
Lentiviral-Induced Spinal Cord Gliomas in Rat Model

 and
and 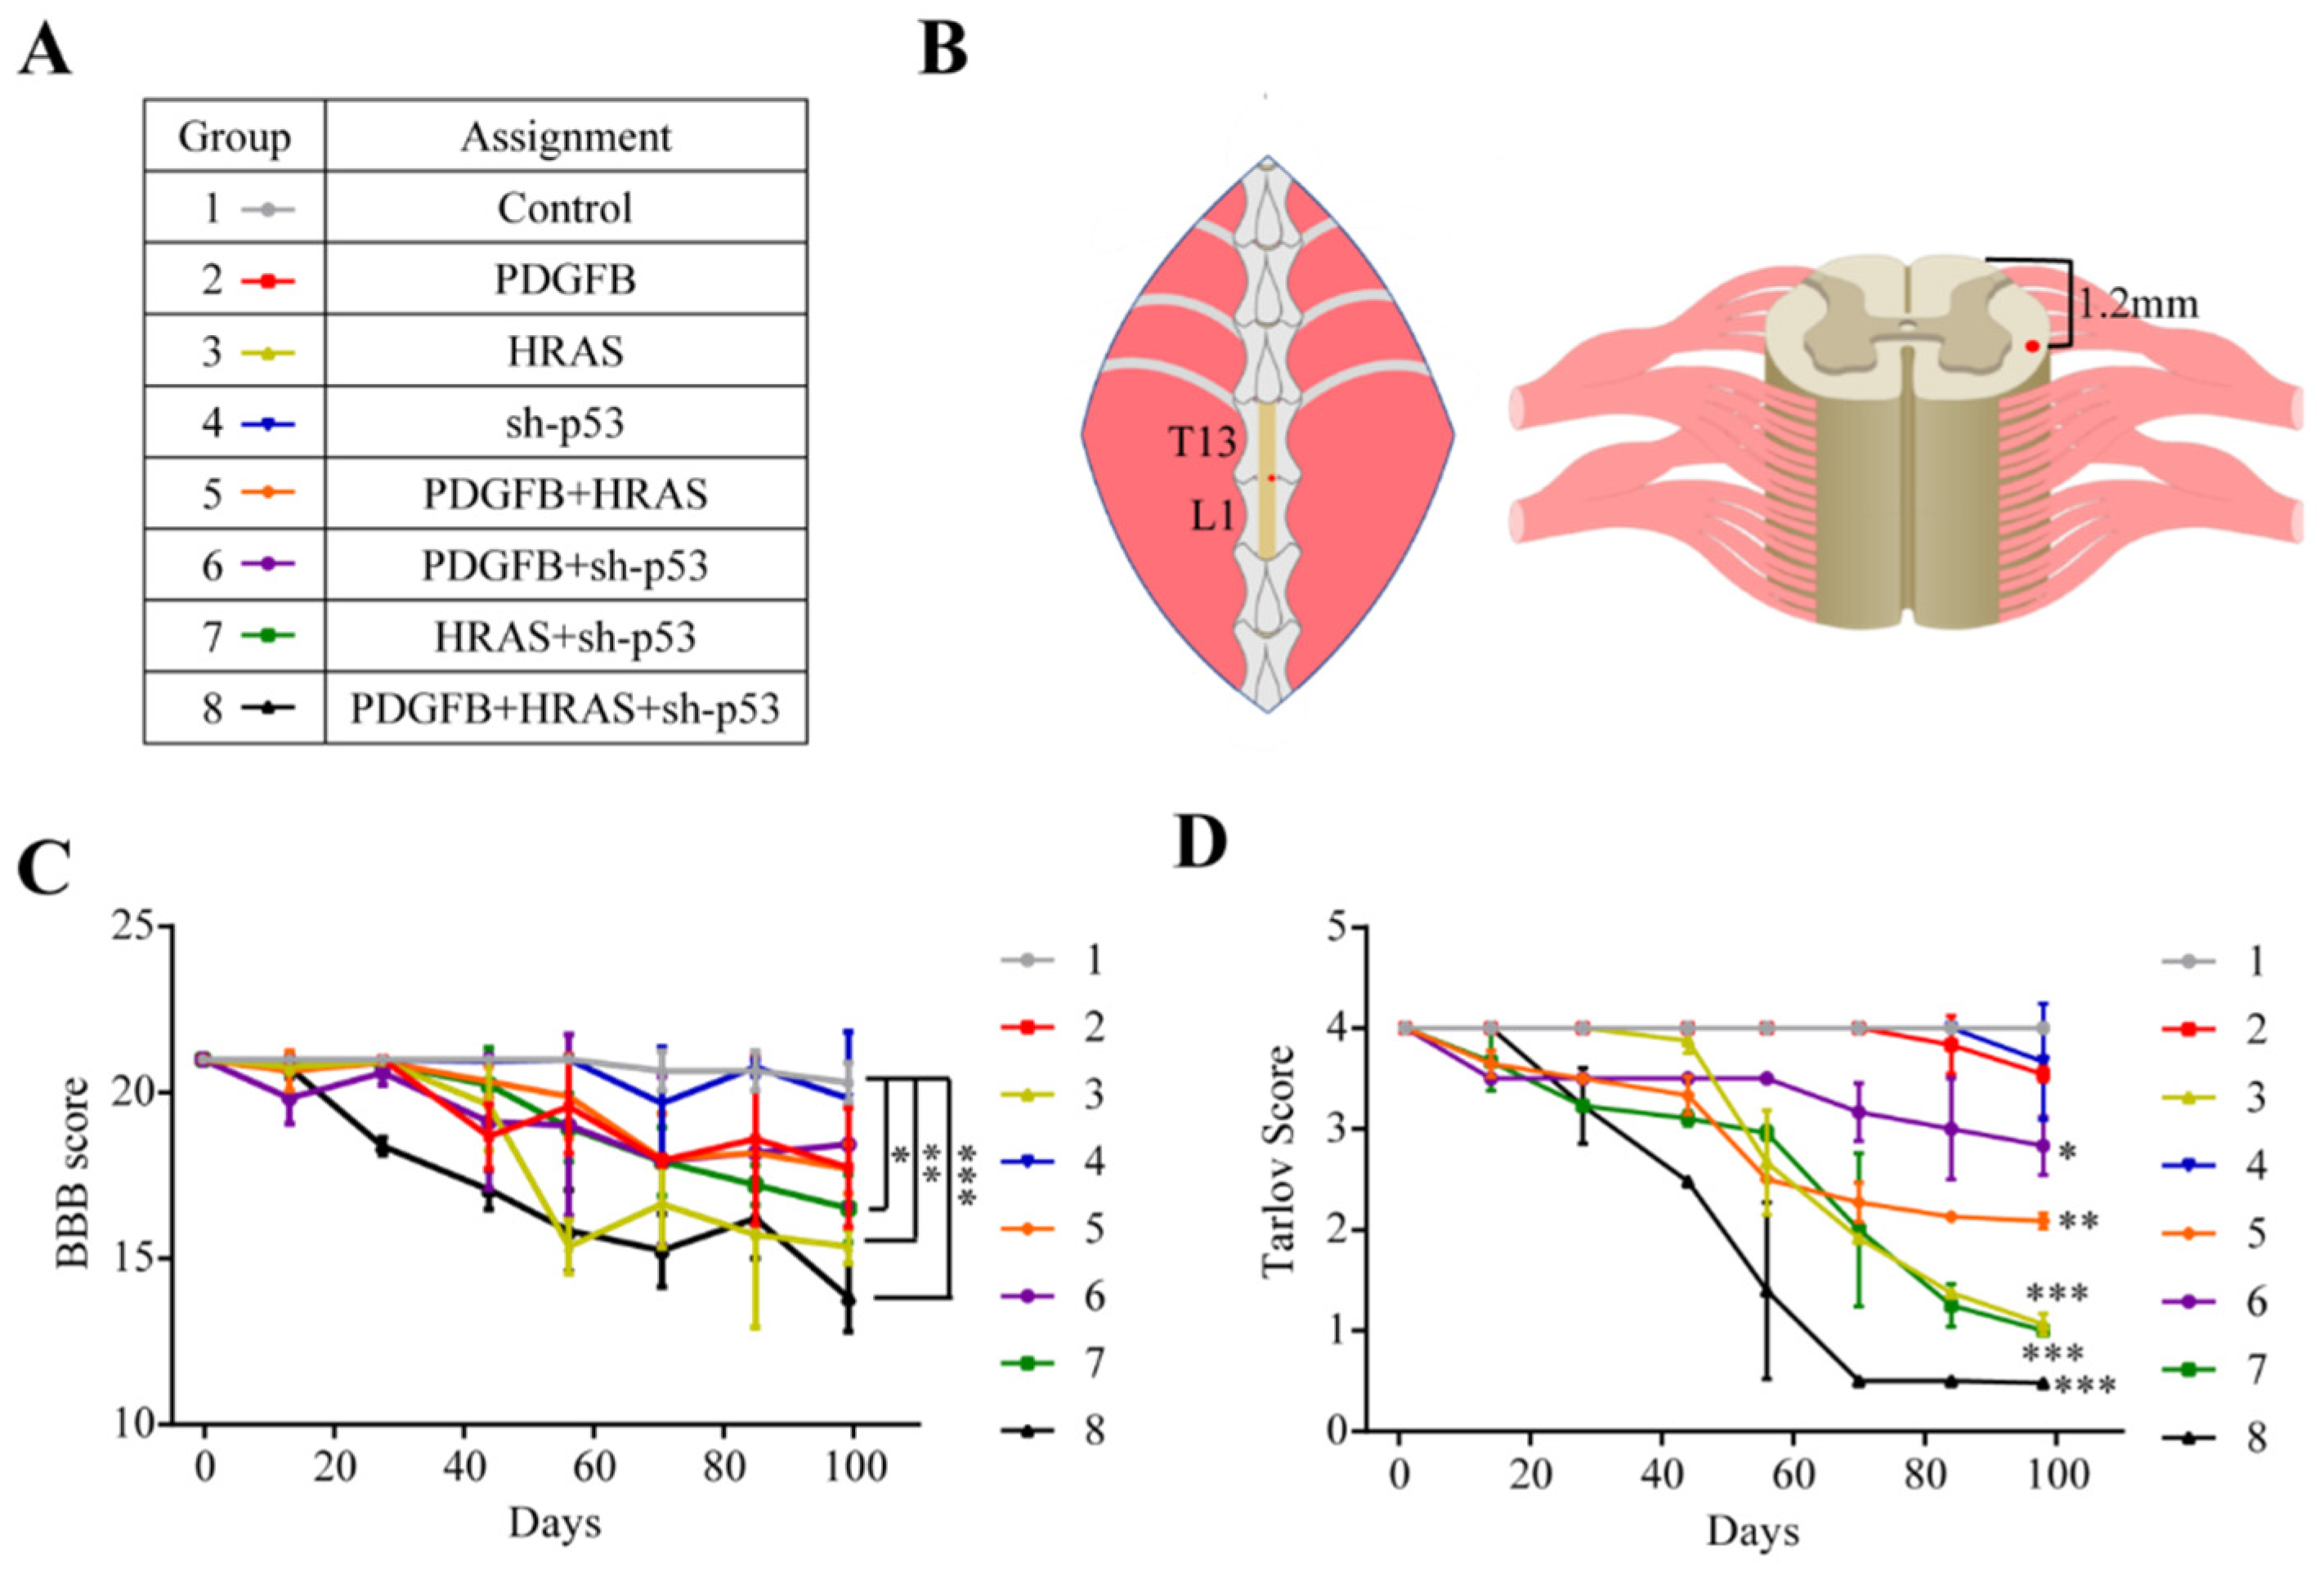
Abstract
:1. Introduction
2. Results
2.1. Animals Injected with HRAS and Triple Cocktail Exhibit Aggressive Motor Deficits
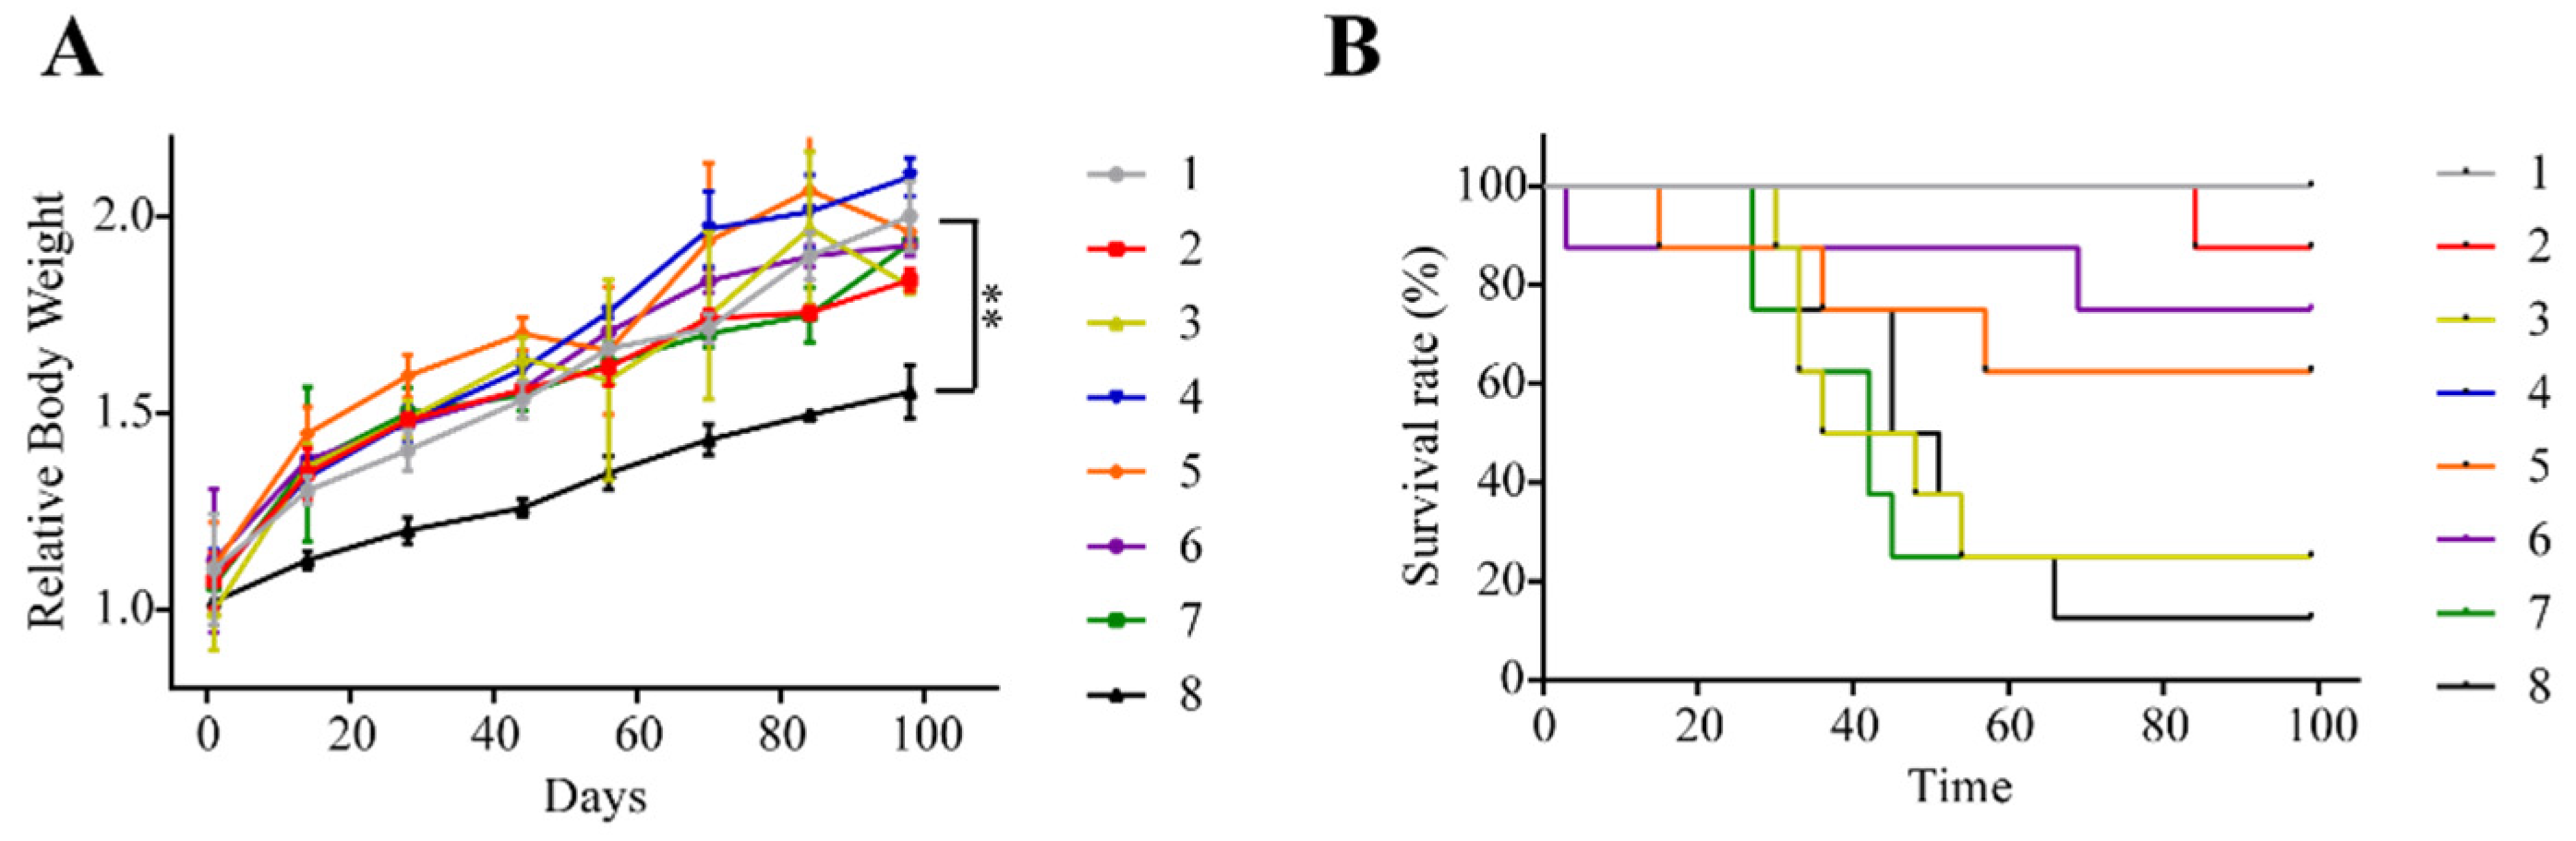
2.2. Animals Injected with Triple Cocktail Show Significant Decline in Weight and Survival Rate
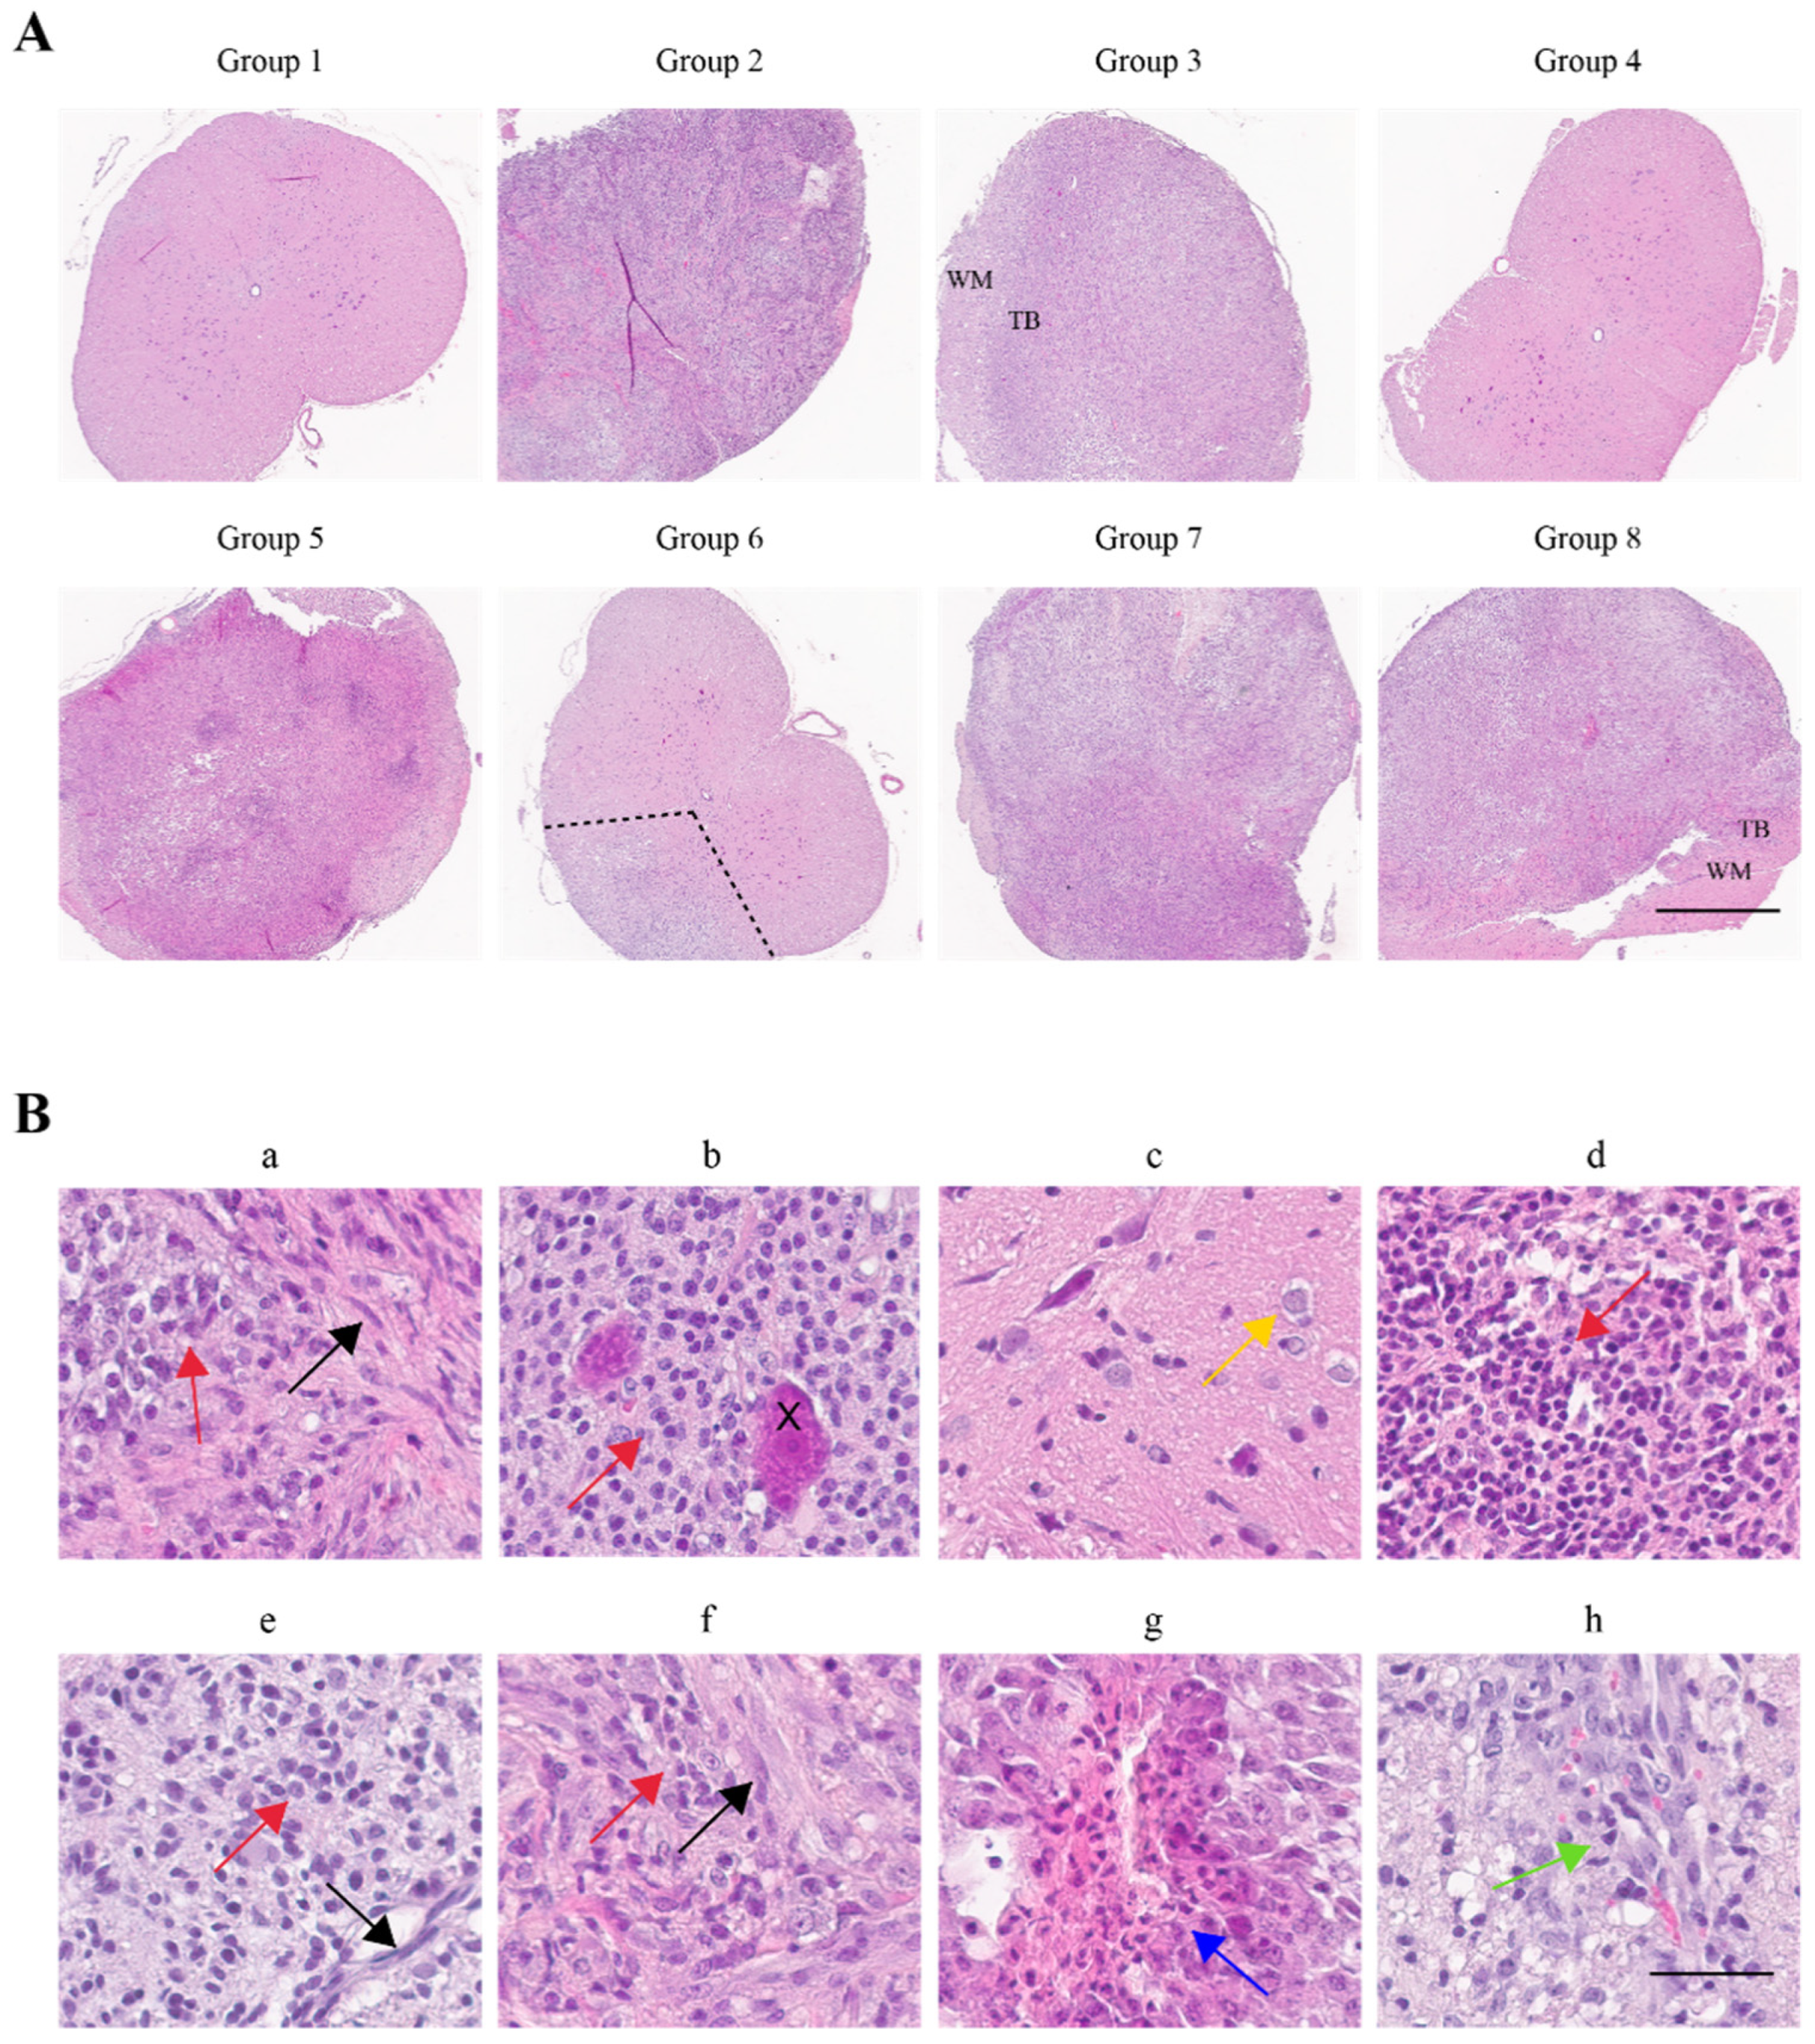
2.3. Histopathological Confirmation of Glioma Characteristic Differences between Groups
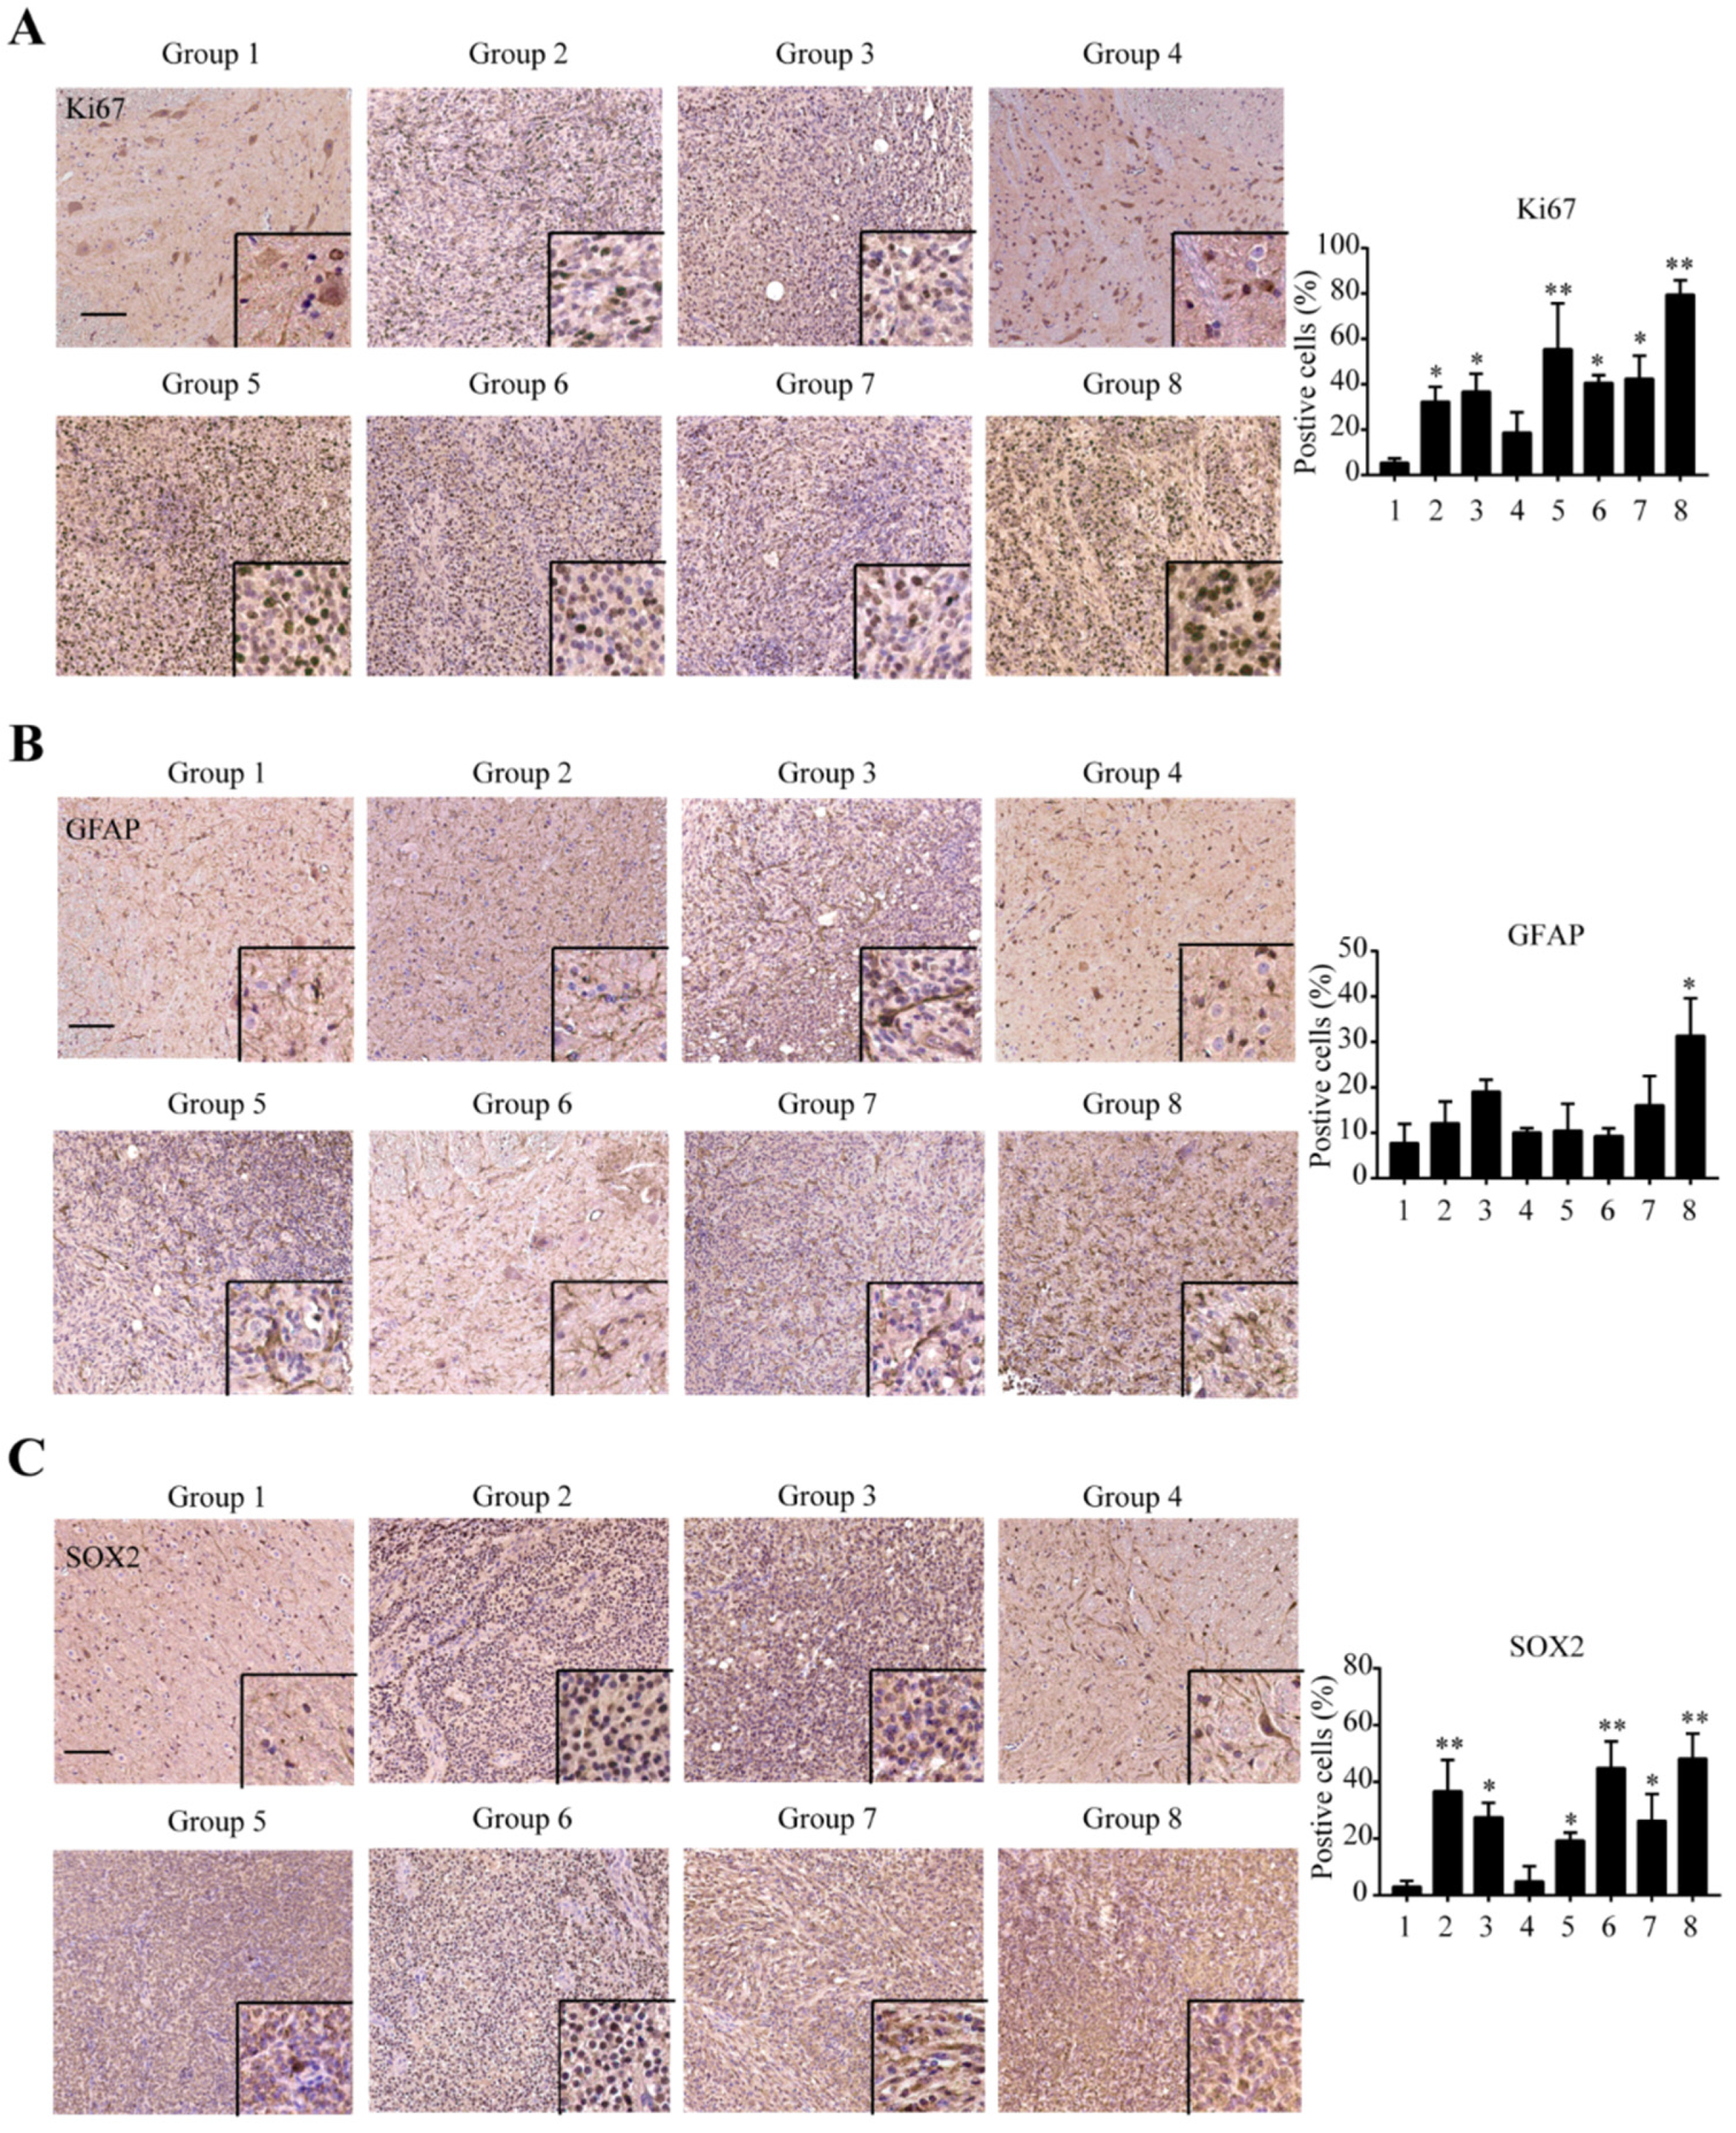
2.4. Immunohistochemical Confirmation of Glioma Marker Differences between Groups
3. Discussion
4. Materials and Methods
4.1. Vector Design
4.2. Animals
4.3. Surgical Approach
4.4. Animals’ Behavior, and Physical Examination
4.5. Tissue Processing
4.6. Hematoxylin & Eosin and Immunohistochemistry
4.7. Data Analysis
5. Conclusions
Supplementary Materials
Author Contributions
Funding
Institutional Review Board Statement
Informed Consent Statement
Data Availability Statement
Conflicts of Interest
References
- Chamberlain, M.C.; Tredway, T.L. Adult Primary Intradural Spinal Cord Tumors: A Review. Curr. Neurol. Neurosci. Rep. 2011, 11, 320–328. [Google Scholar] [CrossRef]
- Schellinger, K.A.; Propp, J.M.; Villano, J.L.; McCarthy, B.J. Descriptive epidemiology of primary spinal cord tumors. J. Neuro-Oncol. 2007, 87, 173–179. [Google Scholar] [CrossRef]
- DeAngelis, L.M.; Gutin, P.H.; Leibel, S.A.; Posner, J.B. Intracranial Tumors: Diagnosis and Treatment; CRC Press: Boca Raton, FL, USA, 2001. [Google Scholar]
- Hitoshi, Y.; Harris, B.T.; Liu, H.; Popko, B.; Israel, M.A. Spinal Glioma: Platelet-Derived Growth Factor B–Mediated Oncogenesis in the Spinal Cord. Cancer Res. 2008, 68, 8507–8515. [Google Scholar] [CrossRef] [PubMed] [Green Version]
- Broggi, G.; Angelico, G.; Filetti, V.; Ledda, C.; Lombardo, C.; Vitale, E.; Rapisarda, V.; Loreto, C.; Caltabiano, R. Immunohistochemical Expression of Serine and Arginine-Rich Splicing Factor 1 (SRSF1) in Fluoro-Edenite-Induced Malignant Mesothelioma: A Preliminary Study. Int. J. Environ. Res. Public Health 2021, 18, 6249. [Google Scholar] [CrossRef] [PubMed]
- Stella, M.; Falzone, L.; Caponnetto, A.; Gattuso, G.; Barbagallo, C.; Battaglia, R.; Mirabella, F.; Broggi, G.; Altieri, R.; Certo, F.; et al. Serum Extracellular Vesicle-Derived circHIPK3 and circSMARCA5 Are Two Novel Diagnostic Biomarkers for Glioblastoma Multiforme. Pharmaceuticals 2021, 14, 618. [Google Scholar] [CrossRef]
- Kaufman, H.L.; Kohlhapp, F.J.; Zloza, A. Oncolytic viruses: A new class of immunotherapy drugs. Nat. Rev. Drug Discov. 2015, 14, 642–662. [Google Scholar] [CrossRef]
- Melo, F.D.S.E.; Vermeulen, L.; Fessler, E.; Medema, J.P. Cancer heterogeneity—A multifaceted view. EMBO Rep. 2013, 14, 686–695. [Google Scholar] [CrossRef] [Green Version]
- Buckner, J.C.; Brown, P.D.; O’Neill, B.P.; Meyer, F.B.; Wetmore, C.J.; Uhm, J.H. Central nervous system tumors. In Mayo Clinic Proceedings; Elsevier: Amsterdam, The Netherlands, 2007; pp. 1271–1286. [Google Scholar]
- Abd-El-Barr, M.M.; Huang, K.; Chi, J.H. Infiltrating spinal cord astrocytomas: Epidemiology, diagnosis, treatments and future directions. J. Clin. Neurosci. 2016, 29, 15–20. [Google Scholar] [CrossRef]
- Lenting, K.; Verhaak, R.; Ter Laan, M.; Wesseling, P.; Leenders, W. Glioma: Experimental models and reality. Acta Neuropathol. 2017, 133, 263–282. [Google Scholar] [CrossRef] [Green Version]
- Ellis, J.A.; Castelli, M.; Bruce, J.N.; Canoll, P.; Ogden, A.T. Retroviral delivery of platelet-derived growth factor to spinal cord pro-genitor cells drives the formation of intramedullary gliomas. Neurosurgery 2012, 70, 198–204. [Google Scholar] [CrossRef] [PubMed] [Green Version]
- Assanah, M.; Lochhead, R.; Ogden, A.; Bruce, J.; Goldman, J.; Canoll, P. Glial Progenitors in Adult White Matter Are Driven to Form Malignant Gliomas by Platelet-Derived Growth Factor-Expressing Retroviruses. J. Neurosci. 2006, 26, 6781–6790. [Google Scholar] [CrossRef] [Green Version]
- Uhrbom, L.; Hesselager, G.; Nistér, M.; Westermark, B. Induction of brain tumors in mice using a recombinant platelet-derived growth factor B-chain retrovirus. Cancer Res. 1998, 58, 5275–5279. [Google Scholar] [PubMed]
- Escors, D.; Breckpot, K. Lentiviral Vectors in Gene Therapy: Their Current Status and Future Potential. Arch. Immunol. Ther. Exp. 2010, 58, 107–119. [Google Scholar] [CrossRef] [Green Version]
- Charest, A.; Wilker, E.W.; McLaughlin, M.E.; Lane, K.; Gowda, R.; Coven, S.; McMahon, K.; Kovach, S.; Feng, Y.; Yaffe, M.B. ROS fusion tyrosine kinase activates a SH2 domain–containing phosphatase-2/phosphatidylinositol 3-Kinase/mammalian target of rapamycin signaling axis to form glioblastoma in mice. Cancer Res. 2006, 66, 7473–7481. [Google Scholar] [CrossRef] [PubMed] [Green Version]
- Venkatesan, S.; Lamfers, M.L.; Dirven, C.M.; Leenstra, S. Genetic biomarkers of drug response for small-molecule therapeutics targeting the RTK/Ras/PI3K, p53 or Rb pathway in glioblastoma. CNS Oncol. 2016, 5, 77–90. [Google Scholar] [CrossRef]
- Stegh, A.H.; DePinho, R.A. Beyond effector caspase inhibition: Bcl2L12 neutralizes p53 signaling in glioblastoma. Cell Cycle 2011, 10, 33–38. [Google Scholar] [CrossRef] [PubMed] [Green Version]
- Chow, L.M.; Baker, S.J. Capturing the Molecular and Biological Diversity of High-Grade Astrocytoma in Genetically Engineered Mouse Models. Oncotarget 2012, 3, 67–77. [Google Scholar] [CrossRef] [Green Version]
- Lynes, J.; Wibowo, M.; Koschmann, C.; Baker, G.J.; Saxena, V.; Muhammad, A.; Bondale, N.; Klein, J.; Assi, H.; Lieberman, A.P. Lenti-viral-induced high-grade gliomas in rats: The effects of PDGFB, HRAS-G12V, AKT, and IDH1-R132H. Neurotherapeutics 2014, 11, 623–635. [Google Scholar] [CrossRef] [Green Version]
- Tora, M.S.; Texakalidis, P.; Neill, S.; Wetzel, J.; Rindler, R.S.; Hardcastle, N.; Nagarajan, P.P.; Krasnopeyev, A.; Roach, C.; James, R. Len-tiviral Vector Induced Modeling of High-Grade Spinal Cord Glioma in Minipigs. Sci. Rep. 2020, 10, 5291. [Google Scholar] [CrossRef]
- Basso, D.M.; Beattie, M.S.; Bresnahan, J.C. A Sensitive and Reliable Locomotor Rating Scale for Open Field Testing in Rats. J. Neurotrauma 1995, 12, 1–21. [Google Scholar] [CrossRef]
- Ling, C.; Pouget, C.; Rech, F.; Pflaum, R.; Treffel, M.; Bielle, F.; Mokhtari, K.; Casse, J.-M.; Vignaud, J.-M.; Kalamarides, M. Endothelial cell hypertrophy and microvascular proliferation in meningiomas are correlated with higher histological grade and shorter progression-free survival. J. Neuropathol. Exp. Neurol. 2016, 75, 1160–1170. [Google Scholar] [CrossRef] [Green Version]
- Yuan, J.; Levitin, H.M.; Frattini, V.; Bush, E.C.; Boyett, D.M.; Samanamud, J.; Ceccarelli, M.; Dovas, A.; Zanazzi, G.; Canoll, P.; et al. Single-cell transcriptome analysis of lineage diversity in high-grade glioma. Genome Med. 2018, 10, 57. [Google Scholar] [CrossRef] [Green Version]
- Ligon, K.L.; Alberta, J.A.; Kho, A.T.; Weiss, J.; Kwaan, M.R.; Nutt, C.L.; Louis, D.N.; Stiles, C.D.; Rowitch, D.H. The oligodendroglial line-age marker OLIG2 is universally expressed in diffuse gliomas. J. Neuropathol. Exp. Neurol. 2004, 63, 499–509. [Google Scholar] [CrossRef] [Green Version]
- Rodrigues, G.B.; Waldron, J.N. Wong CS, Laperriere NJ: A retrospective analysis of 52 cases of spinal cord glioma managed with radiation therapy. Int. J. Radiat. Oncol. Biol. Phys. 2000, 48, 837–842. [Google Scholar] [CrossRef]
- Salcman, M.; Botero, E.; Rao, K.C.V.; Broadwell, R.D.; Scott, E. Intramedullary canine spinal cord tumor model. J. Neurosurg. 1984, 61, 761–766. [Google Scholar] [CrossRef]
- Mavinkurve, G.; Pradilla, G.; Legnani, F.G.; Tyler, B.M.; Bagley, C.A.; Brem, H.; Jallo, G. A novel intramedullary spinal cord tumor model: Functional, radiological, and histopathological characterization. J. Neurosurg. Spine 2005, 3, 142–148. [Google Scholar] [CrossRef]
- Del Vecchio, C.; Calistri, A.; Parolin, C.; Mucignat-Caretta, C. Lentiviral vectors as tools for the study and treatment of glioblas-toma. Cancers 2019, 11, 417. [Google Scholar] [CrossRef] [PubMed] [Green Version]
- Carter, M.; Shieh, J.C. Guide to Research Techniques in Neuroscience; Academic Press: Cambridge, MA, USA, 2015. [Google Scholar]
- Miletic, H.; Fischer, Y.H.; Neumann, H.; Hans, V.; Stenzel, W.; Giroglou, T.; Hermann, M.; Deckert, M.; Von Laer, D. Selective trans-duction of malignant glioma by lentiviral vectors pseudotyped with lymphocytic choriomeningitis virus glycoproteins. Hum. Gene Ther. 2004, 15, 1091–1100. [Google Scholar] [CrossRef]
- Tong, Y.; Hao, J.; Tu, Q.; Yu, H.; Yan, L.; Li, Y.; Lv, L.; Wang, F.; Iavarone, A.; Zhao, X. A tree shrew glioblastoma model recapitulates features of human glioblastoma. Oncotarget 2017, 8, 17897–17907. [Google Scholar] [CrossRef] [PubMed] [Green Version]
- Geng, X.; Doitsh, G.; Yang, Z.; Galloway, N.L.; Greene, W.C. Efficient delivery of lentiviral vectors into resting human CD4 T cells. Gene Ther. 2014, 21, 444–449. [Google Scholar] [CrossRef] [PubMed] [Green Version]
- Zhou, Q.; Buchholz, C.J. Cell type specific gene delivery by lentiviral vectors: New options in immunotherapy. Oncoimmunology 2013, 2, e22566. [Google Scholar] [CrossRef] [Green Version]
- Yang, L.; Bailey, L.; Baltimore, D.; Wang, P. Targeting lentiviral vectors to specific cell types in vivo. Proc. Natl. Acad. Sci. USA 2006, 103, 11479–11484. [Google Scholar] [CrossRef] [PubMed] [Green Version]
- Lee, C.-H.; Chung, C.K.; Kim, C.H. Genetic differences on intracranial versus spinal cord ependymal tumors: A meta-analysis of genetic researches. Eur. Spine J. 2016, 25, 3942–3951. [Google Scholar] [CrossRef]
- Nazarenko, I.; Hede, S.-M.; He, X.; Hedrén, A.; Thompson, J.; Lindström, M.S.; Nistér, M. PDGF and PDGF receptors in glioma. Upsala J. Med. Sci. 2012, 117, 99–112. [Google Scholar] [CrossRef] [Green Version]
- Lindberg, N.; Holland, E.C. PDGF in gliomas: More than just a growth factor? Upsala J. Med Sci. 2012, 117, 92–98. [Google Scholar] [CrossRef] [PubMed] [Green Version]
- Cantanhede, I.G.; de Oliveira, J.R.M. PDGF family expression in glioblastoma multiforme: Data compilation from ivy glioblastoma atlas project database. Sci. Rep. 2017, 7, 15271. [Google Scholar] [CrossRef] [Green Version]
- Heldin, C.H.; Lennartsson, J.; Westermark, B. Involvement of platelet-derived growth factor ligands and receptors in tumor-igenesis. J. Int. Med. 2018, 283, 16–44. [Google Scholar] [CrossRef] [PubMed] [Green Version]
- Terrile, M.; Appolloni, I.; Calzolari, F.; Perris, R.; Tutucci, E.; Malatesta, P. PDGF-B-driven gliomagenesis can occur in the absence of the proteoglycan NG2. BMC Cancer 2010, 10, 550. [Google Scholar] [CrossRef] [PubMed] [Green Version]
- Lymbouridou, R.; Soufla, G.; Chatzinikola, A.M.; Vakis, A.; Spandidos, D.A. Down-regulation of K-ras and H-ras in human brain gliomas. Eur. J. Cancer 2009, 45, 1294–1303. [Google Scholar] [CrossRef]
- Consortium, A.P.G. AACR Project GENIE: Powering precision medicine through an international consortium. Cancer Discov. 2017, 7, 818–831. [Google Scholar] [CrossRef] [Green Version]
- Shchors, K.; Persson, A.; Rostker, F.; Tihan, T.; Lyubynska, N.; Li, N.; Swigart, L.B.; Berger, M.S.; Hanahan, D.; Weiss, W.; et al. Using a preclinical mouse model of high-grade astrocytoma to optimize p53 restoration therapy. Proc. Natl. Acad. Sci. USA 2013, 110, E1480–E1489. [Google Scholar] [CrossRef] [Green Version]
- Sugita, S.; Enokida, H.; Yoshino, H.; Miyamoto, K.; Yonemori, M.; Sakaguchi, T.; Osako, Y.; Nakagawa, M. HRAS as a potential therapeutic target of salirasib RAS inhibitor in bladder cancer. Int. J. Oncol. 2018, 53, 725–736. [Google Scholar] [CrossRef]
- Overmeyer, J.H.; Kaul, A.; Johnson, E.E.; Maltese, W.A. Active Ras Triggers Death in Glioblastoma Cells through Hyperstimulation of Macropinocytosis. Mol. Cancer Res. 2008, 6, 965–977. [Google Scholar] [CrossRef] [PubMed] [Green Version]
- Harris, S.L.; Levine, A.J. The p53 pathway: Positive and negative feedback loops. Oncogene 2005, 24, 2899–2908. [Google Scholar] [CrossRef] [Green Version]
- Purkait, S.; Jha, P.; Sharma, M.C.; Suri, V.; Sharma, M.; Kale, S.S.; Sarkar, C. CDKN2A deletion in pediatric versus adult glioblastomas and predictive value of p16 immunohistochemistry. Neuropathology 2013, 33, 405–412. [Google Scholar] [CrossRef]
- Liffers, K.; Lamszus, K.; Schulte, A. EGFR amplification and glioblastoma stem-like cells. Stem Cells Int. 2015, 2015, 915. [Google Scholar] [CrossRef] [PubMed] [Green Version]
- Yan, H.; Parsons, D.W.; Jin, G.; McLendon, R.; Rasheed, B.A.; Yuan, W.; Kos, I.; Batinic-Haberle, I.; Jones, S.; Riggins, G.J.; et al. IDH1andIDH2Mutations in Gliomas. N. Engl. J. Med. 2009, 360, 765–773. [Google Scholar] [CrossRef]
- Di Stefano, A.L.; Fucci, A.; Frattini, V.; Labussiere, M.; Mokhtari, K.; Zoppoli, P.; Marie, Y.; Bruno, A.; Boisselier, B.; Giry, M. Detection, characterization, and inhibition of FGFR–TACC fusions in IDH wild-type glioma. Clin. Cancer Res. 2015, 21, 3307–3317. [Google Scholar] [CrossRef] [PubMed] [Green Version]
- Wierzbicki, K.; Ravi, K.; Franson, A.; Bruzek, A.; Cantor, E.; Harris, M.; Homan, M.J.; Marini, B.L.; Kawakibi, A.R.; Ravindran, R. Targeting and therapeutic monitoring of H3K27M-mutant glioma. Curr. Oncol. Rep. 2020, 22, 19. [Google Scholar] [CrossRef]
- Bhatti, F.I.; Mowforth, O.D.; Butler, M.B.; Bhatti, A.I.; Adeeko, S.; Akhbari, M.; Dilworth, R.; Grodzinski, B.; Osunronbi, T.; Ottewell, L. Systematic review of the impact of cannabinoids on neurobehavioral outcomes in preclinical models of traumatic and nontraumatic spinal cord injury. Spinal Cord 2021, 15, 1221–1239. [Google Scholar] [CrossRef]
- Tarlov, I.M.; Klinger, H. Spinal cord compression studies. II. Time limits for recovery after acute compression in dogs. AMA Arch. Neurol. Psychiatry 1954, 71, 271–290. [Google Scholar] [CrossRef] [PubMed]
- Helgers, S.O.; Talbot, S.R.; Riedesel, A.-K.; Wassermann, L.; Wu, Z.; Krauss, J.K.; Häger, C.; Bleich, A.; Schwabe, K. Body weight algorithm predicts humane endpoint in an intracranial rat glioma model. Sci. Rep. 2020, 10, 9020. [Google Scholar] [CrossRef]
- Lei, K.; Gu, X.; Alvarado, A.G.; Du, Y.; Luo, S.; Ahn, E.H.; Kang, S.S.; Ji, B.; Liu, X.; Mao, H.; et al. Discovery of a dual inhibitor of NQO1 and GSTP1 for treating glioblastoma. J. Hematol. Oncol. 2020, 13, 141. [Google Scholar] [CrossRef] [PubMed]
- Lei, K.; Xia, Y.; Wang, X.-C.; Ahn, E.H.; Jin, L.; Ye, K. C/EBPβ mediates NQO1 and GSTP1 anti-oxidative reductases expression in glioblastoma, promoting brain tumor proliferation. Redox Biol. 2020, 34, 101578. [Google Scholar] [CrossRef] [PubMed]


Publisher’s Note: MDPI stays neutral with regard to jurisdictional claims in published maps and institutional affiliations. |
© 2021 by the authors. Licensee MDPI, Basel, Switzerland. This article is an open access article distributed under the terms and conditions of the Creative Commons Attribution (CC BY) license (https://creativecommons.org/licenses/by/4.0/).
Share and Cite
Nagarajan, P.P.; Tora, M.S.; Neill, S.G.; Federici, T.; Texakalidis, P.; Donsante, A.; Canoll, P.; Lei, K.; Boulis, N.M. Lentiviral-Induced Spinal Cord Gliomas in Rat Model. Int. J. Mol. Sci. 2021, 22, 12943. https://doi.org/10.3390/ijms222312943
Nagarajan PP, Tora MS, Neill SG, Federici T, Texakalidis P, Donsante A, Canoll P, Lei K, Boulis NM. Lentiviral-Induced Spinal Cord Gliomas in Rat Model. International Journal of Molecular Sciences. 2021; 22(23):12943. https://doi.org/10.3390/ijms222312943
Chicago/Turabian StyleNagarajan, Purva P., Muhibullah S. Tora, Stewart G. Neill, Thais Federici, Pavlos Texakalidis, Anthony Donsante, Peter Canoll, Kecheng Lei, and Nicholas M. Boulis. 2021. "Lentiviral-Induced Spinal Cord Gliomas in Rat Model" International Journal of Molecular Sciences 22, no. 23: 12943. https://doi.org/10.3390/ijms222312943