
Identification and Validation of Esophageal Squamous Cell Carcinoma Targets for Fluorescence Molecular Endoscopy

 , , , and
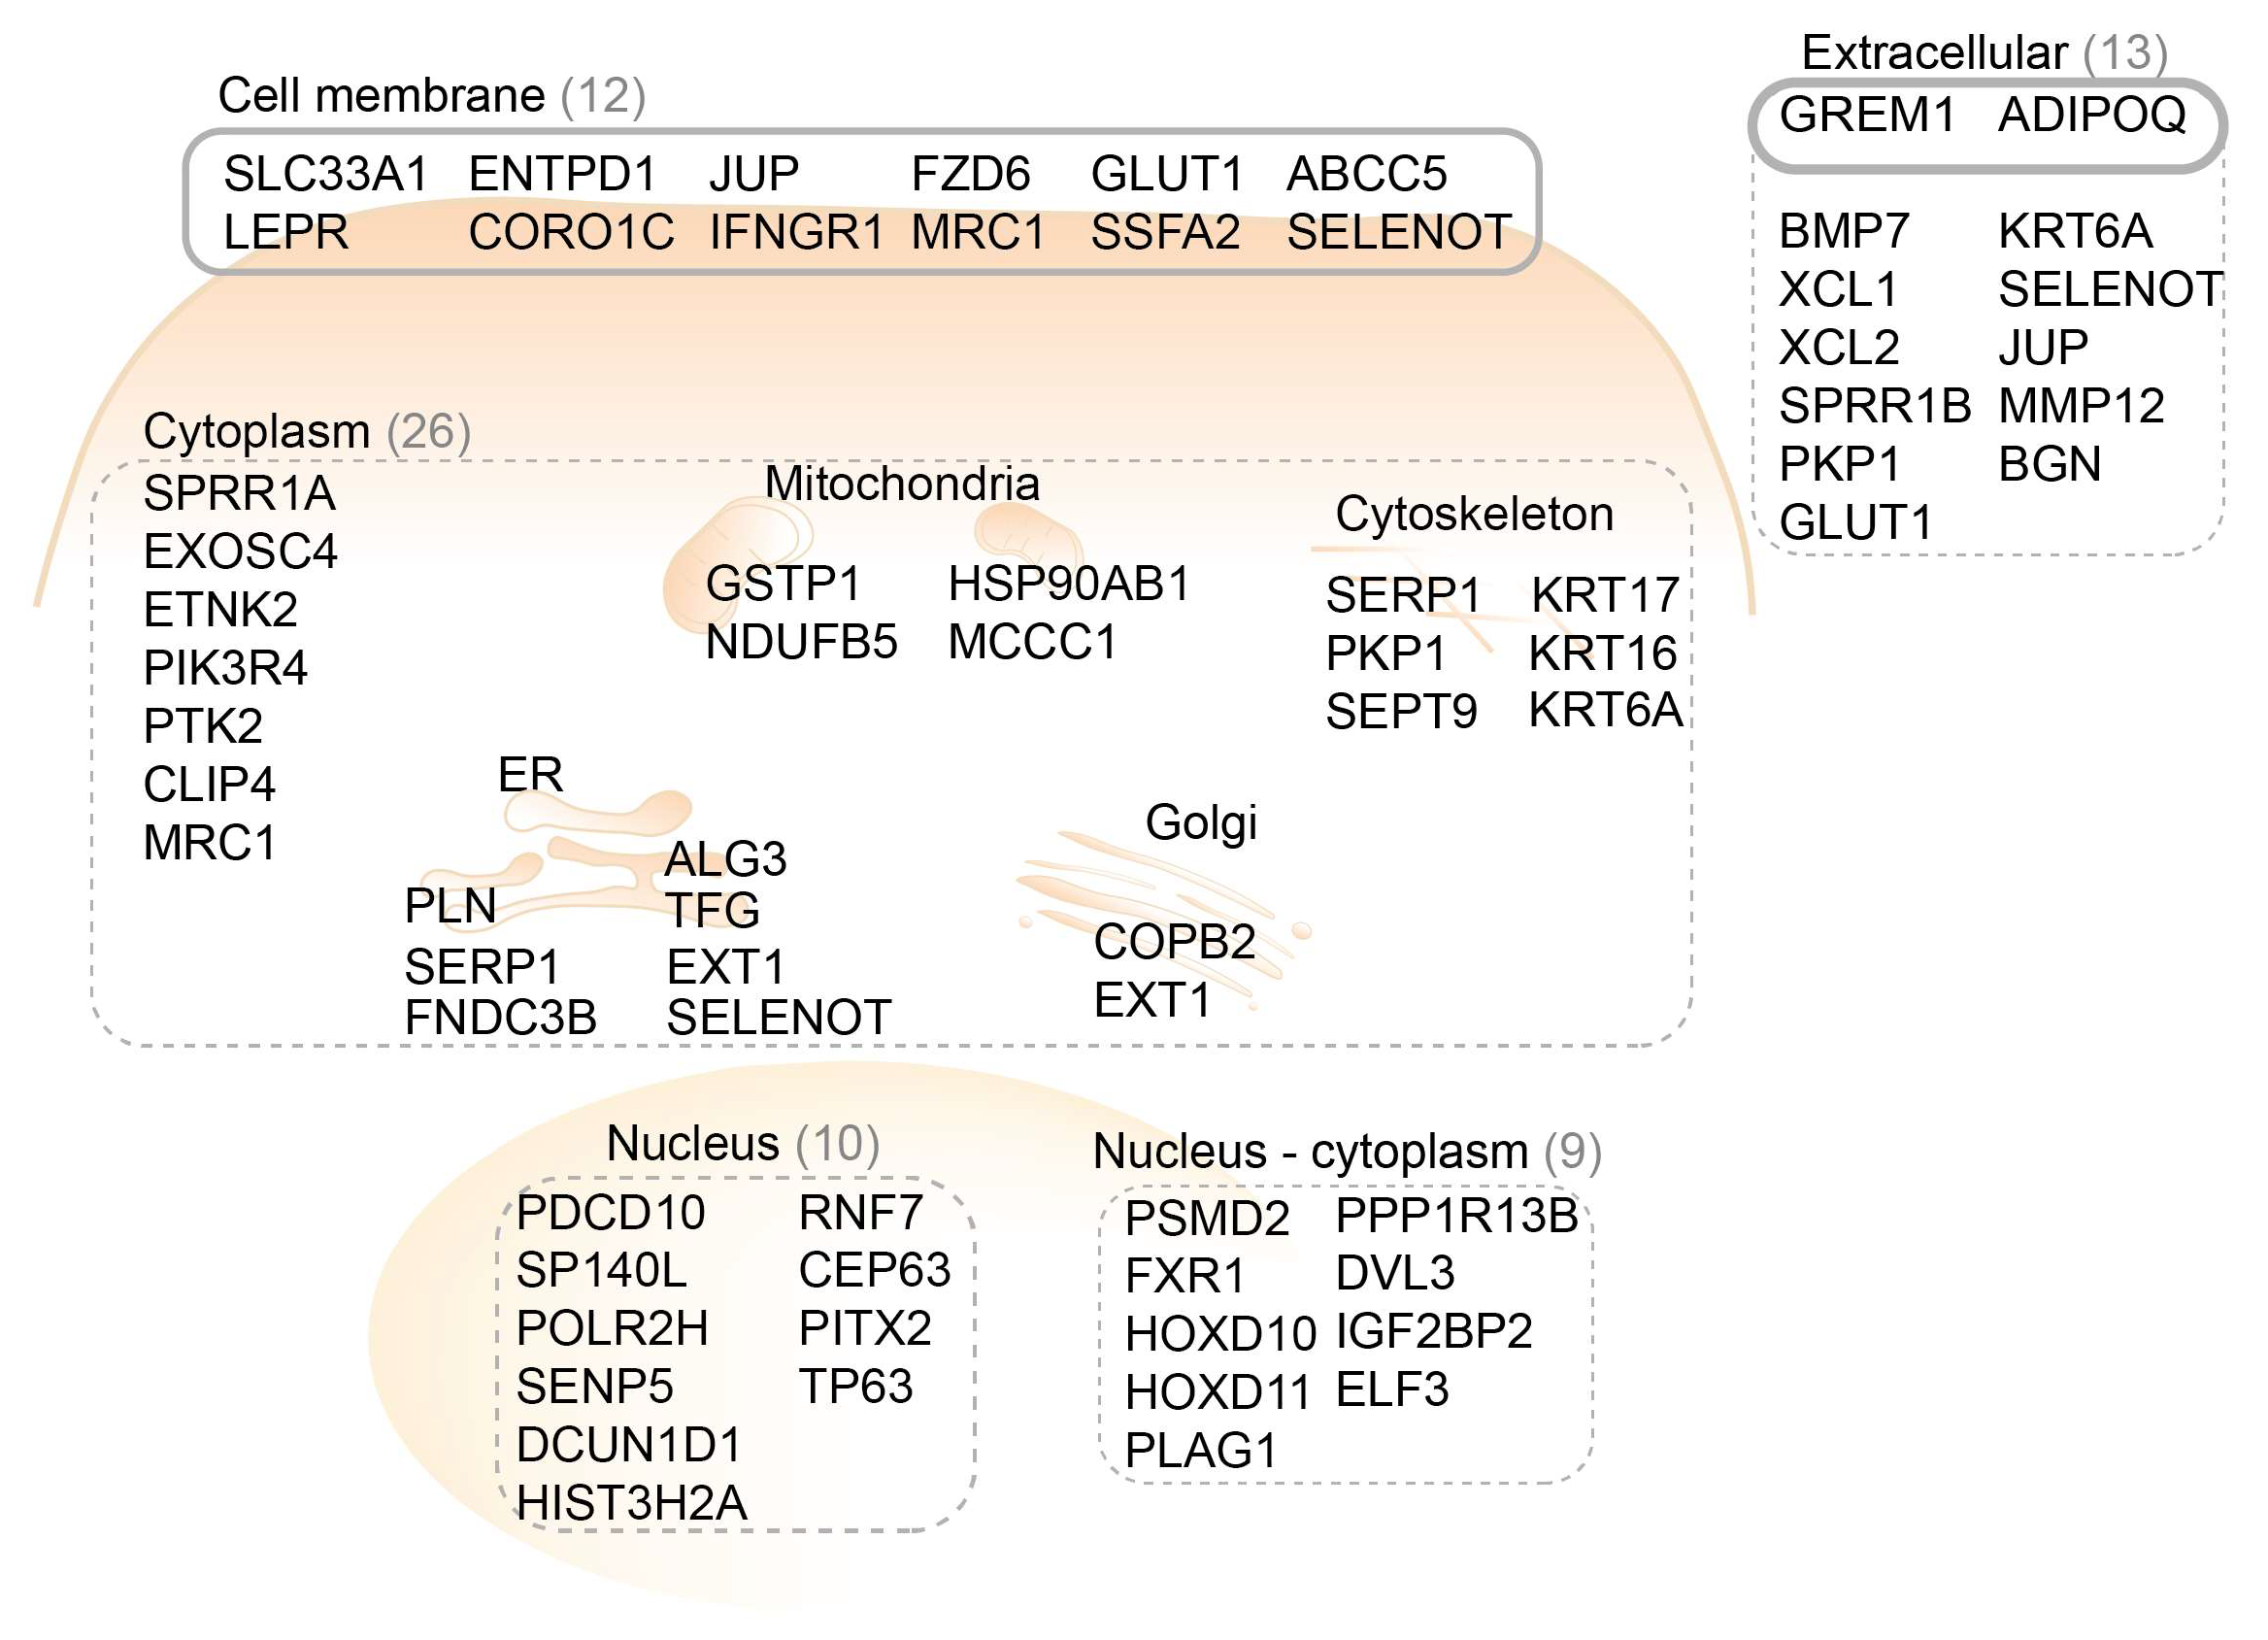
Abstract
:1. Introduction
2. Results
2.1. Functional Genomic mRNA Profiling Identifies Upregulated Genes in Esophageal Squamous Cell Carcinoma
2.2. Target Prioritization by Literature Search
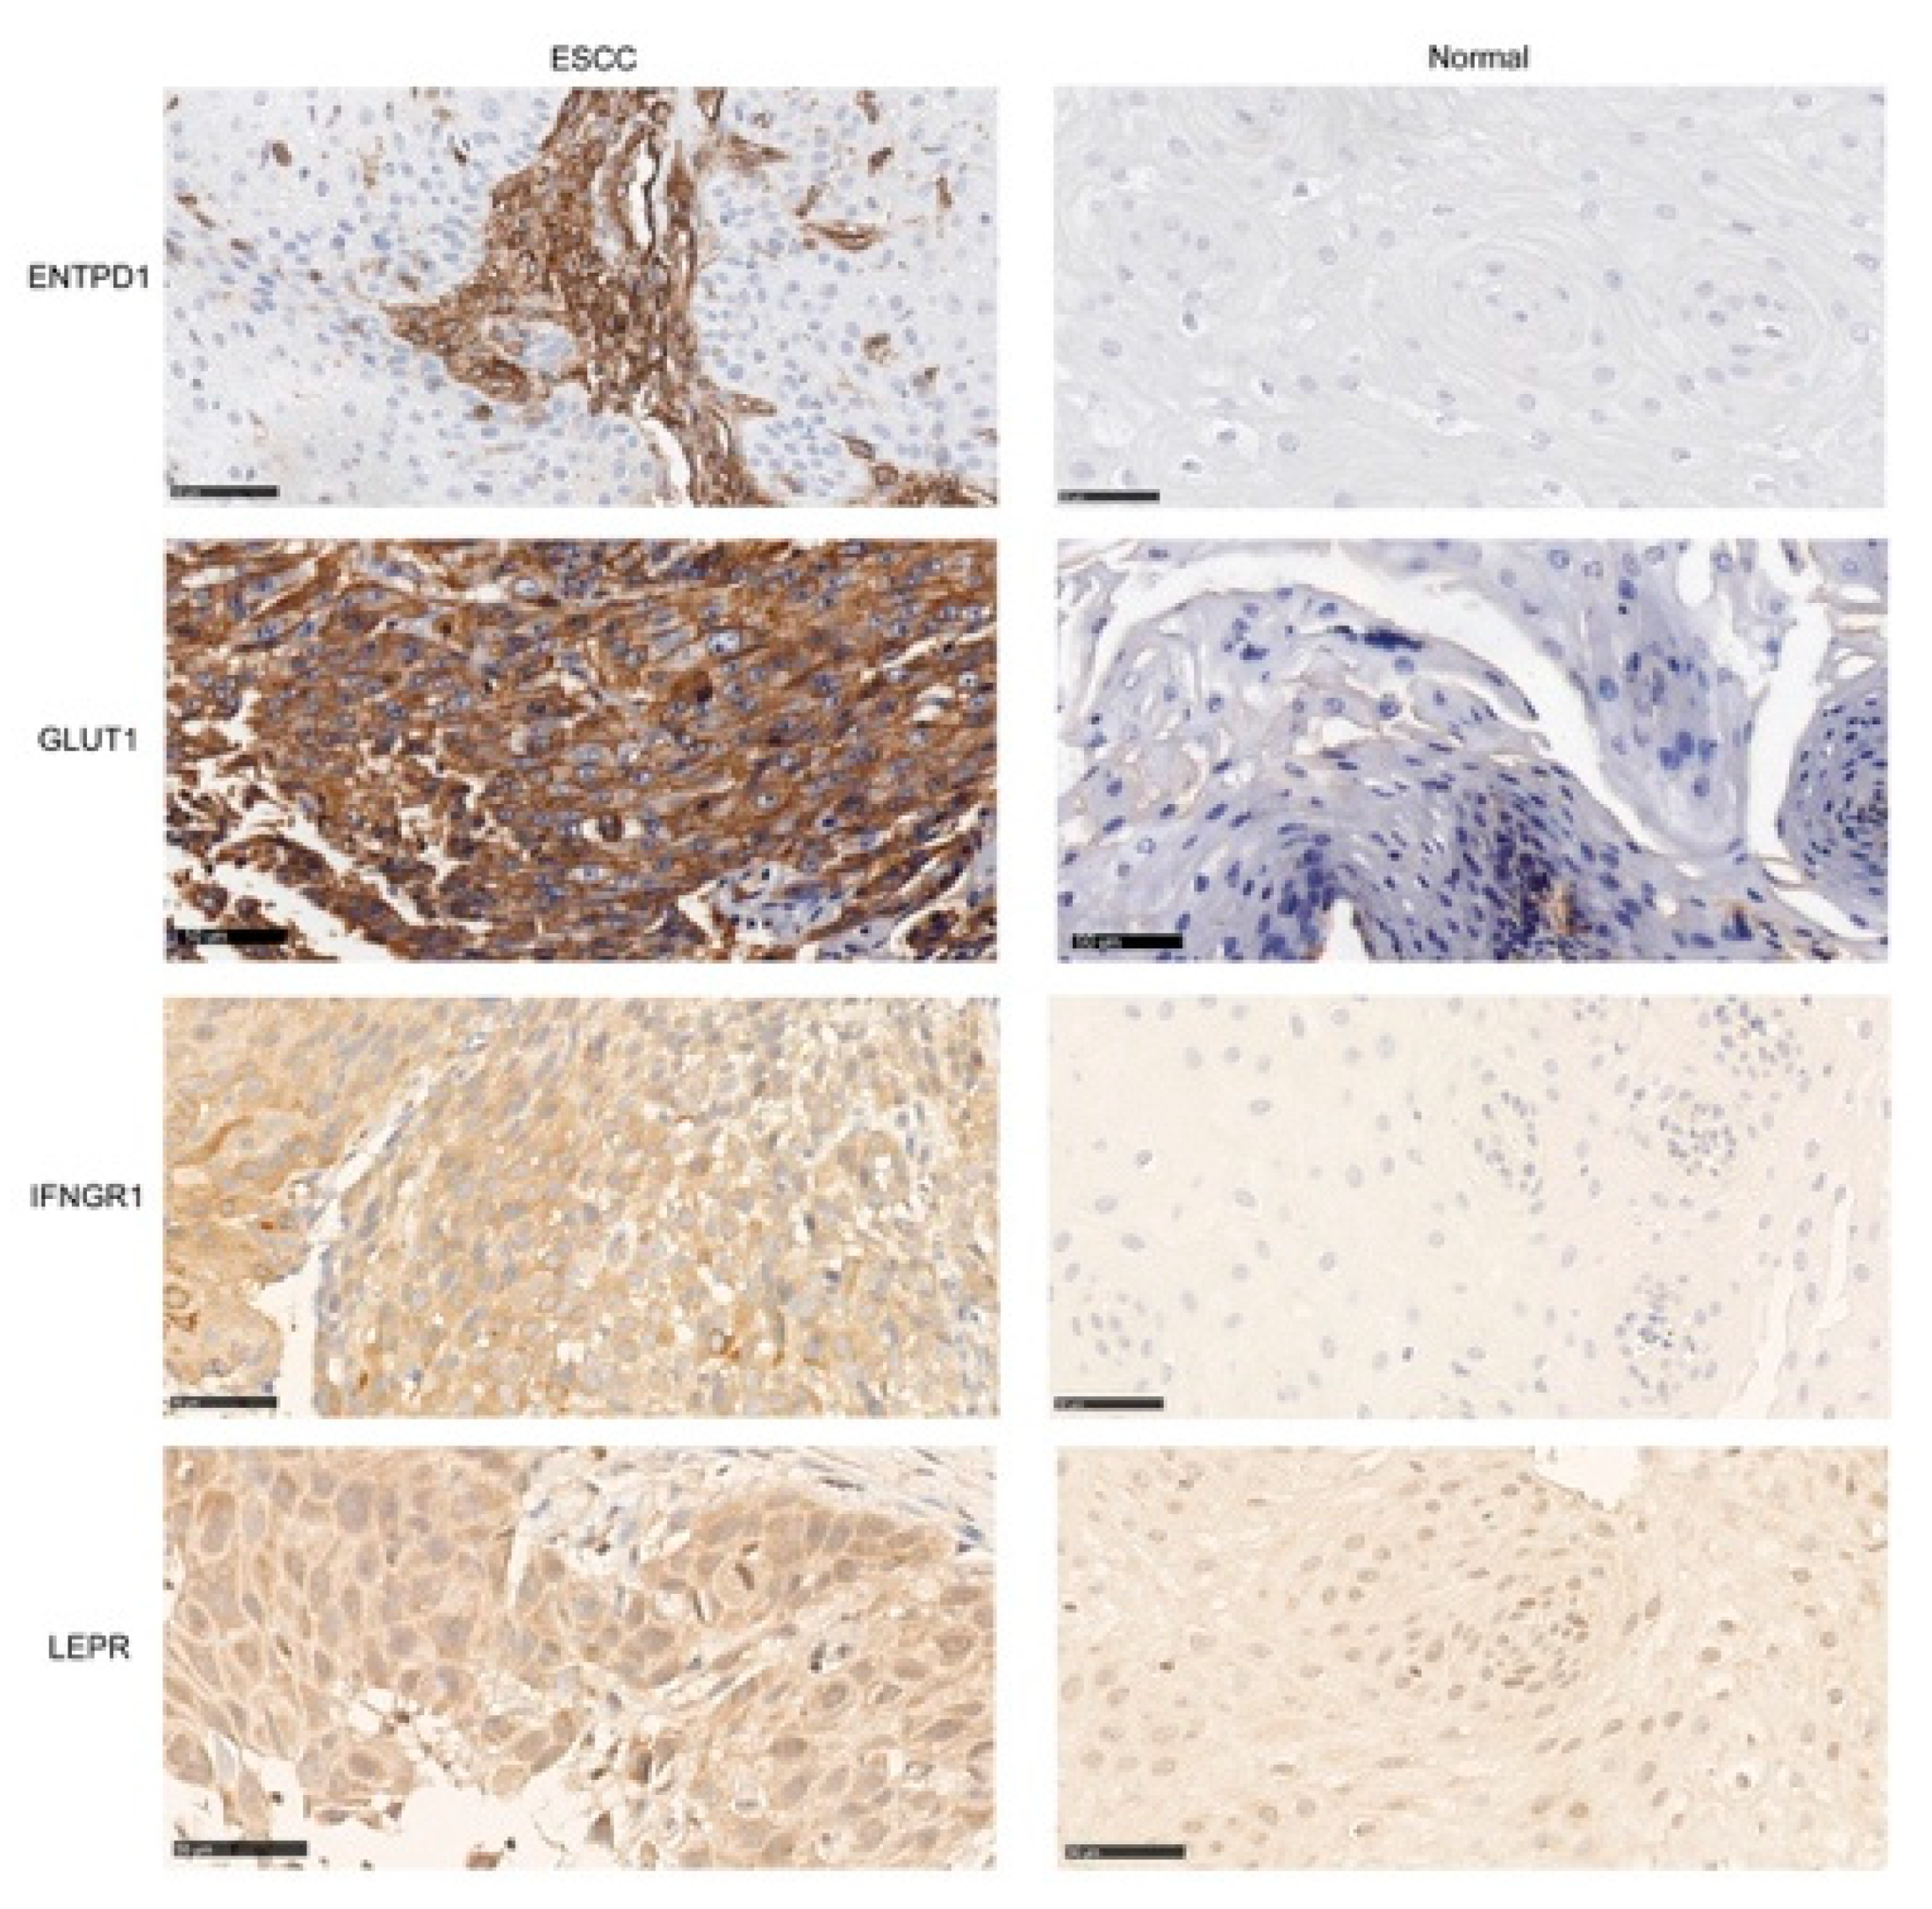
2.3. Evaluation of Five Possible Targets by IHC
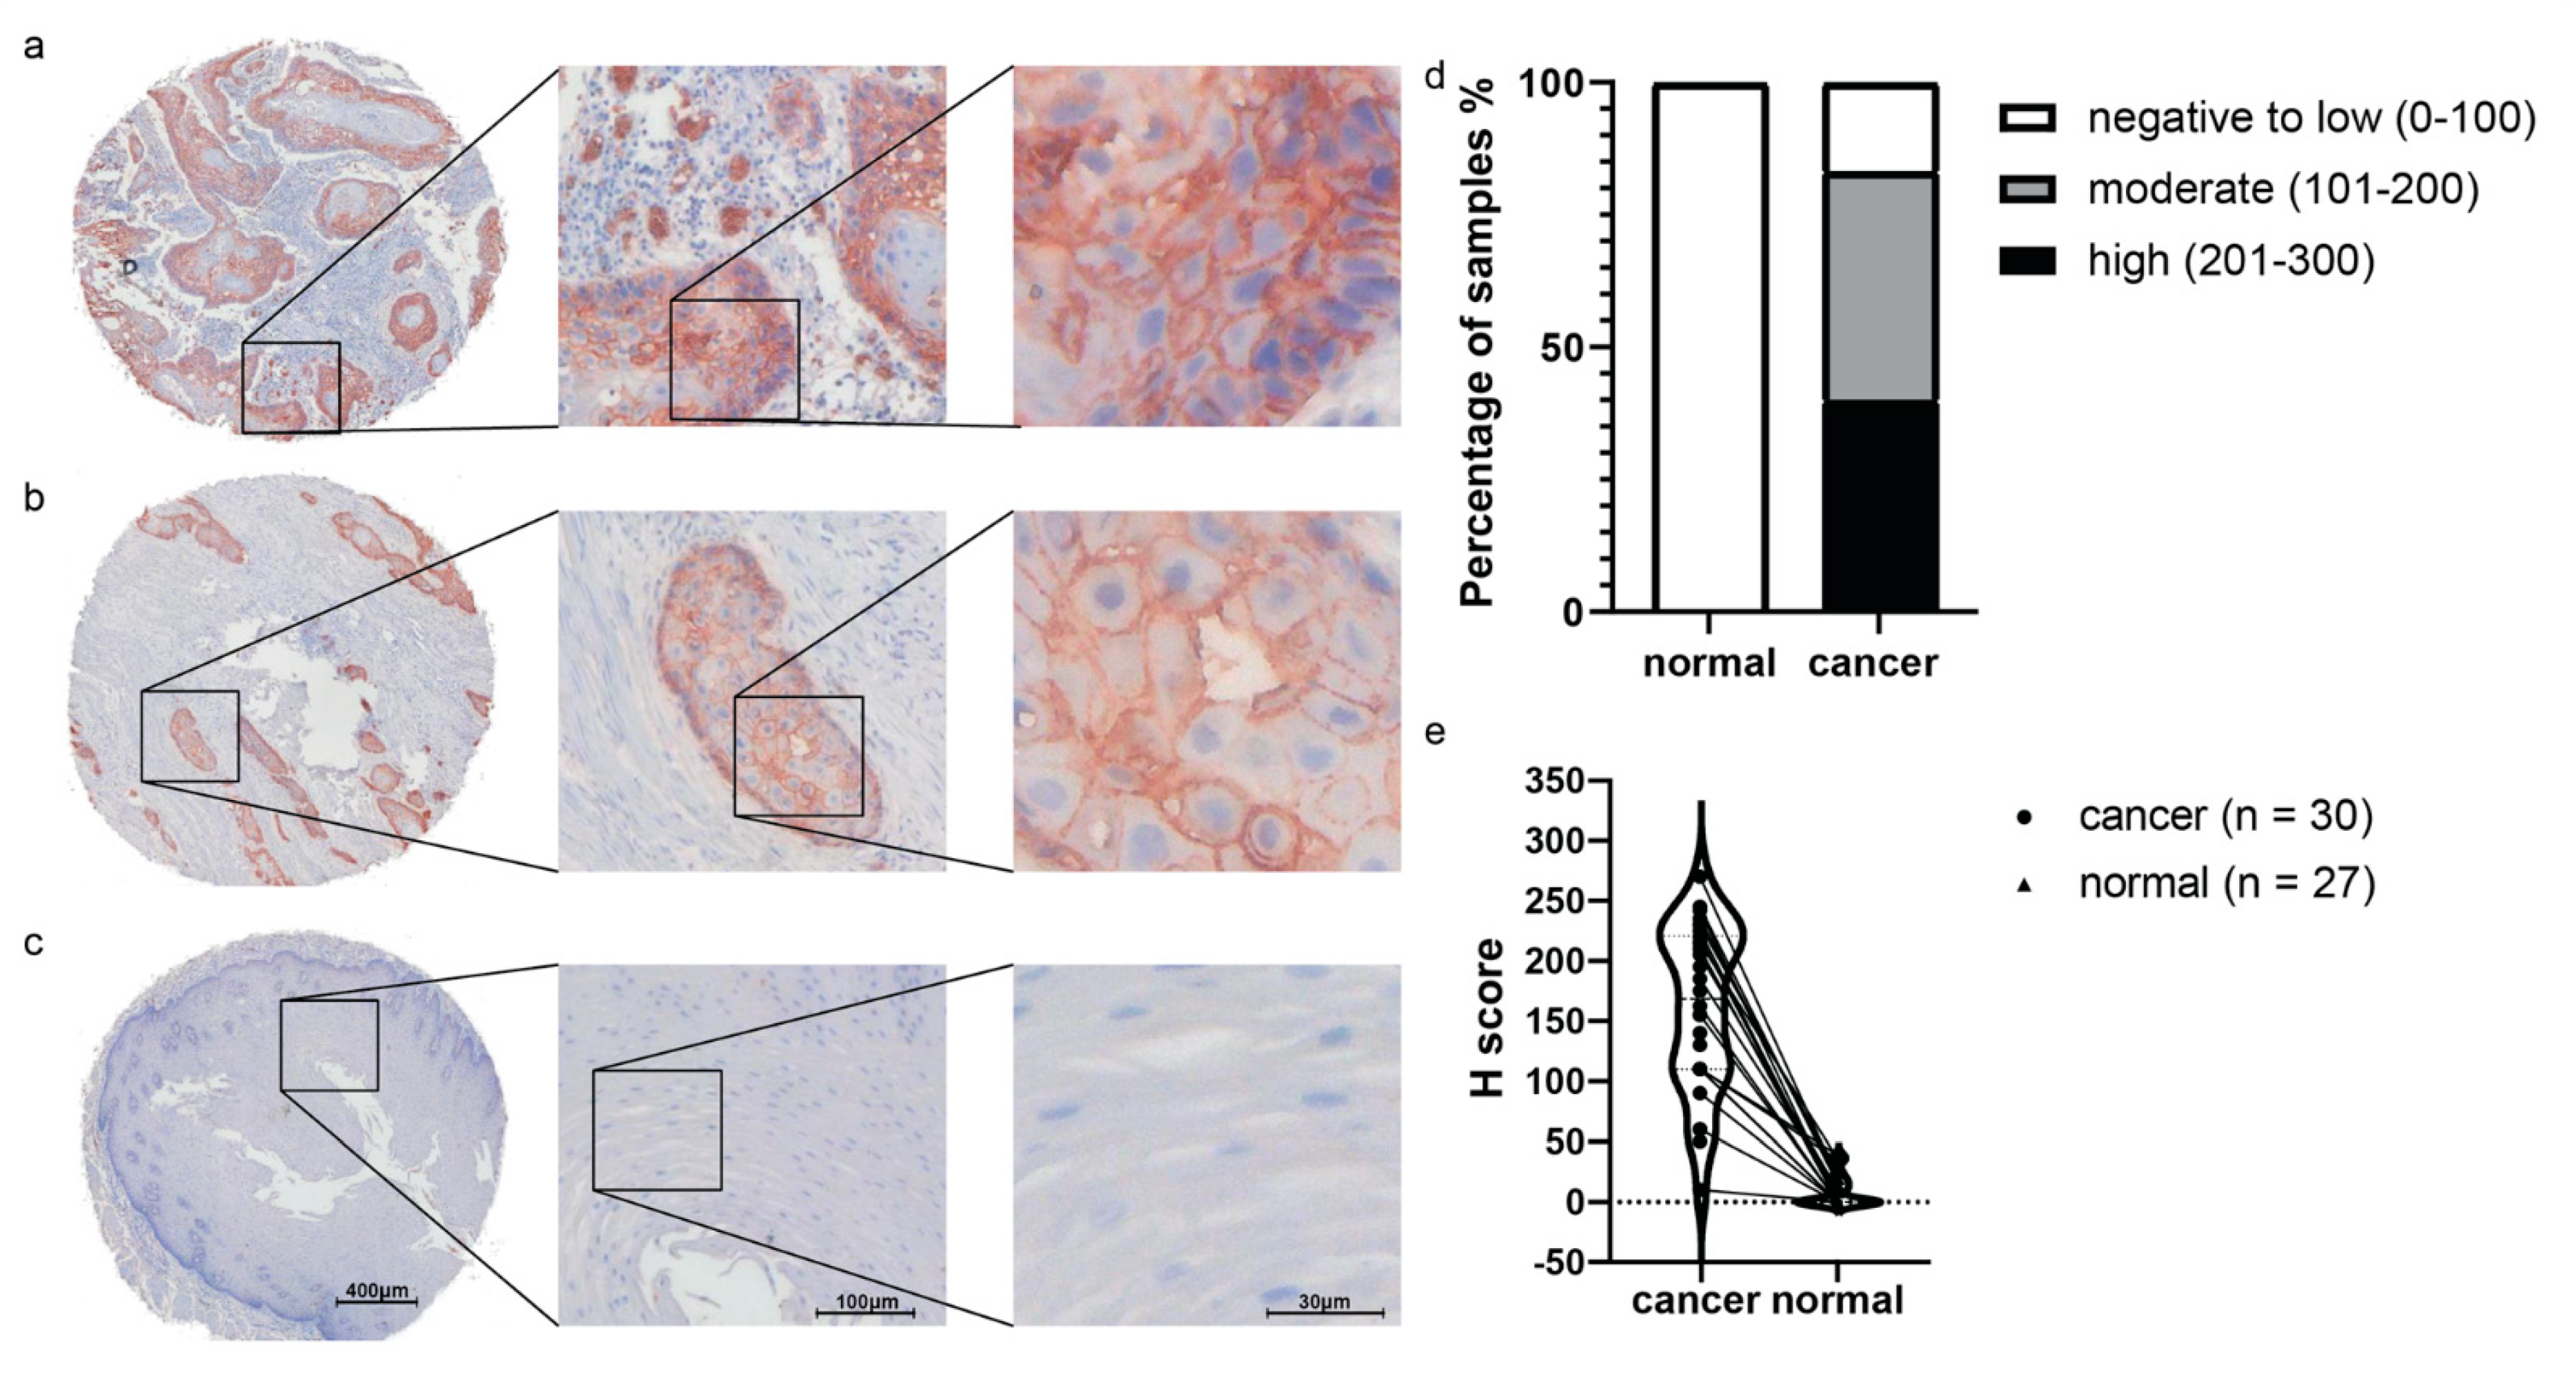
2.4. Ex Vivo Validation of GLUT1 by IHC on TMA: GLUT1 as a Potential Target in ESCC Populations
2.5. GLUT1-Related Fluorescence Imaging (2-DG 800CW) of Endoscopy Biopsies Ex Vivo
3. Discussion
4. Materials and Methods
4.1. Identification of Differentially Expressed Genes with Functional Genomic mRNA Profiling
4.2. Prioritization Strategy
4.3. Immunohistochemistry
4.4. H-Score Calculation
4.5. GLUT1 Related Fluorescence Imaging Using 2-DG 800CW on Patient-Derived Esophageal Squamous Cell Carcinoma Biopsies
4.6. Statistical Analyses
5. Conclusions
Supplementary Materials
Author Contributions
Funding
Institutional Review Board Statement
Informed Consent Statement
Data Availability Statement
Acknowledgments
Conflicts of Interest
References
- World Health Organization. Cancer Today: Data Visualization Tools for Exploring the Global Cancer Burden in 2020. Available online: https://gco.iarc.fr/today/home (accessed on 20 August 2021).
- Arnold, M.; Soerjomataram, I.; Ferlay, J.; Forman, D. Global incidence of oesophageal cancer by histological subtype in 2012. Gut 2015, 64, 381–387. [Google Scholar] [CrossRef] [Green Version]
- Then, E.O.; Lopez, M.; Saleem, S.; Gayam, V.; Sunkara, T.; Culliford, A.; Gaduputi, V. Esophageal Cancer: An Updated Surveillance Epidemiology and End Results Database Analysis. World J. Oncol. 2020, 11, 55–64. [Google Scholar] [CrossRef]
- Wei, W.Q.; Hao, C.Q.; Guan, C.T.; Song, G.H.; Wang, M.; Zhao, D.L.; Li, B.Y.; Bai, W.L.; Hou, P.Y.; Wang, J.W.; et al. Esophageal Histological Precursor Lesions and Subsequent 8.5-Year Cancer Risk in a Population-Based Prospective Study in China. Am. J. Gastroenterol. 2020, 115, 1036–1044. [Google Scholar] [CrossRef] [PubMed]
- Yamashina, T.; Ishihara, R.; Nagai, K.; Matsuura, N.; Matsui, F.; Ito, T.; Fujii, M.; Yamamoto, S.; Hanaoka, N.; Takeuchi, Y.; et al. Long-term outcome and metastatic risk after endoscopic resection of superficial esophageal squamous cell carcinoma. Am. J. Gastroenterol. 2013, 108, 544–551. [Google Scholar] [CrossRef] [PubMed]
- Akutsu, Y.; Uesato, M.; Shuto, K.; Kono, T.; Hoshino, I.; Horibe, D.; Sazuka, T.; Takeshita, N.; Maruyama, T.; Isozaki, Y.; et al. The overall prevalence of metastasis in T1 esophageal squamous cell carcinoma: A retrospective analysis of 295 patients. Ann. Surg. 2013, 257, 1032–1038. [Google Scholar] [CrossRef]
- Kitagawa, Y.; Uno, T.; Oyama, T.; Kato, K.; Kato, H.; Kawakubo, H.; Kawamura, O.; Kusano, M.; Kuwano, H.; Takeuchi, H.; et al. Esophageal cancer practice guidelines 2017 edited by the Japan Esophageal Society: Part 1. Esophagus 2019, 16, 1–24. [Google Scholar] [CrossRef] [PubMed] [Green Version]
- Rice, T.W.; Kelsen, D.; Blackstone, E.H.; Ishwaran, H.; Patil, D.T.; Bass, A.J.; Erasmus, J.J.; Gerdes, H.; Hofstetter, W.L. Esophagus and esophagogastric junction. In AJCC Cancer Staging Manual, 8th ed.; Amin, M.B., Edge, S., Greene, F., Byrd, D.R., Brookland, R.K., Washington, M.K., Gershenwald, J.E., Compton, C.C., Hess, K.R., Sullivan, D.C., et al., Eds.; Springer: New York, NY, USA, 2016; Chapter 16; pp. 185–202. [Google Scholar]
- Lam, A.K.; Ochiai, A.; Odze, R.D. Tumours of the oesophagus: Introduction. In WHO Classification of Tumours Digestive System Tumours, 5th ed.; Odze, R.D., Lam, A.K., Ochiai, A., Washington, M.K., Eds.; IARC: Lyon, France, 2019; Chapter 2; pp. 28–29. [Google Scholar]
- Kondo, H.; Fukuda, H.; Ono, H. Sodium thiosulfate solution spray for relief of irritation caused by Lugol’s stain in chromoendoscopy. Gastrointest. Endosc. 2001, 53, 199–202. [Google Scholar] [CrossRef] [PubMed]
- Li, J.; Xu, R.; Liu, M.; Cai, H.; Cao, C.; Liu, F.; Cai, H.; Cao, C.; Liu, F.; Li, F.; et al. Lugol chromoendoscopy detects esophageal dysplasia with low levels of sensitivity in a high-risk region of China. Clin. Gastroenterol. Hepatol. 2018, 16, 1585–1592. [Google Scholar] [CrossRef] [PubMed]
- Ide, E.; Carneiro, F.O.; Frazão, M.S.; Chaves, D.M.; Sallum, R.A.; de Moura, E.G.; Sakai, P.; Cecconello, I.; Maluf-Filho, F. Endoscopic detection of early esophageal squamous cell carcinoma in patients with achalasia: Narrow-band imaging versus Lugol’s staining. J. Oncol. 2013, 2013, 736756. [Google Scholar] [CrossRef] [PubMed] [Green Version]
- Gruner, M.; Denis, A.; Masliah, C.; Amil, M.; Metivier-Cesbron, E.; Luet, D.; Kaasis, M.; Coron, E.; Le Rhun, M.; Lecleire, S.; et al. Narrow-band imaging versus Lugol chromoendoscopy for esophageal squamous cell cancer screening in normal endoscopic practice: Randomized controlled trial. Endoscopy 2021, 53, 674–682. [Google Scholar]
- Lin, D.C.; Wang, M.R.; Koeffler, H.P. Genomic and Epigenomic Aberrations in Esophageal Squamous Cell Carcinoma and Implications for Patients. Gastroenterology 2018, 154, 374–389. [Google Scholar] [CrossRef] [Green Version]
- Nagengast, W.B.; Hartmans, E.; Garcia-Allende, P.B.; Peters, F.T.M.; Linssen, M.D.; Koch, M.; Koller, M.; Tjalma, J.J.J.; Karrenbeld, A.; Jorritsma-Smit, A.; et al. Near-infrared fluorescence molecular endoscopy detects dysplastic oesophageal lesions using topical and systemic tracer of vascular endothelial growth factor A. Gut 2019, 68, 7–10. [Google Scholar] [CrossRef] [PubMed] [Green Version]
- Shih, C.H.; Ozawa, S.; Ando, N.; Ueda, M.; Kitajima, M. Vascular endothelial growth factor expression predicts outcome and lymph node metastasis in squamous cell carcinoma of the esophagus. Clin. Cancer Res. 2000, 6, 1161–1168. [Google Scholar]
- Mukherjee, T.; Kumar, A.; Mathur, M.; Chattopadhyay, T.K.; Ralhan, R. Ets-1 and VEGF expression correlates with tumor angiogenesis, lymph node metastasis, and patient survival in esophageal squamous cell carcinoma. J. Cancer Res. Clin. Oncol. 2003, 129, 430–436. [Google Scholar] [CrossRef] [PubMed]
- Kovar, J.L.; Volcheck, W.; Sevick-Muraca, E.; Simpson, M.A.; Olive, D.M. Characterization and performance of a near-infrared 2-deoxyglucose optical imaging agent for mouse cancer models. Anal. Biochem. 2009, 384, 254–262. [Google Scholar] [CrossRef] [PubMed] [Green Version]
- Hartmans, E.; Orian-Rousseau, V.; Matzke-Ogi, A.; Karrenbeld, A.; de Groot, D.J.; de Jong, S.; van Dam, G.M.; Fehrmann, R.S.; Nagengast, W.B. Functional genomic mRNA profiling of colorectal adenomas: Identification and in vivo validation of CD44 and splice variant CD44v6 as molecular imaging targets. Theranostics 2017, 7, 482–492. [Google Scholar] [CrossRef] [PubMed]
- Fehrmann, R.S.; Karjalainen, J.M.; Krajewska, M.; Westra, H.J.; Maloney, D.; Simeonov, A.; Pers, T.H.; Hirschhorn, J.N.; Jansen, R.C.; Schultes, E.A.; et al. Gene expression analysis identifies global gene dosage sensitivity in cancer. Nat. Genet. 2015, 47, 115–125. [Google Scholar] [CrossRef] [PubMed]
- Zhang, Y.; Jin, X.; Wang, Z.; Zhang, X.; Liu, S.; Liu, G. Downregulation of SNHG1 suppresses cell proliferation and invasion by regulating Notch signaling pathway in esophageal squamous cell cancer. Cancer Biomark. 2017, 21, 89–96. [Google Scholar] [CrossRef] [PubMed]
- Qi, B.; Wang, Y.; Chen, Z.J.; Li, X.N.; Qi, Y.; Yang, Y.; Cui, G.H.; Guo, H.Z.; Li, W.H.; Zhao, S. Down-regulation of miR-30a-3p/5p promotes esophageal squamous cell carcinoma cell proliferation by activating the Wnt signaling pathway. World J. Gastroenterol. 2017, 23, 7965–7977. [Google Scholar] [CrossRef] [PubMed]
- Cubas, R.; Zhang, S.; Li, M.; Chen, C.; Yao, Q. Trop2 expression contributes to tumor pathogenesis by activating the ERK MAPK pathway. Mol. Cancer 2010, 9, 253. [Google Scholar] [CrossRef] [PubMed] [Green Version]
- Nakashima, K.; Shimada, H.; Ochiai, T.; Kuboshima, M.; Kuroiwa, N.; Okazumi, S.; Matsubara, H.; Nomura, F.; Takiguchi, M.; Hiwasa, T. Serological identification of TROP2 by recombinant cDNA expression cloning using sera of patients with esophageal squamous cell carcinoma. Int. J. Cancer 2004, 112, 1029–1035. [Google Scholar] [CrossRef] [PubMed]
- Bardia, A.; Messersmith, W.A.; Kio, E.A.; Berlin, J.D.; Vahdat, L.; Masters, G.A.; Moroose, R.; Santin, A.D.; Kalinsky, K.; Picozzi, V.; et al. Sacituzumab govitecan, a Trop-2-directed antibody-drug conjugate, for patients with epithelial cancer: Final safety and efficacy results from the phase I/II IMMU-132-01 basket trial. Ann. Oncol. 2021, 32, 746–756. [Google Scholar] [CrossRef]
- Kim, Y.H.; Jeong, D.C.; Pak, K.; Han, M.E.; Kim, J.Y.; Liangwen, L.; Kim, H.J.; Kim, T.W.; Kim, T.H.; Hyun, D.W.; et al. SLC2A2 (GLUT2) as a novel prognostic factor for hepatocellular carcinoma. Oncotarget 2017, 8, 68381–68392. [Google Scholar] [CrossRef] [PubMed] [Green Version]
- Choi, W.H.; Yoo, I.E.R.; Kim, T.J.; Lee, K.Y.; Kim, Y.K. Is the Glut expression related to FDG uptake in PET/CT of non-small cell lung cancer patients? Technol. Health Care 2015, 23 (Suppl. S2), 311–318. [Google Scholar] [CrossRef] [Green Version]
- Nakashima, T.; Takayama, Y.; Nishie, A.; Asayama, Y.; Baba, S.; Yamashita, Y.; Shirabe, K.; Kubo, Y.; Hida, T.; Honda, H. Hepatocellular adenoma showing high uptake of (18)F-fluorodeoxyglucose (FDG) via an increased expression of glucose transporter 2 (GLUT-2). Clin. Imaging 2014, 38, 888–891. [Google Scholar] [CrossRef]
- Van den Abbeele, A.D.; Gatsonis, C.; de Vries, D.J.; Melenevsky, Y.; Szot-Barnes, A.; Yap, J.T.; Godwin, A.K.; Rink, L.; Huang, M.; Blevins, M.; et al. ACRIN 6665/RTOG 0132 phase II trial of neoadjuvant imatinib mesylate for operable malignant gastrointestinal stromal tumor: Monitoring with 18F-FDG PET and correlation with genotype and GLUT4 expression. J. Nucl. Med. 2012, 53, 567–574. [Google Scholar] [CrossRef] [Green Version]
- Zhou, J.C.; Zhang, J.J.; Zhang, W.; Ke, Z.Y.; Ma, L.G.; Liu, M. Expression of GLUT-1 in nasopharyngeal carcinoma and its clinical significance. Eur. Rev. Med. Pharmacol. Sci. 2017, 21, 4891–4895. [Google Scholar]
- Xie, B.W.; Mol, I.M.; Keereweer, S.; van Beek, E.R.; Que, I.; Snoeks, T.J.; Chan, A.; Kaijzel, E.L.; Löwik, C.W. Dual-wavelength imaging of tumor progression by activatable and targeting near-infrared fluorescent probes in a bioluminescent breast cancer model. PLoS ONE 2012, 7, e31875. [Google Scholar] [CrossRef] [Green Version]
- Cancer Genome Atlas Research Network; Analysis Working Group: Asan University; BC Cancer Agency; Brigham and Women’s Hospital; Broad Institute; Brown University; Case Western Reserve University; Dana-Farber Cancer Institute; Duke University; Greater Poland Cancer Centre; et al. Integrated genomic characterization of oesophageal carcinoma. Nature 2017, 541, 169–175. [Google Scholar] [CrossRef] [PubMed] [Green Version]
- Hao, J.J.; Lin, D.C.; Dinh, H.Q.; Mayakonda, A.; Jiang, Y.Y.; Chang, C.; Jiang, Y.; Lu, C.C.; Shi, Z.Z.; Xu, X.; et al. Spatial intratumoral heterogeneity and temporal clonal evolution in esophageal squamous cell carcinoma. Nat. Genet. 2016, 48, 1500–1507. [Google Scholar] [CrossRef]
- Chen, J.; Jiang, Y.; Chang, T.S.; Joshi, B.; Zhou, J.; Rubenstein, J.H.; Wamsteker, E.J.; Kwon, R.S.; Appelman, H.; Beer, D.G.; et al. Multiplexed endoscopic imaging of Barrett’s neoplasia using targeted fluorescent heptapeptides in a phase 1 proof-of-concept study. Gut 2021, 70, 1010–1013. [Google Scholar] [CrossRef] [PubMed]
- Barrett, T.; Wilhite, S.E.; Ledoux, P.; Evangelista, C.; Kim, I.F.; Tomashevsky, M.; Marshall, K.A.; Phillippy, K.H.; Sherman, P.M.; Holko, M.; et al. NCBI GEO: Archive for functional genomics data sets—update. Nucleic Acids Res. 2013, 41, D991–D995. [Google Scholar] [CrossRef] [PubMed] [Green Version]
- Koller, M.; Hartmans, E.; de Groot, D.J.A.; Zhao, X.J.; van Dam, G.M.; Nagengast, W.B.; Fehrmann, R.S.N. Data-driven prioritization and review of targets for molecular-based theranostic approaches in pancreatic cancer. J. Nucl. Med. 2017, 58, 1899–1903. [Google Scholar] [CrossRef] [Green Version]
- Kimchi, E.T.; Posner, M.C.; Park, J.O.; Darga, T.E.; Kocherginsky, M.; Karrison, T.; Hart, J.; Smith, K.D.; Mezhir, J.J.; Weichselbaum, R.R.; et al. Progression of Barrett’s metaplasia to adenocarcinoma is associated with the suppression of the transcriptional programs of epidermal differentiation. Cancer Res. 2005, 65, 3146–3154. [Google Scholar] [CrossRef] [Green Version]
- Stairs, D.B.; Nakagawa, H.; Klein-Szanto, A.; Mitchell, S.D.; Silberg, D.G.; Tobias, J.W.; Lynch, J.P.; Rustgi, A.K. Cdx1 and c-Myc foster the initiation of transdifferentiation of the normal esophageal squamous epithelium toward Barrett’s esophagus. PLoS ONE 2008, 3, e3534. [Google Scholar] [CrossRef] [PubMed] [Green Version]
- Wang, Q.; Ma, C.; Kemmner, W. Wdr66 is a novel marker for risk stratification and involved in epithelial-mesenchymal transition of esophageal squamous cell carcinoma. BMC Cancer 2013, 13, 137. [Google Scholar] [CrossRef] [Green Version]
- Lee, J.J.; Natsuizaka, M.; Ohashi, S.; Wong, G.S.; Takaoka, M.; Michaylira, C.Z.; Budo, D.; Tobias, J.W.; Kanai, M.; Shirakawa, Y.; et al. Hypoxia activates the cyclooxygenase-2-prostaglandin E synthase axis. Carcinogenesis 2010, 31, 427–434. [Google Scholar] [CrossRef] [Green Version]
- Yu, K.; Ganesan, K.; Tan, L.K.; Laban, M.; Wu, J.; Zhao, X.D.; Li, H.; Leung, C.H.; Zhu, Y.; Wei, C.L.; et al. A precisely regulated gene expression cassette potently modulates metastasis and survival in multiple solid cancers. PLoS Genet. 2008, 4, e1000129. [Google Scholar] [CrossRef] [Green Version]
- Hyland, P.L.; Zhang, H.; Yang, Q.; Yang, H.H.; Hu, N.; Lin, S.W.; Su, H.; Wang, L.; Wang, C.; Ding, T.; et al. Pathway, in silico and tissue-specific expression quantitative analyses of oesophageal squamous cell carcinoma genome-wide association studies data. Int. J. Epidemiol. 2016, 45, 206–220. [Google Scholar] [CrossRef] [Green Version]
- Aoyagi, K.; Minashi, K.; Igaki, H.; Tachimori, Y.; Nishimura, T.; Hokamura, N.; Ashida, A.; Daiko, H.; Ochiai, A.; Muto, M.; et al. Artificially induced epithelial-mesenchymal transition in surgical subjects: Its implications in clinical and basic cancer research. PLoS ONE 2011, 6, e18196. [Google Scholar] [CrossRef]
- Chen, K.; Li, Y.; Dai, Y.; Li, J.; Qin, Y.; Zhu, Y.; Zeng, T.; Ban, X.; Fu, L.; Guan, X.Y. Characterization of tumor suppressive function of cornulin in esophageal squamous cell carcinoma. PLoS ONE 2013, 8, e68838. [Google Scholar] [CrossRef] [PubMed] [Green Version]
- Matsuyama, Y.; Suzuki, M.; Arima, C.; Huang, Q.M.; Tomida, S.; Takeuchi, T.; Sugiyama, R.; Itoh, Y.; Yatabe, Y.; Goto, H.; et al. Proteasomal non-catalytic subunit PSMD2 as a potential therapeutic target in association with various clinicopathologic features in lung adenocarcinomas. Mol. Carcinog. 2011, 50, 301–309. [Google Scholar] [CrossRef]
- Davis, H.; Irshad, S.; Bansal, M.; Rafferty, H.; Boitsova, T.; Bardella, C.; Jaeger, E.; Lewis, A.; Freeman-Mills, L.; Giner, F.C.; et al. Aberrant epithelial GREM1 expression initiates colonic tumorigenesis from cells outside the stem cell niche. Nat. Med. 2015, 21, 62–70. [Google Scholar] [CrossRef]
- Van Vlodrop, I.J.; Baldewijns, M.M.; Smits, K.M.; Schouten, L.J.; van Neste, L.; van Criekinge, W.; van Poppel, H.; Lerut, E.; Schuebel, K.E.; Ahuja, N.; et al. Prognostic significance of Gremlin1 (GREM1) promoter CpG island hypermethylation in clear cell renal cell carcinoma. Am. J. Pathol. 2010, 176, 575–584. [Google Scholar] [CrossRef] [Green Version]
- Xu, G.; Tang, S.; Yang, J.; Chen, K.; Kang, J.; Zhao, G.; Feng, F.; Yang, X.; Zhao, L.; Lu, Q.; et al. BMP7 expression in esophageal squamous cell carcinoma and its potential role in modulating metastasis. Dig. Dis. Sci. 2013, 58, 1871–1879. [Google Scholar] [CrossRef]
- Motoyama, K.; Tanaka, F.; Kosaka, Y.; Mimori, K.; Uetake, H.; Inoue, H.; Sugihara, K.; Mori, M. Clinical significance of BMP7 in human colorectal cancer. Ann. Surg. Oncol. 2008, 15, 1530–1537. [Google Scholar] [CrossRef]
- Alarmo, E.L.; Pärssinen, J.; Ketolainen, J.M.; Savinainen, K.; Karhu, R.; Kallioniemi, A. BMP7 influences proliferation, migration, and invasion of breast cancer cells. Cancer Lett. 2009, 275, 35–43. [Google Scholar] [CrossRef] [PubMed]
- Wang, T.; Han, S.; Wu, Z.; Han, Z.; Yan, W.; Liu, T.; Wei, H.; Song, D.; Zhou, W.; Yang, X.; et al. XCR1 promotes cell growth and migration and is correlated with bone metastasis in non-small cell lungcancer. Biochem. Biophys. Res. Commun. 2015, 464, 635–641. [Google Scholar] [CrossRef] [PubMed]
- Kim, M.; Rooper, L.; Xie, J.; Rayahin, J.; Burdette, J.E.; Kajdacsy-Balla, A.A.; Barbolina, M.V. The lymphotactin receptor is expressed in epithelial ovarian carcinoma and contributes to cell migration and proliferation. Mol. Cancer Res. 2012, 10, 1419–1429. [Google Scholar] [CrossRef] [PubMed] [Green Version]
- Louie, S.M.; Grossman, E.A.; Crawford, L.A.; Ding, L.; Camarda, R.; Huffman, T.R.; Miyamoto, D.K.; Goga, A.; Weerapana, E.; Nomura, D.K. GSTP1 Is a Driver of Triple-Negative Breast Cancer Cell Metabolism and Pathogenicity. Cell Chem. Biol. 2016, 23, 567–578. [Google Scholar] [CrossRef] [Green Version]
- Yamamoto, Y.; Konishi, H.; Ichikawa, D.; Arita, T.; Shoda, K.; Komatsu, S.; Shiozaki, A.; Ikoma, H.; Fujiwara, H.; Okamoto, K.; et al. Significance of GSTP1 for predicting the prognosis and chemotherapeutic efficacy in esophageal squamous cell carcinoma. Oncol. Rep. 2013, 30, 1687–1694. [Google Scholar] [CrossRef] [Green Version]
- Allameh, A.; Rasmi, Y.; Nasseri-Moghaddam, S.; Tavangar, S.M.; Sharifi, R.; Sadreddini, M. Immunohistochemical analysis of selected molecular markers in esophagus precancerous, adenocarcinoma and squamous cell carcinoma in Iranian subjects. Cancer Epidemiol. 2009, 33, 79–84. [Google Scholar] [CrossRef]
- Zhang, R.; Kang, K.A.; Piao, M.J.; Kim, K.C.; Zheng, J.; Yao, C.W.; Cha, J.W.; Maeng, Y.H.; Chang, W.Y.; Moon, P.G.; et al. Epigenetic alterations are involved in the overexpression of glutathione S-transferase π-1 in human colorectal cancers. Int. J. Oncol. 2014, 45, 1275–1283. [Google Scholar] [CrossRef] [Green Version]
- Fujikawa, Y.; Urano, Y.; Komatsu, T.; Hanaoka, K.; Kojima, H.; Terai, T.; Inoue, H.; Nagano, T. Design and synthesis of highly sensitive fluorogenic substrates for glutathione S-transferase and application for activity imaging in living cells. J. Am. Chem. Soc. 2008, 130, 14533–14543. [Google Scholar] [CrossRef]
- Jin, X.; Zhai, B.; Fang, T.; Guo, X.; Xu, L. FXR1 is elevated in colorectal cancer and acts as an oncogene. Tumour Biol. 2016, 37, 2683–2690. [Google Scholar] [CrossRef] [PubMed]
- Qian, J.; Hassanein, M.; Hoeksema, M.D.; Harris, B.K.; Zou, Y.; Chen, H.; Lu, P.; Eisenberg, R.; Wang, J.; Espinosa, A.; et al. The RNA binding protein FXR1 is a new driver in the 3q26-29 amplicon and predicts poor prognosis in human cancers. Proc. Natl. Acad. Sci. USA 2015, 112, 3469–3474. [Google Scholar] [CrossRef] [Green Version]
- Michifuri, Y.; Hirohashi, Y.; Torigoe, T.; Miyazaki, A.; Fujino, J.; Tamura, Y.; Tsukahara, T.; Kanaseki, T.; Kobayashi, J.; Sasaki, T.; et al. Small proline-rich protein-1B is overexpressed in human oral squamous cell cancer stem-like cells and is related to their growth through activation of MAP kinase signal. Biochem. Biophys. Res. Commun. 2013, 439, 96–102. [Google Scholar] [CrossRef] [PubMed]
- Pu, X.; Wang, J.; Li, W.; Fan, W.; Wang, L.; Mao, Y.; Yang, S.; Liu, S.; Xu, J.; Lv, Z.; et al. COPB2 promotes cell proliferation and tumorigenesis through up-regulating YAP1 expression in lung adenocarcinoma cells. Biomed. Pharmacother. 2018, 103, 373–380. [Google Scholar] [CrossRef] [PubMed]
- Kim, B.K.; Yoo, H.I.; Kim, I.; Park, J.; Kim Yoon, S. FZD6 expression is negatively regulated by miR-199a-5p in human colorectal cancer. BMB Rep. 2015, 48, 360–366. [Google Scholar] [CrossRef] [Green Version]
- Yan, J.; Liu, T.; Zhou, X.; Dang, Y.; Yin, C.; Zhang, G. FZD6, targeted by miR-21, represses gastric cancer cell proliferation and migration via activating non-canonical wnt pathway. Am. J. Transl. Res. 2016, 8, 2354–2364. [Google Scholar]
- Wang, L.; Chen, S.; Xue, M.; Zhong, J.; Wang, X.; Gan, L.; Lam, E.K.; Liu, X.; Zhang, J.; Zhou, T.; et al. Homeobox D10 gene, a candidate tumor suppressor, is downregulated through promoter hypermethylation and associated with gastric carcinogenesis. Mol. Med. 2012, 18, 389–400. [Google Scholar] [CrossRef] [PubMed]
- Lee, P.; Jiang, S.; Li, Y.; Yue, J.; Gou, X.; Chen, S.Y.; Zhao, Y.; Schober, M.; Tan, M.; Wu, X. Phosphorylation of Pkp1 by RIPK4 regulates epidermal differentiation and skin tumorigenesis. EMBO J. 2017, 36, 1963–1980. [Google Scholar] [CrossRef]
- Hamamoto, R.; Toyokawa, G.; Nakakido, M.; Ueda, K.; Nakamura, Y. SMYD2-dependent HSP90 methylation promotes cancer cell proliferation by regulating the chaperone complex formation. Cancer Lett. 2014, 351, 126–133. [Google Scholar] [CrossRef] [PubMed]
- Chan, C.T.; Paulmurugan, R.; Gheysens, O.S.; Kim, J.; Chiosis, G.; Gambhir, S.S. Molecular imaging of the efficacy of heat shock protein 90 inhibitors in living subjects. Cancer Res. 2008, 68, 216–226. [Google Scholar] [CrossRef] [PubMed] [Green Version]
- Lau, D.; Guo, L.; Chan, A.; Wu, R. SPR1. An early molecular marker for bronchial carcinogenesis. Methods Mol. Med. 2003, 75, 397–403. [Google Scholar] [PubMed]
- Matsuyama, A.; Hisaoka, M.; Hashimoto, H. PLAG1 expression in mesenchymal tumors: An immunohistochemical study with special emphasis on the pathogenetical distinction between soft tissue myoepithelioma and pleomorphic adenoma of the salivary gland. Pathol. Int. 2012, 62, 1–7. [Google Scholar] [CrossRef]
- Declercq, J.; Van Dyck, F.; Braem, C.V.; Van Valckenborgh, I.C.; Voz, M.; Wassef, M.; Schoonjans, L.; Van Damme, B.; Fiette, L.; Van de Ven, W.J. Salivary gland tumors in transgenic mice with targeted PLAG1 proto-oncogene overexpression. Cancer Res. 2005, 65, 4544–4553. [Google Scholar] [CrossRef] [PubMed] [Green Version]
- Lauenborg, B.; Kopp, K.; Krejsgaard, T.; Eriksen, K.W.; Geisler, C.; Dabelsteen, S.; Gniadecki, R.; Zhang, Q.; Wasik, M.A.; Woetmann, A.; et al. Programmed cell death-10 enhances proliferation and protects malignant T cells from apoptosis. APMIS 2010, 118, 719–728. [Google Scholar] [CrossRef] [Green Version]
- Wang, Y.; Godin-Heymann, N.; Dan Wang, X.; Bergamaschi, D.; Llanos, S.; Lu, X. ASPP1 and ASPP2 bind active RAS, potentiate RAS signalling and enhance p53 activity in cancer cells. Cell Death Differ. 2013, 20, 525–534. [Google Scholar] [CrossRef] [Green Version]
- O’Byrne, K.; Paquet, N.; Box, J.K.; Adams, M.; Richard, D. 17P Examination of EXOSC4 as a new prognostic marker and a novel therapeutic avenue in lung adenocarcinoma. J. Thorac. Oncol. 2016, 11 (Suppl. S4), 63. [Google Scholar] [CrossRef]
- Hasan, R.; Srivastava, G.; Alyass, A.; Sharma, R.; Saraya, A.; Chattopadhyay, T.K.; DattaGupta, S.; Walfish, P.G.; Chauhan, S.S.; Ralhan, R. Prediction of recurrence free survival for esophageal cancer patients using a protein signature based risk model. Oncotarget 2016, 5, 18. [Google Scholar] [CrossRef] [Green Version]
- You, X.J.; Bryant, P.J.; Jurnak, F.; Holcombe, R.F. Expression of Wnt pathway components frizzled and disheveled in colon cancer arising in patients with inflammatory bowel disease. Oncol. Rep. 2007, 18, 691–694. [Google Scholar] [CrossRef] [PubMed] [Green Version]
- Zhao, H.; Zhao, Y.; Jiang, G.; Zhang, X.; Zhang, Y.; Dong, Q.; Luan, L.; Papavassiliou, P.; Wang, E.; Wang, E. Dishevelled-3 activates p65 to upregulate p120-catenin transcription via a p38-dependent pathway in non-small cell lung cancer. Mol. Carcinog. 2015, 54 (Suppl. S1), E112–E121. [Google Scholar] [CrossRef]
- Ogane, N.; Yasuda, M.; Shimizu, M.; Miyazawa, M.; Kamoshida, S.; Ueda, A.; Takata, K.; Sakuma, Y.; Miyagi, Y.; Kameda, Y. Clinicopathological implications of expressions of hypoxia-related molecules in esophageal superficial squamous cell carcinoma. Ann. Diagn. Pathol. 2010, 14, 23–29. [Google Scholar] [CrossRef] [PubMed]
- Goos, J.A.; de Cuba, E.M.; Coupé, V.M.; Diosdado, B.; Delis-Van Diemen, P.M.; Karga, C.; Beliën, J.A.; Menke-Van der Houven van Oordt, C.W.; Geldof, A.A.; Meijer, G.A.; et al. Glucose Transporter 1 (SLC2A1) and Vascular Endothelial Growth Factor A (VEGFA) Predict Survival After Resection of Colorectal Cancer Liver Metastasis. Ann. Surg. 2016, 263, 138–145. [Google Scholar] [CrossRef] [PubMed]
- Wellberg, E.A.; Johnson, S.; Finlay-Schultz, J.; Lewis, A.S.; Terrell, K.L.; Sartorius, C.A.; Abel, E.D.; Muller, W.J.; Anderson, S.M. The glucose transporter GLUT1 is required for ErbB2-induced mammary tumorigenesis. Breast Cancer Res. 2016, 18, 131. [Google Scholar] [CrossRef] [Green Version]
- Sohn, C.H.; Park, S.P.; Choi, S.H.; Park, S.H.; Kim, S.; Xu, L.; Kim, S.H.; Hur, J.A.; Choi, J.; Choi, T.H. MRI molecular imaging using GLUT1 antibody-Fe3O4 nanoparticles in the hemangioma animal model for differentiating infantile hemangioma from vascular malformation. Nanomedicine 2015, 11, 127–135. [Google Scholar] [CrossRef]
- Jin, Z.L.; Pei, H.; Xu, Y.H.; Yu, J.; Deng, T. The SUMO-specific protease SENP5 controls DNA damage response and promotes tumorigenesis in hepatocellular carcinoma. Eur. Rev. Med. Pharmacol. Sci. 2016, 20, 3566–3573. [Google Scholar]
- Chen, C.F.; Hsu, E.C.; Lin, K.T.; Tu, P.H.; Chang, H.W.; Lin, C.H.; Chen, Y.J.; Gu, D.L.; Lin, C.H.; Wu, J.Y.; et al. Overlapping high-resolution copy number alterations in cancer genomes identified putative cancer genes in hepatocellular carcinoma. Hepatology 2010, 52, 1690–1701. [Google Scholar] [CrossRef] [PubMed]
- Mourskaia, A.A.; Amir, E.; Dong, Z.; Tiedemann, K.; Cory, S.; Omeroglu, A.; Bertos, N.; Ouellet, V.; Clemons, M.; Scheffer, G.L.; et al. ABCC5 supports osteoclast formation and promotes breast cancer metastasis to bone. Breast Cancer Res. 2012, 14, R149. [Google Scholar] [CrossRef] [PubMed] [Green Version]
- Tóth, K.; Wasserkort, R.; Sipos, F.; Kalmár, A.; Wichmann, B.; Leiszter, K.; Valcz, G.; Juhász, M.; Miheller, P.; Patai, Á.V.; et al. Detection of Methylated Septin 9 in Tissue and Plasma of Colorectal Patients with Neoplasia and the Relationship to the Amount of Circulating Cell-Free DNA. PLoS ONE 2014, 9, e115415. [Google Scholar] [CrossRef]
- Liu, M.; Shen, S.; Chen, F.; Yu, W.; Yu, L. Linking the septin expression with carcinogenesis. Mol. Biol. Rep. 2010, 37, 3601–3608. [Google Scholar] [CrossRef]
- Name, N.; Boonpipattanapong, T.; Palanusont, A.; Maneechay, W.; Sangkhathat, S. Alteration of Leptin and Adiponectin in Multistep Colorectal Tumorigenesis. Asian Pac. J. Cancer Prev. 2016, 17, 2119–2123. [Google Scholar]
- Cai, X.Y.; Wang, X.F.; Li, J.; Dong, J.N.; Liu, J.Q.; Li, N.P.; Yun, B.; Xia, R.L. Overexpression of CD39 and high tumoral CD39+/CD8+ ratio are associated with adverse prognosis in resectable gastric cancer. Int. J. Clin. Exp. Pathol. 2015, 8, 14757–14764. [Google Scholar] [PubMed]
- Cai, X.Y.; Ni, X.C.; Yi, Y.; He, H.W.; Wang, J.X.; Fu, Y.P.; Sun, J.; Zhou, J.; Cheng, Y.F.; Jin, J.J. Overexpression of CD39 in hepatocellular carcinoma is an independent indicator of poor outcome after radical resection. Medicine 2016, 95, e4989. [Google Scholar] [CrossRef] [PubMed]
- Luan, S.L.; Boulanger, E.; Ye, H.; Chanudet, E.; Johnson, N.; Hamoudi, R.A.; Bacon, C.M.; Liu, H.; Huang, Y.; Said, J.; et al. Primary effusion lymphoma: Genomic profiling revealed amplification of SELPLG and CORO1C encoding for proteins important for cell migration. J. Pathol. 2010, 222, 166–179. [Google Scholar] [CrossRef] [PubMed]
- Fu, W.; Sun, J.; Huang, G.; Liu, J.C.; Kaufman, A.; Ryan, R.J.; Ramanathan, S.Y.; Venkatesh, T.; Singh, B. Squamous Cell Carcinoma-related Oncogene (SCCRO) Family Members Regulate Cell Growth and Proliferation through Their Cooperative and Antagonistic Effects on Cullin Neddylation. J. Biol. Chem. 2016, 291, 6200–6217. [Google Scholar] [CrossRef] [PubMed] [Green Version]
- De Andrea, C.E.; Zhu, J.F.; Jin, H.; Bovée, J.V.; Jones, K.B. Cell cycle deregulation and mosaic loss of Ext1 drive peripheral chondrosarcomagenesis in the mouse and reveal an intrinsic cilia deficiency. J. Pathol. 2015, 236, 210–218. [Google Scholar] [CrossRef] [PubMed] [Green Version]
- Aihara, H.; Nakagawa, T.; Mizusaki, H.; Yoneda, M.; Kato, M.; Doiguchi, M.; Imamura, Y.; Higashi, M.; Ikura, T.; Hayashi, T.; et al. Histone H2A T120 Phosphorylation Promotes Oncogenic Transformation via Upregulation of Cyclin D1. Mol. Cell. 2016, 64, 176–188. [Google Scholar] [CrossRef] [Green Version]
- Jullien, D.; Vignard, J.; Fedor, Y.; Béry, N.; Olichon, A.; Crozatier, M.; Erard, M.; Cassard, H.; Ducommun, B.; Salles, B.; et al. Chromatibody, a novel non-invasive molecular tool to explore and manipulate chromatin in living cells. J. Cell Sci. 2016, 129, 2673–2683. [Google Scholar]
- Hu, J.; Zhang, L.C.; Song, X.; Lu, J.R.; Jin, Z. KRT6 interacting with notch1 contributes to progression of renal cell carcinoma, and aliskiren inhibits renal carcinoma cell lines proliferation in vitro. Int. J. Clin. Exp. Pathol. 2015, 8, 9182–9188. [Google Scholar] [PubMed]
- Sun, Y.; Li, H. Functional characterization of SAG/RBX2/ROC2/RNF7, an antioxidant protein and an E3 ubiquitin ligase. Protein Cell 2013, 4, 103–116. [Google Scholar] [CrossRef] [PubMed] [Green Version]
- Milosevic, V.S.; Vukmirovic, F.C.; Krstic, M.S.; Zindovic, M.M.; Lj Stojanovic, D.; Jancic, S.A. Involvement of leptin receptors expression in proliferation and neoangiogenesis in colorectal carcinoma. J. BUON 2015, 20, 100–108. [Google Scholar] [PubMed]
- Howard, J.M.; Cathcart, M.C.; Healy, L.; Beddy, P.; Muldoon, C.; Pidgeon, G.P.; Reynolds, J.V. Leptin and adiponectin receptor expression in oesophageal cancer. Br. J. Surg. 2014, 101, 643–652. [Google Scholar] [CrossRef] [PubMed] [Green Version]
- Luque-García, J.L.; Martínez-Torrecuadrada, J.L.; Epifano, C.; Cañamero, M.; Babel, I.; Casal, J.I. Differential protein expression on the cell surface of colorectal cancer cells associated to tumor metastasis. Proteomics 2010, 10, 940–952. [Google Scholar] [CrossRef] [PubMed] [Green Version]
- Lin, Y.C.; Wu, M.Y.; Li, D.R.; Wu, X.Y.; Zheng, R.M. Prognostic and clinicopathological features of E-cadherin, alpha-catenin, beta-catenin, gamma-catenin and cyclin D1 expression in human esophageal squamous cell carcinoma. World J. Gastroenterol. 2004, 10, 3235–3239. [Google Scholar] [CrossRef]
- Kim, C.Y.; Jung, W.Y.; Lee, H.J.; Kim, H.K.; Kim, A.; Shin, B.K. Proteomic analysis reveals overexpression of moesin and cytokeratin 17 proteins in colorectal carcinoma. Oncol. Rep. 2012, 27, 608–620. [Google Scholar] [PubMed] [Green Version]
- Hu, H.; Xu, D.H.; Huang, X.X.; Zhu, C.C.; Xu, J.; Zhang, Z.Z.; Zhao, G. Keratin17 Promotes Tumor Growth and is Associated with Poor Prognosis in Gastric Cancer. J. Cancer 2018, 9, 346–357. [Google Scholar] [CrossRef] [Green Version]
- Simpson, J.A.; Al-Attar, A.; Watson, N.F.; Scholefield, J.H.; Ilyas, M.; Durrant, L.G. Intratumoral T cell infiltration, MHC class I and STAT1 as biomarkers of good prognosis in colorectal cancer. Gut 2010, 59, 926–933. [Google Scholar] [CrossRef]
- Zhang, C.; Hou, D.; Wei, H.; Zhao, M.; Yang, L.; Liu, Q.; Zhang, X.; Gong, Y.; Shao, C. Lack of interferon-γ receptor results in a microenvironment favorable for intestinal tumorigenesis. Oncotarget 2016, 7, 42099–42109. [Google Scholar] [CrossRef] [Green Version]
- Miyazaki, T.; Kato, H.; Nakajima, M.; Sohda, M.; Fukai, Y.; Masuda, N.; Manda, R.; Fukuchi, M.; Tsukada, K.; Kuwano, H. FAK overexpression is correlated with tumour invasiveness and lymph node metastasis in oesophageal squamous cell carcinoma. Br. J. Cancer 2003, 89, 140–145. [Google Scholar] [CrossRef] [Green Version]
- Cance, W.G.; Harris, J.E.; Iacocca, M.V.; Roche, E.; Yang, X.; Chang, J.; Simkins, S.; Xu, L. Immunohistochemical analyses of focal adhesion kinase expression in benign and malignant human breast and colon tissues: Correlation with preinvasive and invasive phenotypes. Clin. Cancer Res. 2000, 6, 2417–2423. [Google Scholar]
- Kessler, B.E.; Sharma, V.; Zhou, Q.; Jing, X.; Pike, L.A.; Kerege, A.A.; Sams, S.B.; Schweppe, R.E. FAK Expression, Not Kinase Activity, Is a Key Mediator of Thyroid Tumorigenesis and Protumorigenic Processes. Mol. Cancer Res. 2016, 14, 869–882. [Google Scholar] [CrossRef] [Green Version]
- Liao, X.; Lu, S.; Wu, Y.; Xu, W.; Zhuo, Y.; Peng, Q.; Li, B.; Zhang, L.; Wang, Y. The effect of differentiation induction on FAK and Src activity in live HMSCs visualized by FRET. PLoS ONE 2013, 8, e72233. [Google Scholar] [CrossRef] [Green Version]
- Zhang, J.X.; Tong, Z.T.; Yang, L.; Wang, F.; Chai, H.P.; Zhang, F.; Xie, M.R.; Zhang, A.L.; Wu, L.M.; Hong, H.; et al. PITX2: A promising predictive biomarker of patients’ prognosis and chemoradioresistance in esophageal squamous cell carcinoma. Int. J. Cancer 2013, 132, 2567–2577. [Google Scholar] [CrossRef]
- Huang, Y.; Guigon, C.J.; Fan, J.; Cheng, S.Y.; Zhu, G.Z. Pituitary homeobox 2 (PITX2) promotes thyroid carcinogenesis by activation of cyclin D2. Cell Cycle 2010, 9, 1333–1341. [Google Scholar] [CrossRef] [PubMed] [Green Version]
- Kim, A.Y.; Lim, B.; Choi, J.; Kim, J. The TFG-TEC oncoprotein induces transcriptional activation of the human β-enolase gene via chromatin modification of the promoter region. Mol. Carcinog. 2016, 55, 1411–1423. [Google Scholar] [CrossRef] [PubMed]
- Liu, W.; Li, Z.; Xu, W.; Wang, Q.; Yang, S. Humoral autoimmune response to IGF2 mRNA-binding protein (IMP2/p62) and its tissue-specific expression in colon cancer. Scand. J. Immunol. 2013, 77, 255–260. [Google Scholar] [CrossRef] [PubMed]
- Ye, S.; Song, W.; Xu, X.; Zhao, X.; Yang, L. IGF2BP2 promotes colorectal cancer cell proliferation and survival through interfering with RAF-1 degradation by miR-195. FEBS Lett. 2016, 590, 1641–1650. [Google Scholar] [CrossRef] [PubMed] [Green Version]
- Barghash, A.; Golob-Schwarzl, N.; Helms, V.; Haybaeck, J.; Kessler, S.M. Elevated expression of the IGF2 mRNA binding protein 2 (IGF2BP2/IMP2) is linked to short survival andmetastasis in esophageal adenocarcinoma. Oncotarget 2016, 7, 49743–49750. [Google Scholar] [CrossRef] [Green Version]
- Yachida, S.; Wood, L.D.; Suzuki, M.; Takai, E.; Totoki, Y.; Kato, M.; Luchini, C.; Arai, Y.; Nakamura, H.; Hama, N.; et al. Genomic Sequencing Identifies ELF3 as a Driver of Ampullary Carcinoma. Cancer Cell 2016, 29, 229–240. [Google Scholar] [CrossRef] [Green Version]
- Ding, Y.; Shimada, Y.; Gorrin-Rivas, M.J.; Itami, A.; Li, Z.; Hong, T.; Maeda, M.; Komoto, I.; Kawabe, A.; Kaganoi, J.; et al. Clinicopathological significance of human macrophage metalloelastase expression in esophageal squamous cell carcinoma. Oncology 2002, 63, 378–384. [Google Scholar] [CrossRef] [Green Version]
- Zheng, J.; Chu, D.; Wang, D.; Zhu, Y.; Zhang, X.; Ji, G.; Zhao, H.; Wu, G.; Du, J.; Zhao, Q. Matrix metalloproteinase-12 is associated with overall survival in Chinese patients with gastric cancer. J. Surg. Oncol. 2013, 107, 746–751. [Google Scholar] [CrossRef]
- Xu, J.E.C.; Yao, Y.; Ren, S.; Wang, G.; Jin, H. Matrix metalloproteinase expression and molecular interaction network analysis in gastric cancer. Oncol. Lett. 2016, 12, 2403–2408. [Google Scholar] [CrossRef]
- Zhu, Y.H.; Yang, F.; Zhang, S.S.; Zeng, T.T.; Xie, X.; Guan, X.Y. High expression of biglycan is associated with poor prognosis in patients with esophageal squamous cell carcinoma. Int. J. Clin. Exp. Pathol. 2013, 6, 2497–2505. [Google Scholar] [PubMed]
- Wang, B.; Li, G.X.; Zhang, S.G.; Wang, Q.; Wen, Y.G.; Tang, H.M.; Zhou, C.Z.; Xing, A.Y.; Fan, J.W.; Yan, D.W.; et al. Biglycan expression correlates with aggressiveness and poor prognosis of gastric cancer. Exp. Biol. Med. 2011, 236, 1247–1253. [Google Scholar] [CrossRef]
- Xing, X.; Gu, X.; Ma, T. Knockdown of biglycan expression by RNA interference inhibits the proliferation and invasion of, and induces apoptosis in, the HCT116 colon cancer cell line. Mol. Med. Rep. 2015, 12, 7538–7544. [Google Scholar] [CrossRef]
- Okayama, A.; Kimura, Y.; Miyagi, Y.; Oshima, T.; Oshita, F.; Ito, H.; Nakayama, H.; Nagashima, T.; Rino, Y.; Masuda, M.; et al. Relationship between phosphorylation of sperm-specific antigen and prognosis of lung adenocarcinoma. J. Proteom. 2016, 139, 60–66. [Google Scholar] [CrossRef] [PubMed]
- Hu, H.; Xia, S.H.; Li, A.D.; Xu, X.; Cai, Y.; Han, Y.L.; Wei, F.; Chen, B.S.; Huang, X.P.; Han, Y.S.; et al. Elevated expression of p63 protein in human esophageal squamous cell carcinomas. Int. J. Cancer 2002, 102, 580–583. [Google Scholar] [CrossRef] [PubMed]
- Song, Y.; Liu, D.; He, G. TKTL1 and p63 are biomarkers for the poor prognosis of gastric cancer patients. Cancer Biomark. 2015, 15, 591–597. [Google Scholar] [CrossRef] [PubMed]
- De Oliveira, D.H.; de Sousa Lopes, M.L.; de Santana Sarmento, D.J.; Queiroz, L.M.; da Costa Miguel, M.C.; da Silveira, E.J. Relationship between the epithelial expression of hMLH1, MDM2, and p63 and lower lip carcinogenesis. J. Oral Pathol. Med. 2014, 43, 357–363. [Google Scholar] [CrossRef] [PubMed]
- Schütz, M.; Steinigeweg, D.; Salehi, M.; Kömpe, K.; Schlücker, S. Hydrophilically stabilized gold nanostars as SERS labels for tissue imaging of the tumor suppressor p63 by immuno-SERS microscopy. Chem. Commun. 2011, 47, 4216–4218. [Google Scholar] [CrossRef] [PubMed]
- Urzúa-Traslaviña, C.G.; Leeuwenburgh, V.C.; Bhattacharya, A.; Loipfinger, S.; van Vugt, M.A.T.M.; de Vries, E.G.E.; Fehrmann, R.S.N. Improving gene function predictions using independent transcriptional components. Nat. Commun. 2021, 12, 1464. [Google Scholar] [CrossRef] [PubMed]


Publisher’s Note: MDPI stays neutral with regard to jurisdictional claims in published maps and institutional affiliations. |
© 2021 by the authors. Licensee MDPI, Basel, Switzerland. This article is an open access article distributed under the terms and conditions of the Creative Commons Attribution (CC BY) license (https://creativecommons.org/licenses/by/4.0/).
Share and Cite
Zhao, X.; Huang, Q.; Koller, M.; Linssen, M.D.; Hooghiemstra, W.T.R.; de Jongh, S.J.; van Vugt, M.A.T.M.; Fehrmann, R.S.N.; Li, E.; Nagengast, W.B. Identification and Validation of Esophageal Squamous Cell Carcinoma Targets for Fluorescence Molecular Endoscopy. Int. J. Mol. Sci. 2021, 22, 9270. https://doi.org/10.3390/ijms22179270
Zhao X, Huang Q, Koller M, Linssen MD, Hooghiemstra WTR, de Jongh SJ, van Vugt MATM, Fehrmann RSN, Li E, Nagengast WB. Identification and Validation of Esophageal Squamous Cell Carcinoma Targets for Fluorescence Molecular Endoscopy. International Journal of Molecular Sciences. 2021; 22(17):9270. https://doi.org/10.3390/ijms22179270
Chicago/Turabian StyleZhao, Xiaojuan, Qingfeng Huang, Marjory Koller, Matthijs D. Linssen, Wouter T. R. Hooghiemstra, Steven J. de Jongh, Marcel A. T. M. van Vugt, Rudolf S. N. Fehrmann, Enmin Li, and Wouter B. Nagengast. 2021. "Identification and Validation of Esophageal Squamous Cell Carcinoma Targets for Fluorescence Molecular Endoscopy" International Journal of Molecular Sciences 22, no. 17: 9270. https://doi.org/10.3390/ijms22179270