Article

Microtubule Dynamics Plays a Vital Role in Plant Adaptation and Tolerance to Salt Stress

1
Institute of Agriculture & Life Science, Gyeongsang National University, Jinju 52828, Korea
2
Plant Molecular Biology and Biotechnology Research Center, Gyeongsang National University, Jinju 52828, Korea
3
Division of Applied Life Science (BK21 Four), Gyeongsang National University, Jinju 52828, Korea
4
Central Instrument Facility, Gyeongsang National University, Jinju 52828, Korea
5
Department of Plant Bioscience, Life and Industry Convergence Research Institute, Pusan National University, Miryang 50463, Korea
6
Department of Biomedical Science & Engineering, Konkuk University, Seoul 05029, Korea
*
Author to whom correspondence should be addressed.
These authors contributed equally to this study.
Int. J. Mol. Sci. 2021, 22(11), 5957; https://doi.org/10.3390/ijms22115957
Submission received: 6 May 2021 / Revised: 27 May 2021 / Accepted: 27 May 2021 / Published: 31 May 2021

Abstract

:
Although recent studies suggest that the plant cytoskeleton is associated with plant stress responses, such as salt, cold, and drought, the molecular mechanism underlying microtubule function in plant salt stress response remains unclear. We performed a comparative proteomic analysis between control suspension-cultured cells (A0) and salt-adapted cells (A120) established from Arabidopsis root callus to investigate plant adaptation mechanisms to long-term salt stress. We identified 50 differentially expressed proteins (45 up- and 5 down-regulated proteins) in A120 cells compared with A0 cells. Gene ontology enrichment and protein network analyses indicated that differentially expressed proteins in A120 cells were strongly associated with cell structure-associated clusters, including cytoskeleton and cell wall biogenesis. Gene expression analysis revealed that expressions of cytoskeleton-related genes, such as FBA8, TUB3, TUB4, TUB7, TUB9, and ACT7, and a cell wall biogenesis-related gene, CCoAOMT1, were induced in salt-adapted A120 cells. Moreover, the loss-of-function mutant of Arabidopsis TUB9 gene, tub9, showed a hypersensitive phenotype to salt stress. Consistent overexpression of Arabidopsis TUB9 gene in rice transgenic plants enhanced tolerance to salt stress. Our results suggest that microtubules play crucial roles in plant adaptation and tolerance to salt stress. The modulation of microtubule-related gene expression can be an effective strategy for developing salt-tolerant crops.

1. Introduction

Plant adaptation to environmental stress is regulated by cascades of molecular networks, including stress perception, signal transduction, metabolic adjustment, and the regulation of stress-responsive gene expressions, to reestablish cellular homeostasis, such as osmotic and ionic homeostasis, and protect proteins and cell membranes by using heat shock proteins (Hsps), chaperones, late embryogenesis abundant (LEA) proteins, osmoprotectants, and free-radical scavengers [1]. Plant cells have adapted to salt stress by changing cell wall composition [2,3]. Extensin, a significant cell wall glycoprotein, is cross-linked with phenolics by reactive oxygen species (ROS) accumulation to stiffen the cell wall when plant cells are exposed to salt stress [2]. The RhEXP4, expansin A4 of rose, overexpressing Arabidopsis plants show increased seed germination, root growth, and several lateral roots under salt stress conditions [4]. A higher pectin content in root tips enhances plant tolerance to salt stress by increasing root growth compared with the cell wall composition in two soybean cultivars [5]. The dysfunction of Arabidopsis AtCSLD5, a pectin biosynthesis enzyme in sos6 (salt overly sensitive 6) mutant, enhances plant sensitivity to salt stress [6]. The Arabidopsis CC1 and CC2 proteins, along with cellulose synthases, interact with microtubules (MTs) and are essential for seedling growth under salt stress conditions [7]. However, the molecular mechanisms of changing cell wall dynamics by salt stress, including signal transduction and cell wall integrity pathways, remain unclear.
The plant cytoskeleton comprises the systemic polymers between actin filaments and MTs [8,9]. MTs form heterodimers by polymerization between α-tubulin and β-tubulin [10]; also, actin filaments polymerize to form filamentous structures by G-actin [11]. The adaptive mechanisms of the plant cytoskeleton to salt stress are varied by organization, dynamics, and cellular processes [12,13]. MTs play essential roles in the cell cycle, cell growth, and stress response by forming highly dynamic polymers [14,15]. Additionally, MT depolymerization and reorganization are essential for enhancing plant tolerance to salt stress [16]. In plants, response to salt stress, calcium ions, abscisic acid (ABA), and ROS as signaling molecules are associated with cortical MT array organization [17,18,19]. Cytosolic-increased calcium induces MT depolymerization by regulating calcium channels in the salt stress response [18]. The plant hormone, ABA, influences the organization and stability of cortical MTs [18]. ABA promotes the ectopic derivative of root cells by depolymerizing and reorganizing cortical MTs and activating MT depolymerization in guard cells during stomatal closure [20,21]. ROS induces the MTs’ reorganization through MT disassembly and the formation of irregular MT polymers [19]. When ROS homeostasis is collapsed by salt stress, tubulin forms a modified structural state by assembling non-typical tubulin structures [22]. Propyzamide-hypersensitive 1 (PHS1), a mitogen-activated protein kinase phosphatase, phosphorylates α-tubulin and elevates MT depolymerization to salt stress [23]. When plants are exposed for a long period to salt stress, cortical MT reorganization is induced by the depolymerization and reassembly of MT networks [17]. The MT-associated proteins, 65-1 and MAP65-1, facilitate MT polymerization and bundling, enhance MT-stabilizing activity, and expedite cortical MT recovery by binding phosphatidic acid under salt stress conditions [24]. Although the role of MTs during plants’ responses to salt stress has been much studied, the mechanism of the actin cytoskeleton is less understood. The actin cytoskeleton leads to assembly and bundle formation in response to a short period of salt stress; however, long-term exposure to salt stress or exposure to high salt stress induces the disassembly of the actin cytoskeleton [25]. Salt stress regulates the cellular process of actin dynamics via the salt overly sensitive (SOS) pathway and calcium signaling [26]. The arp2 (actin-related protein 2) mutant showed a hypersensitive phenotype to salt stress by increasing mitochondria-dependent [Ca2+]cyt levels [27].
Salt stress affects the expression levels of MT-associated genes and proteins. The loss-of-function mutants of prefoldin subunits 3 (PFD3) and PFD5 showed a hypersensitive phenotype to salt stress by decreasing expression levels of α-tubulin and β-tubulin [28]. The 26S proteasome degrades MT-associated protein SPIRAL1 (SPR1)-stabilizing MT in response to salt stress [16]. Proteomics analyses reveal that the plant adaptation to salt stress is associated with complex networks of protein expression and post-translational modifications [29,30,31]. Functional profiling of various proteins by a comparative proteomic approach has made it possible to characterize essential proteins involved in salt tolerance in various plant species, including Thellungiella halophila [32], Halogetong lomeratus [33], Tangut Nitraria [34], canola [35], sesame [36], and rice [37]. Adaptation to salt stress is a congested process in the whole plant and cellular levels and needs to adjust the transcription of various genes that trigger protein profile change [38,39]. Thus, quantitative analysis of expressed proteins by proteomics is valuable for understanding the molecular mechanisms underlying plant adaptation and tolerance to salt stress.
Our previous metabolite profiling study using salt-adapted Arabidopsis callus suspension-cultured cells reveals that various cellular processes, including cell wall thickening, play essential roles in plant salt adaptation [40]. In this proteomics study, we revealed that major differentially expressed proteins (DEPs) identified from salt-adapted cells were functionally associated with cytoskeleton and cell wall biogenesis. Structural and morphological changes of plant cells mediated by cytoskeleton and cell wall biogenesis functions are vital for adaptation and tolerance to salt stress.

2. Results

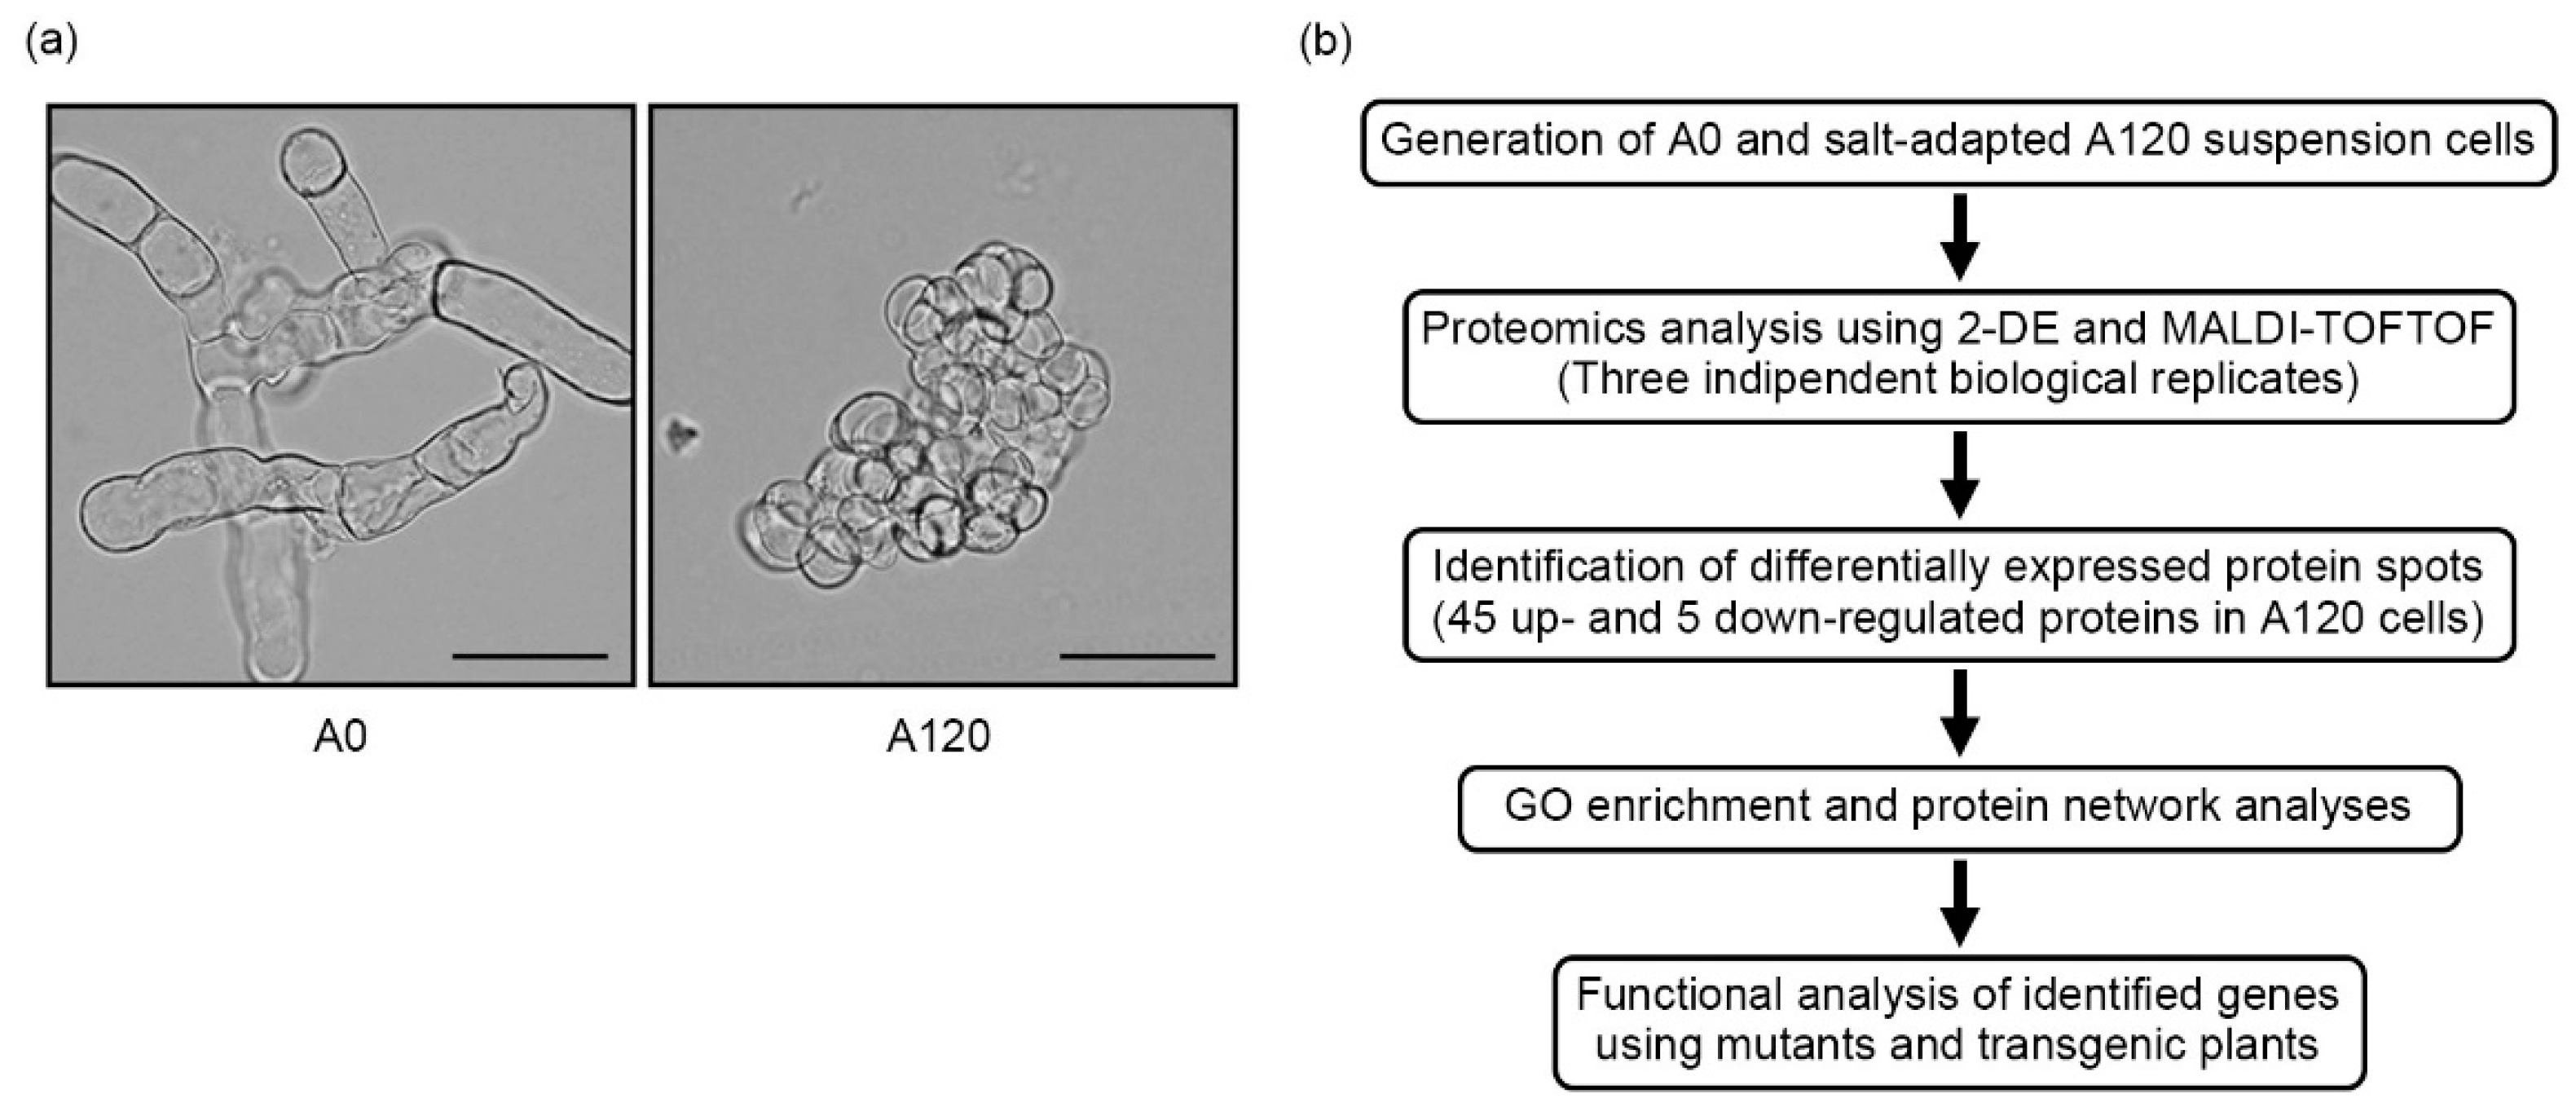
2.1. Morphological Features of Salt-Adapted Callus Suspension-Cultured Cells

Plants exhibit growth inhibition and impediment of tissue development in response to salt stress because of a deficit of cell wall extensibility [41]. When we compared morphologies between control cells (A0) and salt-adapted cells (A120; adapted to 120 mM NaCl), we observed that the A120 cells showed distinct morphological changes compared with A0 cells, including spherical or ellipsoidal and isodiametric shapes (Figure 1a). Additionally, newly divided A120 cells stuck together in small clumps. Vacuole size and the cytoplasmic volume in A120 cells were significantly reduced compared with those in A0 cells (Figure 1a). These data suggested that plant suspension cells have changed their morphology to adapt to long periods of salt stress. To understand the molecular mechanism underlying cell morphology changes during salt adaptation, we identified DEPs in salt-adapted A120 cells by proteomics analysis. Additionally, we characterized their biological functions by molecular genetic analysis using Arabidopsis mutants and transgenic rice plants (Figure 1b).

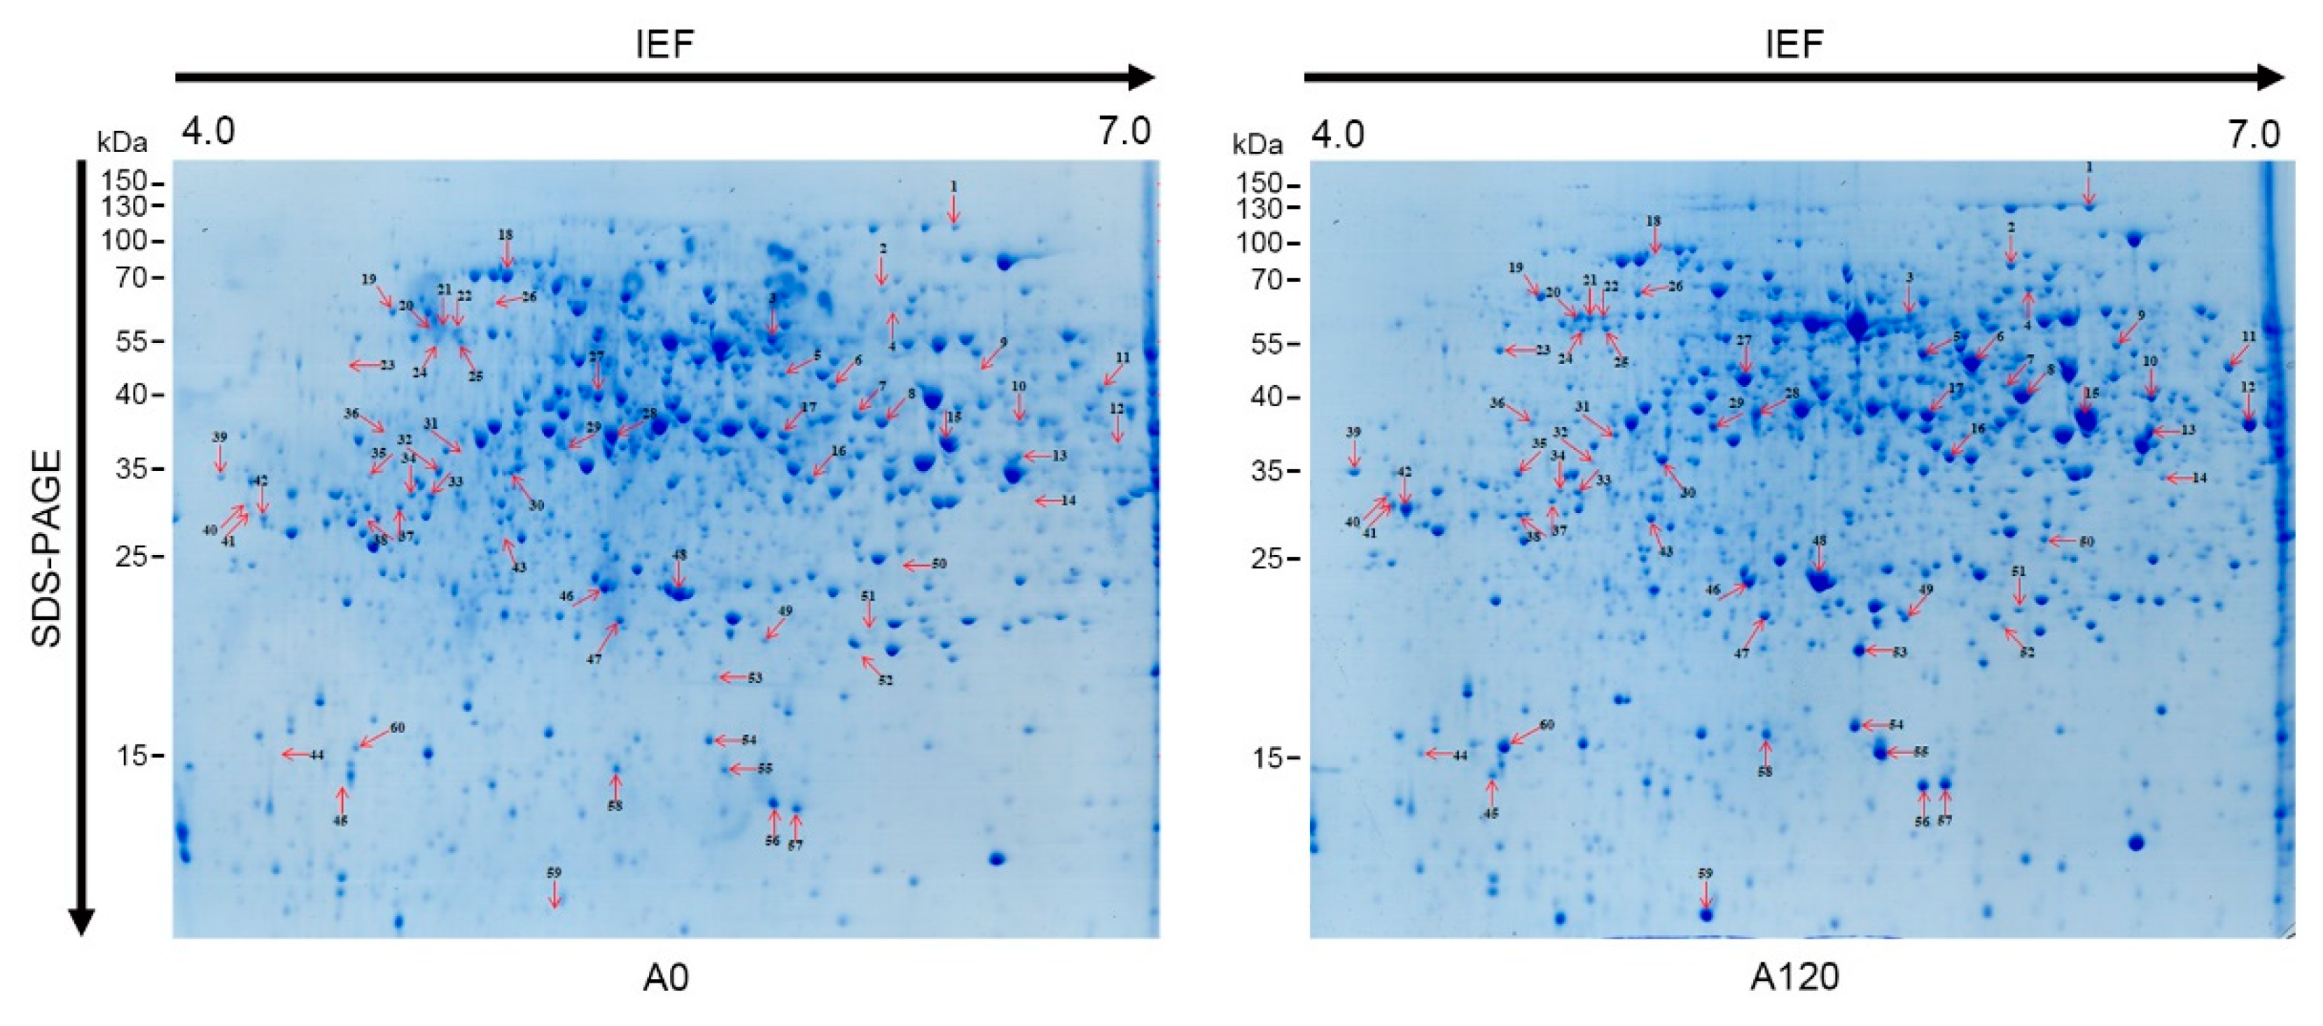
2.2. Overview of Proteomic Profiles in Salt-Adapted Cells

Crude proteins were extracted from A0 and A120 cells grown in normal media (for A0 cells) and saline media with 120 mM NaCl (for A120 cells) for 8 days after subculture using the trichloroacetic acid/acetone/phenol extraction protocol [42] and quantified using a 2D-Quant Kit (GE Healthcare, Waukesha, WI, USA). Representative two-dimensional gel electrophoresis (2-DE) images from three biological replicates of A0 and A120 cells are displayed in Figure 2. With a cut-off point as a p-value of <0.05 for the differential expression between A0 and A120 cells, 50 DEP spots were identified by matrix-assisted laser desorption/ionization time-of-flight mass spectrometry (MALDI-TOF/TOF MS) (Table 1). When comparing expression levels in A120 cells with those in A0 cells, we identified 45 induced spots and 5 reduced spots in A120 cells (Table 1). Fifty DEPs identified in A120 cells were classified into functional categories based on gene ontology (GO) analysis using the PANTHER program (http://pantherdb.org) (Figure 3). The DEPs were included in “binding” (42.6%), “catalytic activity” (42.6%), “structural molecule activity” (8.5%), and “translation regulator activity” (6.4%) categories in the molecular function (Figure 3a, red color). In the biological process, DEPs were included in five categories, which are “biological regulation” (1.9%), “cellular process” (55.6%), “localization” (1.9%), “metabolic process” (33.3%), and “response to stimulus” (7.4%) (Figure 3a, green color). The DEPs were included in “cellular, anatomical entity” (46.6%), “intracellular” (48.3%), and “protein-containing complex” (5.2%) categories in the cellular component (Figure 3a, black bar). In the analysis of protein class, the two largest proportions of DEPs belonged to the “metabolite interconversion enzyme” (41.5%) and “cytoskeletal protein” (14.6%) classes (Figure 3b). Above these, DEPs were included in “calcium binding protein” (4.9%), “chaperone” (12.2%), “gene-specific transcriptional regulator” (2.4%), “nucleic acid metabolism protein” (2.4%), “protein modifying enzyme” (7.3%), “protein-binding activity modulator” (2.4%), and “translational protein” (9.8%) classes (Figure 3b). In the analysis of pathway class, the largest proportion of DEPs belonged to the “cytoskeletal regulation by Rho GTPase” (30.8%) class (Figure 3c). Above these, DEPs were associated with “apoptosis signaling pathway” (7.7%), “cell cycle” (7.7%), “de novo purine biosynthesis” (7.7%), “fructose galactose metabolism” (7.7%), “glycolysis” (7.7%), “S-adenosylmethionine biosynthesis” (15.4%), “TCA cycle” (7.7%), and “ubiquitin-proteasome pathway” (7.7%) (Figure 3c). Thus, our results suggested that critical cellular changes during plant adaptation to salt stress were related to cytoskeletal regulation and metabolite processes.

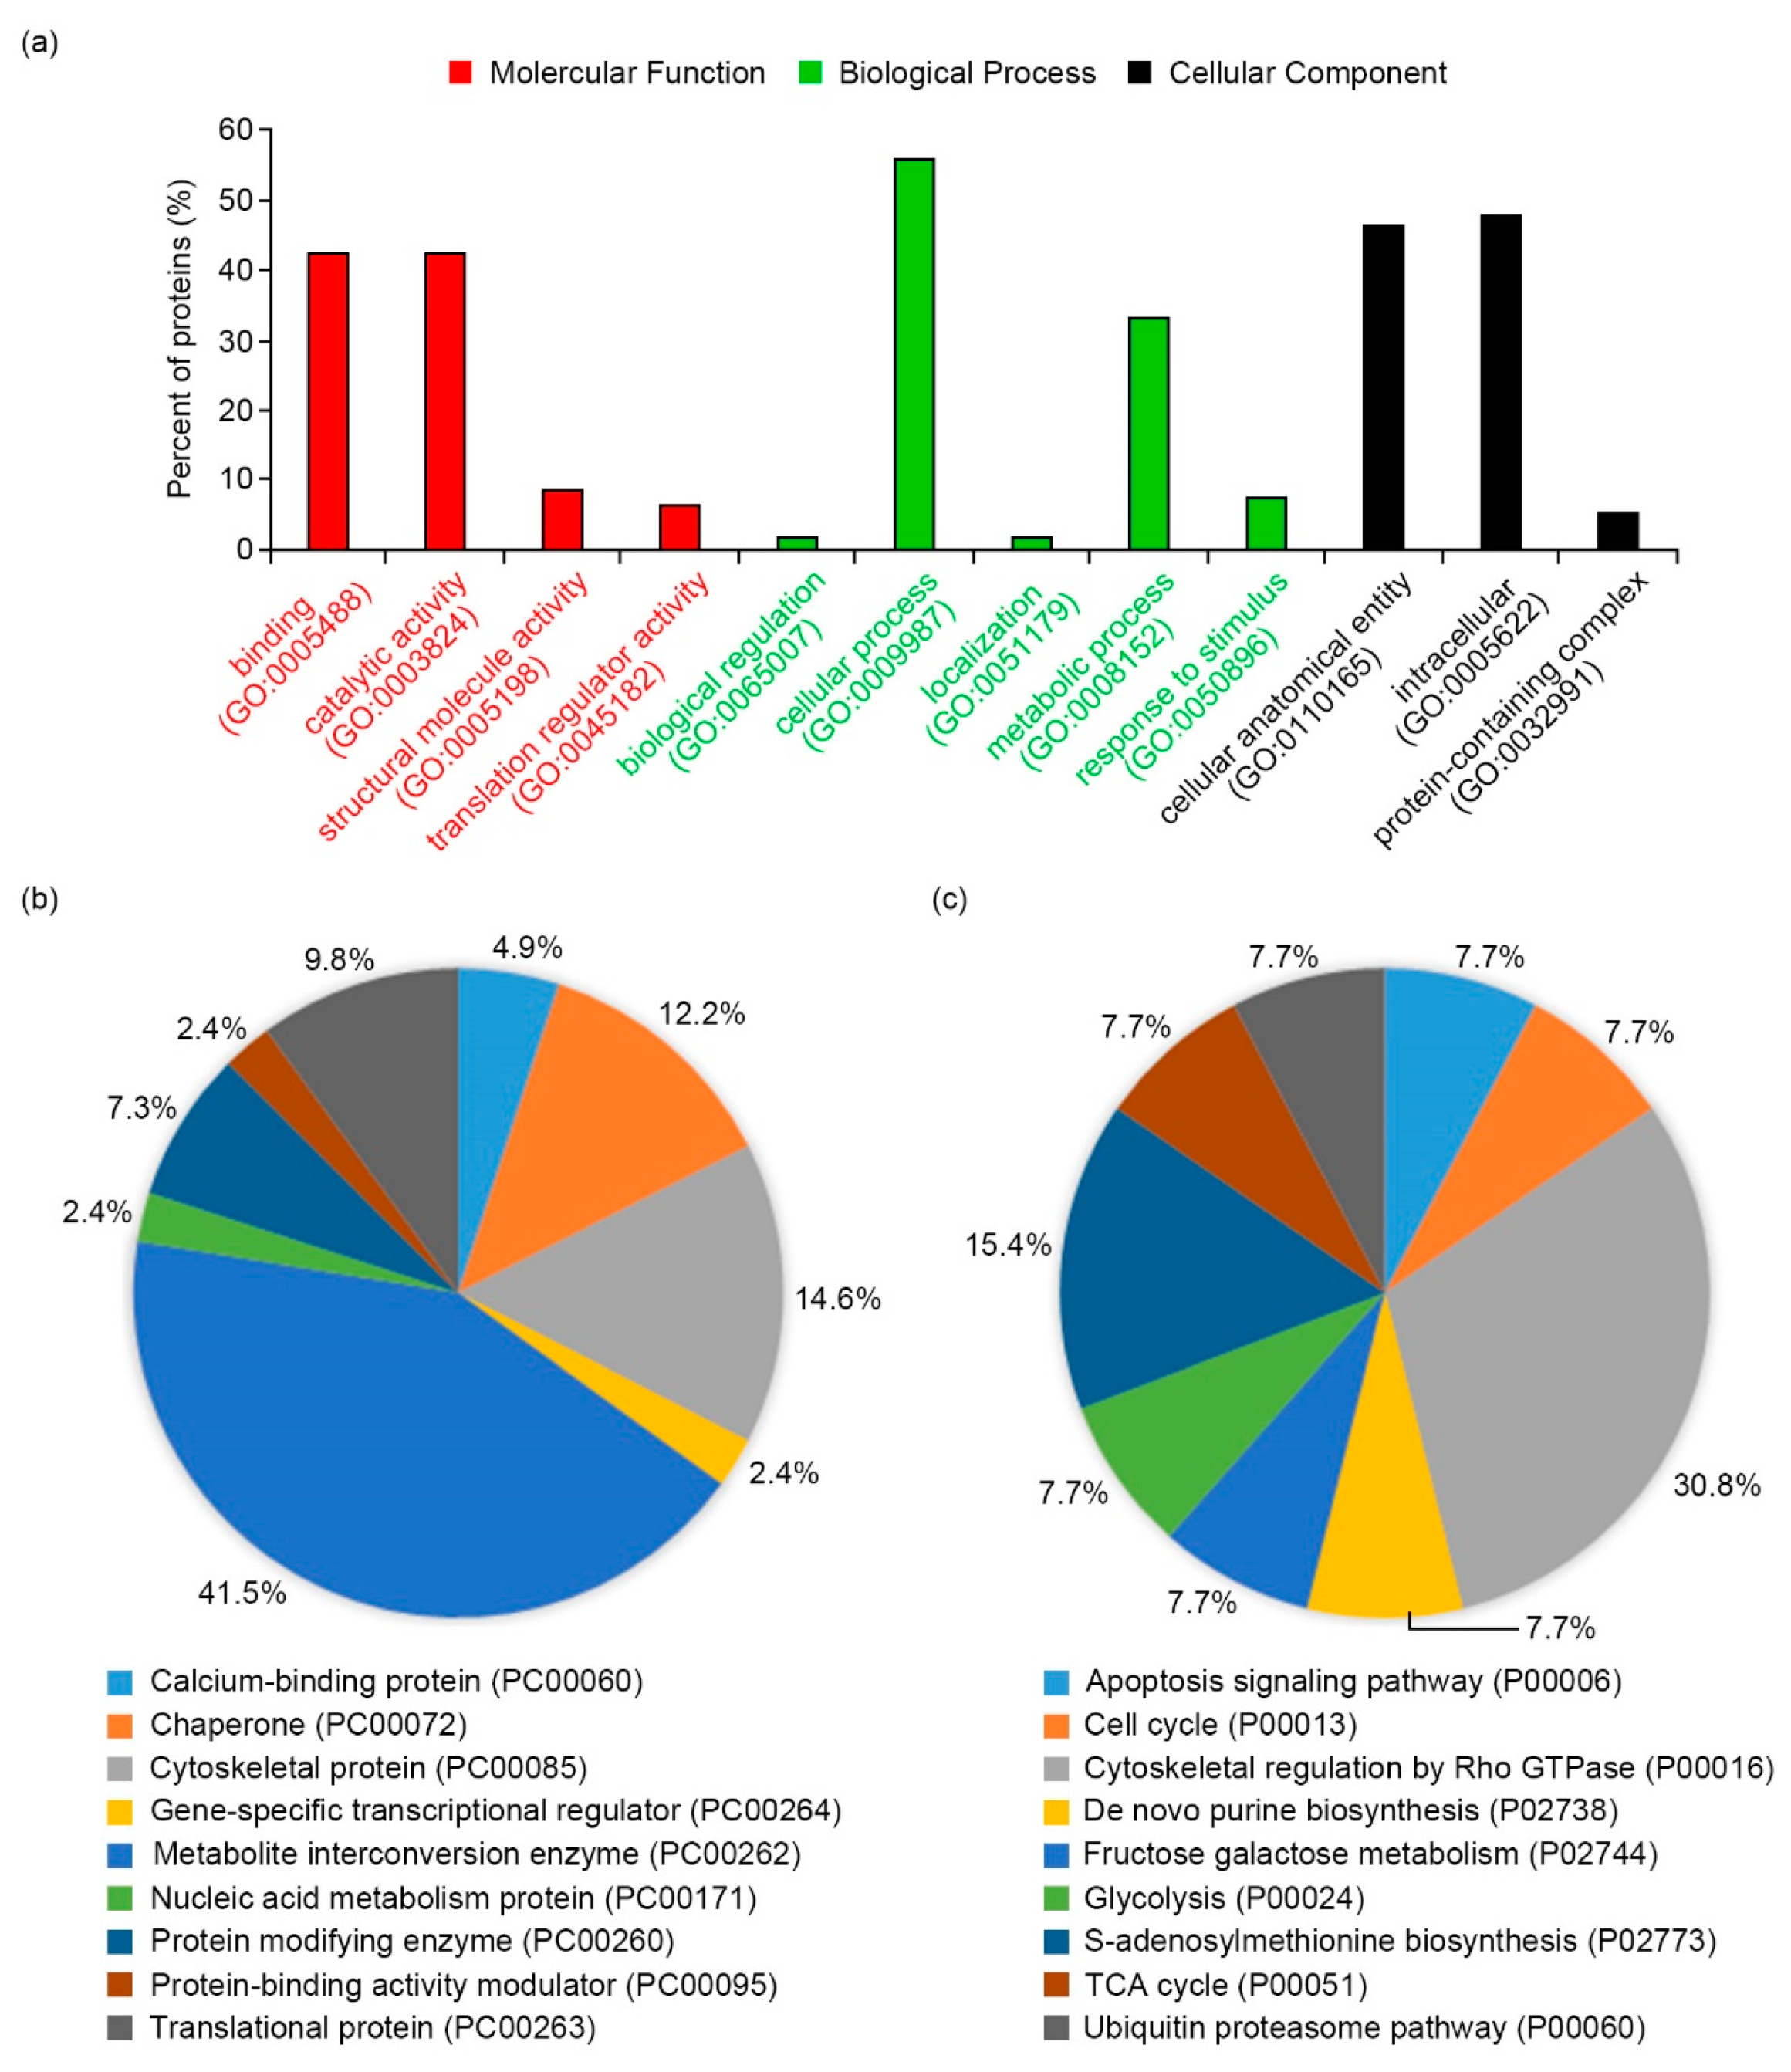
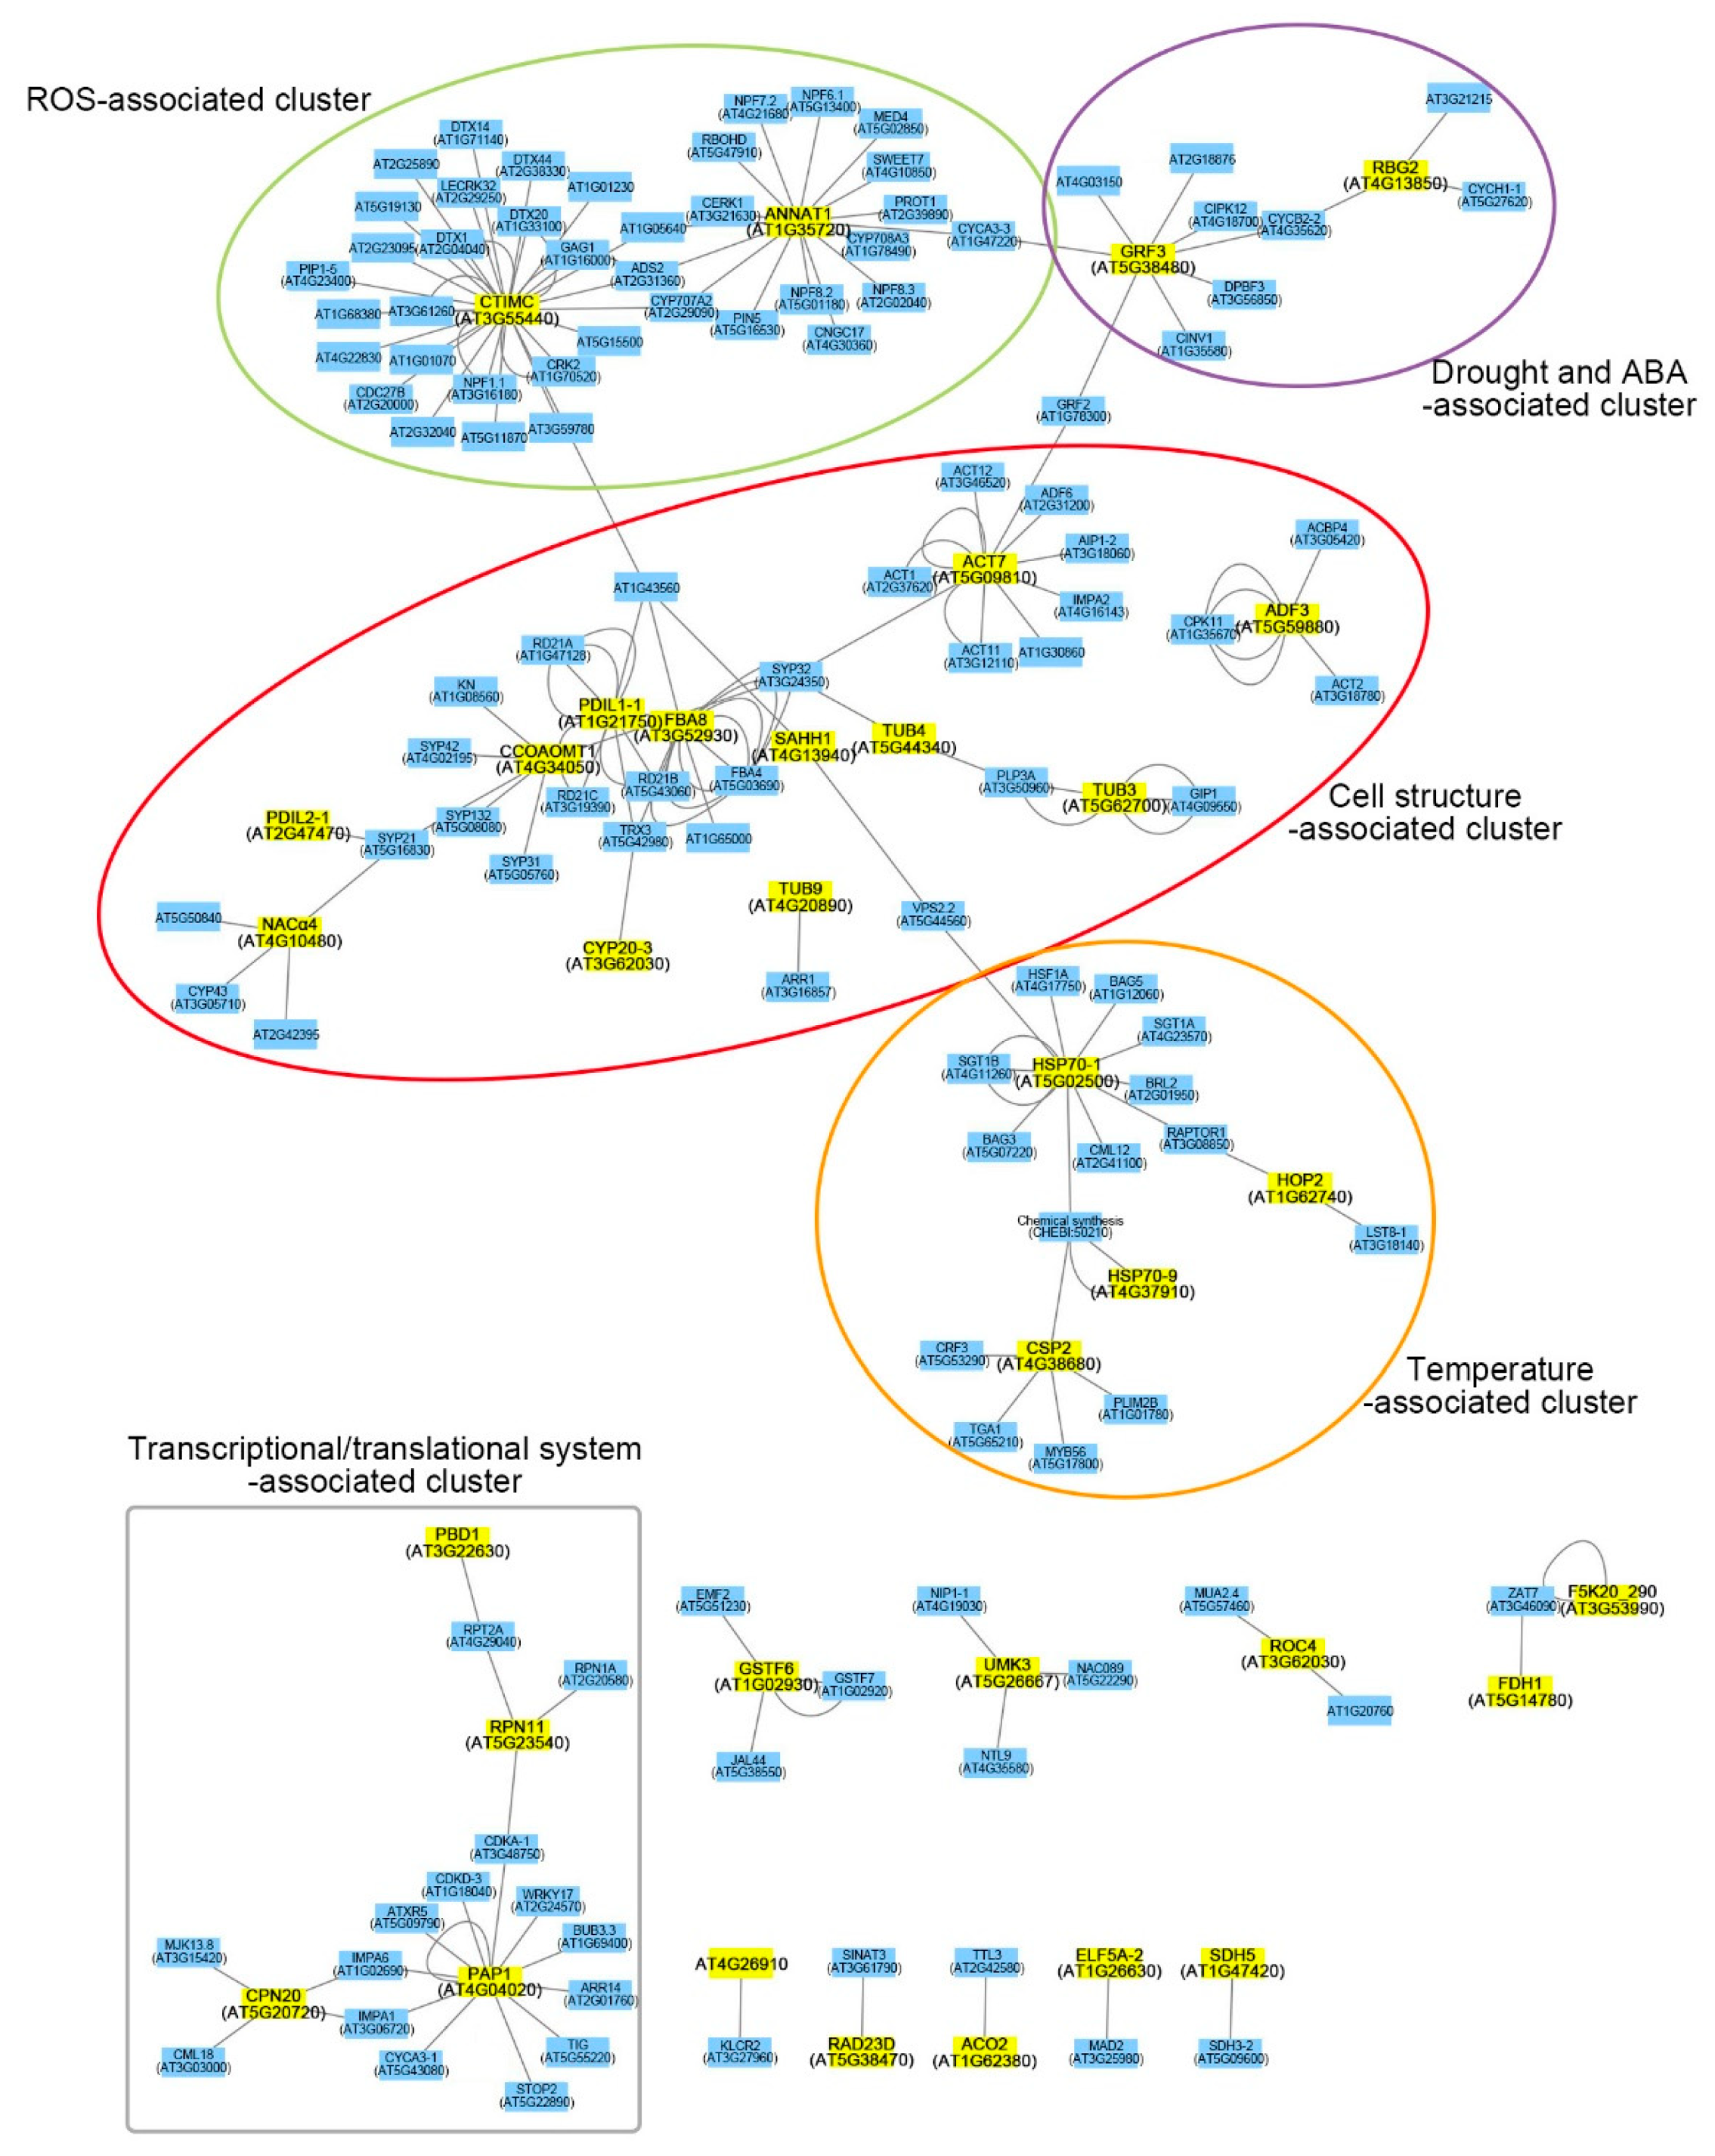
2.3. Functional Network Analysis of Differentially Expressed Proteins

To understand the biological functions and modes of action of 50 DEPs in plant salt adaptation, we analyzed putative physical interactions of DEPs using the Cytoscape software platform (https://cytoscape.org/) (accessed on 1 April 2021) and the IntAct database (https://www.ebi.ac.uk/intact/) (accessed on 1 April 2021) (Figure 4). The Cytoscape with large databases of protein–protein, protein–DNA, and genetic interactions is a powerful software for studying the prediction of a physical interaction network in model organisms [43]. Out of 50 DEPs, the physical interactions of 34 DEPs were identified from this analysis. The largest cluster was the “cell structure-associated cluster,” including 12 DEPs (red ellipse) in the functional network. The proteins in this cluster were mainly involved in the regulation of cell structures, including both cytoskeleton functions, such as actin filaments (ACT7, ADF3, and FBA8) and MTs (TUB3, TUB4, and TUB9), and secondary cell wall biogenesis (CCoAOMT1) (Figure 4). Even though TUB7 and PCAP1 proteins were highly induced in A120 cells (Table 1), they were not identified in functional network analysis. This is probably due to the lack of physical interaction information identified so far. PCAP1, also known as MT-destabilizing protein 25 (MDP25), functions as a negative regulator in hypocotyl cell elongation [44]. Additionally, other DEPs physically interacted with various functional proteins clustered in the ROS-associated cluster (CTIMC and ANNAT1; green ellipse), drought- and ABA-associated cluster (GRF3 and RBG2; purple ellipse), temperature-associated cluster (HSP70-1, HSP70-9, HOP2, and CSP2; orange ellipse), and transcriptional/translational system-associated cluster (PBD1, RPN11, PAP1, and CPN20; gray box) (Figure 4). The connectivity of protein interaction networks suggested that significant cellular and molecular changes in plant adaptation to salt stress might be associated with the plant cytoskeleton and cell wall biogenesis, affecting cell structure changes.

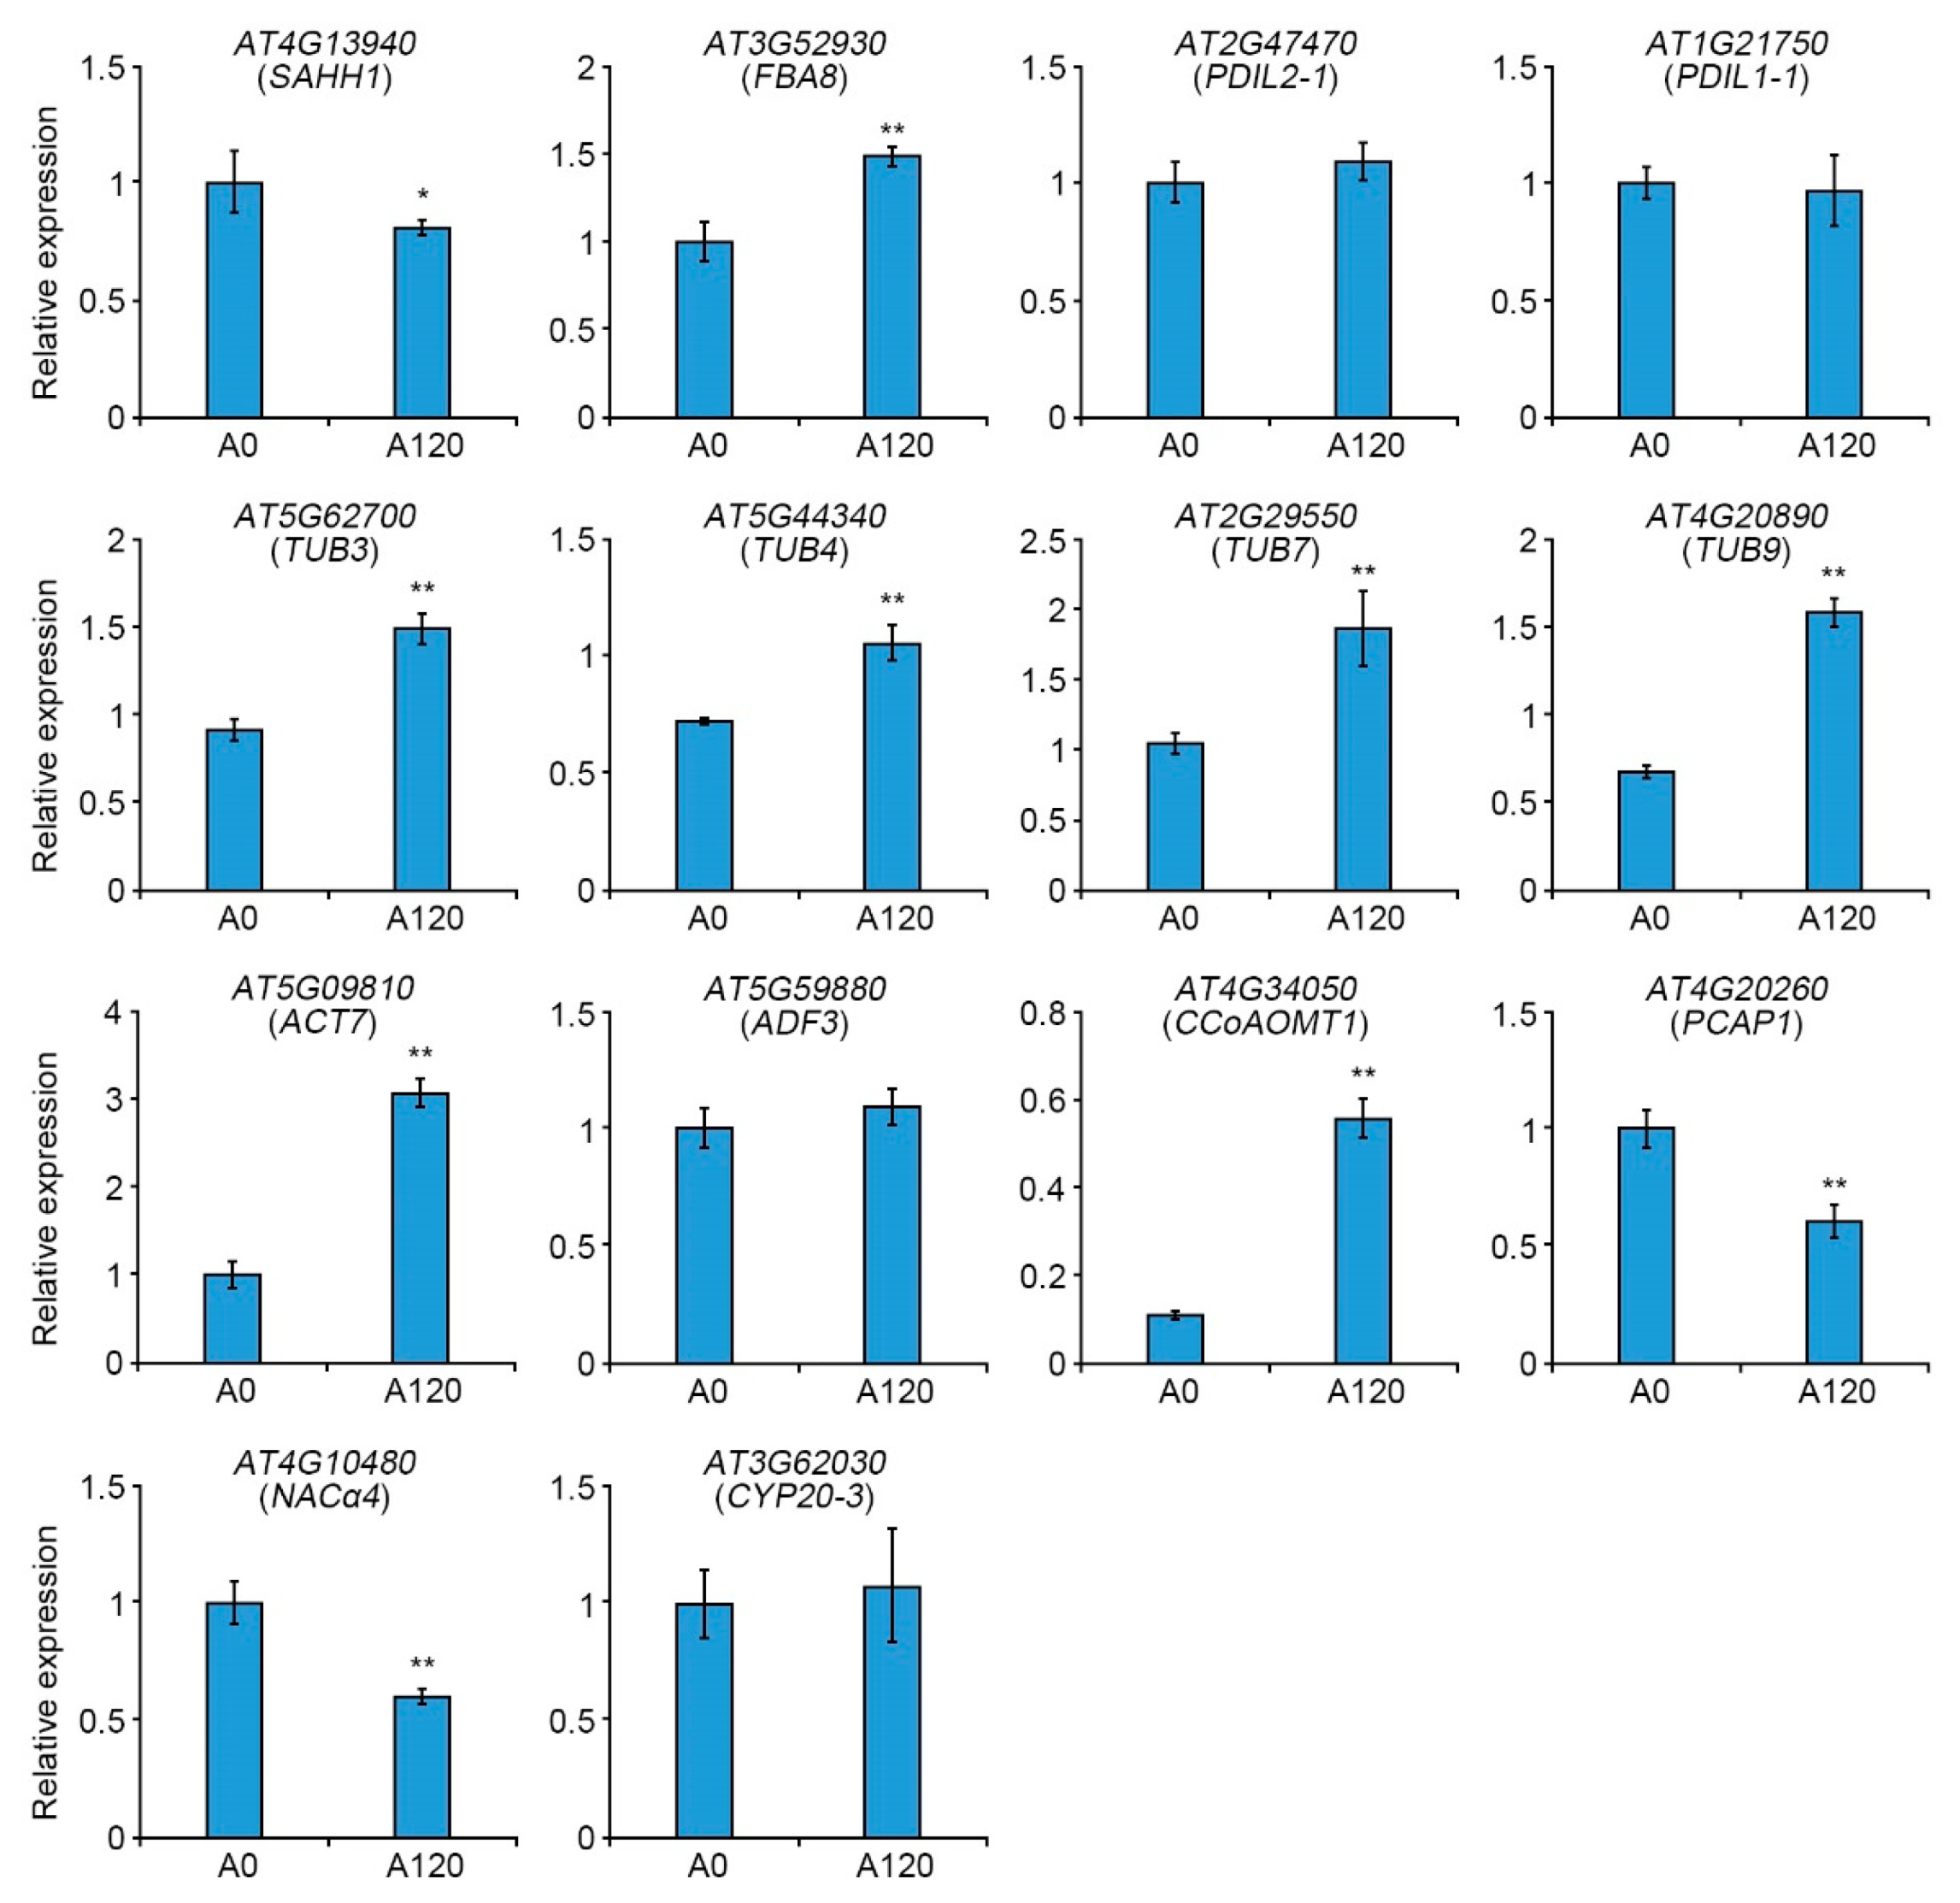
2.4. Expression Patterns of Cytoskeleton-Related Genes in Salt-Adapted Cells

To confirm the results of proteomics and bioinformatics analyses suggesting the crucial roles of cell structure-related proteins in plant salt adaptation (Table 1 and Figure 4), we tested the expressions of 12 genes encoding DEPs. This belonged to the cytoskeleton and cell wall biogenesis functions between A0 and A120 cells using quantitative real-time PCR (qRT-PCR). We also included two cytoskeleton-related genes, TUB7 and PCAP1, in the gene expression analysis.
The expression of cytoskeleton-related genes, including AT3G52930 (FBA8), AT5G62770 (TUB3), AT5G44340 (TUB4), AT2G29550 (TUB7), AT4G20890 (TUB9), and AT5G09810 (ACT7), and cell wall-related gene, AT4G34050 (CCoAOMT1), was significantly induced in A120 cells (Figure 5). However, the expression of other genes, such as AT4G13940 (SAHH1), AT4G20260 (PCAP1), and AT4G10480 (NACα4), in this cluster was decreased in A120 cells. Those of AT2G47470 (PDIL2-1), AT1G21750 (PDIL1-1), AT3G62030 (CYP20-3), and AT5G59880 (ADF3) were similar in A0 and A120 cells (Figure 5). Among 14 genes tested, FBA8, TUB3, TUB4, TUB7, TUB9, ACT7, and CCoAOMT1 were induced in mRNA (Figure 5) and protein levels (Table 1) in salt-adapted A120 cells. Although TUB7 was not identified in functional network analysis (Figure 4), its mRNA was more abundant in A120 cells (Figure 5). Since four TUB genes, TUB3, TUB4, TUB7, and TUB9, were induced in the protein and mRNA levels in A120 cells, MT-related proteins play essential roles in plant adaptation to salt stress.

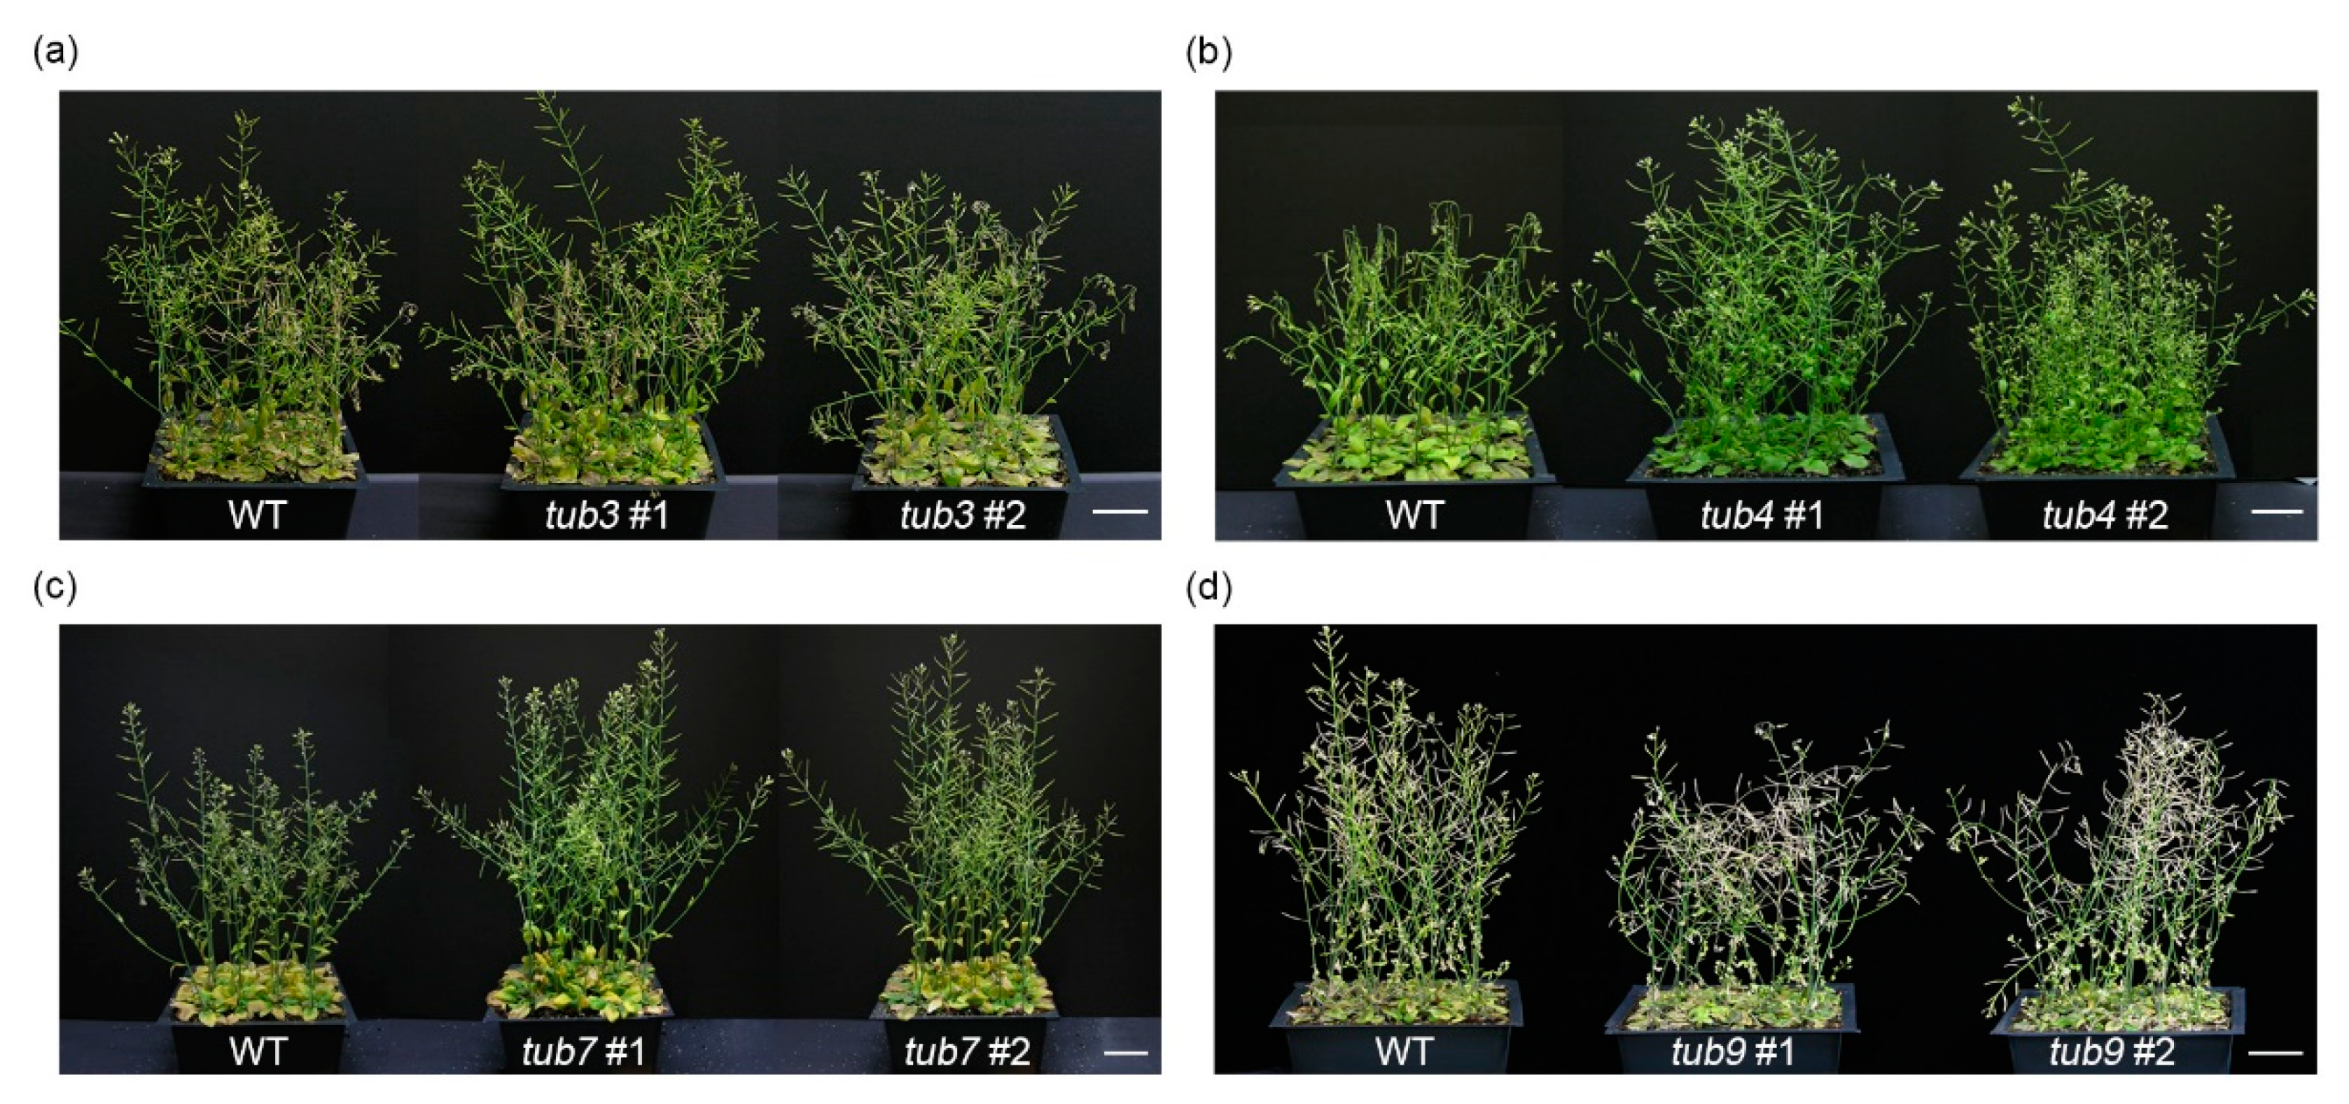
2.5. The Effect of the Loss-of-Function β-Tubulin Genes in Salt Stress Response

Recent evidence indicates that the regulation of MTs’ destabilization and reorganization is essential for plant adaptation to salt stress [17,45,46]. Furthermore, the largest protein family among the cell structure-associated cluster is related to the β-tubulin family proteins, including TUB3, TUB4, TUB7, and TUB9 (Table 1 and Figure 4). To characterize the physiological functions of β-tubulin in salt stress responses, we isolated T-DNA insertion mutants of Arabidopsis β-tubulin genes (tub3, SALK_073132; tub4, SALK_204506; tub7, SALK_026797; tub9, SALK_015876). Wild-type (WT, ecotype Col-0) and four tub mutant plants were grown on MS medium for 5 days and then transferred to the soil to test mutant phenotypes under salt stress conditions. After 9 days, we supplied water containing 130 mM NaCl to the soil once a week for 4 weeks. The tub4 mutants displayed strongly tolerant phenotypes, such as enhanced plant height and late wilting of leaves, to salt stress compared to WT plants (Figure 6b). In contrast, tub9 mutants were hypersensitive to salt stress with a quickly wilting phenotype compared with WT plants (Figure 6d). Furthermore, tub3 and tub7 mutants showed similar phenotypes, including plant height and wilting of leaves, to WT plants under salt stress conditions (Figure 6a,c). These results suggested that both TUB4 and TUB9 play significant roles in plant adaptation and tolerance to salt stress, but their mode of function differs.

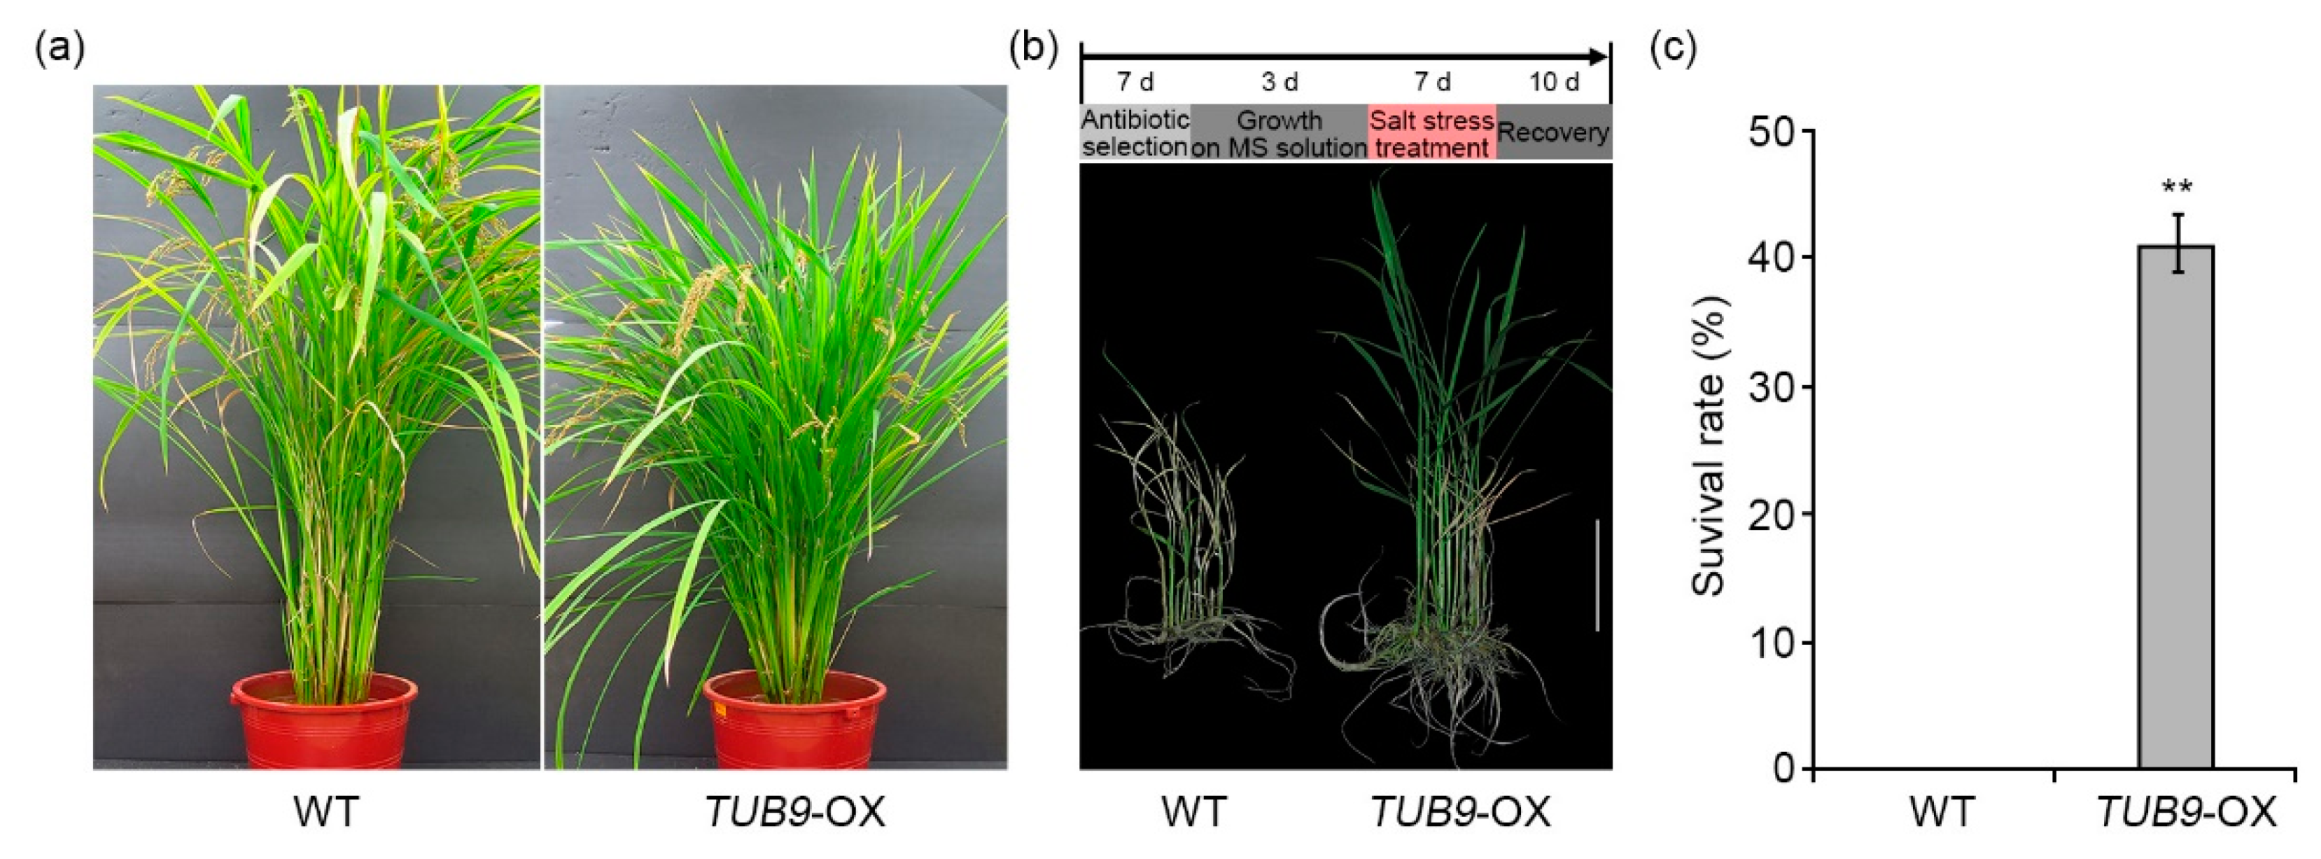
2.6. The Effect of TUB9 Overexpression in Rice during Salt Stress

The hypersensitive phenotype of Arabidopsis tub9 mutants to salt stress suggests that the overexpression of Arabidopsis TUB9 gene can enhance crop tolerance to salt stress. To confirm this, we generated transgenic rice plants overexpressing Arabidopsis TUB9 gene under the control of the CaMV 35S promoter (TUB9-OX). The Arabidopsis TUB9-OX construct was transformed into rice (“Ilmi” cultivar) embryogenic callus, and three independent TUB9-OX T1 lines were selected by hygromycin B resistance and RT-PCR analysis. Under normal conditions, TUB9-OX transgenic plants were shorter than WT plants (Figure 7a). Besides plant height, other morphological phenotypes of TUB9-OX transgenic plants were comparable with WT plants. Ten-day-old WT and TUB9-OX transgenic plant seedlings were transferred into MS liquid media containing 120 mM NaCl. After 7 days of salt treatment, salt-treated WT and TUB9-OX transgenic plants were recovered in liquid MS medium without NaCl for 10 days. The TUB9-OX transgenic plants had greener leaves and higher heights than WT plants (Figure 7b). The number of rice transgenic plants with green leaves in WT and TUB9-OX transgenic lines was counted in the recovery stage after salt treatment to calculate the survival rate. The survival rate of TUB9-OX transgenic plants was approximately 40%; however, most WT plants had no green leaves (Figure 7b,c). These results suggested that Arabidopsis TUB9 gene functions as a positive regulator in plant adaptation to salt stress and can enhance plant tolerance to salt stress.

3. Discussion

Salt stress disrupts cell division in leaves and roots through various cellular mechanisms, such as calcium ion, ROS, and ABA-dependent responses [47]. The changes in cellular morphology, such as cell proliferation and cell expansion, are essential for plant adaptation and tolerance to salt stress [47,48]. However, cellular and molecular mechanisms of morphological changes during salt adaptation have not been well elucidated. This study demonstrated that salt-adapted A120 cells showed morphological changes, such as spherical or ellipsoidal and isodiametric shapes, compared with control A0 cells (Figure 1a). Results of GO and network analysis using proteomics data showed that many DEPs identified from salt-adapted cells were associated with regulating cell structures, including cytoskeleton and cell wall biogenesis (Figure 3 and Figure 4). Moreover, our gene expression and molecular genetic analyses revealed that β-tubulin family proteins play positive and negative roles in plant adaptation and tolerance to salt stress (Figure 6 and Figure 7). Our results suggest that β-tubulin MTs are vital components in modulating plant adaptation and tolerance to salt stress.

3.1. Molecular Functions of Differentially Expressed Proteins in Salt-Adapted Cells

This study elucidated the molecular mechanisms underlying plant adaptation to prolonged salt stress by comparative proteomics between control and salt-adapted cells. The previous proteomics studies conducted using suspension cells demonstrated that molecular mechanisms of suspension cells in salt stress response are complicated but similar to those studied at the whole plant level [49,50]. Using proteomics, we identified 50 DEPs, including 45 up-regulated and 5 down-regulated proteins, in salt-adapted cells compared with control cells (Table 1). Functional network analysis revealed that the identified DEPs were included in various functional clusters, but many of them in cell structure-associated clusters, including cytoskeleton and cell wall biogenesis functions (Figure 4).

3.1.1. Cell Structure-Associated Cluster

The plant cell surface comprises the cell wall, plasma membrane, and cytoskeleton [41]. Plant cytoskeletons play essential functions in plant tolerance and survival to salt stress [17,18]. Many up-regulated proteins in A120 cells were MTs and actin filament-related proteins (Table 1 and Figure 4). The ACT7 (AT5G09810), ADF3 (AT5G59880), and FBA8 (AT3G52930) proteins were involved in the actin cytoskeleton. Actin cytoskeletons are composed of two classes, which are vegetative (ACT2, ACT7, and ACT8) and reproductive (ACT1, ACT3, ACT4, ACT11, and ACT12). ACT7 transcription is high in vegetative organs and induced by auxin [51]. The act11 mutant decreases pollen germination and increases pollen tube growth by increasing the actin turnover rate [52]. However, the loss-of-function ACT2 mutant vegetative class affects root hair growth but is not complemented by overexpressing ACT7, even if they are of the same classes [53]. Additionally, ACT7 physically interacts with ACT1, ACT11, ACT12, actin-depolymerizing factor 6 (ADF6), and actin-interacting protein 1-2 (AIP1-2) (Figure 4). ADF3 (actin-depolymerizing factor 3) depolymerizes F-actin and acts as a crucial regulator in plant defense response to biotic stress [54]. Abiotic stresses also regulate the protein and gene expression of ADFs. OsADF proteins in rice leaves are highly accumulated because of drought stress [55]. OsADF3 protein is induced by salt stress in two rice cultivars (Oryza sativa L. cv. Nipponbare and Oryza sativa L. cv. Tainung 67) [56,57]. FBA8, which encodes fructose-bisphosphate aldolase 8, is involved in actin polymerization and various abiotic stress responses, such as salt, drought, ABA, and temperature stresses [50,58]. MT dynamics, polymerization and depolymerization, are necessary for cellular processes of plant tolerance and adaptation to salt stress [17]. Our results revealed that TUB3, TUB4, TUB7, and TUB9 proteins, involved in MT depolymerization and reorganization, play vital roles in plant adaptation and tolerance to salt stress (Table 1 and Figure 4). It was also reported that TUA6 (α-chain tubulin 6) and TUB2 (β-chain tubulin 2) proteins are highly expressed in Arabidopsis roots in response to salt stress [59].
CCoAOMT1 (AT4G34050), encoding caffeoyl-coA o-methyltransferase 1, plays an essential role in lignin biosynthesis and salt stress response [60]. ccoaomt1 mutants showed a hypersensitive phenotype to salt and drought stresses [60,61]. SAHH1 (AT4G13940), encoding S-adenosyl-L-homocysteine hydrolase 1, is involved in the interaction between cytokinin and DNA methylation. Protein disulfide isomerase-like (PDIL) protein 1-1 (PDIL1-1, AT1G21750), which plays essential roles in ER trafficking, is associated with the response to salt stress. The loss-of-function mutant of PDIL2-1 (AT2G47470) disrupts pollen tube growth by delaying embryo development [62]. In addition, protein disulfide isomerase genes in maize are induced by abiotic stress, such as salt, drought, ABA, and H2O2 [63]. Cyclophilin CYP20-3 (ROC4, AT3G62030), which plays an important role in redox regulation, is involved in salt stress response [64]. CYP20-3 protein composes the sophisticated and reticular connective networks with FBA8, SAHH1, CCoAOMT1, PDIL1-1, and PDIL2-1 (Figure 4). However, nascent polypeptide-associated complex (NAC) alpha subunit family protein (NACα4 and AT4G10480) is involved in the cell structure-associated cluster (Figure 4). NACα4 function is not well known; however, the NAC complex plays a vital role in abiotic stress responses, such as drought and salt in barley [65].

3.1.2. ROS-Associated Cluster

Plants depend on cellular signaling and pathways via the reestablishment of ROS homeostasis in salt stress adaptation [66]. CTIMC (AT3G55440), which encodes triosephosphate isomerase (TPI), plays an essential role in redox regulation and is induced in response to salt stress by reactive carbonyl species (RCS). CTIMC protein forms a complex network in abiotic stress signaling through redox regulation by ROS-related proteins, including protein detoxification (DTX) proteins, L-type lectin receptor kinases 32 (LECRK32), plasma membrane intrinsic protein 1-5 (PIP1-5), nitrate transporter 1.1 (NPF1.1), cysteine-rich RLK 2 (CRK2), and acyl-lipid desaturase 2 (ADS2) (Figure 4). ANNAT1 (AT1G35720), annexin protein, has peroxidase activity and is involved in various abiotic stresses, such as salt, drought, and ABA. The annat1 mutant showed tolerance to salt and drought stress by regulating ABA and proline biosynthesis [67]. ANNAT1 protein forms a complex network in various signaling pathways by controlling ROS-related proteins, including NPF6.1, 7.2, 8.2, 8.3, ADS2, respiratory burst oxidase homolog D (RBOHD), LysM Receptor-Like Kinase1 (CERK1), PIN5, cyclic nucleotide-gated channels 17 (CNGC17), proline transporter 1 (PROT1), and sugar transporter 7 (SWEET7) (Figure 4).

3.1.3. Drought- and ABA-Associated Cluster

Growth regulating factor 3 (GRF3) influences plant tolerance to drought stress and organ growth by increasing leaf size. Glycine-rich RNA-binding protein 2 (RGB2/GRP2) affects seed germination in an ABA-independent manner under salt stress. GRF2 and RGB2 proteins are related to various plant stress-associated proteins, such as CBL-interacting protein kinases (CIPK12), cyclin-B 2-2 (CYCB2-2), ABA-responsive element-binding protein 3 (AREB3/DPBF3), cytosolic invertase 1 (CINV1), and cyclin-H 1-1 (CYCH1-1) (Figure 4).

3.1.4. Temperature-Associated Cluster

Heat shock 70 kDa protein 1 (HSP70-1), a key component in protein folding, plays a vital role in stomatal closure and seed germination and response to ABA stress. Mitochondrial HSP70-9 protein is involved in iron–sulfur protein biogenesis. Cold shock protein 2 (CRP2) protein plays different roles as a negative regulator in response to cold stress and as a positive regulator in salt stress response. Hsp70-Hsp90 organizing protein 2 (HOP2) influences plant adaptation to prolonged heat stress. These four proteins compose functional networks via physical interaction with chaperon regulators, including heat stress transcription factor A-1 (HSF1A), suppressor of G2 allele of skp1 (SGT1) homolog B (SGT1B), Bcl-2-associated athanogene 3 (BAG3) and 5 (BAG5), and cytokinin response factor 3 (CRF3) (Figure 4).

3.1.5. Transcriptional/Translational System-Associated Cluster

Proteasome subunit beta type 2-A (PBD1) and regulatory particle non-ATPase 11 (RPN11) play an important role in the plant ubiquitin–proteasome system via protein degradation and stabilization. Plastid-lipid-associated protein 1 (PAP1) contributes to the protection of photosystem II (PSII) and in response to ABA stress. Chloroplast co-chaperonin 20 (CPN20) acts as a negative regulator in ABA signaling. These four proteins compose functional networks via physical interaction with protein stability- or gene transcription-related proteins, including 26S proteasome regulatory subunit 4 homolog A (RPT2A), RPN1A, trithorax-related protein 5 (ATXR5), importin alpha isoform 6 (IMPA6), calmodulin-like protein 18 (CML18), sensitive to proton rhizotoxicity 2 (STOP2), authentic response regulator 14 (ARR14), budding uninhibited by benzymidazol 3.3 (BUB3.3), and WRKY17 (Figure 4).

3.2. The Role of Microtubules in Plant Adaptation and Tolerance to Salt Stress

MTs are fixed in the plasma membrane and composed of a greater part of plant interphase arrays [9,15]. The cortical MT arrays are involved in plant response to various abiotic stresses, especially salt stress [9,18]. Plants increase salt tolerance by regulating depolymerization and reorganization of the cortical MTs [48]. MAP65-1 acts as a positive regulator in plant salt tolerance by promoting cortical MT reorganization [68]. Calcium ions reorganize the damage of MT arrays in the salt stress response of plant cells [17]. The loss-of-function sos3, a calcium sensor in the salt stress response, mutant shows hypersensitivity to salt stress due to the irregular organization of MTs [26]. Plants with salt-susceptible phenotypes have a lower concentration of calcium ions than that of salt-tolerant plants [69]. Our proteomic analysis showed that the four β-tubulin family proteins, including TUB3, TUB4, TUB7, and TUB9, were induced in salt-adapted A120 cells compared with control A0 cells (Table 1 and Figure 4). Additionally, the mRNA levels of TUB3, TUB4, TUB7, and TUB9 genes were higher in A120 cells than in A0 cells (Figure 5). Our results suggest that the elevation of β-tubulin mRNAs and protein levels can affect MT functions and enhance plant adaptation to salt stress. In our molecular genetic analysis, the loss-of-function tub4 mutant showed enhanced tolerance to salt stress. In contrast, the tub9 mutant was more hypersensitive than WT plants (Figure 6). The overexpression of TUB9 in rice plants enhanced the plant’s tolerance to salt stress (Figure 7). Interestingly, tub4 and tub9 mutant plants showed opposite phenotypes in response to transiently applied salt stress, even though TUB4 and TUB9 protein levels were higher in cells that have adapted to salt stress for a long time. These results suggest that TUB4 and TUB9 proteins play different roles in plant responses to short-term and long-term salt stresses. It was also reported that short-term and long-term salt stress have different effects on the actin filament assembly and disassembly [25]. It would be worthwhile to dissect the biological functions of TUB4 and TUB9 in plant adaptation and tolerance to salt stress in further studies.
Altogether, our results suggest that β-tubulin proteins play different roles in plant adaptation and tolerance to salt stress by regulating MT depolymerization and reorganization. Therefore, changes in MT dynamics in plant cells would be essential for cellular processes to enhance the adaptation and tolerance to salt stress. Furthermore, morphological changes in salt-adapted suspension cells are at least partly due to the changes in MT dynamics.

4. Materials and Methods

4.1. Growth Conditions of Callus Suspension Cells

Salt-adapted callus suspension cells were generated from Arabidopsis thaliana (Col-0 ecotype) roots as described in detail in a previous study [40]. Callus suspension cells were maintained at 23 °C in the dark with gentle shaking (140 rpm).

4.2. Proteomic Profiling Using Two-Dimensional Gel Electrophoresis

Total protein was isolated from 5 g of A0 and salt-adapted cells (A120) using trichloroacetic acid/acetone/phenol extraction protocol described in detail in a previous study [42]. Total soluble proteins were quantified using the 2D-Quant Kit (Amersham Biosciences Europe GmbH, Freiburg, Germany). Two-dimensional gel electrophoresis was performed with Protean IEF cell (Bio-Rad, Hercules, CA, USA) for the first-dimensional isoelectric focusing using immobilized pH gradient strips (24 cm, pH 4–7; Bio-Rad Laboratories, Hercules, CA, USA), and with the Protean Xi-II Cell system (Bio-Rad Laboratories, Hercules, CA, USA) for the second-dimensional sodium dodecyl sulfate–polyacrylamide gel electrophoresis. After Coomassie brilliant blue staining, gel images were taken using a GS-800 Imaging Densitometer Scanner (Bio-Rad Laboratories, Hercules, CA, USA) and analyzed using PDQuest v.7.2.0 (Bio-Rad Laboratories, Hercules, CA, USA). All experiments were performed in three independent biological replicates, and the volume of each spot was detected and normalized to a relative density. Proteins showing a statistically significant difference (p < 0.05) between A0 and A120 cells were identified. For protein identification, differential protein spots visualized in the gel were excised and subjected to in-gel digestion as described previously [42]. Protein identification was performed by MALDI-TOF/TOF MS using the ABI 4800 Plus TOF-TOF Mass Spectrometer (Applied Biosystems, Framingham, MA, USA). Fifty proteins were identified, of which peptide and fragment mass tolerance was fixed at 100 ppm. The high confidence interval displayed statistically reliable search scores (more than 95% confidence) corresponding to protein’s experimental isoelectric point (pI) and molecular weight.

4.3. Bioinformatics Analysis

The functional classification of DEPs identified in proteomics was performed using the PANTHER classification system (http://www.pantherdb.org/) (accessed on 3 April 2021). We used network-based enrichment by Cytoscape software platform to forecast physical interactions of DEPs (https://cytoscape.org/) (accessed on 1 April 2021) using the IntAct database (https://www.ebi.ac.uk/intact/) (accessed on 1 April 2021).

4.4. Analysis of Quantitative Real Time PCR (qRT-PCR)

Total RNA was extracted from A0 and A120 cells using the RNeasy Plant Kit (Qiagen, Valencia, CA, USA) following the manufacturer’s protocol. To remove genomic DNA contaminants, extracted RNA was treated with DNaseI (Thermo Fisher Scientific, Waltham, MA, USA). One µg of total RNA was used the first strand of cDNA synthesis using a cDNA synthesis kit (Invitrogen, Carlsbad, CA, USA), according to the manufacturer’s protocol.
The qRT-PCR analysis was performed using the QuantiMix SYBR (PhileKorea, Seoul, Korea), and the relative values of indicated gene expression were automatically calculated using the CFX96 real-time PCR detection system (Bio-Rad Laboratories, Hercules, CA, USA) by applying normalization of the expression of UBQ10. The qRT-PCR was performed using the following conditions: 50 °C for 10 min, 95 °C for 10 min; followed by 50 cycles at 95 °C for 15 s, 60 °C for 15 s, and 72 °C for 15 s. The gene specific primers in qRT-PCR analysis are listed in Supplementary Table S1.

4.5. Plant Materials and Growth Conditions

Oryza sativa L. (“Ilmi” cultivar) and Arabidopsis thaliana (Col-0 ecotype) plants were used in all experiments. Rice plants were grown under natural light conditions in a greenhouse at 25–30 °C. The tub3 (SALK_073132), tub4 (SALK_204506), tub7 (SALK_026797), and tub9 (SALK_015876) mutants were obtained from Arabidopsis Biological Resource Center (https://www.arabidopsis.org/) (accessed on 24 February 2014). Arabidopsis plants were grown in a growth chamber in long-day conditions (16 h light/8 h dark) at 23 °C.

4.6. Generation of Transgenic Rice Plants

To generate the transgenic rice plants overexpressing the Arabidopsis TUB9 gene, we cloned the full-length cDNA (1335 bp) of the Arabidopsis TUB9 gene into pH2GW7 vector under the control of CaMV 35S promoter. The TUB9-OX construct was introduced into Agrobacterium tumefaciens (LBA4404) by electroporation. We used a modified version of the general rice-transformation protocol [70]. Transgenic TUB9-OX (T1) plants were selected on MS medium containing hygromycin B and then transferred to soil and allowed to self-pollinate.

4.7. Salt Stress Treatment

In Arabidopsis, 5-day-old WT seedlings, tub3, tub4, tub7, and tub9 plants grown on MS media were transferred to soil. After 9 days, we supplied water containing 130 mM NaCl to the soil once a week for 4 weeks. Photographs of each representative of 12–16 individual plants were taken to analyze plant phenotypes. In rice, 10-day-old WT seedlings and TUB9-OX plants germinated in MS media containing hygromycin B were transferred into MS liquid medium with 120 mM NaCl. After 7 days, plants were recovered in MS solution without NaCl for 10 days. Photographs were taken to represent 8–10 individual plants to analyze plant phenotypes.

4.8. Statistical Analyses

Statistical analyses, including Student’s t-test, were performed using Excel 2010. qRT-PCR analysis was performed in three independent biological replicates, and the average values of 2ΔΔCT were used to determine expression differences. Data were indicated as means ± standard deviation (SD). Error bars indicate SD.

5. Conclusions

This study suggests that the morphological changes of plant cells are an essential cellular process for adaptation to prolonged salt stress. We revealed that various protein families involved in various cellular processes play a role in salt adaptation response using proteomic analysis. Furthermore, gene expression and molecular genetic analyses demonstrated that β-tubulin proteins play an important role in plant adaptation and tolerance to salt stress. Altogether, our results suggest that the dynamics of depolymerization and reorganization of tubulin MTs play critical roles in plant adaptation to salt stress.

Supplementary Materials

The following are available online at https://www.mdpi.com/article/10.3390/ijms22115957/s1, Table S1: Primers used for qRT-PCR.

Author Contributions

H.J.C., D.B., B.J.J. and M.C.K. designed and performed the experiments, analyzed data, and wrote the manuscript. H.M.C., S.H.L., M.S.P., L.H.L., Y.J.C., D.-W.B. and S.T.K. performed experiments. D.-J.Y. and M.C.K. discussed and commented on results and revised the manuscript. All authors have read and agreed to the published version of the manuscript.

Funding

This research was supported by the Basic Science Research Program through the National Research Foundation of Korea (NRF) funded by the Ministry of Education (2015R1A6A1A03031413 (M.C.K.), 2020R1I1A1A01067256 (H.J.C.), and 2016R1D1A1B01011803 (D.B.)).

Institutional Review Board Statement

Not Applicable.

Informed Consent Statement

Not Applicable.

Data Availability Statement

The data presented in this study are available on request from the corresponding author.

Conflicts of Interest

The authors declare no conflict of interest.

References

  1. Vinocur, B.; Altman, A. Recent advances in engineering plant tolerance to abiotic stress: Achievements and limitations. Curr. Opin. Biotechnol. 2005, 16, 123–132. [Google Scholar] [CrossRef] [PubMed]
  2. Tenhaken, R. Cell wall remodeling under abiotic stress. Front. Plant Sci. 2015, 5, 771. [Google Scholar] [CrossRef] [Green Version]
  3. Zhu, J.-K. Abiotic Stress Signaling and Responses in Plants. Cell 2016, 167, 313–324. [Google Scholar] [CrossRef] [Green Version]
  4. Lü, P.; Kang, M.; Jiang, X.; Dai, F.; Gao, J.; Zhang, C. RhEXPA4, a rose expansin gene, modulates leaf growth and confers drought and salt tolerance to Arabidopsis. Planta 2013, 237, 1547–1559. [Google Scholar] [CrossRef] [PubMed]
  5. An, P.; Li, X.; Zheng, Y.; Matsuura, A.; Abe, J.; Eneji, A.E.; Tanimoto, E.; Inanaga, S. Effects of NaCl on Root Growth and Cell Wall Composition of Two Soya bean Cultivars with Contrasting Salt Tolerance. J. Agron. Crop. Sci. 2014, 200, 212–218. [Google Scholar] [CrossRef]
  6. Zhu, J.; Lee, B.-H.; Dellinger, M.; Cui, X.; Zhang, C.; Wu, S.; Nothnagel, E.A.; Zhu, J.-K. A cellulose synthase-like protein is required for osmotic stress tolerance in Arabidopsis. Plant J. 2010, 63, 128–140. [Google Scholar] [CrossRef] [Green Version]
  7. Endler, A.; Kesten, C.; Schneider, R.; Zhang, Y.; Ivakov, A.; Froehlich, A.; Funke, N.; Persson, S. A Mechanism for Sustained Cellulose Synthesis during Salt Stress. Cell 2015, 162, 1353–1364. [Google Scholar] [CrossRef] [Green Version]
  8. Henty-Ridilla, J.L.; Li, J.; Blanchoin, L.; Staiger, C.J. Actin dynamics in the cortical array of plant cells. Curr. Opin. Plant Biol. 2013, 16, 678–687. [Google Scholar] [CrossRef] [PubMed] [Green Version]
  9. Ehrhardt, D.W.; Shaw, S. Microtubule Dynamics and Organization in The Plant Cortical Array. Annu. Rev. Plant Biol. 2006, 57, 859–875. [Google Scholar] [CrossRef]
  10. Dixit, R.; Cyr, R. The Cortical Microtubule Array: From Dynamics to Organization. Plant Cell 2004, 16, 2546–2552. [Google Scholar] [CrossRef] [Green Version]
  11. Blanchoin, L.; Boujemaa-Paterski, R.; Henty, J.L.; Khurana, P.; Staiger, C.J. Actin dynamics in plant cells: A team effort from multiple proteins orchestrates this very fast-paced game. Curr. Opin. Plant Biol. 2010, 13, 714–723. [Google Scholar] [CrossRef]
  12. Li, J.; Staiger, C.J. Understanding Cytoskeletal Dynamics During the Plant Immune Response. Annu. Rev. Phytopathol. 2018, 56, 513–533. [Google Scholar] [CrossRef]
  13. Wang, X.; Mao, T. Understanding the functions and mechanisms of plant cytoskeleton in response to environmental signals. Curr. Opin. Plant Biol. 2019, 52, 86–96. [Google Scholar] [CrossRef]
  14. Smith, L.G.; Oppenheimer, D.G. Spatial Control of Cell Expansion by The Plant Cytoskeleton. Annu. Rev. Cell Dev. Biol. 2005, 21, 271–295. [Google Scholar] [CrossRef] [Green Version]
  15. Hashimoto, T.; Kato, T. Cortical control of plant microtubules. Curr. Opin. Plant Biol. 2006, 9, 5–11. [Google Scholar] [CrossRef] [PubMed]
  16. Wang, S.; Kurepa, J.; Hashimoto, T.; Smalle, J.A. Salt Stress–Induced Disassembly of Arabidopsis Cortical Microtubule Arrays Involves 26S Proteasome–Dependent Degradation of SPIRAL1. Plant Cell 2011, 23, 3412–3427. [Google Scholar] [CrossRef] [PubMed] [Green Version]
  17. Wang, C.; Li, J.; Yuan, M. Salt Tolerance Requires Cortical Microtubule Reorganization in Arabidopsis. Plant Cell Physiol. 2007, 48, 1534–1547. [Google Scholar] [CrossRef] [Green Version]
  18. Wang, C.; Zhang, L.-J.; Huang, R.-D. Cytoskeleton and plant salt stress tolerance. Plant Signal. Behav. 2011, 6, 29–31. [Google Scholar] [CrossRef] [PubMed] [Green Version]
  19. Livanos, P.; Galatis, B.; Quader, H.; Apostolakos, P. Disturbance of reactive oxygen species homeostasis induces atypical tubulin polymer formation and affects mitosis in root-tip cells of Triticum turgidum and Arabidopsis thaliana. Cytoskeleton 2012, 69, 1–21. [Google Scholar] [CrossRef] [PubMed]
  20. Jiang, Y.; Wu, K.; Lin, F.; Qu, Y.; Liu, X.; Zhang, Q. Phosphatidic acid integrates calcium signaling and microtubule dynamics into regulating ABA-induced stomatal closure in Arabidopsis. Planta 2013, 239, 565–575. [Google Scholar] [CrossRef]
  21. Takatani, S.; Hirayama, T.; Hashimoto, T.; Takahashi, T.; Motose, H. Abscisic acid induces ectopic outgrowth in epidermal cells through cortical microtubule reorganization in Arabidopsis thaliana. Sci. Rep. 2015, 5, 11364. [Google Scholar] [CrossRef] [Green Version]
  22. Bogoutdinova, L.R.; Lazareva, E.M.; Chaban, I.A.; Kononenko, N.V.; Dilovarova, T.; Khaliluev, M.R.; Kurenina, L.V.; Gulevich, A.A.; Smirnova, E.A.; Baranova, E.N. Salt Stress-Induced Structural Changes Are Mitigated in Transgenic Tomato Plants Over-Expressing Superoxide Dismutase. Biology 2020, 9, 297. [Google Scholar] [CrossRef]
  23. Fujita, S.; Pytela, J.; Hotta, T.; Kato, T.; Hamada, T.; Akamatsu, R.; Ishida, Y.; Kutsuna, N.; Hasezawa, S.; Nomura, Y.; et al. An Atypical Tubulin Kinase Mediates Stress-Induced Microtubule Depolymerization in Arabidopsis. Curr. Biol. 2013, 23, 1969–1978. [Google Scholar] [CrossRef] [Green Version]
  24. Zhang, Q.; Lin, F.; Mao, T.; Nie, J.; Yan, M.; Yuan, M.; Zhang, W. Phosphatidic Acid Regulates Microtubule Organization by Interacting with MAP65-1 in Response to Salt Stress in Arabidopsis. Plant Cell 2012, 24, 4555–4576. [Google Scholar] [CrossRef] [PubMed] [Green Version]
  25. Wang, C.; Zhang, L.; Yuan, M.; Ge, Y.; Liu, Y.; Fan, J.; Ruan, Y.; Cui, Z.; Tong, S.; Zhang, S. The microfilament cytoskeleton plays a vital role in salt and osmotic stress tolerance in Arabidopsis. Plant Biol. 2009, 12, 70–78. [Google Scholar] [CrossRef] [PubMed]
  26. Ye, J.; Zhang, W.; Guo, Y. Arabidopsis SOS3 plays an important role in salt tolerance by mediating calcium-dependent microfilament reorganization. Plant Cell Rep. 2013, 32, 139–148. [Google Scholar] [CrossRef] [PubMed]
  27. Zhao, Y.; Pan, Z.; Zhang, Y.; Qu, X.; Zhang, Y.; Yang, Y.; Jiang, X.; Huang, S.; Yuan, M.; Schumaker, K.S.; et al. The Actin-Related Protein2/3 Complex Regulates Mitochondrial-Associated Calcium Signaling during Salt Stress in Arabidopsis. Plant Cell 2013, 25, 4544–4559. [Google Scholar] [CrossRef] [PubMed] [Green Version]
  28. Rodríguez-Milla, M.A.; Salinas, J. Prefoldins 3 and 5 Play an Essential Role in Arabidopsis Tolerance to Salt Stress. Mol. Plant 2009, 2, 526–534. [Google Scholar] [CrossRef] [Green Version]
  29. Barkla, B.J.; Vera-Estrella, R.; Pantoja, O. Progress and challenges for abiotic stress proteomics of crop plants. Proteomics 2013, 13, 1801–1815. [Google Scholar] [CrossRef]
  30. Silveira, J.A.; Carvalho, F.E. Proteomics, photosynthesis and salt resistance in crops: An integrative view. J. Proteom. 2016, 143, 24–35. [Google Scholar] [CrossRef]
  31. Lv, X.; Chen, S.; Wang, Y. Advances in Understanding the Physiological and Molecular Responses of Sugar Beet to Salt Stress. Front. Plant Sci. 2019, 10, 1431. [Google Scholar] [CrossRef] [Green Version]
  32. Wang, X.; Chang, L.; Wang, B.; Wang, D.; Li, P.; Wang, L.; Yi, X.; Huang, Q.; Peng, M.; Guo, A. Comparative Proteomics of Thellungiella halophila Leaves from Plants Subjected to Salinity Reveals the Importance of Chloroplastic Starch and Soluble Sugars in Halophyte Salt Tolerance. Mol. Cell. Proteom. 2013, 12, 2174–2195. [Google Scholar] [CrossRef] [PubMed] [Green Version]
  33. Wang, J.; Meng, Y.; Li, B.; Ma, X.; Lai, Y.; Si, E.; Yang, K.; Xu, X.; Shang, X.; Wang, H.; et al. Physiological and proteomic analyses of salt stress response in the halophyte H alogeton glomeratus. Plant Cell Environ. 2015, 38, 655–669. [Google Scholar] [CrossRef] [PubMed] [Green Version]
  34. Cheng, T.; Chen, J.; Zhang, J.; Shi, S.; Zhou, Y.; Lu, L.; Wang, P.; Jiang, Z.; Yang, J.; Zhang, S.; et al. Physiological and proteomic analyses of leaves from the halophyte Tangut Nitraria reveals diverse response pathways critical for high salinity tolerance. Front. Plant Sci. 2015, 6, 30. [Google Scholar] [CrossRef] [PubMed] [Green Version]
  35. Shokri-Gharelo, R.; Noparvar, P.M. Molecular response of canola to salt stress: Insights on tolerance mechanisms. Peer J 2018, 6, e4822. [Google Scholar] [CrossRef]
  36. Zhang, Y.; Wei, M.; Liu, A.; Zhou, R.; Li, D.; Dossa, K.; Wang, L.; Zhang, Y.; Gong, H.; Zhang, X.; et al. Comparative proteomic analysis of two sesame genotypes with contrasting salinity tolerance in response to salt stress. J. Proteom. 2019, 201, 73–83. [Google Scholar] [CrossRef]
  37. Frukh, A.; Siddiqi, T.O.; Khan, M.I.R.; Ahmad, A. Modulation in growth, biochemical attributes and proteome profile of rice cultivars under salt stress. Plant Physiol. Biochem. 2020, 146, 55–70. [Google Scholar] [CrossRef]
  38. Parker, R.; Flowers, T.J.; Moore, A.L.; Harpham, N.V.J. An accurate and reproducible method for proteome profiling of the effects of salt stress in the rice leaf lamina. J. Exp. Bot. 2006, 57, 1109–1118. [Google Scholar] [CrossRef]
  39. Sobhanian, H.; Aghaei, K.; Komatsu, S. Changes in the plant proteome resulting from salt stress: Toward the creation of salt-tolerant crops? J. Proteom. 2011, 74, 1323–1337. [Google Scholar] [CrossRef]
  40. Chun, H.J.; Baek, D.; Cho, H.M.; Jung, H.S.; Jeong, M.S.; Jung, W.-H.; Choi, C.W.; Lee, S.H.; Jin, B.J.; Park, M.S.; et al. Metabolic Adjustment of Arabidopsis Root Suspension Cells During Adaptation to Salt Stress and Mitotic Stress Memory. Plant Cell Physiol. 2018, 60, 612–625. [Google Scholar] [CrossRef]
  41. Le Gall, H.; Philippe, F.; Domon, J.-M.; Gillet, F.; Pelloux, J.; Rayon, C. Cell Wall Metabolism in Response to Abiotic Stress. Plants 2015, 4, 112–166. [Google Scholar] [CrossRef]
  42. Kwon, Y.S.; Kim, S.G.; Chung, W.S.; Bae, H.; Jeong, S.W.; Shin, S.C.; Jeong, M.-J.; Park, S.-C.; Kwak, Y.-S.; Bae, D.-W.; et al. Proteomic analysis of Rhizoctonia solani AG-1 sclerotia maturation. Fungal Biol. 2014, 118, 433–443. [Google Scholar] [CrossRef]
  43. Shannon, P.; Markiel, A.; Ozier, O.; Baliga, N.S.; Wang, J.T.; Ramage, D.; Amin, N.; Schwikowski, B.; Ideker, T. Cytoscape: A Software Environment for Integrated Models of Biomolecular Interaction Networks. Genome Res. 2003, 13, 2498–2504. [Google Scholar] [CrossRef] [PubMed]
  44. Li, J.; Wang, X.; Qin, T.; Zhang, Y.; Liu, X.; Sun, J.; Zhou, Y.; Zhu, L.; Zhang, Z.; Yuan, M.; et al. MDP25, A Novel Calcium Regulatory Protein, Mediates Hypocotyl Cell Elongation by Destabilizing Cortical Microtubules in Arabidopsis. Plant Cell 2011, 23, 4411–4427. [Google Scholar] [CrossRef] [PubMed] [Green Version]
  45. Shoji, T.; Suzuki, K.; Abe, T.; Kaneko, Y.; Shi, H.; Zhu, J.-K.; Rus, A.; Hasegawa, P.M.; Hashimoto, T. Salt Stress Affects Cortical Microtubule Organization and Helical Growth in Arabidopsis. Plant Cell Physiol. 2006, 47, 1158–1168. [Google Scholar] [CrossRef] [PubMed]
  46. Yang, Y.; Guo, Y. Elucidating the molecular mechanisms mediating plant salt-stress responses. New Phytol. 2018, 217, 523–539. [Google Scholar] [CrossRef] [Green Version]
  47. Qi, F.; Zhang, F. Cell Cycle Regulation in the Plant Response to Stress. Front. Plant Sci. 2020, 10, 1765. [Google Scholar] [CrossRef] [PubMed] [Green Version]
  48. Ma, H.; Liu, M. The microtubule cytoskeleton acts as a sensor for stress response signaling in plants. Mol. Biol. Rep. 2019, 46, 5603–5608. [Google Scholar] [CrossRef]
  49. Liu, D.; Ford, K.L.; Roessner, U.; Natera, S.; Cassin, A.M.; Patterson, J.H.; Bacic, A. Rice suspension cultured cells are evaluated as a model system to study salt responsive networks in plants using a combined proteomic and metabolomic profiling approach. Proteomics 2013, 13, 2046–2062. [Google Scholar] [CrossRef]
  50. Wang, J.; Yao, L.; Li, B.; Meng, Y.; Ma, X.; Lai, Y.; Si, E.; Ren, P.; Yang, K.; Shang, X.; et al. Comparative Proteomic Analysis of Cultured Suspension Cells of the Halophyte Halogeton glomeratus by iTRAQ Provides Insights into Response Mechanisms to Salt Stress. Front. Plant Sci. 2016, 7, 110. [Google Scholar] [CrossRef] [PubMed] [Green Version]
  51. McDowell, J.M.; Huang, S.; McKinney, E.C.; An, Y.Q.; Meagher, R.B. Structure and evolution of the actin gene family in Ar-abidopsis thaliana. Genetics 1996, 142, 587–602. [Google Scholar] [CrossRef] [PubMed]
  52. Chang, M.; Huang, S. ArabidopsisACT11 modifies actin turnover to promote pollen germination and maintain the normal rate of tube growth. Plant J. 2015, 83, 515–527. [Google Scholar] [CrossRef]
  53. Kandasamy, M.K.; McKinney, E.C.; Meagher, R.B. A Single Vegetative Actin Isovariant Overexpressed under the Control of Multiple Regulatory Sequences Is Sufficient for Normal Arabidopsis Development. Plant Cell 2009, 21, 701–718. [Google Scholar] [CrossRef] [Green Version]
  54. Mondal, H.A.; Louis, J.; Archer, L.; Patel, M.; Nalam, V.J.; Sarowar, S.; Sivapalan, V.; Root, D.D.; Shah, J. Arabidopsis Actin-Depolymerizing Factor3 Is Required for Controlling Aphid Feeding from the Phloem. Plant Physiol. 2018, 176, 879–890. [Google Scholar] [CrossRef] [PubMed] [Green Version]
  55. Salekdeh, G.H.; Siopongco, J.; Wade, L.J.; Ghareyazie, B.; Bennett, J. Proteomic analysis of rice leaves during drought stress and recovery. Proteomics 2002, 2, 1131–1145. [Google Scholar] [CrossRef]
  56. Yan, S.; Tang, Z.; Su, W.; Sun, W. Proteomic analysis of salt stress-responsive proteins in rice root. Proteomics 2005, 5, 235–244. [Google Scholar] [CrossRef] [PubMed]
  57. Huang, Y.-C.; Huang, W.-L.; Hong, C.-Y.; Lur, H.-S.; Chang, M.-C. Comprehensive analysis of differentially expressed rice actin depolymerizing factor gene family and heterologous overexpression of OsADF3 confers Arabidopsis Thaliana drought tolerance. Rice 2012, 5, 33. [Google Scholar] [CrossRef] [PubMed] [Green Version]
  58. Lu, W.; Tang, X.; Huo, Y.; Xu, R.; Qi, S.; Huang, J.; Zheng, C.; Wu, C. Identification and characterization of fructose 1,6-bisphosphate aldolase genes in Arabidopsis reveal a gene family with diverse responses to abiotic stresses. Gene 2012, 503, 65–74. [Google Scholar] [CrossRef] [PubMed]
  59. Jiang, Y.-Q.; Yang, B.; Harris, N.S.; Deyholos, M.K. Comparative proteomic analysis of NaCl stress-responsive proteins in Arabidopsis roots. J. Exp. Bot. 2007, 58, 3591–3607. [Google Scholar] [CrossRef] [PubMed] [Green Version]
  60. Chun, H.J.; Baek, D.; Cho, H.M.; Lee, S.H.; Jin, B.J.; Yun, D.-J.; Hong, Y.-S.; Kim, M.C. Lignin biosynthesis genes play critical roles in the adaptation of Arabidopsis plants to high-salt stress. Plant Signal. Behav. 2019, 14, 1625697. [Google Scholar] [CrossRef]
  61. Chun, H.; Lim, L.; Cheong, M.; Baek, D.; Park, M.; Cho, H.; Lee, S.; Jin, B.; No, D.; Cha, Y.; et al. Arabidopsis CCoAOMT1 Plays a Role in Drought Stress Response via ROS- and ABA-Dependent Manners. Plants 2021, 10, 831. [Google Scholar] [CrossRef] [PubMed]
  62. Wang, H.; Boavida, L.C.; Ron, M.; McCormick, S. Truncation of a Protein Disulfide Isomerase, PDIL2-1, Delays Embryo Sac Maturation and Disrupts Pollen Tube Guidance in Arabidopsis thaliana. Plant Cell 2009, 20, 3300–3311. [Google Scholar] [CrossRef] [PubMed] [Green Version]
  63. Zhu, C.; Luo, N.; He, M.; Chen, G.; Zhu, J.; Yin, G.; Li, X.; Hu, Y.; Li, J.; Yan, Y. Molecular Characterization and Expression Profiling of the Protein Disulfide Isomerase Gene Family in Brachypodium distachyon L. PLoS ONE 2014, 9, e94704. [Google Scholar] [CrossRef]
  64. Dominguez-Solis, J.R.; He, Z.; Lima, A.; Ting, J.; Buchanan, B.B.; Luan, S. A cyclophilin links redox and light signals to cysteine biosynthesis and stress responses in chloroplasts. Proc. Natl. Acad. Sci. USA 2008, 105, 16386–16391. [Google Scholar] [CrossRef] [Green Version]
  65. Maršálová, L.; Vítámvás, P.; Hynek, R.; Prášil, I.T.; Kosová, K. Proteomic Response of Hordeum vulgare cv. Tadmor and Hordeum marinum to Salinity Stress: Similarities and Differences between a Glycophyte and a Halophyte. Front. Plant Sci. 2016, 7, 1154. [Google Scholar] [CrossRef]
  66. Yang, Y.; Guo, Y. Unraveling salt stress signaling in plants. J. Integr. Plant Biol. 2018, 60, 796–804. [Google Scholar] [CrossRef] [Green Version]
  67. Huh, S.M.; Noh, E.K.; Kim, H.G.; Jeon, B.W.; Bae, K.; Hu, H.-C.; Kwak, J.M.; Park, O.K. Arabidopsis Annexins AnnAt1 and AnnAt4 Interact with Each Other and Regulate Drought and Salt Stress Responses. Plant Cell Physiol. 2010, 51, 1499–1514. [Google Scholar] [CrossRef] [PubMed] [Green Version]
  68. Zhou, S.; Chen, Q.; Li, X.; Li, Y. MAP65-1 is required for the depolymerization and reorganization of cortical microtubules in the response to salt stress in Arabidopsis. Plant Sci. 2017, 264, 112–121. [Google Scholar] [CrossRef]
  69. Errabii, T.; Gandonou, C.B.; Essalmani, H.; Abrini, J.; Idaomar, M.; Senhaji, N.S. Effects of NaCl and mannitol induced stress on sugarcane (Saccharum sp.) callus cultures. Acta Physiol. Plant. 2007, 29, 95–102. [Google Scholar] [CrossRef]
  70. Hiei, Y.; Ohta, S.; Komari, T.; Kumashiro, T. Efficient transformation of rice (Oryza sativa L.) mediated by Agrobacterium and sequence analysis of the boundaries of the T-DNA. Plant J. 1994, 6, 271–282. [Google Scholar] [CrossRef] [Green Version]
Figure 1. Characterization of Arabidopsis salt-adapted cells. (a) The morphological phenotype of control suspension cells (A0) grown in normal MS medium and salt-adapted cells (A120) grown in high salt MS medium with 120 mM NaCl. The photograph was taken using a microscope after 2 weeks of subculture. Scale bars indicate 50 μm. (b) Experimental scheme of proteomic and functional analyses.
Ijms 22 05957 g001
Figure 2. Proteome analysis of control A0 and salt-adapted A120 cell lines. The 50 differentially expressed protein (DEP) spots (45 up- and 5 down-regulated in A120 cells) were identified by 2-DE and MALDI-TOF/TOF analyses.
Ijms 22 05957 g002
Figure 3. Functional classification of DEPs using the PANTHER database. (a) The bar chart of molecular function (red), biological process (green), and cellular components (black) represented is based on the PANTHER GO analysis. (b) Bar chart of the PANTHER protein classes in DEPs. (c) Bar chart of the PANTHER pathway classes in DEPs. The input percentage was calculated on the basis of the number of proteins mapped to the GO term divided by all protein numbers in the lists of DEPs (Arabidopsis thaliana IDs from the NCBI database).
Ijms 22 05957 g003
Figure 4. Interaction network analysis with DEPs by the Cytoscape software platform using IntAct molecular interaction database. Yellow squares indicate proteins of the input lists, whereas blue squares indicate proteins of physical interaction.
Ijms 22 05957 g004
Figure 5. Transcript levels of cell structure-related genes in control (A0) and salt-adapted (A120) cells. Total RNAs were extracted from the A0 and A120 cells. Transcript levels were determined by quantitative real-time PCR (qRT-PCR). UBQ10 was used as a quantitative control for qRT-PCR. Error bars represent the standard deviation (SD) of three independent replicates. Asterisks indicate significant differences in the A0 cells (* p-value < 0.5; **, p-value ≤ 0.01, Student’s t-test).
Ijms 22 05957 g005
Figure 6. Characterization of loss-of-function mutants of Arabidopsis β-tubulin genes in salt stress. The 2-week-old wild-type (WT), tub3 (a), tub4 (b), tub7 (c), and tub9 (d) mutants grown on soil were treated with 130 mM NaCl for four weeks. Photos show a representative of 12 to 16 individual test plants. Scale bars indicate 5 cm.
Ijms 22 05957 g006
Figure 7. Characterization of TUB9-overexpressing transgenic rice plants. (a) Comparison of plant growth in wild-type (WT, “Ilmi” cultivar) and TUB9-overexpressing transgenic rice plants (TUB9-OX). Photographs were taken at maturity (milky ripening) stages. (b) Comparison of plant tolerance in WT and TUB9-OX plants to salt stress. Ten-day-old seedlings were treated with 120 mM NaCl for 7 days. After NaCl treatment, plants were recovered in MS medium without NaCl. Scale bars indicate 5 cm. (c) Quantitative analysis of survival rate of WT and TUB9-OX plants after salt stress treatment. Error bars represent the standard deviation (SD) of three independent replicates of the same experiment. Asterisks represent significant differences in the WT (** p ≤ 0.01, Student’s t-test).
Ijms 22 05957 g007
Table 1. Identification of DEPs between control A0 and salt-adapted A120 Arabidopsis callus suspension-cultured cells.
Spot No. aLocus No.Protein NameTheo. Mr/pI bQueries Matched cScores dExpectFold
(A0 vs. A120)
1, 28AT1G56070LOS1Low expression of osmotically responsive genes 195.10/
5.89
315663.70 × 10−501.554
2AT1G62740HOP2Stress-inducible protein, putative67.63/
6.24
223491.90 × 10−282.538
3AT4G13940SAHH1S-adenosyl-L-homocysteine hydrolase 153.97/
5.66
275229.40 × 10−46−1.133
4AT1G51710UBP6Ubiquitin carboxyl-terminal hydrolase 654.00/
5.82
274673.00 × 10−402.473
5AT4G01850SAM-2S-adenosylmethionine synthase 243.63/
5.67
286163.70 × 10−551.932
6AT2G36880MAT3Methionine adenosyltransferase 342.93/
5.76
336991.90 × 10−631.249
7AT1G77120ADH1Alcohol dehydrogenase class-P41.84/
5.83
277982.40 × 10−73−1.614
8AT4G02930 GTP binding Elongation factor Tu family protein49.61/
6.25
3311001.50 × 10−1031.129
9AT3G51800CPRMetallopeptidase M24 family protein43.28/
6.36
172801.50 × 10−214.172
10AT5G14780FDH1Formate dehydrogenase, chloroplastic/mitochondrial42.67/
7.12
255601.50 × 10−492.048
11AT4G26910 Dihydrolipoamide succinyltransferase50.03/
9.21
131854.70 × 10−122.026
12, 50AT3G04120GAPC1Glyceraldehyde-3-phosphate dehydrogenase 1, cytosolic37.01/
6.62
3010401.50 × 10−974.510
13AT5G43330MDH2Lactate/malate dehydrogenase family protein35.98/
7.00
246754.70 * 10−611.407
14AT5G23540RPN1126S proteasome non-ATPase regulatory subunit 14 homolog34.39/
6.31
182411.20 × 10−175.121
15AT3G52930FBA8Fructose-bisphosphate aldolase 8, cytosolic38.86/
6.05
3110901.50 × 10−1021.031
16AT5G65020ANNAT2Annexin D2, calcium binding proteins36.36/
5.76
273391.9 × 10−271.426
17AT2G47470PDIL2-1Disulfide isomerase-like (PDIL) protein39.81/
5.80
205763.70 × 10−511.308
18AT5G02500HSP70-1Arabidopsis thaliana heat shock cognate protein 70-157.54/
5.01
348445.90 × 10−78−4.195
19AT1G21750PDIL1-1Disulfide isomerase-like (PDIL) protein55.85/
4.81
234573.00 × 10−391.466
20, 21AT5G62700TUB3Tubulin beta chain 351.27/
4.73
387782.40 × 10−713.032
22AT2G29550TUB7Tubulin beta-7 chain51.34/
4.74
366745.90 × 10−613.857
23AT5G38470RAD23DRad23 UV excision repair protein family40.10/
4.58
173829.40 * 10−322.453
24AT4G20890TUB9Tubulin beta-9 chain50.31/
4.69
387154.70 × 10−651.649
25AT5G44340TUB4Tubulin beta chain 450.36/
4.76
314901.50 ×× 10−422.158
26AT4G37910HSP70-9Heat shock 70 kDa protein 9, mitochondrial73.32/
5.51
296254.70 × 10−562.615
27AT5G09810ACT7Actin 741.94/
5.31
3211001.50 × 10−1031.110
29AT1G35720ANNAT1Annexin D1, calcium binding proteins36.30/
5.21
277545.90 × 10−692.469
30AT1G79230STR1Thiosulfate/3-mercaptopyruvate sulfurtransferase 1, mitochondrial42.15/
5.95
215291.90 × 10−461.487
31AT3G53970 Probable proteasome inhibitor32.15/
4.94
153291.90 × 10−263.353
32AT1G62380ACO21-aminocyclopropane-1-carboxylate oxidase 236.39/
4.98
217229.40 × 10−66−2.900
33, 34AT4G20260PCAP1Plasma membrane associated cation-binding protein 118.98/
9.88
91682.40 × 10−10−1.309
37AT5G38480GRF314-3-3-like protein GF14 psi32.00/
4.91
81491.90 × 10−081.052
38AT4G04020PAP1Probable plastid-lipid-associated protein 1, chloroplastic34.99/
5.45
237863.70 × 10−725.711
40AT4G10480NACα4Nascent polypeptide-associated complex (NAC), alpha subunit family protein23.10/
4.25
82029.40 × 10−142.031
41, 42AT4G02450P23-1HSP20-like chaperones superfamily protein25.38/
4.46
102482.40 × 10−183.315
43AT4G34050CCoAOMT1S-adenosyl-L-methionine-dependent methyltransferases superfamily protein29.25/
5.13
206591.90 × 10−597.222
45AT1G47420SDH5Succinate dehydrogenase subunit 5, mitochondrial28.15/
6.19
154101.50 × 10−345.433
46, 48AT3G55440CTIMCTriosephosphate isomerase, cytosolic27.38/
5.39
269045.90 × 10−841.155
47AT5G20720CPN2020 kDa chaperonin, chloroplastic26.79/
8.86
8870.0331.638
49AT5G26667UMK3P-loop containing nucleoside triphosphate hydrolases superfamily protein22.58/
5.79
132982.40 × 10−232.088
51AT1G02930GSTF6Glutathione S-transferase F623.47/
5.80
184673.00 * 10−401.795
52AT3G22630PBD1Proteasome subunit beta type-2-A22.64/
5.95
151382.40 * 10−071.952
53AT4G38680CSP2Glycine-rich protein 2, Arabidopsis thaliana cold shock protein 219.49/
5.62
5970.00314.117
54AT3G62030CYP20-3
/ROC4
Peptidyl-prolyl cis-trans isomerase CYP20-3, chloroplastic26.73/
8.63
164182.40 × 10−351.402
55AT1G26630ELF5A-2Eukaryotic translation initiation factor 5A-1 (eIF-5A 1) protein17.36/
5.55
72329.40 × 10−172.141
56AT5G59880ADF3Actin-depolymerizing factor 316.03/
5.93
105454.70 × 10−481.290
57AT3G53990F5K20_290Adenine nucleotide alpha hydrolases-like superfamily protein17.90/
5.66
215754.70 × 10−511.502
58AT3G23490CYNCyanate hydratase18.64/
5.49
155745.90 × 10−511.316
59AT4G13850RBG2Glycine-rich RNA-binding protein 2, mitochondrial14.74/
6.73
72682.40 × 10−2013.161
60AT5G18060SAUR23SAUR-like auxin-responsive protein family72.78/
5.87
21691.92.814
a The number of identification spots. b Theoretical mass (Mr, kDa) and pI of identified proteins. Theoretical values were retrieved from the protein database. c Number of matched peptides. d The mascot scores.
Publisher’s Note: MDPI stays neutral with regard to jurisdictional claims in published maps and institutional affiliations.

