1. Introduction
Alzheimer’s disease (AD) is a common progressive neurodegenerative disease worldwide, representing a global health concern. Approximately 50 million individuals have dementia worldwide; this figure will almost triple by 2050 [
1]. AD causes a progressive loss of mental capacity and behavior, causing a functional decline in the ability to learn [
2]. The causes of AD are unknown; however, factors such as oxidative stress and neuro-inflammation contribute to the pathogenesis of AD [
2]. Four drugs are approved by the FDA for cognitive manifestations of AD treatment: the acetylcholine esterase inhibitors rivastigmine, galantamine, and donepezil elevate the acetylcholine levels in the brain nerves and the NMDA receptor antagonist memantine protects the nervous tissues against glutamate-mediated cytotoxicity. These agents provide symptomatic relief; however, the benefits remain limited [
3,
4]. Therefore, the development of new drugs for AD is urgently required.
Studies have indicated that extracellular amyloid β (Aβ) plaques and intracellular tau neurofibrillary tangles (NFTs) are two neuropathological hallmarks of AD. Evidence suggests a crosslink between these two markers, although the detailed mechanisms remain unclear [
5]. Aβ formation in amyloid precursor protein (APP) transgenic mice causes hyperphosphorylation of tau, leading to possible synaptic dysfunction, and ultimately, neuronal loss [
5]. Tau is a microtubule-associated protein that contributes to microtubule stabilization, neuronal cell growth, axon morphology, and transportation under physiological conditions [
5]. However, in pathological disease, hyperphosphorylation of tau diminishes its ability to bind and stabilize microtubules, causing microtubule sabotage [
4,
6]. Several kinases and phosphatases majorly contribute to tau phosphorylation, such as glycogen synthase kinase 3β (GSK3β), cyclin-dependent kinase 5 (CDK5), mitogen-activated protein kinase (MAPK), and protein phosphatase 2A (PP2A), and are deemed potential therapeutic targets for AD [
6].
Evodiamine, an indole alkaloid derived from the fruit of
Evodia rutaecarpa, possesses several biological effects, such as anti-obese [
7], anti-inflammatory [
8], analgesic [
9], antibacterial [
10], antidepressive [
11], and neuroprotective effects [
12]. Furthermore, evodiamine can ameliorate the blood–brain barrier (BBB) permeability and improve cognitive impairment by attenuating cellular apoptosis [
12,
13], decreasing oxidative stress, and reducing inflammation [
14] in ischemia and AD mouse models. Evodiamine can increase p-GSK3β Ser9 expression [
12], an inhibited form of GSK3β, which is the major kinase causing tau phosphorylation [
6]. However, whether evodiamine inhibits hyperphosphorylated tau and its self-aggregates to form NFTs resulting in neuronal cell apoptosis remains unclear. Therefore, we determined whether evodiamine decreases tau phosphorylation for a neuroprotective effect against AD.
3. Discussion
Studies indicated that evodiamine can inhibit streptozotocin-triggered oxidative stress and inflammatory cytokines (e.g., TNF-α, IL-1β, and IL-6) in the hippocampi of mice [
14], and it shows high permeability through the BBB for neuroprotective effects by reducing 1-methyl-4-phenylpyridinium ion (MPP
+) or hydrogen peroxide-induced injury [
16]. Furthermore, 20 μM treatment of evodiamine had no significant effect on cell viability in mouse microglial BV-2 cells and mouse hippocampal neuronal HT22 cells [
13,
24]. These findings suggest that evodiamine is therapeutic for neurodegenerative diseases. Zhang’s group demonstrated that evodiamine significantly increased the serum levels of acetylcholine and decreased the levels of acetylcholinesterase in the serum, hypothalamus, and brain, by reducing the Aβ
42 deposition in the brain [
13]. Wang et al. also indicated that evodiamine inhibits glial cell activation and neuroinflammation in the hippocampus [
14]. Several protein kinases, including GSK3β, CDK5, and MAPKs, can phosphorylate tau proteins at various sites, triggering tau hyperphosphorylation, whereas its dephosphorylation is catalyzed by protein phosphatases, of which, PP2A accounts for 70% of human brain tau phosphatase activity [
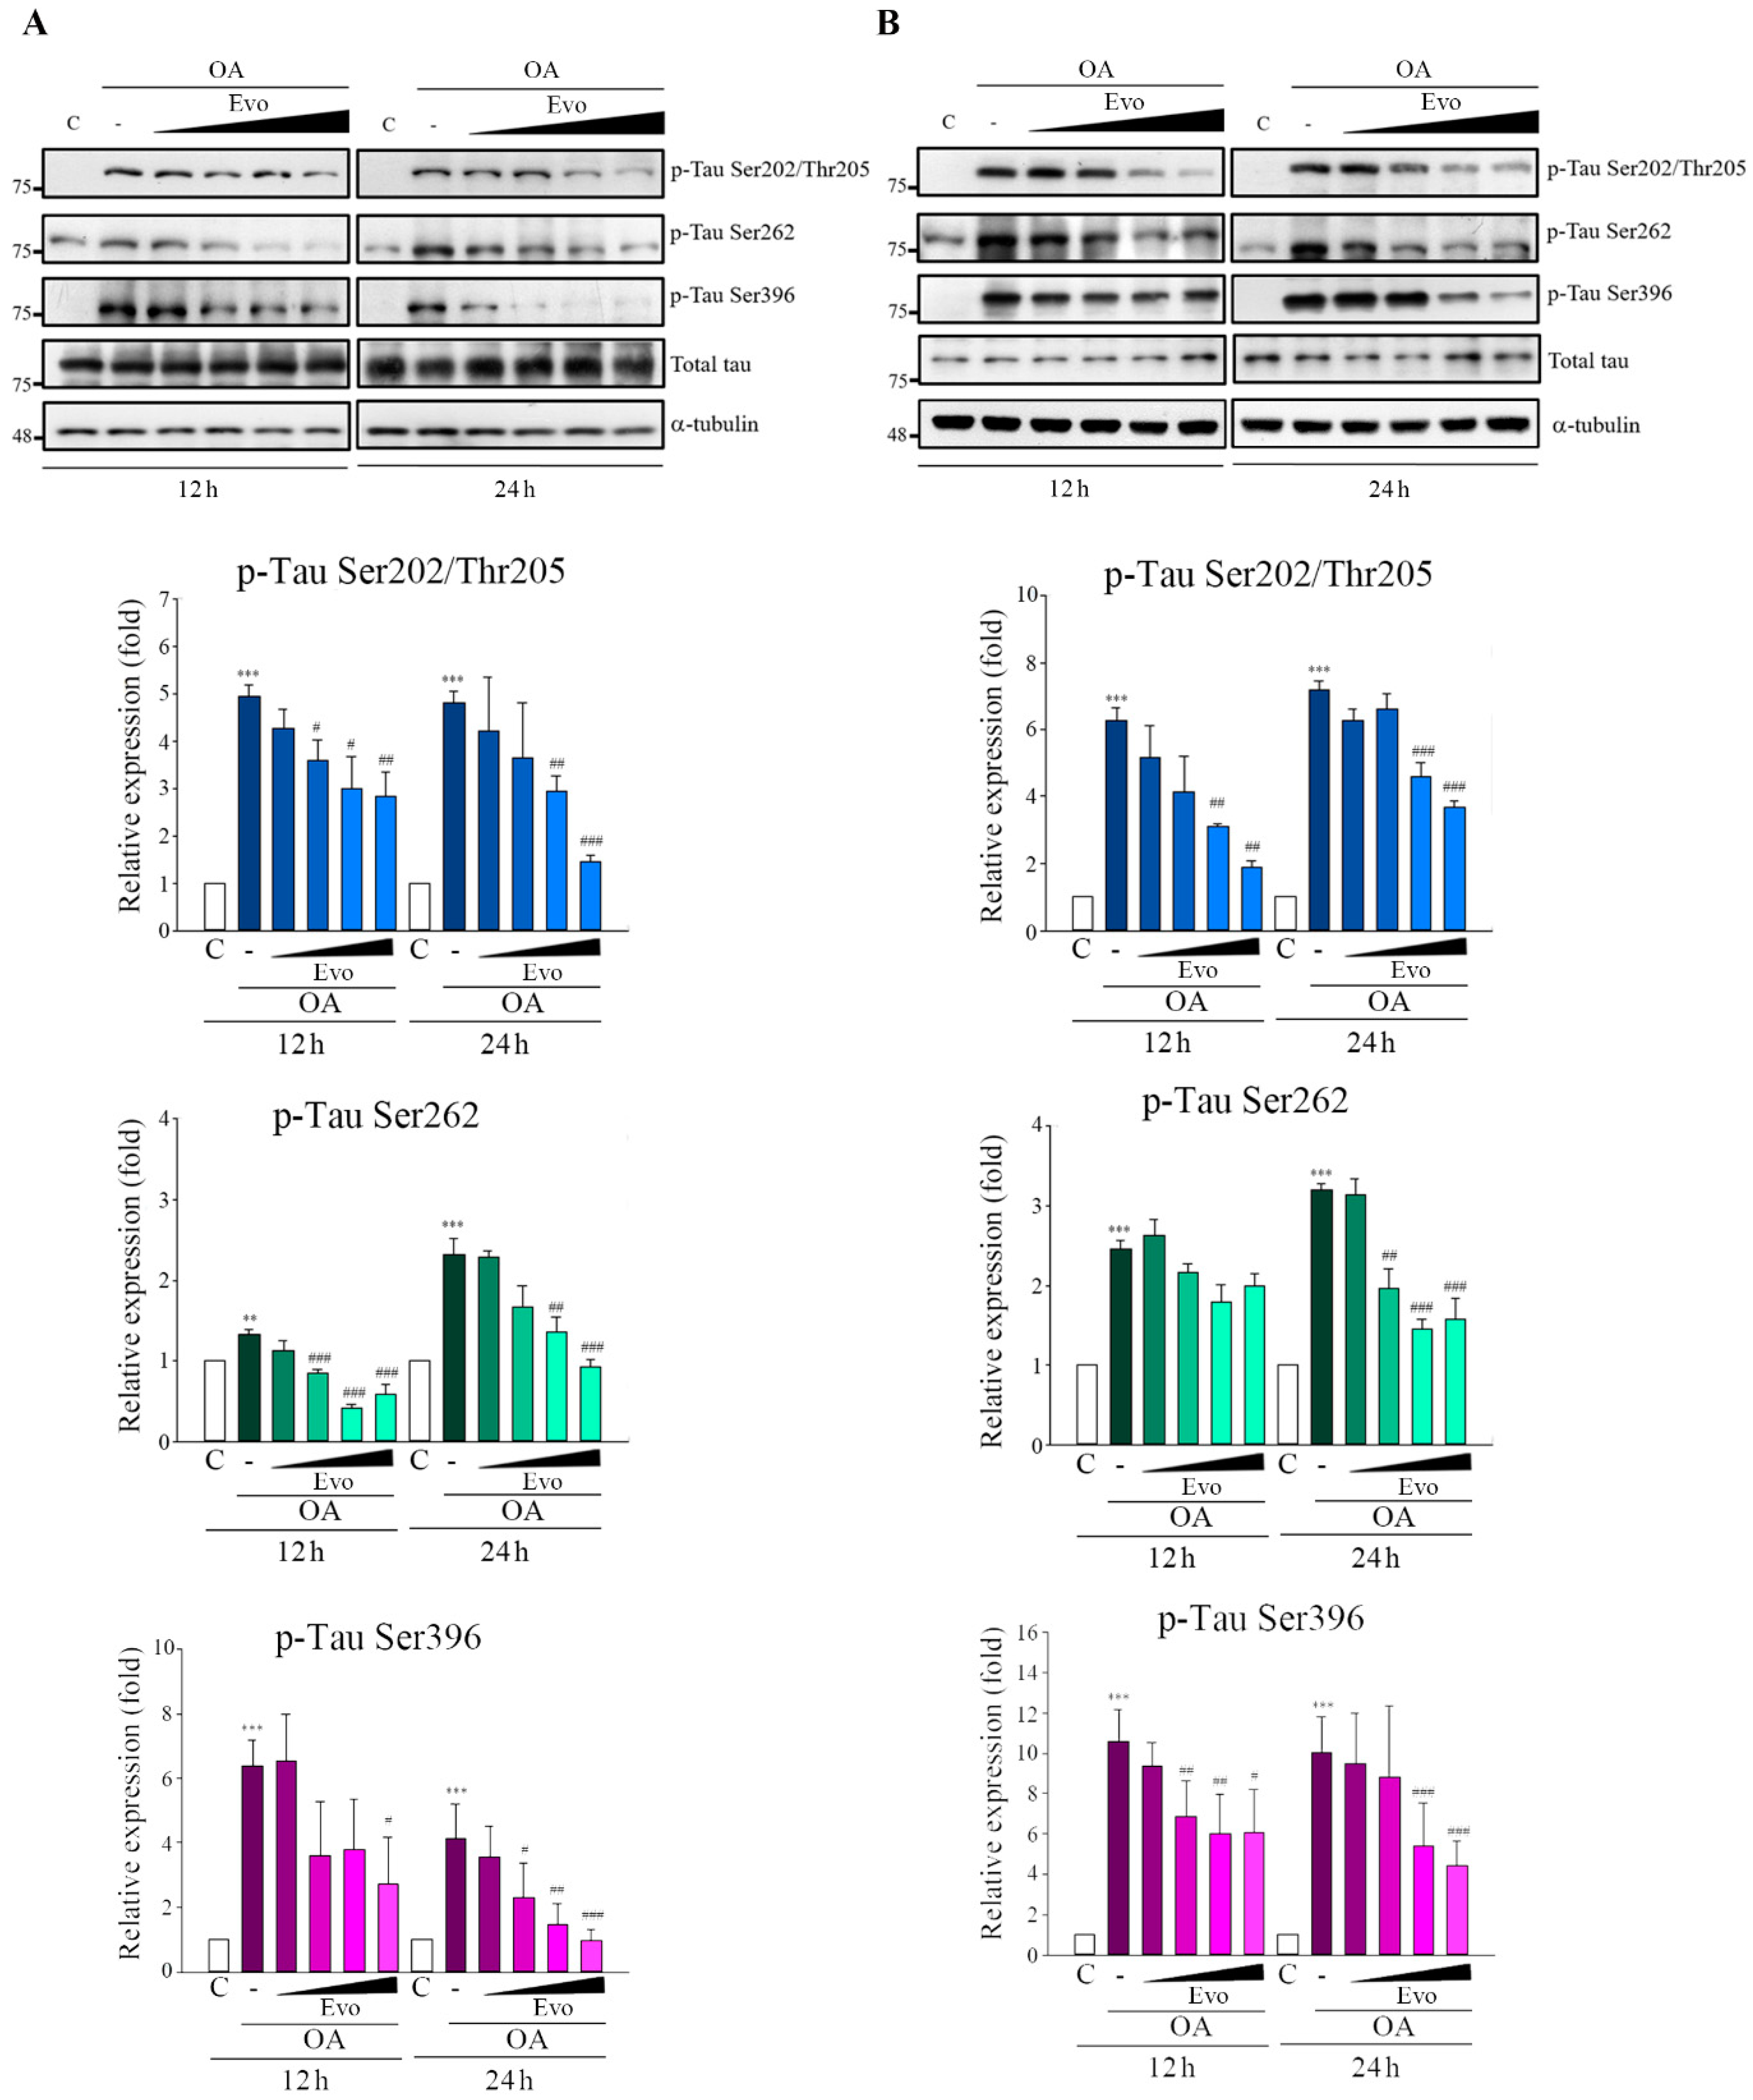
6]; the imbalance between tau phosphorylation and dephosphorylation is critical to AD tauopathy. OA treatment not only inhibited PP2A activity but also induced an Alzheimer-like hyperphosphorylation and accumulation of tau through increased activity of GSK3β and CDK5 both in vivo and in vitro [
25]. Here, OA-treated neuronal cells significantly increased tau phosphorylation (
Figure 3) and hyperphosphorylated tau aggregation, leading to neuronal death (
Figure 5), consistent with the findings of previous studies. Evodiamine treatment significantly decreased phosphorylated (
Figure 3) and aggregated tau and downregulated apoptosis (
Figure 5). Evodiamine treatment ameliorated learning and memory impairments in vivo (
Figure 6), emphasizing its therapeutic potential for AD.
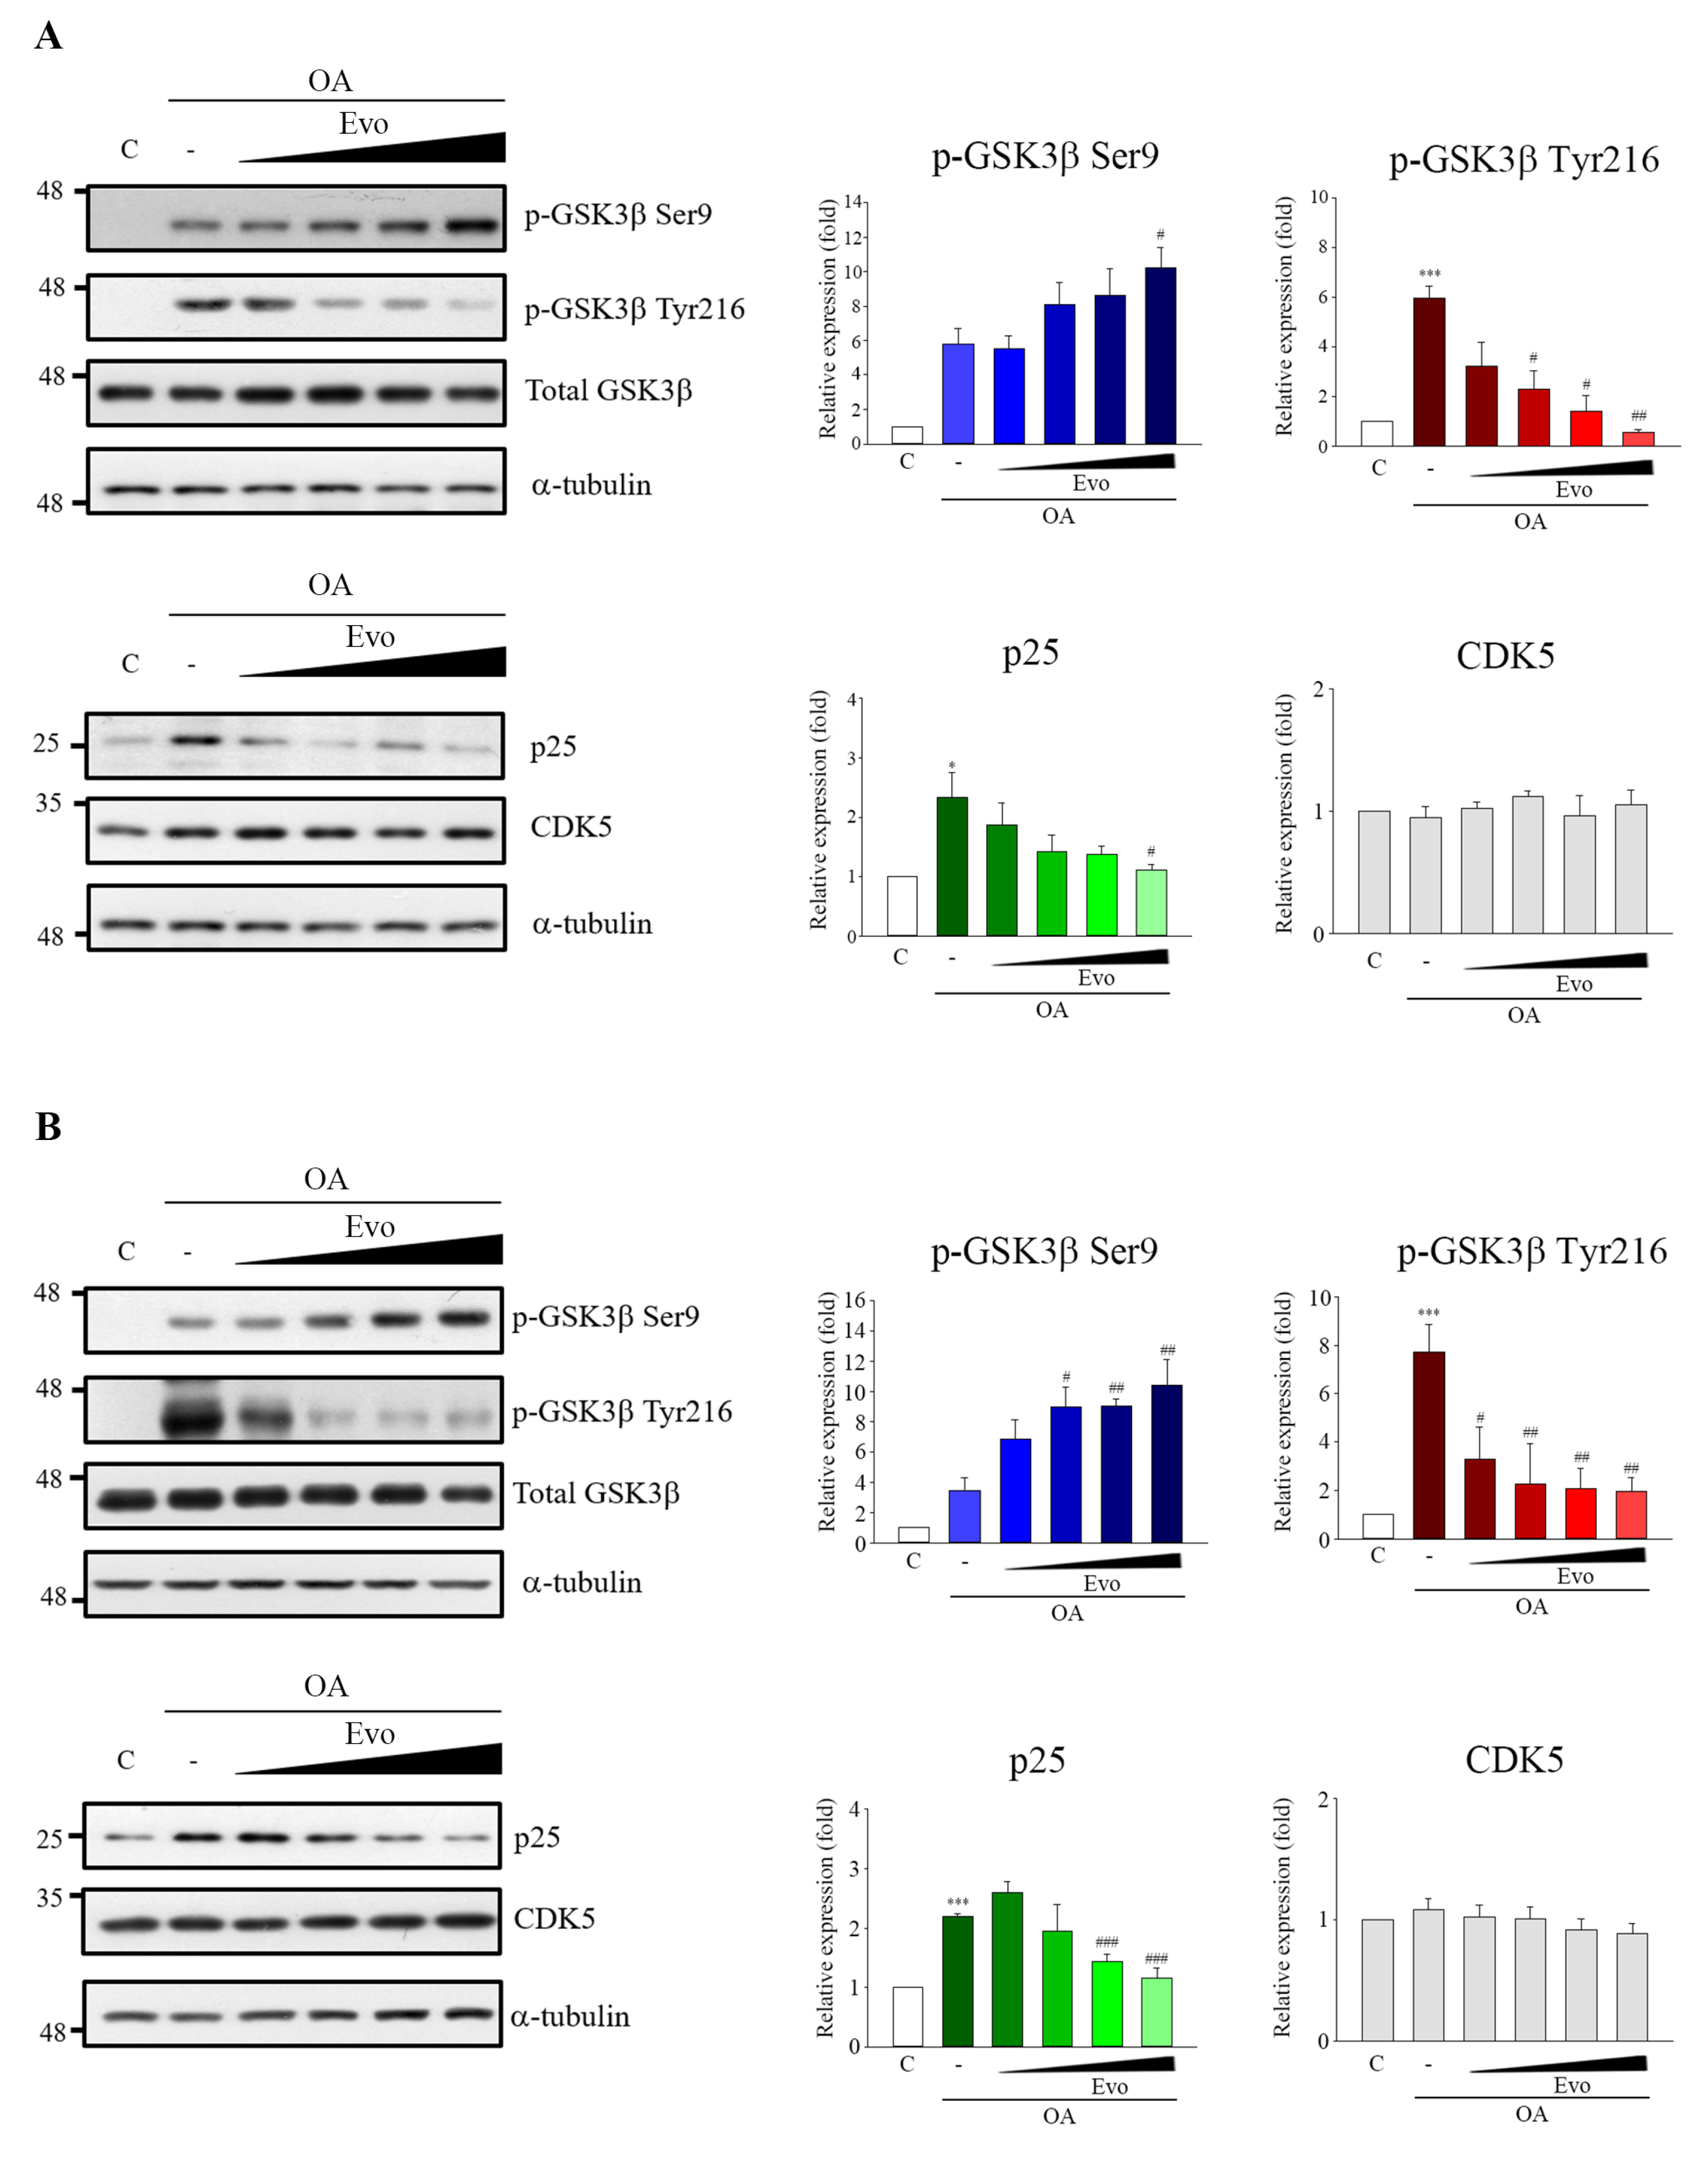
GSK3β and CDK5 are major kinases in aberrant tau phosphorylation. GSK3β is a constitutively active protein kinase and its kinase is primarily regulated via the phosphorylation inhibition on Ser9 and phosphorylation activation on Tyr216 [
19]. GSK3β-mediated phosphorylation of tau primarily occurs in the regions surrounding the microtubule-binding domain, whereas phosphorylation at these sites has been found to cause tau detachment from microtubules, resulting in self-aggregation [
26]. Increased GSK3β activity has been found in AD patients [
17], and overexpression of GSK3β in mice results in AD-like tau pathology [
27]. CDK5 activity is closely linked with p35/25 protein expression, and CDK5, along with its major activator p35, is involved in neuronal cellular functions; however, under neurotoxic stress, the activating calpain which cleaves p35 to produce p25. CDK5 combined with p25, causing the hyperactivation of CDK5, leads to tau phosphorylation [
28]. Here, evodiamine treatment not only significantly decreased GSK3β phosphorylation on Tyr216, but also increased GSK3β phosphorylation on Ser9 and decreased the expression of p25 in an OA-induced model (
Figure 3). Thus, evodiamine inhibits tau phosphorylation by modulating GSK3β and CDK5 kinase activity. Furthermore, ROS regulates signaling in cell proliferation and apoptosis, whereas activation of MAPKs contributes to ROS-induced signal pathways [
29]. OA treatment increases ROS levels and induces MAPK activation, causing tau phosphorylation at sites in paired helical filament (PFH)-tau, ultimately causing apoptosis [
21]. In this study, evodiamine treatment significantly reversed OA treatment-induced GSH reduction and MDA increase, along with significantly increased MAPKs activation (
Figure 4). Collectively, our results indicated that evodiamine decreased tau phosphorylation, exerting neuroprotective effects against AD via the inhibition of GSK3β, CDK5, and MAPKs signals.
4. Materials and Methods
4.1. Materials
Evodiamine was obtained from Matsuura Yakugyo Co Ltd (Nagoya, Japan). Primary antibodies against APP, p-GSK3β (Ser9), p-GSK3β (Tye216), p-SAPK/JNK (Thr183/Tyr185), p-p44/42 MAPK (ERK1/2) (Thr202/Tyr204), and p-p38 MAPK (Thr180/Tyr182) were purchased from Cell Signaling Technology (Danvers, MA, USA). Antibodies against p-tau (Ser396), JNK, ERK, and p38 were purchased from Abcam (Cambridge, MA, USA). Antibodies against p-tau (Ser202/Thr205), p-tau (Ser262), and tau were obtained from Thermo Fisher Scientific (Waltham, MA, USA); antibodies to GSK3β and GAPDH were obtained from GeneTex Inc. (Hsinchu city, Taiwan). Horseradish peroxidase (HRP)-conjugated antimouse and antirabbit IgG secondary antibodies were purchased from Jackson ImmunoResearch Inc. (West Grove, PA, USA). OA was purchased from Cayman Chemical Company (Ann Arbor, MI, USA). Unless otherwise stated, all other chemicals were purchased from Sigma-Aldrich (St. Louis, MO, USA).
4.2. Cell Culture
Human neuroblastoma cell line SH-SY5Y was kindly provided by Prof. Shiow-Lin Pan (Taipei Medical University) and was maintained in Ham’s F12 nutrient mixture/minimum essential media with 10% fetal bovine serum, penicillin (100 units/mL), and streptomycin (100 μg/mL). The mouse neuroblastoma cell line Neuro-2a was purchased from the Bioresource Collection and Research Center (Hsinchu, Taiwan) and cultured in minimum essential media containing 10% fetal bovine serum, penicillin (100 units/mL), and streptomycin (100 μg/mL). All cell lines were incubated at 37 °C with 5% CO2.
4.3. PP2A Activity
PP2A activity was assessed using a serine/threonine phosphatase assay system (Promega Corp., Madison, WI, USA). An end product of lipid peroxidation, MDA, was spectrophotometrically measured according to the assay protocol (Cell Biolabs, San Diego, CA, USA). Endogenous antioxidant glutathione levels were measured using a glutathione colorimetric assay kit (BioVision Inc., Milpitas, CA, USA).
4.4. Estimation of Lipid Peroxidation
An end product of lipid peroxidation, MDA, was measured spectrophotometrically at a wavelength of 532 nm using malondialdehyde bis(dimethyl acetal) as a standard as per the assay protocol (Cell Biolabs, San Diego, CA, USA).
4.5. Estimation of Glutathione
Endogenous antioxidant glutathione levels were estimated using a glutathione colorimetric assay kit (BioVision Inc., Milpitas, CA, USA) by reacting it with 5,5′-dithiobis 2-nitrobenzoicacid, using reduced glutathione as a standard at a 412 nm wavelength.
4.6. Flow Cytometry
After treatment, the cells were collected, washed with cold phosphate-buffered saline (PBS), and fixed with 75% alcohol overnight at −20 °C. After centrifugation, fixed cells were washed with cold PBS and resuspended in DNA extraction buffer (0.2 M Na2HPO4, 0.1 M citric acid, pH 7.8) for 30 min. Cells were then centrifuged and incubated with propidium iodide (PI) (0.1% Triton X-100, 100 μg/mL RNase A, and 80 μg/mL PI in PBS) for 30 min. A FACScan Flow cytometer and Cell Quest software (Becton Dickinson, Mountain View, CA, USA) was used to analyze the cell cycle.
4.7. Subcellular Fractionation
This assay followed a previously published method [
22]. Briefly, cells (1 × 10
7) were treated with drugs and scraped off into a lysis buffer (0.25 M sucrose, 10 mM HEPES, pH 7.2, 1 mM MgAc
2, and protease inhibitors). Lysates were centrifuged at 190,000×
g for 1 h, and the supernatant was collected as the cytosolic fraction. The pellet was resuspended and incubated with 5 μM nocodazole on ice for 30 min, and then centrifuged for 1 h at 190,000×
g. The supernatant and pellets contained microtubule-tau and membrane-bound and aggregated tau, respectively. The pellets were extracted using 100 mM sodium carbonate buffer, pH 11.5, centrifuged at 190,000×
g for 1 h, and washed with 1% SDS to produce a fraction containing tau aggregates. Samples containing equal protein were analyzed using SDS-PAGE.
4.8. Immunoblot Analyses
For 10 min at 4 °C, 1 × 10⁶ cells were incubated in lysis buffer (20 mM HEPES, pH 7.4; 2 mM EGTA, 0.1% Triton X-100; 50 mM β-glycerophosphate; 1 mM DTT; 10% glycerol; 1 μg/mL leupeptin; 1 mM sodium orthovanadate; 1 mM phenylmethylsulfonyl fluoride, and 5 μg/mL aprotinin). Next, the cells were removed, placed on ice for 10 min, and subjected to 30 min centrifugation (17,000× g) at 4 °C. Next, we electrophoresed 20-μg protein samples on SDS polyacrylamide gels before transferring them onto a nitrocellulose membrane. The nitrocellulose membrane was subsequently blocked through 30 min incubation with 5% bovine serum albumin in Tris-buffered saline containing 0.1% Tween 20 (TBST) at room temperature (RT). Immunoblots were obtained through incubation overnight at 4 °C with primary antibodies in TBST and subsequent 1 h incubation at RT with secondary antibodies conjugated with HRP. Measurement of antibody binding was performed through photographic film exposure and application of an enhanced chemiluminescence reagent (GE Healthcare Corp., Buckinghamshire, UK).
4.9. Surgery and Microinjection for Intracerebroventricular (ICV) Administration of Okadaic Acid
The mice were anesthetized with Zoletil (I.M.) and restrained in a stereotactic apparatus (Stoelting Company, Wood Dale, Illinois, USA). A midline sagittal incision was made in the scalp. Okadaic acid (100 ng/1 μL in ACSF (147 mM NaCl, 2.9 mM KCl, 1.6 mM MgCl2, 1.7 mM CaCl2, and 2.2 mM dextrose) or only ACSF (1 μL) was ICV administered once into left lateral cerebral ventricle by microsyringe (Model 1701N, needle size 26s gauge) (Hamilton Company, NV, USA), using the coordinates: 0 mm posterior; −2.0 mm lateral; −2.5 mm ventral to bregma. After microsyringe puncture into cerebral ventricle and waiting for 5 min to obtain the equilibrium of brain pressure, microinjection continues for a period of 1 min (1 μL/min) by syringe pump (KD Scientific Inc., Holliston, MA, USA) then followed by an additional 5 min waiting time to allow for diffusion away from the injection site. Finally, the wound would be sutured rapidly.
4.10. Analysis of Cognitive Dysfunction
Six-week-old male ICR mice were randomly assigned to six groups (
n = 5). The groups and treatment conditions are detailed in
Table 1. Total experimental period was 31 d. Mice were intragastrically administered evodiamine (50, 100 mg/kg) or donepezil (2.5 mg/kg) with vehicle (0.9% saline, including 1% DMSO and 0.5% tween-80) once daily from day 3–30. On days 7–11, mice were treated with OA (100 ng) dissolved in sterile artificial cerebrospinal fluid by intracerebroventricular (ICV) injection once into the left lateral cerebral ventricle. Ten days after ICV injection, mice were subjected to the Morris water maze (days 21–25), magnetic resonance imaging (MRI) analysis (day 26), and the passive avoidance test (days 28–29). On day 31, the mice were sacrificed, and their brains extracted to evaluate tau phosphorylation and immunohistochemistry stains.
4.11. Morris Water Maze
The water maze was a white circular pool filled with water that was maintained at 25 °C. A black platform was submerged 2 cm below the surface of the water, and Styrofoam beads were added to make the platform invisible. Animals were trained to remain on the platform for 10 s upon reaching it. If the mice failed to locate the platform in 120 s, they were placed on the platform for 10 s such that they could learn and memorize the location; training was performed twice daily over 4 days for 1 week.
4.12. Magnetic Resonance Imaging (MRI)
Mice were subjected to 1H MRI scanning using a 7T animal scanner (Biospec 70/30 AS, Bruker Biospin MRI, Ettlingen, Germany) with an actively shielded gradient (BGA-12S, maximum strength of 670 mT/m). A 20 mm 1H selective double-tuned surface coil was used for signal excitation and reception. A system that was interfaced to a Linux PC running Topspin 2.0 and Paravision 5.1 software was used to acquire data. Before MRI, the mice were anesthetized by administering a mixture of 97% oxygen and 3% isoflurane. The anesthesia concentration was maintained at a proportion of 98% oxygen and 2% isoflurane during MR acquisition. To ensure consistent slice positioning, the coronal multislice rapid acquisition and relaxation enhancement (RARE) images were first acquired in axial orientations with the following parameters: repetition time (TR) = 3000 ms, echo time (TE) = 33 ms, acquisition matrix size = 256 × 256, field of view (FOV) = 20 × 20 mm2, 9 slices, slice thickness = 1 mm, and RARE factor = 8. The MT images, −1 mm posterior to the bregma, were acquired using a multiecho sequence in axial orientation with the following parameters: TR = 3000 ms, TE = 33 ms, acquisition matrix size = 256 × 256, FOV = 20 × 20 mm2, slice thickness = 1 mm, and number of averages = 1. RARE images were acquired without an off-resonance radiofrequency (RF) pulse (unsaturated) and with an off-resonance RF pulse (saturated) at an offset frequency of −16,875 Hz (pulse strength = 12 μT, number of pulses = 36, pulse length = 40 ms, saturation time = 1440 ms). The MT-ratio was calculated using the voxel extent ratio of the signal intensities by Image J. MRI analysis was entrusted by the Instrumentation Center of National Taiwan University.
4.13. Passive Avoidance Test
The passive avoidance test used two equally sized compartments (17 × 12 × 10 cm) set up with an electrifiable grid floor and separated by a guillotine door. On day 1, mice were initially placed in the light compartment to acclimatize for 40 s. The door was automatically opened and closed after the mice entered the dark compartment and were given a low-intensity electric foot shock (0.5 mA, 3 s) in the dark compartment. The transference of mice from the light to dark compartments was recorded in seconds as the transfer latency time. On day 2, no foot shock was delivered, and the duration of the trial was 300 s to examine the transfer latency time. The transfer latency time was measured using the Gemini Avoidance System (San Diego Instruments, San Diego, CA, USA).
4.14. Immunohistochemical Staining
On day 31, the mice were anesthetized and sacrificed by means of perfusion with 40–50 mL PBS, followed by 40–50 mL 4% paraformaldehyde in PBS as a fixative solution. Subsequently, the brains were removed and soaked in the same fixative solution. The immunohistochemistry stains were entrusted by Rapid Science Co. Ltd. (Taichung, Taiwan). Briefly, the whole brains were dehydrated, followed by immersion in paraffin and subsequently cut into 5 μm thick coronal slices. Replacing paraffin with xylene for 10 min dewaxes paraffin slices, which were then treated by 95%, 85%, 75% alcohol and subsequently distilled water for 5 min. The slices were immersed in Trilogy solution at 121 °C for 10 min to conduct antigen presentation, and cooled down naturally at RT. After washing three times with PBS for 3 min, the slices were placed in 3% H2O2 solution for 10 min at RT to reduce endogenous peroxidase activity, then washed three times with PBS for 3 min. The slices were incubated with 5% fetal bovine serum for 1 h at RT and then with primary antibody in 5% FBS overnight at 4 °C. After incubation, the slices were rinsed with PBS and reacted with HRP polymer conjugate reagent for 1 h at RT, then the slices were treated by DAB chromogen reagent to develop color.
4.15. Data Analysis and Statistics
Data are expressed as mean ± SEM and were analyzed using one-way ANOVA. When ANOVA showed significant differences between groups, the Tukey’s post hoc test was used to determine the pairs of groups showing statistically significant differences. Parameters with p < 0.05 were considered statistically significant.


