Value of Glucosylsphingosine (Lyso-Gb1) as a Biomarker in Gaucher Disease: A Systematic Literature Review


Abstract
:1. Introduction
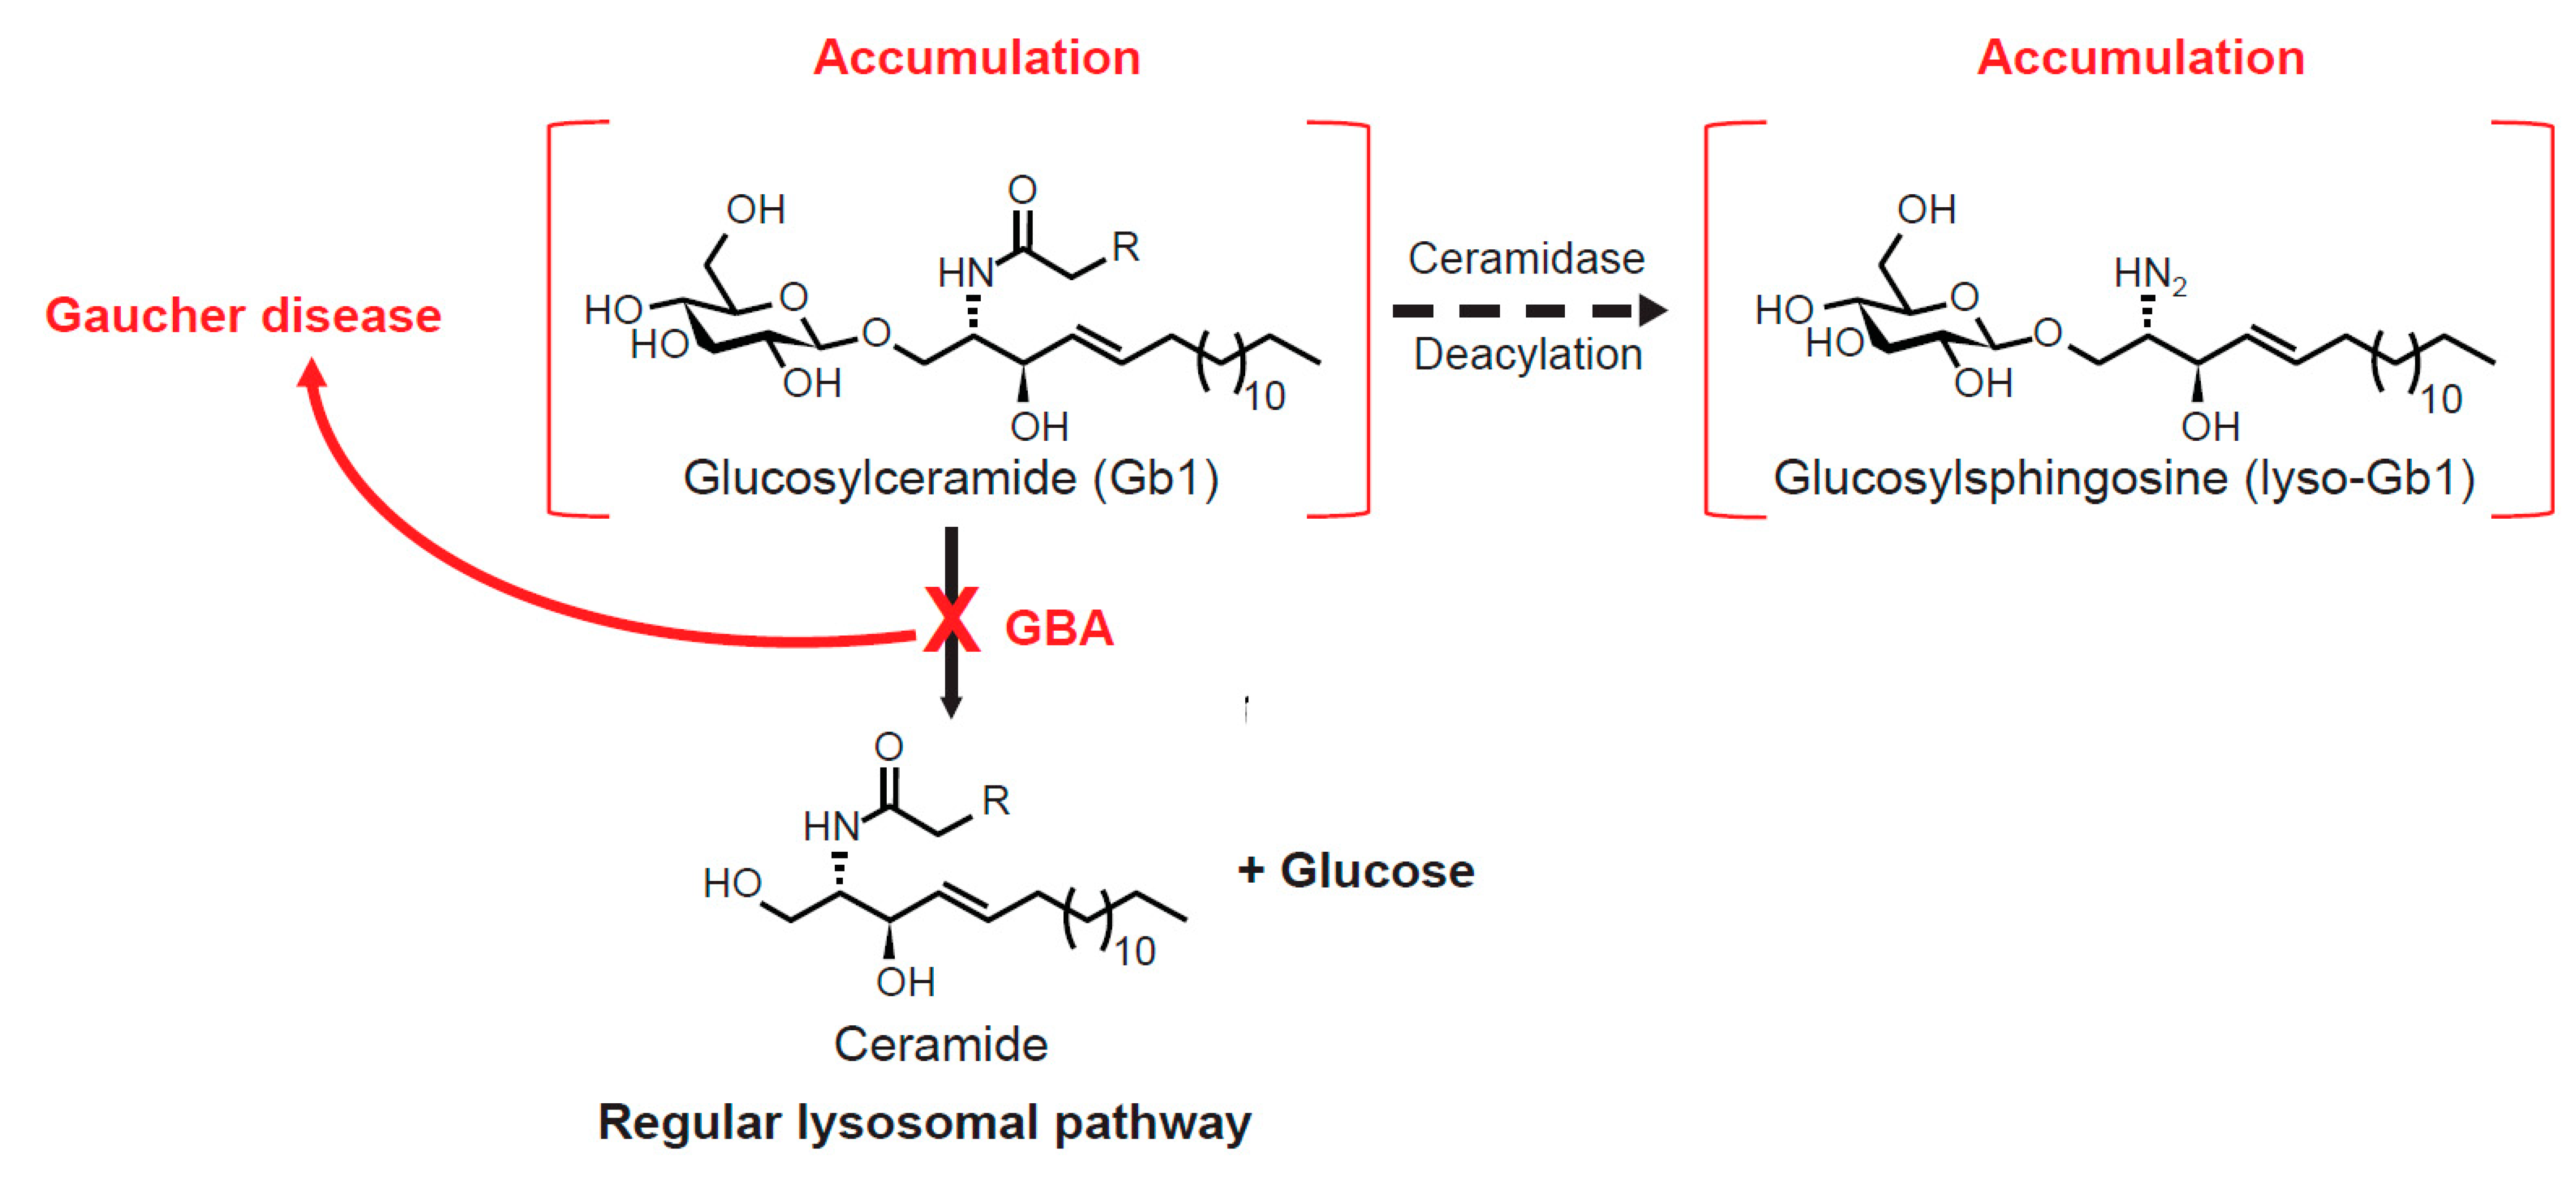
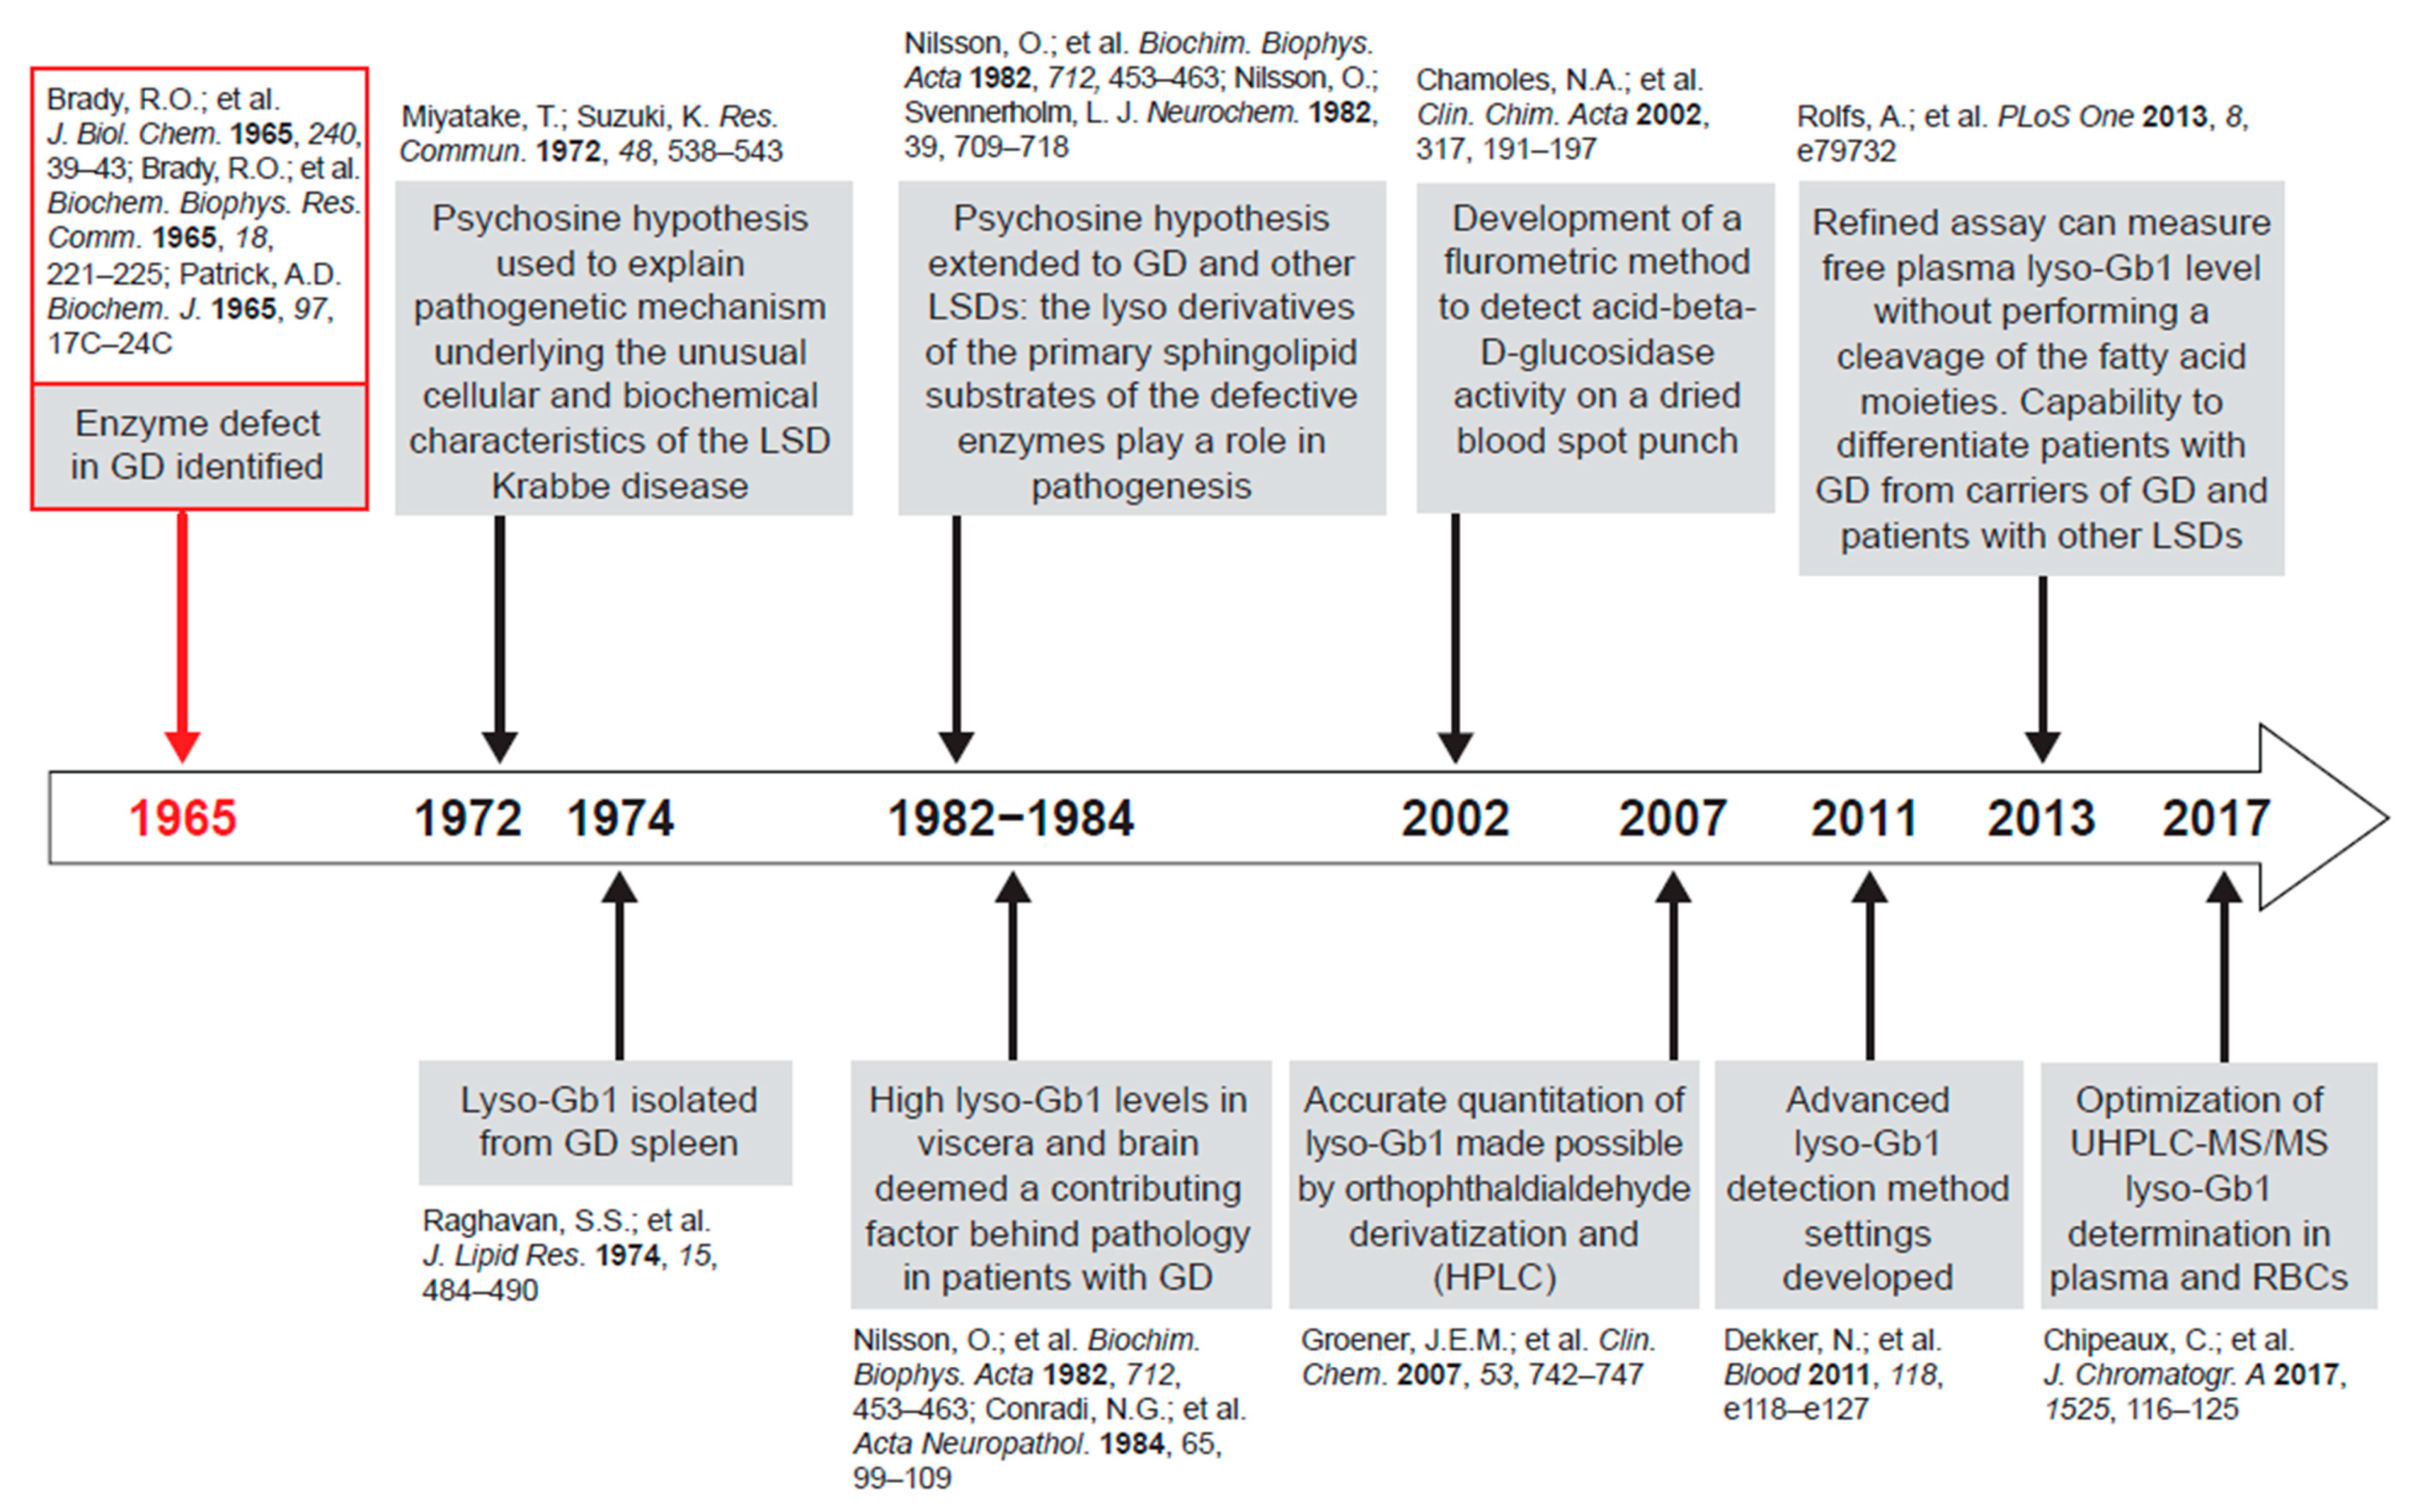
1.1. Gb1 Metabolism and Lyso-Gb1
1.2. Systematic Literature Review Objectives
2. Results
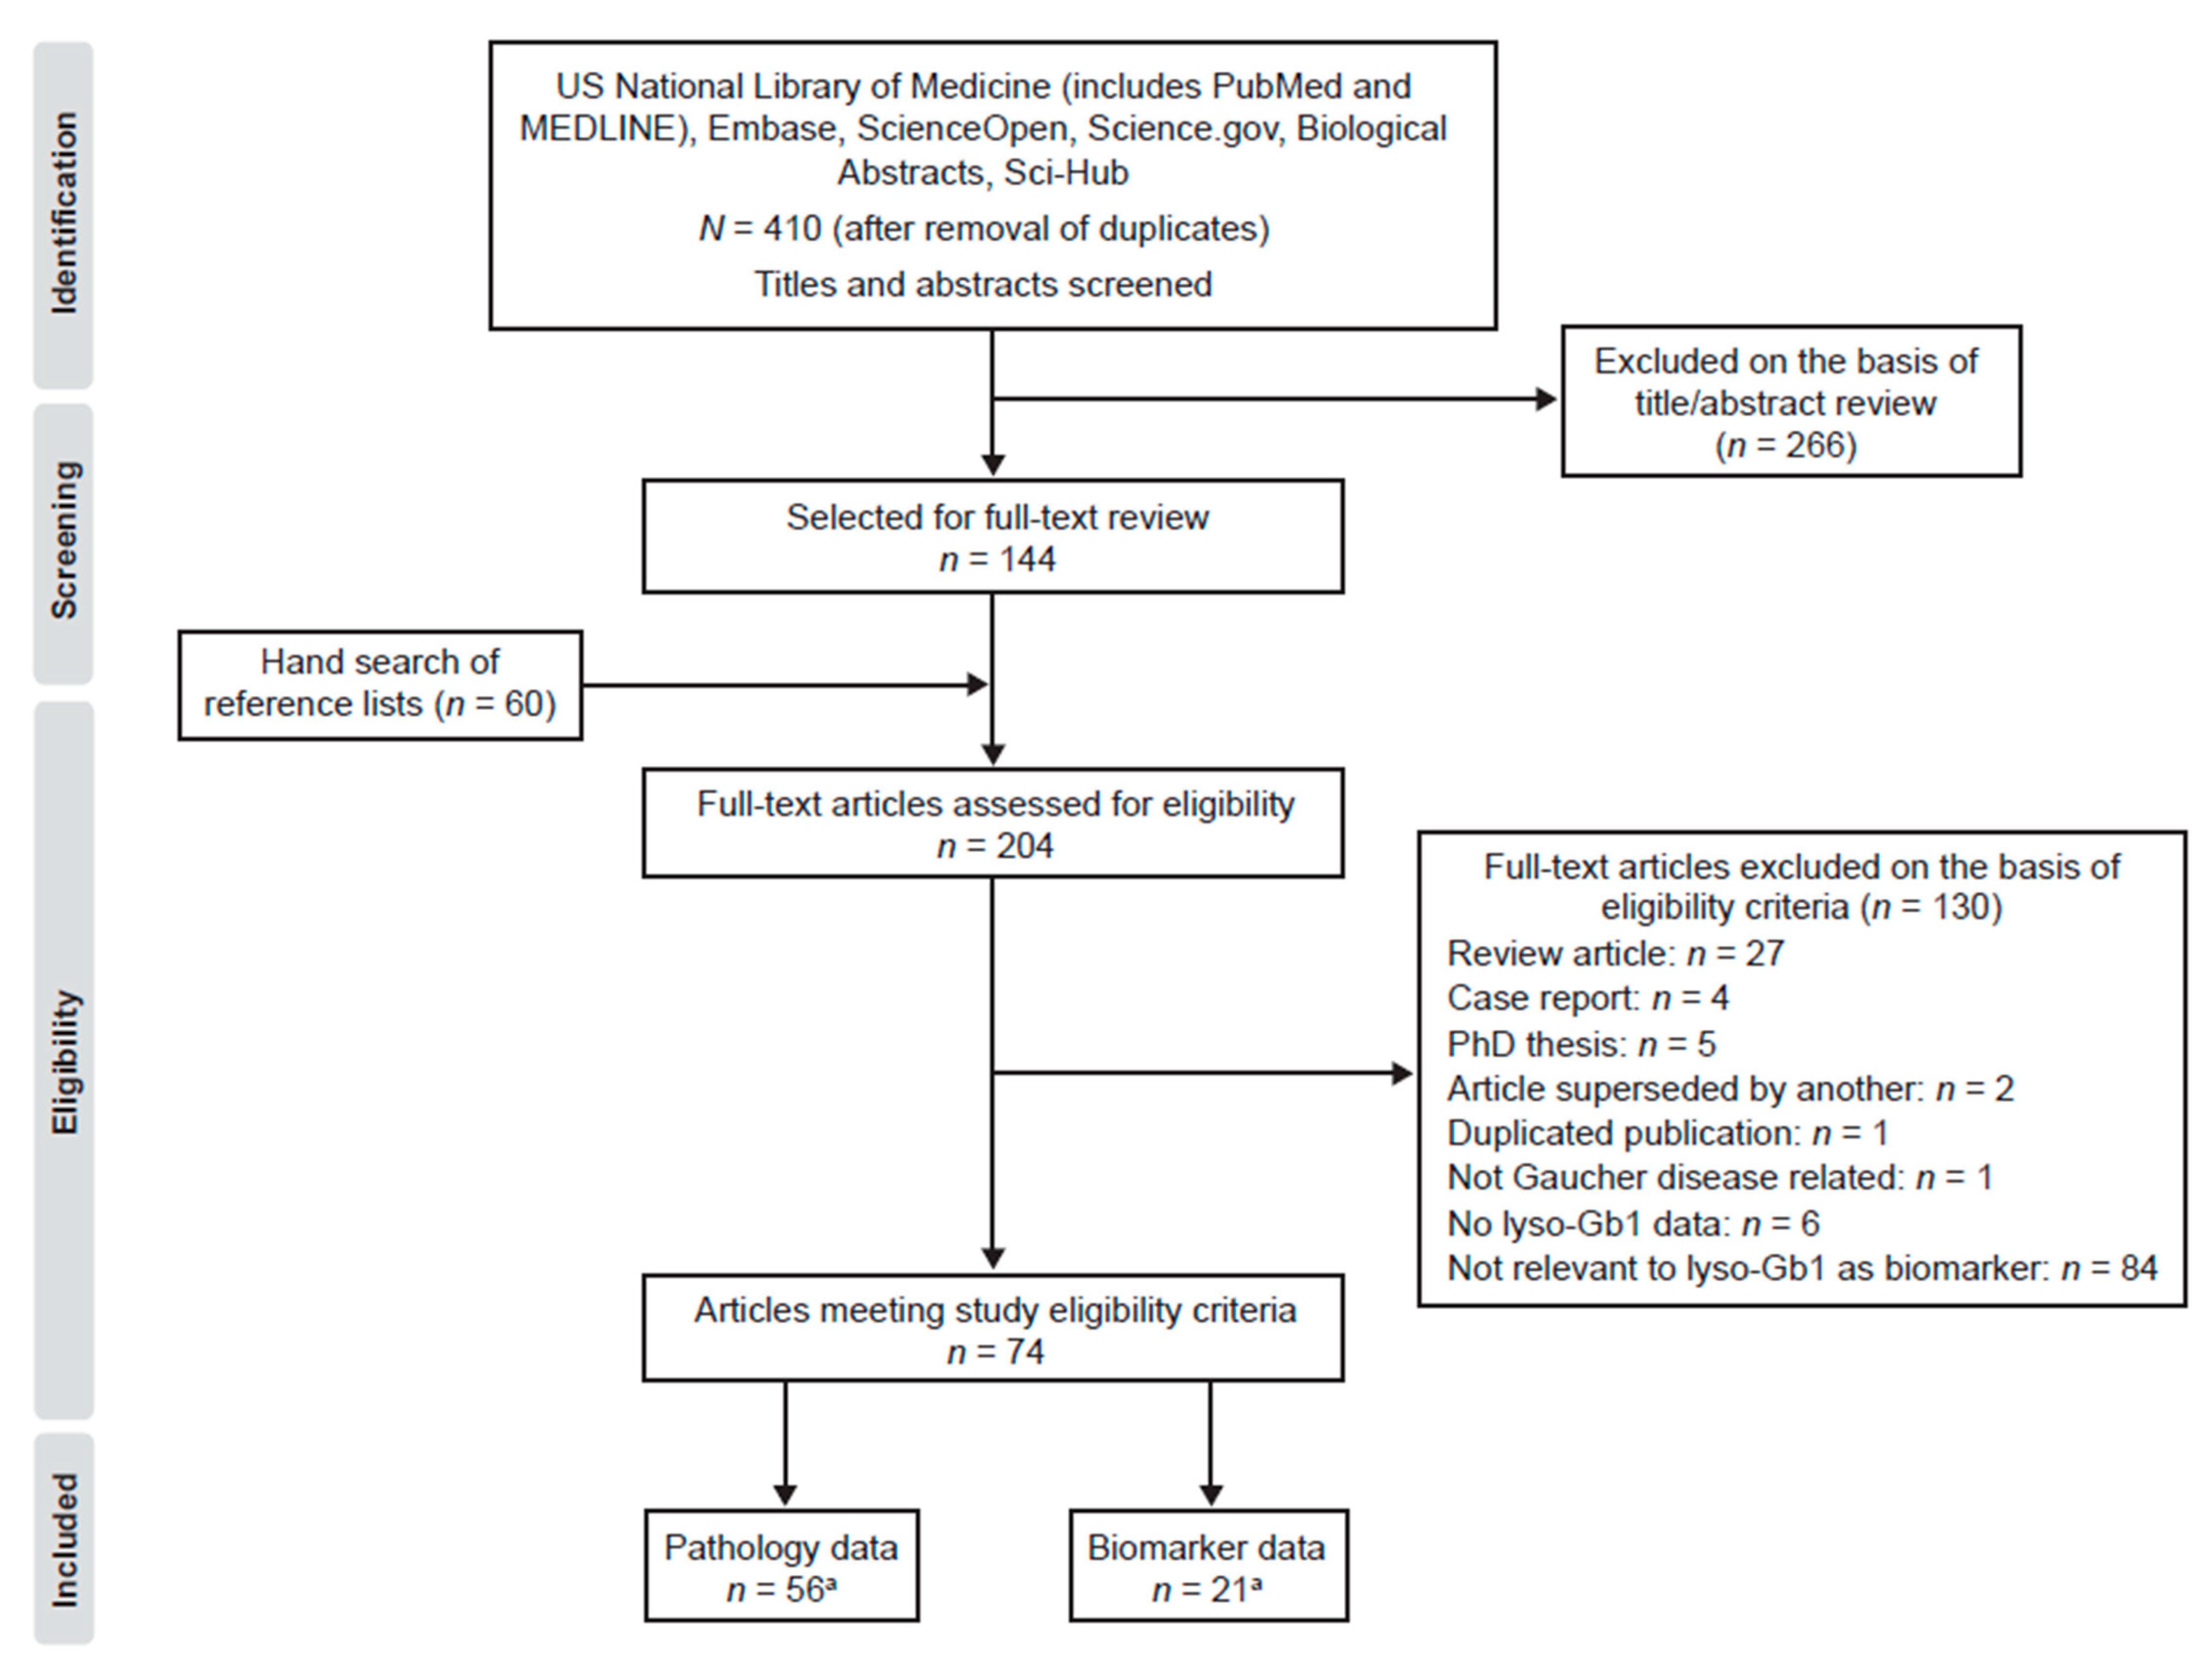
2.1. Search Results
2.2. Quality Assessment
2.3. Pathology
2.3.1. Accumulation of Lyso-Gb1 in Gaucher Disease
2.3.2. Relationship between Lyso-Gb1 and GD Pathology
2.4. Lyso-Gb1 as a Clinical Biomarker
2.4.1. Diagnosis
2.4.2. Prognosis
2.4.3. Disease Monitoring/Responsivity to Treatment
3. Discussion
4. Methods
4.1. Search Strategy
4.2. Eligibility Criteria
4.3. Screening and Data Collection
4.4. Data Analysis
4.5. Quality (Risk of Bias) Assessment
5. Conclusions
Supplementary Materials
Author Contributions
Funding
Acknowledgments
Conflicts of Interest
Abbreviations
| AMRF | Action myoclonus-renal failure |
| CBE | Conduritol B epoxide |
| CCL18 | (C-C motif) ligand 18 |
| CNS | Central nervous system |
| CSF | Cerebrospinal fluid |
| ERT | Enzyme replacement therapy |
| GBA | Glucosylceramidase |
| GD | Gaucher disease |
| Hb | Hemoglobin |
| HPLC | High-performance liquid chromatography |
| HPTLC | High-performance thin-layer chromatography |
| LC/MS/MS | Liquid chromatography tandem mass spectrometry |
| Lyso-Gb1 | Glucosylsphingosine |
| NICE | National Institute for Health and Care Excellence |
| PRISMA-P | Preferred Items for Systematic Review and Meta-Analyses Protocols |
| RBC | Red blood cell |
| SRT | Substrate reduction therapy |
| STA | Single technology appraisal |
| SYRCLE | Systematic Review Centre for Laboratory animal Experimentation |
| TDAG8 | T cell death-associated gene 8 |
| TLC | Thin-layer chromatography. |
References
- Zimran, A.; Elstein, D. Gaucher Disease and Related Lysosomal Storage Diseases. In Williams Hematology, 9th ed.; Kaushansky, K., Lichtman, M., Prchal, J., Levi, M.M., Press, O., Burns, L., Caligiuri, M., Eds.; McGraw-Hill: New York, NY, USA, 2016. [Google Scholar]
- Hruska, K.S.; LaMarca, M.E.; Scott, C.R.; Sidransky, E. Gaucher disease: Mutation and polymorphism spectrum in the glucocerebrosidase gene (GBA). Hum. Mutat. 2008, 29, 567–583. [Google Scholar] [CrossRef] [PubMed]
- Kang, L.; Zhan, X.; Gu, X.; Zhang, H. Successful newborn screening for Gaucher disease using fluorometric assay in China. J. Hum. Genet. 2017, 62, 763–768. [Google Scholar] [CrossRef] [PubMed] [Green Version]
- Matern, D.; Gavrilov, D.; Oglesbee, D.; Raymond, K.; Rinaldo, P.; Tortorelli, S. Newborn screening for lysosomal storage disorders. Semin. Perinatol. 2015, 39, 206–216. [Google Scholar] [CrossRef] [PubMed]
- Horowitz, M.; Pasmanik-Chor, M.; Borochowitz, Z.; Falik-Zaccai, T.; Heldmann, K.; Carmi, R.; Parvari, R.; Beit-Or, H.; Goldman, B.; Peleg, L.; et al. Prevalence of glucocerebrosidase mutations in the Israeli Ashkenazi Jewish population. Hum. Mutat. 1998, 12, 240–244. [Google Scholar] [CrossRef]
- Ferraz, M.J.; Kallemeijn, W.W.; Mirzaian, M.; Herrera Moro, D.; Marques, A.; Wisse, P.; Boot, R.G.; Willems, L.I.; Overkleeft, H.S.; Aerts, J.M. Gaucher disease and Fabry disease: New markers and insights in pathophysiology for two distinct glycosphingolipidoses. Biochim. Biophys. Acta 2014, 1841, 811–825. [Google Scholar] [CrossRef]
- Aerts, J.; Kuo, C.L.; Lelieveld, L.T.; Boer, D.E.C.; van der Lienden, M.J.C.; Overkleeft, H.S.; Artola, M. Glycosphingolipids and lysosomal storage disorders as illustrated by Gaucher disease. Curr. Opin. Chem. Biol. 2019, 53, 204–215. [Google Scholar] [CrossRef]
- Boven, L.A.; van Meurs, M.; Boot, R.G.; Mehta, A.; Boon, L.; Aerts, J.M.; Laman, J.D. Gaucher cells demonstrate a distinct macrophage phenotype and resemble alternatively activated macrophages. Am. J. Clin. Pathol. 2004, 122, 359–369. [Google Scholar] [CrossRef]
- Brady, R.O.; Kanfer, J.N.; Bradley, R.M.; Shapiro, D. Demonstration of a deficiency of glucocerebroside-cleaving enzyme in Gaucher’s disease. J. Clin. Investig. 1966, 45, 1112–1115. [Google Scholar] [CrossRef] [Green Version]
- Mistry, P.K.; Lopez, G.; Schiffmann, R.; Barton, N.W.; Weinreb, N.J.; Sidransky, E. Gaucher disease: Progress and ongoing challenges. Mol. Genet. Metab. 2017, 120, 8–21. [Google Scholar] [CrossRef] [Green Version]
- Lobato, B.J.; Hidalgo, M.J.; Jimenez, L.M.J. Biomarkers in lysosomal storage diseases. Diseases 2016, 4, 40. [Google Scholar] [CrossRef]
- Biomarkers Definitions Working Group. Biomarkers and surrogate endpoints: Preferred definitions and conceptual framework. Clin. Pharm. 2001, 69, 89–95. [Google Scholar]
- Hassan, S.; Sidransky, E.; Tayebi, N. The role of epigenetics in lysosomal storage disorders: Uncharted territory. Mol. Genet. Metab. 2017, 122, 10–18. [Google Scholar] [CrossRef] [PubMed]
- Biegstraaten, M.; van Schaik, I.N.; Aerts, J.M.; Langeveld, M.; Mannens, M.M.; Bour, L.J.; Sidransky, E.; Tayebi, N.; Fitzgibbon, E.; Hollak, C.E. A monozygotic twin pair with highly discordant Gaucher phenotypes. Blood Cells Mol. Dis. 2011, 46, 39–41. [Google Scholar] [CrossRef] [PubMed] [Green Version]
- Goker-Alpan, O.; Hruska, K.S.; Orvisky, E.; Kishnani, P.S.; Stubblefield, B.K.; Schiffmann, R.; Sidransky, E. Divergent phenotypes in Gaucher disease implicate the role of modifiers. J. Med. Genet. 2005, 42, e37. [Google Scholar] [CrossRef] [Green Version]
- Lachmann, R.H.; Grant, I.R.; Halsall, D.; Cox, T.M. Twin pairs showing discordance of phenotype in adult Gaucher’s disease. QJM 2004, 97, 199–204. [Google Scholar] [CrossRef] [Green Version]
- Lo, S.M.; Choi, M.; Liu, J.; Jain, D.; Boot, R.G.; Kallemeijn, W.W.; Aerts, J.M.; Pashankar, F.; Kupfer, G.M.; Mane, S.; et al. Phenotype diversity in type 1 Gaucher disease: Discovering the genetic basis of Gaucher disease/hematologic malignancy phenotype by individual genome analysis. Blood 2012, 119, 4731–4740. [Google Scholar] [CrossRef] [Green Version]
- Sims, K.B.; Pastores, G.M.; Weinreb, N.J.; Barranger, J.; Rosenbloom, B.E.; Packman, S.; Kaplan, P.; Mankin, H.; Xavier, R.; Angell, J.; et al. Improvement of bone disease by imiglucerase (Cerezyme) therapy in patients with skeletal manifestations of type 1 Gaucher disease: Results of a 48-month longitudinal cohort study. Clin. Genet. 2008, 73, 430–440. [Google Scholar] [CrossRef] [Green Version]
- Stein, P.; Yu, H.; Jain, D.; Mistry, P.K. Hyperferritinemia and iron overload in type 1 Gaucher disease. Am. J. Hematol. 2010, 85, 472–476. [Google Scholar] [CrossRef] [Green Version]
- Koppe, T.; Doneda, D.; Siebert, M.; Paskulin, L.; Camargo, M.; Tirelli, K.M.; Vairo, F.; Daudt, L.; Schwartz, I.V. The prognostic value of the serum ferritin in a southern Brazilian cohort of patients with Gaucher disease. Genet. Mol. Biol. 2016, 39, 30–34. [Google Scholar] [CrossRef]
- Stirnemann, J.; Boutten, A.; Vincent, C.; Mekinian, A.; Heraoui, D.; Fantin, B.; Fain, O.; Mentre, F.; Belmatoug, N. Impact of imiglucerase on the serum glycosylated-ferritin level in Gaucher disease. Blood Cells Mol. Dis. 2011, 46, 34–38. [Google Scholar] [CrossRef]
- Cabrera-Salazar, M.A.; O’Rourke, E.; Henderson, N.; Wessel, H.; Barranger, J.A. Correlation of surrogate markers of Gaucher disease. Implications for long-term follow up of enzyme replacement therapy. Clin. Chim. Acta 2004, 344, 101–107. [Google Scholar] [CrossRef] [PubMed]
- Boot, R.G.; Verhoek, M.; de Fost, M.; Hollak, C.E.; Maas, M.; Bleijlevens, B.; van Breemen, M.J.; van Meurs, M.; Boven, L.A.; Laman, J.D.; et al. Marked elevation of the chemokine CCL18/PARC in Gaucher disease: A novel surrogate marker for assessing therapeutic intervention. Blood 2004, 103, 33–39. [Google Scholar] [CrossRef] [PubMed] [Green Version]
- Hollak, C.E.; van Weely, S.; van Oers, M.H.; Aerts, J.M. Marked elevation of plasma chitotriosidase activity. A novel hallmark of Gaucher disease. J. Clin. Investig. 1994, 93, 1288–1292. [Google Scholar] [CrossRef] [PubMed] [Green Version]
- Deegan, P.B.; Moran, M.T.; McFarlane, I.; Schofield, J.P.; Boot, R.G.; Aerts, J.M.; Cox, T.M. Clinical evaluation of chemokine and enzymatic biomarkers of Gaucher disease. Blood Cells Mol. Dis. 2005, 35, 259–267. [Google Scholar] [CrossRef] [PubMed]
- Ferraz, M.J.; Marques, A.R.; Appelman, M.D.; Verhoek, M.; Strijland, A.; Mirzaian, M.; Scheij, S.; Ouairy, C.M.; Lahav, D.; Wisse, P.; et al. Lysosomal glycosphingolipid catabolism by acid ceramidase: Formation of glycosphingoid bases during deficiency of glycosidases. FEBS Lett. 2016, 590, 716–725. [Google Scholar] [CrossRef] [Green Version]
- Gonzalez, D.E.; Turkia, H.B.; Lukina, E.A.; Kisinovsky, I.; Dridi, M.F.; Elstein, D.; Zahrieh, D.; Crombez, E.; Bhirangi, K.; Barton, N.W.; et al. Enzyme replacement therapy with velaglucerase alfa in Gaucher disease: Results from a randomized, double-blind, multinational, Phase 3 study. Am. J. Hematol. 2013, 88, 166–171. [Google Scholar] [CrossRef] [PubMed]
- Pastores, G.M.; Shankar, S.P.; Petakov, M.; Giraldo, P.; Rosenbaum, H.; Amato, D.J.; Szer, J.; Chertkoff, R.; Brill-Almon, E.; Zimran, A. Enzyme replacement therapy with taliglucerase alfa: 36-month safety and efficacy results in adult patients with Gaucher disease previously treated with imiglucerase. Am. J. Hematol. 2016, 91, 661–665. [Google Scholar] [CrossRef] [Green Version]
- Schutyser, E.; Richmond, A.; Van Damme, J. Involvement of CC chemokine ligand 18 (CCL18) in normal and pathological processes. J. Leukoc. Biol. 2005, 78, 14–26. [Google Scholar] [CrossRef] [Green Version]
- van Dussen, L.; Hendriks, E.J.; Groener, J.E.; Boot, R.G.; Hollak, C.E.; Aerts, J.M. Value of plasma chitotriosidase to assess non-neuronopathic Gaucher disease severity and progression in the era of enzyme replacement therapy. J. Inherit. Metab. Dis. 2014, 37, 991–1001. [Google Scholar] [CrossRef]
- Suzuki, K. Twenty five years of the “psychosine hypothesis”: A personal perspective of its history and present status. Neurochem. Res. 1998, 23, 251–259. [Google Scholar] [CrossRef]
- Linari, S.; Castaman, G. Clinical manifestations and management of Gaucher disease. Clin. Cases Min. Bone Metab. 2015, 12, 157–164. [Google Scholar] [CrossRef] [PubMed]
- Dekker, N.; van Dussen, L.; Hollak, C.E.; Overkleeft, H.; Scheij, S.; Ghauharali, K.; van Breemen, M.J.; Ferraz, M.J.; Groener, J.E.; Maas, M.; et al. Elevated plasma glucosylsphingosine in Gaucher disease: Relation to phenotype, storage cell markers, and therapeutic response. Blood 2011, 118, e118–e127. [Google Scholar] [CrossRef] [PubMed] [Green Version]
- Meikle, P.J.; Whitfield, P.D.; Rozaklis, T.; Blacklock, D.; Duplock, S.; Elstein, D.; Zimran, A.; Mengel, E.; Cannell, P.; Hopwood, J.J.; et al. Plasma lipids are altered in Gaucher disease: Biochemical markers to evaluate therapeutic intervention. Blood Cells Mol. Dis. 2008, 40, 420–427. [Google Scholar] [CrossRef] [PubMed]
- Groener, J.E.; Poorthuis, B.J.; Kuiper, S.; Helmond, M.T.; Hollak, C.E.; Aerts, J.M. HPLC for simultaneous quantification of total ceramide, glucosylceramide, and ceramide trihexoside concentrations in plasma. Clin. Chem. 2007, 53, 742–747. [Google Scholar] [CrossRef] [PubMed] [Green Version]
- Mistry, P.K.; Lukina, E.; Ben Turkia, H.; Shankar, S.P.; Baris, H.; Ghosn, M.; Mehta, A.; Packman, S.; Pastores, G.; Petakov, M.; et al. Outcomes after 18 months of eliglustat therapy in treatment-naive adults with Gaucher disease type 1: The phase 3 ENGAGE trial. Am. J. Hematol. 2017, 92, 1170–1176. [Google Scholar] [CrossRef]
- Arkadir, D.; Dinur, T.; Revel-Vilk, S.; Becker Cohen, M.; Cozma, C.; Hovakimyan, M.; Eichler, S.; Rolfs, A.; Zimran, A. Glucosylsphingosine is a reliable response biomarker in Gaucher disease. Am. J. Hematol. 2018, 93, E140–E142. [Google Scholar] [CrossRef] [Green Version]
- Chipeaux, C.; de Person, M.; Burguet, N.; Billette de Villemeur, T.; Rose, C.; Belmatoug, N.; Heron, S.; Le Van Kim, C.; Franco, M.; Moussa, F. Optimization of ultra-high pressure liquid chromatography-tandem mass spectrometry determination in plasma and red blood cells of four sphingolipids and their evaluation as biomarker candidates of Gaucher’s disease. J. Chromatogr. A 2017, 1525, 116–125. [Google Scholar] [CrossRef]
- Elstein, D.; Mellgard, B.; Dinh, Q.; Lan, L.; Qiu, Y.; Cozma, C.; Eichler, S.; Bottcher, T.; Zimran, A. Reductions in glucosylsphingosine (lyso-Gb1) in treatment-naive and previously treated patients receiving velaglucerase alfa for type 1 Gaucher disease: Data from phase 3 clinical trials. Mol. Genet. Metab. 2017, 122, 113–120. [Google Scholar] [CrossRef]
- Franco, M.; Reihani, N.; Marin, M.; De Person, M.; Billette de Villemeur, T.; Rose, C.; Colin, Y.; Moussa, F.; Belmatoug, N.; Le Van Kim, C. Effect of velaglucerase alfa enzyme replacement therapy on red blood cell properties in Gaucher disease. Am. J. Hematol. 2017, 92, E561–E563. [Google Scholar] [CrossRef] [Green Version]
- Fuller, M.; Szer, J.; Stark, S.; Fletcher, J.M. Rapid, single-phase extraction of glucosylsphingosine from plasma: A universal screening and monitoring tool. Clin. Chim. Acta 2015, 450, 6–10. [Google Scholar] [CrossRef]
- Gaspar, P.; Kallemeijn, W.W.; Strijland, A.; Scheij, S.; Van Eijk, M.; Aten, J.; Overkleeft, H.S.; Balreira, A.; Zunke, F.; Schwake, M.; et al. Action myoclonus-renal failure syndrome: Diagnostic applications of activity-based probes and lipid analysis. J. Lipid Res. 2014, 55, 138–145. [Google Scholar] [CrossRef] [PubMed] [Green Version]
- Lukina, E.; Watman, N.; Dragosky, M.; Lau, H.; Avila Arreguin, E.; Rosenbaum, H.; Zimran, A.; Foster, M.C.; Gaemers, S.J.M.; Peterschmitt, M.J. Outcomes after 8 years of eliglustat therapy for Gaucher disease type 1: Final results from the Phase 2 trial. Am. J. Hematol. 2019, 94, 29–38. [Google Scholar] [CrossRef] [PubMed] [Green Version]
- Mirzaian, M.; Wisse, P.; Ferraz, M.J.; Gold, H.; Donker-Koopman, W.E.; Verhoek, M.; Overkleeft, H.S.; Boot, R.G.; Kramer, G.; Dekker, N.; et al. Mass spectrometric quantification of glucosylsphingosine in plasma and urine of type 1 Gaucher patients using an isotope standard. Blood Cells Mol. Dis. 2015, 54, 307–314. [Google Scholar] [CrossRef] [PubMed]
- Mistry, P.K.; Liu, J.; Sun, L.; Chuang, W.L.; Yuen, T.; Yang, R.; Lu, P.; Zhang, K.; Li, J.; Keutzer, J.; et al. Glucocerebrosidase 2 gene deletion rescues type 1 Gaucher disease. Proc. Natl. Acad. Sci. USA 2014, 111, 4934–4939. [Google Scholar] [CrossRef] [PubMed] [Green Version]
- Moraitou, M.; Dimitriou, E.; Dekker, N.; Monopolis, I.; Aerts, J.; Michelakakis, H. Gaucher disease: Plasmalogen levels in relation to primary lipid abnormalities and oxidative stress. Blood Cells Mol. Dis. 2014, 53, 30–33. [Google Scholar] [CrossRef]
- Murugesan, V.; Chuang, W.L.; Liu, J.; Lischuk, A.; Kacena, K.; Lin, H.; Pastores, G.M.; Yang, R.; Keutzer, J.; Zhang, K.; et al. Glucosylsphingosine is a key biomarker of Gaucher disease. Am. J. Hematol. 2016, 91, 1082–1089. [Google Scholar] [CrossRef] [PubMed] [Green Version]
- Murugesan, V.; Liu, J.; Yang, R.; Lin, H.; Lischuk, A.; Pastores, G.; Zhang, X.; Chuang, W.L.; Mistry, P.K. Validating glycoprotein non-metastatic melanoma B (gpNMB, osteoactivin), a new biomarker of Gaucher disease. Blood Cells Mol. Dis. 2018, 68, 47–53. [Google Scholar] [CrossRef]
- Narita, A.; Shirai, K.; Itamura, S.; Matsuda, A.; Ishihara, A.; Matsushita, K.; Fukuda, C.; Kubota, N.; Takayama, R.; Shigematsu, H.; et al. Ambroxol chaperone therapy for neuronopathic Gaucher disease: A pilot study. Ann. Clin. Transl. Neurol. 2016, 3, 200–215. [Google Scholar] [CrossRef]
- Rolfs, A.; Giese, A.K.; Grittner, U.; Mascher, D.; Elstein, D.; Zimran, A.; Bottcher, T.; Lukas, J.; Hubner, R.; Golnitz, U.; et al. Glucosylsphingosine is a highly sensitive and specific biomarker for primary diagnostic and follow-up monitoring in Gaucher disease in a non-Jewish, Caucasian cohort of Gaucher disease patients. PLoS ONE 2013, 8, e79732. [Google Scholar] [CrossRef]
- Smid, B.E.; Ferraz, M.J.; Verhoek, M.; Mirzaian, M.; Wisse, P.; Overkleeft, H.S.; Hollak, C.E.; Aerts, J.M. Biochemical response to substrate reduction therapy versus enzyme replacement therapy in Gaucher disease type 1 patients. Orphanet J. Rare Dis. 2016, 11, 28. [Google Scholar] [CrossRef] [Green Version]
- Tylki-Szymanska, A.; Szymanska-Rozek, P.; Hasinski, P.; Lugowska, A. Plasma chitotriosidase activity versus plasma glucosylsphingosine in wide spectrum of Gaucher disease phenotypes-A statistical insight. Mol. Genet. Metab. 2018, 123, 495–500. [Google Scholar] [CrossRef] [PubMed]
- Zhang, W.; Oehrle, M.; Prada, C.E.; Schwartz, I.V.D.; Chutipongtanate, S.; Wattanasirichaigoon, D.; Inskeep, V.; Dai, M.; Pan, D.; Sun, Y.; et al. A convenient approach to facilitate monitoring Gaucher disease progression and therapeutic response. Analyst 2017, 142, 3380–3387. [Google Scholar] [CrossRef] [PubMed]
- Nilsson, O.; Grabowski, G.A.; Ludman, M.D.; Desnick, R.J.; Svennerholm, L. Glycosphingolipid studies of visceral tissues and brain from type 1 Gaucher disease variants. Clin. Genet. 1985, 27, 443–450. [Google Scholar] [CrossRef] [PubMed]
- Nilsson, O.; Mansson, J.E.; Hakansson, G.; Svennerholm, L. The occurrence of psychosine and other glycolipids in spleen and liver from the three major types of Gaucher’s disease. Biochim. Biophys. Acta 1982, 712, 453–463. [Google Scholar] [CrossRef]
- Nilsson, O.; Svennerholm, L. Accumulation of glucosylceramide and glucosylsphingosine (psychosine) in cerebrum and cerebellum in infantile and juvenile Gaucher disease. J. Neurochem. 1982, 39, 709–718. [Google Scholar] [CrossRef] [PubMed]
- Orvisky, E.; Park, J.K.; LaMarca, M.E.; Ginns, E.I.; Martin, B.M.; Tayebi, N.; Sidransky, E. Glucosylsphingosine accumulation in tissues from patients with Gaucher disease: Correlation with phenotype and genotype. Mol. Genet. Metab. 2002, 76, 262–270. [Google Scholar] [CrossRef]
- Orvisky, E.; Sidransky, E.; McKinney, C.E.; Lamarca, M.E.; Samimi, R.; Krasnewich, D.; Martin, B.M.; Ginns, E.I. Glucosylsphingosine accumulation in mice and patients with type 2 Gaucher disease begins early in gestation. Pediatr. Res. 2000, 48, 233–237. [Google Scholar] [CrossRef] [Green Version]
- Park, J.K.; Orvisky, E.; Tayebi, N.; Kaneski, C.; Lamarca, M.E.; Stubblefield, B.K.; Martin, B.M.; Schiffmann, R.; Sidransky, E. Myoclonic epilepsy in Gaucher disease: Genotype-phenotype insights from a rare patient subgroup. Pediatr. Res. 2003, 53, 387–395. [Google Scholar] [CrossRef] [Green Version]
- Raghavan, S.S.; Mumford, R.A.; Kanfer, J.N. Deficiency of glucosylsphingosine: Beta-glucosidase in Gaucher disease. Biochem. Biophys. Res. Commun. 1973, 54, 256–263. [Google Scholar] [CrossRef]
- Tayebi, N.; Walker, J.; Stubblefield, B.; Orvisky, E.; LaMarca, M.E.; Wong, K.; Rosenbaum, H.; Schiffmann, R.; Bembi, B.; Sidransky, E. Gaucher disease with parkinsonian manifestations: Does glucocerebrosidase deficiency contribute to a vulnerability to parkinsonism? Mol. Genet. Metab. 2003, 79, 104–109. [Google Scholar] [CrossRef]
- Conradi, N.G.; Sourander, P.; Nilsson, O.; Svennerholm, L.; Erikson, A. Neuropathology of the Norrbottnian type of Gaucher disease. Morphological and biochemical studies. Acta Neuropathol. 1984, 65, 99–109. [Google Scholar] [CrossRef] [PubMed]
- Lloyd-Evans, E.; Pelled, D.; Riebeling, C.; Bodennec, J.; de-Morgan, A.; Waller, H.; Schiffmann, R.; Futerman, A.H. Glucosylceramide and glucosylsphingosine modulate calcium mobilization from brain microsomes via different mechanisms. J. Biol. Chem. 2003, 278, 23594–23599. [Google Scholar] [CrossRef] [PubMed] [Green Version]
- Atsumi, S.; Nosaka, C.; Iinuma, H.; Umezawa, K. Accumulation of tissue glucosylsphingosine in Gaucher-like mouse induced by the glucosylceramidase inhibitor cyclophellitol. Arch. Biochem. Biophys. 1993, 304, 302–304. [Google Scholar] [CrossRef]
- Barnes, S.; Xu, Y.H.; Zhang, W.; Liou, B.; Setchell, K.D.; Bao, L.; Grabowski, G.A.; Sun, Y. Ubiquitous transgene expression of the glucosylceramide-synthesizing enzyme accelerates glucosylceramide accumulation and storage cells in a Gaucher disease mouse model. PLoS ONE 2014, 9, e116023. [Google Scholar] [CrossRef] [PubMed] [Green Version]
- Dahl, M.; Doyle, A.; Olsson, K.; Mansson, J.E.; Marques, A.R.A.; Mirzaian, M.; Aerts, J.M.; Ehinger, M.; Rothe, M.; Modlich, U.; et al. Lentiviral gene therapy using cellular promoters cures type 1 Gaucher disease in mice. Mol. Ther. 2015, 23, 835–844. [Google Scholar] [CrossRef] [Green Version]
- Dai, M.; Liou, B.; Swope, B.; Wang, X.; Zhang, W.; Inskeep, V.; Grabowski, G.A.; Sun, Y.; Pan, D. Progression of behavioral and CNS deficits in a viable murine model of chronic neuronopathic Gaucher disease. PLoS ONE 2016, 11, e0162367. [Google Scholar] [CrossRef]
- Dasgupta, N.; Xu, Y.H.; Li, R.; Peng, Y.; Pandey, M.K.; Tinch, S.L.; Liou, B.; Inskeep, V.; Zhang, W.; Setchell, K.D.; et al. Neuronopathic Gaucher disease: Dysregulated mRNAs and miRNAs in brain pathogenesis and effects of pharmacologic chaperone treatment in a mouse model. Hum. Mol. Genet. 2015, 24, 7031–7048. [Google Scholar] [CrossRef]
- Enquist, I.B.; Lo Bianco, C.; Ooka, A.; Nilsson, E.; Mansson, J.E.; Ehinger, M.; Richter, J.; Brady, R.O.; Kirik, D.; Karlsson, S. Murine models of acute neuronopathic Gaucher disease. Proc. Natl. Acad. Sci. USA 2007, 104, 17483–17488. [Google Scholar] [CrossRef] [Green Version]
- Farfel-Becker, T.; Vitner, E.B.; Kelly, S.L.; Bame, J.R.; Duan, J.; Shinder, V.; Merrill, A.H., Jr.; Dobrenis, K.; Futerman, A.H. Neuronal accumulation of glucosylceramide in a mouse model of neuronopathic Gaucher disease leads to neurodegeneration. Hum. Mol. Genet. 2014, 23, 843–854. [Google Scholar] [CrossRef] [Green Version]
- Ferraz, M.J.; Marques, A.R.; Gaspar, P.; Mirzaian, M.; van Roomen, C.; Ottenhoff, R.; Alfonso, P.; Irun, P.; Giraldo, P.; Wisse, P.; et al. Lyso-glycosphingolipid abnormalities in different murine models of lysosomal storage disorders. Mol. Genet. Metab. 2016, 117, 186–193. [Google Scholar] [CrossRef] [Green Version]
- Hamler, R.; Brignol, N.; Clark, S.W.; Morrison, S.; Dungan, L.B.; Chang, H.H.; Khanna, R.; Frascella, M.; Valenzano, K.J.; Benjamin, E.R.; et al. Glucosylceramide and glucosylsphingosine quantitation by liquid chromatography-tandem mass spectrometry to enable in vivo preclinical studies of neuronopathic Gaucher disease. Anal. Chem. 2017, 89, 8288–8295. [Google Scholar] [CrossRef] [PubMed]
- Karageorgos, L.; Hein, L.; Rozaklis, T.; Adams, M.; Duplock, S.; Snel, M.; Hemsley, K.; Kuchel, T.; Smith, N.; Hopwood, J.J. Glycosphingolipid analysis in a naturally occurring ovine model of acute neuronopathic Gaucher disease. Neurobiol. Dis. 2016, 91, 143–154. [Google Scholar] [CrossRef] [PubMed]
- Liu, J.; Halene, S.; Yang, M.; Iqbal, J.; Yang, R.; Mehal, W.Z.; Chuang, W.L.; Jain, D.; Yuen, T.; Sun, L.; et al. Gaucher disease gene GBA functions in immune regulation. Proc. Natl. Acad. Sci. USA 2012, 109, 10018–10023. [Google Scholar] [CrossRef] [PubMed] [Green Version]
- Lukas, J.; Cozma, C.; Yang, F.; Kramp, G.; Meyer, A.; Nesslauer, A.M.; Eichler, S.; Bottcher, T.; Witt, M.; Brauer, A.U.; et al. Glucosylsphingosine causes hematological and visceral changes in mice-evidence for a pathophysiological role in Gaucher disease. Int. J. Mol. Sci. 2017, 18, 2192. [Google Scholar] [CrossRef] [Green Version]
- Marshall, J.; Sun, Y.; Bangari, D.S.; Budman, E.; Park, H.; Nietupski, J.B.; Allaire, A.; Cromwell, M.A.; Wang, B.; Grabowski, G.A.; et al. CNS-accessible inhibitor of glucosylceramide synthase for substrate reduction therapy of neuronopathic Gaucher disease. Mol Ther. 2016, 24, 1019–1029. [Google Scholar] [CrossRef] [Green Version]
- Mistry, P.K.; Liu, J.; Yang, M.; Nottoli, T.; McGrath, J.; Jain, D.; Zhang, K.; Keutzer, J.; Chuang, W.L.; Mehal, W.Z.; et al. Glucocerebrosidase gene-deficient mouse recapitulates Gaucher disease displaying cellular and molecular dysregulation beyond the macrophage. Proc. Natl. Acad. Sci. USA 2010, 107, 19473–19478. [Google Scholar] [CrossRef] [Green Version]
- Pandey, M.K.; Burrow, T.A.; Rani, R.; Martin, L.J.; Witte, D.; Setchell, K.D.; McKay, M.A.; Magnusen, A.F.; Zhang, W.; Liou, B.; et al. Complement drives glucosylceramide accumulation and tissue inflammation in Gaucher disease. Nature 2017, 543, 108–112. [Google Scholar] [CrossRef]
- Pavlova, E.V.; Archer, J.; Wang, S.; Dekker, N.; Aerts, J.M.; Karlsson, S.; Cox, T.M. Inhibition of UDP-glucosylceramide synthase in mice prevents Gaucher disease-associated B-cell malignancy. J. Pathol. 2015, 235, 113–124. [Google Scholar] [CrossRef]
- Pavlova, E.V.; Wang, S.Z.; Archer, J.; Dekker, N.; Aerts, J.M.; Karlsson, S.; Cox, T.M. B cell lymphoma and myeloma in murine Gaucher’s disease. J. Pathol. 2013, 231, 88–97. [Google Scholar] [CrossRef]
- Rocha, E.M.; Smith, G.A.; Park, E.; Cao, H.; Graham, A.R.; Brown, E.; McLean, J.R.; Hayes, M.A.; Beagan, J.; Izen, S.C.; et al. Sustained systemic glucocerebrosidase inhibition induces brain alpha-synuclein aggregation, microglia and complement C1q activation in mice. Antioxid. Redox Signal. 2015, 23, 550–564. [Google Scholar] [CrossRef] [Green Version]
- Sardi, S.P.; Viel, C.; Clarke, J.; Treleaven, C.M.; Richards, A.M.; Park, H.; Olszewski, M.A.; Dodge, J.C.; Marshall, J.; Makino, E.; et al. Glucosylceramide synthase inhibition alleviates aberrations in synucleinopathy models. Proc. Natl. Acad. Sci. USA 2017, 114, 2699–2704. [Google Scholar] [CrossRef] [PubMed] [Green Version]
- Smith, N.J.; Fuller, M.; Saville, J.T.; Cox, T.M. Reduced cerebral vascularization in experimental neuronopathic Gaucher disease. J. Pathol. 2018, 244, 120–128. [Google Scholar] [CrossRef] [PubMed]
- Taguchi, Y.V.; Liu, J.; Ruan, J.; Pacheco, J.; Zhang, X.; Abbasi, J.; Keutzer, J.; Mistry, P.K.; Chandra, S.S. Glucosylsphingosine promotes alpha-synuclein pathology in mutant GBA-associated Parkinson’s disease. J. Neurosci. 2017, 37, 9617–9631. [Google Scholar] [CrossRef] [PubMed] [Green Version]
- Vardi, A.; Zigdon, H.; Meshcheriakova, A.; Klein, A.D.; Yaacobi, C.; Eilam, R.; Kenwood, B.M.; Rahim, A.A.; Massaro, G.; Merrill, A.H., Jr.; et al. Delineating pathological pathways in a chemically induced mouse model of Gaucher disease. J. Pathol. 2016, 239, 496–509. [Google Scholar] [CrossRef] [PubMed]
- Sun, Y.; Liou, B.; Ran, H.; Skelton, M.R.; Williams, M.T.; Vorhees, C.V.; Kitatani, K.; Hannun, Y.A.; Witte, D.P.; Xu, Y.H.; et al. Neuronopathic Gaucher disease in the mouse: Viable combined selective saposin C deficiency and mutant glucocerebrosidase (V394L) mice with glucosylsphingosine and glucosylceramide accumulation and progressive neurological deficits. Hum. Mol. Genet. 2010, 19, 1088–1097. [Google Scholar] [CrossRef] [PubMed] [Green Version]
- Sun, Y.; Zhang, W.; Xu, Y.H.; Quinn, B.; Dasgupta, N.; Liou, B.; Setchell, K.D.; Grabowski, G.A. Substrate compositional variation with tissue/region and Gba1 mutations in mouse models-implications for Gaucher disease. PLoS ONE 2013, 8, e57560. [Google Scholar] [CrossRef] [Green Version]
- Bodennec, J.; Trajkovic-Bodennec, S.; Futerman, A.H. Simultaneous quantification of lyso-neutral glycosphingolipids and neutral glycosphingolipids by N-acetylation with [3H] acetic anhydride. J. Lipid Res. 2003, 44, 1413–1419. [Google Scholar] [CrossRef] [Green Version]
- Cabrera-Salazar, M.A.; Bercury, S.D.; Ziegler, R.J.; Marshall, J.; Hodges, B.L.; Chuang, W.L.; Pacheco, J.; Li, L.; Cheng, S.H.; Scheule, R.K. Intracerebroventricular delivery of glucocerebrosidase reduces substrates and increases lifespan in a mouse model of neuronopathic Gaucher disease. Exp. Neurol. 2010, 225, 436–444. [Google Scholar] [CrossRef]
- Cabrera-Salazar, M.A.; Deriso, M.; Bercury, S.D.; Li, L.; Lydon, J.T.; Weber, W.; Pande, N.; Cromwell, M.A.; Copeland, D.; Leonard, J.; et al. Systemic delivery of a glucosylceramide synthase inhibitor reduces CNS substrates and increases lifespan in a mouse model of type 2 Gaucher disease. PLoS ONE 2012, 7, e43310. [Google Scholar] [CrossRef] [Green Version]
- Sun, Y.; Ran, H.; Liou, B.; Quinn, B.; Zamzow, M.; Zhang, W.; Bielawski, J.; Kitatani, K.; Setchell, K.D.; Hannun, Y.A.; et al. Isofagomine in vivo effects in a neuronopathic Gaucher disease mouse. PLoS ONE 2011, 6, e19037. [Google Scholar] [CrossRef]
- Sun, Y.; Liou, B.; Xu, Y.H.; Quinn, B.; Zhang, W.; Hamler, R.; Setchell, K.D.; Grabowski, G.A. Ex vivo and in vivo effects of isofagomine on acid beta-glucosidase variants and substrate levels in Gaucher disease. J. Biol. Chem. 2012, 287, 4275–4287. [Google Scholar] [CrossRef] [PubMed] [Green Version]
- Raghavan, S.S.; Mumford, R.A.; Kanfer, J.N. Isolation and characterization of glucosylsphingosine from Gaucher’s spleen. J. Lipid Res. 1974, 15, 484–490. [Google Scholar] [PubMed]
- Aflaki, E.; Stubblefield, B.K.; Maniwang, E.; Lopez, G.; Moaven, N.; Goldin, E.; Marugan, J.; Patnaik, S.; Dutra, A.; Southall, N.; et al. Macrophage models of Gaucher disease for evaluating disease pathogenesis and candidate drugs. Sci. Transl. Med. 2014, 6, 240ra73. [Google Scholar] [CrossRef] [PubMed] [Green Version]
- Aflaki, E.; Westbroek, W.; Sidransky, E. The complicated relationship between Gaucher disease and Parkinsonism: Insights from a rare disease. Neuron 2017, 93, 737–746. [Google Scholar] [CrossRef] [PubMed] [Green Version]
- Igisu, H.; Hamasaki, N.; Ito, A.; Ou, W. Inhibition of cytochrome c oxidase and hemolysis caused by lysosphingolipids. Lipids 1988, 23, 345–348. [Google Scholar] [CrossRef] [PubMed]
- Nair, S.; Boddupalli, C.S.; Verma, R.; Liu, J.; Yang, R.; Pastores, G.M.; Mistry, P.K.; Dhodapkar, M.V. Type II NKT-TFH cells against Gaucher lipids regulate B-cell immunity and inflammation. Blood 2015, 125, 1256–1271. [Google Scholar] [CrossRef] [PubMed] [Green Version]
- Reed, M.C.; Schiffer, C.; Heales, S.; Mehta, A.B.; Hughes, D.A. Impact of sphingolipids on osteoblast and osteoclast activity in Gaucher disease. Mol. Genet. Metab. 2018, 124, 278–286. [Google Scholar] [CrossRef]
- Sasagasako, N.; Kobayashi, T.; Yamaguchi, Y.; Shinnoh, N.; Goto, I. Glucosylceramide and glucosylsphingosine metabolism in cultured fibroblasts deficient in acid beta-glucosidase activity. J. Biochem. 1994, 115, 113–119. [Google Scholar] [CrossRef]
- Schueler, U.H.; Kolter, T.; Kaneski, C.R.; Blusztajn, J.K.; Herkenham, M.; Sandhoff, K.; Brady, R.O. Toxicity of glucosylsphingosine (glucopsychosine) to cultured neuronal cells: A model system for assessing neuronal damage in Gaucher disease type 2 and 3. Neurobiol. Dis. 2003, 14, 595–601. [Google Scholar] [CrossRef]
- Westbroek, W.; Nguyen, M.; Siebert, M.; Lindstrom, T.; Burnett, R.A.; Aflaki, E.; Jung, O.; Tamargo, R.; Rodriguez-Gil, J.L.; Acosta, W.; et al. A new glucocerebrosidase-deficient neuronal cell model provides a tool to probe pathophysiology and therapeutics for Gaucher disease. Dis. Model. Mech. 2016, 9, 769–778. [Google Scholar] [CrossRef] [Green Version]
- Xu, Y.H.; Xu, K.; Sun, Y.; Liou, B.; Quinn, B.; Li, R.H.; Xue, L.; Zhang, W.; Setchell, K.D.; Witte, D.; et al. Multiple pathogenic proteins implicated in neuronopathic Gaucher disease mice. Hum. Mol. Genet. 2014, 23, 3943–3957. [Google Scholar] [CrossRef] [PubMed] [Green Version]
- Sun, Y.; Florer, J.; Mayhew, C.N.; Jia, Z.; Zhao, Z.; Xu, K.; Ran, H.; Liou, B.; Zhang, W.; Setchell, K.D.; et al. Properties of neurons derived from induced pluripotent stem cells of Gaucher disease type 2 patient fibroblasts: Potential role in neuropathology. PLoS ONE 2015, 10, e0118771. [Google Scholar] [CrossRef] [Green Version]
- Giri, S.; Khan, M.; Rattan, R.; Singh, I.; Singh, A.K. Krabbe disease: Psychosine-mediated activation of phospholipase A2 in oligodendrocyte cell death. J. Lipid Res. 2006, 47, 1478–1492. [Google Scholar] [CrossRef] [Green Version]
- Hannun, Y.A.; Bell, R.M. Lysosphingolipids inhibit protein kinase C: Implications for the sphingolipidoses. Science 1987, 235, 670–674. [Google Scholar] [CrossRef] [PubMed]
- Im, D.S.; Heise, C.E.; Nguyen, T.; O’Dowd, B.F.; Lynch, K.R. Identification of a molecular target of psychosine and its role in globoid cell formation. J. Cell Biol. 2001, 153, 429–434. [Google Scholar] [CrossRef] [PubMed] [Green Version]
- Taketomi, T.; Kawamura, N.; Hara, A.; Murakami, S. Comparative studies on chemical, hemolytic and diffusion-in-gel precipitation properties of various lysosphingolipids. Biochim. Biophys. Acta 1976, 424, 106–113. [Google Scholar] [PubMed]
- Aflaki, E.; Borger, D.K.; Moaven, N.; Stubblefield, B.K.; Rogers, S.A.; Patnaik, S.; Schoenen, F.J.; Westbroek, W.; Zheng, W.; Sullivan, P.; et al. A new glucocerebrosidase chaperone reduces alpha-synuclein and glycolipid levels in iPSC-derived dopaminergic neurons from patients with Gaucher disease and Parkinsonism. J. Neurosci. 2016, 36, 7441–7452. [Google Scholar] [CrossRef]
- Ridley, C.M.; Thur, K.E.; Shanahan, J.; Thillaiappan, N.B.; Shen, A.; Uhl, K.; Walden, C.M.; Rahim, A.A.; Waddington, S.N.; Platt, F.M.; et al. beta-Glucosidase 2 (GBA2) activity and imino sugar pharmacology. J. Biol. Chem. 2013, 288, 26052–26066. [Google Scholar] [CrossRef] [Green Version]
- Kuo, C.L.; Kallemeijn, W.W.; Lelieveld, L.T.; Mirzaian, M.; Zoutendijk, I.; Vardi, A.; Futerman, A.H.; Meijer, A.H.; Spaink, H.P.; Overkleeft, H.S.; et al. In vivo inactivation of glycosidases by conduritol B epoxide and cyclophellitol as revealed by activity-based protein profiling. Febs. J. 2019, 286, 584–600. [Google Scholar] [CrossRef] [Green Version]
- Sun, Y.; Zhang, W. Glycosphingolipid aspects of Gaucher disease lipidomics. Future Med. 2013. [Google Scholar] [CrossRef]
- Stirnemann, J.; Belmatoug, N.; Camou, F.; Serratrice, C.; Froissart, R.; Caillaud, C.; Levade, T.; Astudillo, L.; Serratrice, J.; Brassier, A.; et al. A Review of Gaucher Disease Pathophysiology, Clinical Presentation and Treatments. Int. J. Mol. Sci. 2017, 18, 441. [Google Scholar] [CrossRef] [PubMed]
- Nair, S.; Branagan, A.R.; Liu, J.; Boddupalli, C.S.; Mistry, P.K.; Dhodapkar, M.V. Clonal immunoglobulin against lysolipids in the origin of myeloma. N. Engl. J. Med. 2016, 374, 555–561. [Google Scholar] [CrossRef] [PubMed]
- Cozma, C.; Iurascu, M.; Mascher, H.; Rolfs, A. Quantification of glucosylsphingosine (luso-Gb1) for the diagnosis and monitoring of Gaucher disease. Mol. Genet. Metab. 2018, 123, S35. [Google Scholar]
- Mao, X.Y.; Burgunder, J.M.; Zhang, Z.J.; An, X.K.; Zhang, J.H.; Yang, Y.; Li, T.; Wang, Y.C.; Chang, X.L.; Peng, R. Association between GBA L444P mutation and sporadic Parkinson’s disease from Mainland China. Neurosci. Lett. 2010, 469, 256–259. [Google Scholar] [CrossRef] [PubMed]
- de Fost, M.; Hollak, C.E.; Groener, J.E.; Aerts, J.M.; Maas, M.; Poll, L.W.; Wiersma, M.G.; Haussinger, D.; Brett, S.; Brill, N.; et al. Superior effects of high-dose enzyme replacement therapy in type 1 Gaucher disease on bone marrow involvement and chitotriosidase levels: A 2-center retrospective analysis. Blood 2006, 108, 830–835. [Google Scholar] [CrossRef] [Green Version]
- Luan, Z.; Li, L.; Higaki, K.; Nanba, E.; Suzuki, Y.; Ohno, K. The chaperone activity and toxicity of ambroxol on Gaucher cells and normal mice. Brain Dev. 2013, 35, 317–322. [Google Scholar] [CrossRef]
- Savostyanova, K.; Pushkova, A.; Mura’vovaa, L.; Movsisyana, G.; Rykunovaa, A.; Ponomarevb, R.; Lukinab, K.; Lukinab, E.; Namazova-Baranovaa, L. Glucosylfingosine (lyso-GL1) may be the primary biomarker for screening Gaucher disease in Russian patients [Abstract number 318]. Mol. Genet. Metab. 2019, 126, S130. [Google Scholar]
- Saville, J.T.; McDermott, B.K.; Chin, S.J.; Fletcher, J.M.; Fuller, M. Expanding the clinical utility of glucosylsphingosine for Gaucher disease. J. Inherit. Metab. Dis. 2020, 43, 558–563. [Google Scholar] [CrossRef]
- Polo, G.; Burlina, A.P.; Ranieri, E.; Colucci, F.; Rubert, L.; Pascarella, A.; Duro, G.; Tummolo, A.; Padoan, A.; Plebani, M.; et al. Plasma and dried blood spot lysosphingolipids for the diagnosis of different sphingolipidoses: A comparative study. Clin. Chem. Lab. Med. 2019, 57, 1863–1874. [Google Scholar] [CrossRef]
- Burlina, A.; Polo, G.; Rubert, L.; Gueraldi, D.; Cazzorla, C.; Duro, G.; Salviati, L.; Burlina, A. Implementation of Second-Tier Tests in Newborn Screening for Lysosomal Disorders in North Eastern Italy. Int. J. Neonatal. Screen. 2019, 5, 24. [Google Scholar] [CrossRef] [Green Version]
- Bender, F.; Burin, M.G.; Tirelli, K.M.; Medeiros, F.; Bitencourt, F.H.; Civallero, G.; Kubaski, F.; Bravo, H.; Daher, A.; Carnier, V.; et al. Newborn screening for lysosomal disorders in Brazil: A pilot study using customized fluorimetric assays. Genet. Mol. Biol. 2020, 43, e20180334. [Google Scholar] [CrossRef] [PubMed]
- Cullufi, P.; Tabaku, M.; Beetz, C.; Tomori, S.; Velmishi, V.; Gjikopulli, A.; Bauer, P.; Wirth, S.; Rolfs, A. Comprehensive clinical, biochemical and genetic screening reveals four distinct GBA genotypes as underlying variable manifestation of Gaucher disease in a single family. Mol. Genet. Metab. Rep. 2019, 21, 100532. [Google Scholar] [CrossRef] [PubMed]
- Peterschmitt, M.J.; Foster, M.C.; Zhang, K.; Ji, A.; Cox, G. Correlations between glucosylsphingosine (lyso-GL-1) and baseline disease severity as well as response to treatment in two clinical trials of eliglustat in treatment-naïve adults with type 1 Gaucher disease (abstract number 281). Mol. Genet. Metab. 2019, 126, S117. [Google Scholar] [CrossRef]
- Dao, J.; Goker-Alpan, O.; Limgala, R. Evaluation of disease burden and therapy modifications using glucosylsphingosine (lyso-GL1) in Gaucher disease (abstract number 81). Mol. Genet. Metab. 2019, 126, S45. [Google Scholar] [CrossRef]
- Dinur, T.; Zimran, A.; Becker-Cohen, M.; Arkadir, D.; Cozma, C.; Hovakimyan, M.; Oppermann, S.; Demuth, L.; Rolfs, A.; Revel-Vilk, S. Long term follow-up of 103 untreated adult patients with type 1 Gaucher disease. J. Clin. Med. 2019, 8, 1662. [Google Scholar] [CrossRef] [Green Version]
- Hurvitz, N.; Dinur, T.; Becker-Cohen, M.; Cozma, C.; Hovakimyan, M.; Oppermann, S.; Demuth, L.; Rolfs, A.; Abramov, A.; Zimran, A.; et al. Glucosylsphingosine (lyso-Gb1) as a biomarker for monitoring treated and untreated children with Gaucher disease. Int. J. Mol. Sci. 2019, 20, 3033. [Google Scholar] [CrossRef] [Green Version]
- Cozma, C.; Cullufi, P.; Kramp, G.; Hovakimyan, M.; Velmishi, V.; Gjikopulli, A.; Tomori, S.; Fischer, S.; Oppermann, S.; Grittner, U.; et al. Treatment Efficiency in Gaucher Patients Can Reliably Be Monitored by Quantification of Lyso-Gb1 Concentrations in Dried Blood Spots. Int. J. Mol. Sci. 2020, 21, 4577. [Google Scholar] [CrossRef]
- Jones, M.G.; Blake, D.; Heidelberger, S.M.; Turner, C.; Dalton, R.N.; Cregeen, D.; Jackson, M. Plasma lysosphingolipid analysis by LC-DMS-MS/MS: Rapid sample preparation and resolution of stereoisomers (Abstract P-451). J. Inherit. Metab. Dis. 2019, 42. [Google Scholar]
- Smith, S.E.; Longua, M.; DiPerna, J. Quantitative measurement of glucosylsphingosine (lysoGb1) and galactosylsphingosine (psychosine) from dried blood spots. Presented at the 15th Annual WORLD Symposium, Orlando, FL, USA, 4–8 February 2019. [Google Scholar]
- Zakaria, R.; Allen, K.J.; Koplin, J.J.; Roche, P.; Greaves, R.F. Advantages and Challenges of Dried Blood Spot Analysis by Mass Spectrometry Across the Total Testing Process. EJIFCC 2016, 27, 288–317. [Google Scholar]
- de Vries, R.; Barfield, M.; van de Merbel, N.; Schmid, B.; Siethoff, C.; Ortiz, J.; Verheij, E.; van Baar, B.; Cobb, Z.; White, S.; et al. The effect of hematocrit on bioanalysis of DBS: Results from the EBF DBS-microsampling consortium. Bioanalysis 2013, 5, 2147–2160. [Google Scholar] [CrossRef]
- Moher, D.; Shamseer, L.; Clarke, M.; Ghersi, D.; Liberati, A.; Petticrew, M.; Shekelle, P.; Stewart, L.A. Preferred reporting items for systematic review and meta-analysis protocols (PRISMA-P) 2015 statement. Syst. Rev. 2015, 4, 1. [Google Scholar] [CrossRef] [PubMed] [Green Version]
- National Institute for Health and Care Excellence, NICE Technology Appraisal Guidance. 2018. Available online: https://www.nice.org.uk/about/what-we-do/our-programmes/nice-guidance/nice-technology-appraisal-guidance (accessed on 22 July 2019).
- Wells, G.A.; Shea, B.; O’Connell, D.; Peterson, J.; Welch, V.; Losos, M.; Tugwell, P. The Newcastle-Ottawa Scale (NOS) for Assessing the Quality If Nonrandomized Studies in Meta-Analyses. 2012. Available online: http://www.ohri.ca/programs/clinical_epidemiology/oxford.asp (accessed on 20 November 2019).
- Hooijmans, C.R.; Rovers, M.M.; de Vries, R.B.; Leenaars, M.; Ritskes-Hoitinga, M.; Langendam, M.W. SYRCLE’s risk of bias tool for animal studies. BMC Med. Res. Methodol. 2014, 14, 43. [Google Scholar] [CrossRef] [PubMed] [Green Version]


| Author(s), Year (Reference) | Study Design | Sample: GD Variant (n) | Lyso-Gb1 Assay Method | Lyso-Gb1 Level | Key Finding |
| Raghavan et al., 1974 [93] | Retrospective | Spleen: type 1 (n = 2) | LC and GLC analysis | 5.3 µmol/100 g wet tissue a | First time lyso-Gb1 isolated from GD spleen |
| Nilsson et al., 1982 [55] | Prospective | Spleen: type 1 (n = 4), type 2 (n = 3), type 3 (n = 12). Liver: type 2 (n = 3), type 3 (n = 9) | GLC and MS | Spleen (mmol/kg): type 1, 0.07; type 2, 0.16; type 3, 0.19. Liver (mmol/kg): type 2, 0.09; splenectomized type 3, 0.16; non-splenectomized type 3, 0.06 | High lyso-Gb1 concentrations were deemed a contributing factor behind commonly seen visceral pathology in patients with GD |
| Nilsson and Svennerholm, 1982 [56] | Retrospective, case control | Cerebrum/cerebellum b: type 2 (n = 5), type 3 (n = 8), type unconfirmed [1 or 3] (n = 1), control (n = 20) | LC and densitometry | Type 2 had the highest level (4–12 µmol/kg), some 2 to 3 orders of magnitude higher than in control brain | Lyso-Gb1, never detected in normal human brain, was demonstrated at high levels in brains from all patients with GD |
| Conradi et al., 1984 [62] | Retrospective | Cerebral cortex: type 3 (n = 5) | HPTLC | 0.3–6.3 µmol/kg versus undetectable levels in controls | Highest lyso-Gb1 concentrations seen in cases with the most advanced nerve cell loss |
| Nilsson et al., 1985 [54] | Retrospective | Liver and brain: type 1 (n = 2), control (n = 5) | TLC and densitometry | Patient 1 (µmol/kg wet weight): spleen, 0.16; liver, 0.10; cerebral cortex, 2.4; cerebellar cortex, 1.7. Patient 2 (µmol/kg wet weight): spleen, 0.14; liver, 0.04; cerebral cortex, 0.2; cerebellar cortex, 0.06. Controls: undetectable | Hepatic lyso-Gb1 2-fold greater in a severely affected 3-year-old American Black patient compared with a 56-year-old Ashkenazi Jewish patient. Lyso-Gb1 was found in large amounts only in cerebral and cerebellar cortices from the severely affected patient |
| Orvisky et al., 2000 [58] | Retrospective, case control | Fetal tissue (brain, liver, and spleen): type 2 (n = 2), control (n = 3) | LC and HPLC then fluorescence quantitation | Spleen: 190 ng/mg protein; liver: 92–114 ng/mg protein c; brain: 305–437 ng/mg protein c. Control samples: <0.3 ng/mg protein | Lyso-Gb1 was elevated relative to human control samples |
| Orvisky et al., 2002 [57] | Prospective, case control | Spleen: type 1 (n = 8), type 2 (n = 4), type 3 (n = 4). Brain: type 1 (n = 1), type 2 (n = 8), type 3 (n = 4). Control (n = 9) | HPLC then fluorescence quantitation | Spleen (ng/mg protein): type 1, 54–728; type 2, 133–1200; type 3, 109–1298. Brain (ng/mg protein): type 1, 1.0 (normal); type 2, 24–437; type 3, 14–32. Control samples: 0 ng/mg protein | Lyso-Gb1 accumulation in the brain correlated with CNS involvement but splenic lyso-Gb1 levels bore no relation to the type of GD, the age of the patient, the genotype, or the clinical course |
| Park et al., 2003 [59] | Retrospective, case control | Brain: type 3 with progressive myoclonic epilepsy (n = 2), control (n = 9) | HPLC then fluorescence quantitation | Brain (ng/mg protein): type 3, 22 and 32; control: 0.04–1.2 | 35- to 50-fold increase in brain lyso-Gb1 concentrations observed in two patients with type 3 GD relative to controls |
| Tayebi et al., 2003 [61] | Retrospective, case control | Brain: type 1 (n = 3). Historical controls: type 1 (n = 3), type 2 (n = 8), type 3 (n = 4). Healthy control: (n = 9) | HPLC then fluorescence quantitation | Brain: type 1, 0.4–1.3 ng/mg protein. Historical controls (ng/mg protein): type 1, 0.9–1.4; type 2, 24–437; type 3, 14–32. Healthy control: 0.04–1.2 ng/mg protein | Brain lyso-Gb1 concentrations were in the normal range among three patients with type 1 GD |
| Lloyd-Evans et al., 2003 [63] | Case control | Brain: type 2 (n = 1), control (n = 1) | Acetylation with 3H-acetic anhydride | Brain (ng/mg protein): type 2, 4.88; control, 0 | Lyso-Gb1 detected in the type 2 GD brain with no detectable levels in control brain microsomes |
| Author(s), Year (Reference) | Sample | Observation | Strength of Association with Lyso-Gb1 a |
|---|---|---|---|
| Human Cells | |||
| Hannun et al., 1987 [105] | Mixed micelles and human platelets | Aberrant signal transduction: exogenous lyso-Gb1 inhibited protein kinase C | Induction |
| Im et al., 2001 [106] | HEK293 cells and RH7777 cells (rat) | Globoid cell formation: exogenous lyso-Gb1 evoked giant multinucleated cell formation via activation of the proton-sensing G protein–coupled receptor T-cell death-associated gene 8 | Induction |
| Schueler et al., 2003 [100] | Cultured human cholinergic neuron-like LA-N-2 cells | Cytotoxicity: exogenous lyso-Gb1 cytotoxic to cultured human cholinergic neuron-like LA-N-2 cells. Partial recovery when cells switched to lyso-Gb1-free medium | Induction |
| Giri et al., 2006 [104] | M03.13 cell line: Immortal human–human hybrid cell line expressing phenotypic characteristics of primary oligodendrocytes | Pro-inflammatory: lyso-Gb1 induces arachidonic acid release in oligodendrocytes | Induction |
| Sun et al., 2015 [103] | Neural precursor cells and neurons differentiated from pluripotent stem cells derived from fibroblasts collected from a patient with type 2 GD, a heterozygous carrier (L444P and 1483G > C and 1497G > C), and a control | Electrophysiologic: CBE-treated control neurons had significantly increased lyso-Gb1 and altered physiological properties comparable to those from type 2 GD-derived neurons | Incidental |
| Nair et al., 2015 [97] | Human and murine type 2 natural killer T cells expressing the T-follicular helper phenotype | Pro-inflammatory: frequency of lyso-Gb1-specific T cells in GD mouse models and patients correlates with disease activity and therapeutic response | Correlative |
| Aflaki et al., 2016 [108] | Pluripotent stem cell-derived dopaminergic neurons derived from fibroblasts collected from patients with type 1 and 2 GD with Parkinsonism | Cytotoxicity: α-synuclein and lyso-Gb1 elevated in neurons from patients with parkinsonism or type 2 GD. Effect reversed by NCGC607, a small-molecule non-inhibitory chaperone of GBA | Incidental |
| Smith et al., 2018 [83] | Cultures of human umbilical vein endothelial cells | Cytotoxicity: exogenous lyso-Gb1 concentration-dependent impairment of endothelial cytokinesis | Induction |
| Reed et al., 2018 [98] | Osteoblasts differentiated from mesenchymal stem cells isolated from bone marrow aspirates of patients with type 1 GD and control subjects | Impaired osteoblasts: exogenous lyso-Gb1 reduced mesenchymal stem cell viability, potential for differentiating into osteoblasts, and reduced calcium deposition of these osteoblasts | Induction |
| Animal Cells | |||
| Taketomi et al., 1976 [107] | Animal RBCs | Cytotoxicity: exogenous lyso-Gb1 lyses RBCs | Induction |
| Igisu et al., 1988 [96] | Rat liver mitochondria | Metabolic: exogenous lyso-Gb1 inhibited cytochrome c oxidase | Induction |
| Atsumi et al., 1993 [64] | NIH 3T3 (mouse fibroblast) cells and PC12 (rat neural-crest-derived neoplastic) cells | Cytotoxicity: lyso-Gb1 was directly cytotoxic to both cell lines | Induction |
| Liu et al., 2012 [74] | GBA1 gene deletion in hematopoietic and mesenchymal lineages (knockout/LoxP/Mx1) | Immune dysregulation: exogenous lyso-Gb1 inhibited by >50% the proliferation of HSC precursors. Proliferation of GBA-deficient HSCs inhibited by Gb1 and lyso-Gb1 | Induction |
| Xu et al., 2014 [102] | Newborn neural cells from type 3 GD mouse model | Cytotoxicity: amyloid precursor protein/α-synuclein accumulation in neural cells correlated with increased cellular Gb1 and lyso-Gb1 levels | Correlation |
| Westbroek et al., 2016 [101] | Immortalized cortical neurons from embryonic null allele GBA−/− mice and the control littermate (GBA+/+) | Cellular pathology: lyso-Gb1 accumulation associated with enlarged lysosomes, and an impaired ATP-dependent calcium-influx response | Incidental |
| Taguchi et al., 2017 [84] | GBA mutant (N370S, L444P) and knockout mouse models crossed with an α-synuclein transgenic PD mouse | Cytotoxicity: lyso-Gb1 accumulation promoted α-synuclein aggregation | Induction |
| Author(s), Year (Reference) | Sample | Observation | Strength of Association with Lyso-Gb1 a |
|---|---|---|---|
| Pharmacologically Induced GD | |||
| Rocha et al., 2015 [81] | Murine: wild-type treated with CBE b or vehicle | Brain α-synuclein aggregation, region-specific pre-degenerative changes, and neurodegeneration. Microglia and complement C1q activation | Incidental |
| Marshall et al., 2016 [76] | Murine: wild-type treated with CBE | Ibiglustatb reduced elevated levels of lyso-Gb1 in the liver and brain by >70% and >20%, respectively, relative to controls. Ibiglustat reduced the extent of gliosis and neurobehavioral deficits | Incidental |
| Vardi et al., 2016 [85] | Murine: wild-type treated with CBE | The average day of death of the mice correlated with Gb1 levels (r2 = 0.91) and lyso-Gb1 levels (r2 = 0.83) | Correlation |
| Lukas et al., 2017 [75] | Murine: wild-type treated with lyso-Gb1 | Reduced Hb and hematocrit, increased spleen weights, and a slight inflammatory tissue response | Induction |
| D409V Point Mutation | |||
| Pandey et al., 2017 [78] | Murine: heteroallelicmutations in GBA1, a point mutation, and a D409V knockout (GBA19V/−) | Lyso-Gb1-specific IgG2a autoantibodies not detected in wild-type and GBA19V/− mice | Cause and lack of effect |
| Conditional Type 1 GD | |||
| Mistry et al., 2010 [77] | GBA1 gene deletion in hematopoietic and mesenchymal lineages (knockout/LoxP/Mx1) | Hepatosplenomegaly, anemia, thrombocytopenia, and accumulation of storage cells in the liver, spleen, bone marrow, lymph nodes, and thymus. Inhibition of PKC-mediated osteoblast proliferation and early differentiation. PMA-induced precursor proliferation. Splenomegaly correlated with the tissue content of Gb1 and lyso-Gb1 | Incidental |
| Liu et al., 2012 [74] | GBA1 gene deletion in hematopoietic and mesenchymal lineages (knockout/LoxP/Mx1) | Correlation between splenic lyso-Gb1 levels and splenomegaly (r2 = 0.48; p = 0.00004) | Correlation |
| Mistry et al., 2014 [45] | Murine: double-mutant Mx1-Cre+:GD1:GBA2−/− | Despite elevated lyso-Gb1 levels, concomitant deletion of the GBA2 gene in GD1 mice rescued hepatosplenomegaly, cytopenia, osteopenia, and hypercytokinemia | Incidental |
| Pavlova et al., 2015 [79] | Murine: GBAtm1Karl/tm1KarlTg(Mx1-Cre)1Cgn/0 versus induced GBAtm1Karl/tm1Karl and GBAtm1Karl/+ genotypes | Elevated lyso-Gb1 was associated with occurrence of B-cell lymphomas and monoclonal gammopathy | Incidental |
| Neuronal GD | |||
| Cabrera-Salazar et al., 2010 [89] | Murine: K-14Cre+ GBAlnl/lnl and wild-type | Intracerebroventricular administration of recombinant human GBA produced dose-dependent reductions in brain lyso-Gb1 level and improved survival | Correlation |
| Cabrera-Salazar et al., 2012 [90] | Murine: K-14Cre+ GBAlnl/lnl and wild-type | Intraperitoneal administration of a glucosylceramide synthase inhibitor reduced brain lyso-Gb1 level and improved survival | Incidental |
| Farfel-Becker et al., 2013 [70] | Neuronopathic GD murine: GBAflox/flox; nestin-Cre | No neuronal loss | Correlation |
| Smith et al., 2018 [83] | Type 2 murine: K-14Cre+ GBAlnl/lnl versus wild-type | Diminished cerebral microvascular density | Incidental |
| Dasgupta et al., 2015 [68] | Type 3 (subacute) murine: transgenic 4L;C*h | Activated microglial cells, reduced number of neurons, and aberrant mitochondrial function in the brain followed by deterioration in motor function | Incidental |
| Dai et al., 2016 [67] | Type 3 (chronic) murine: D409V and null alleles (9V/null) | α-synuclein aggregation and hepatosplenomegaly | Incidental |
| Marshall et al., 2016 [76] | Type 3 (subacute) murine: transgenic 4L;C*h | Ibiglustat reduced elevated levels of lyso-Gb1 in the liver and brain by >40%, and also reduced the extent of gliosis and paresis. Ibiglustat-treated 4L;C* mice had a ~30% increase in lifespan | Incidental |
| Sardi et al., 2017 [82] | Type 3 (chronic) murine: D409V/D409 alleles (9V/9V) | Pathologies associated with α-synuclein aggregation | Incidental |
| Author(s), Year (Reference) | Study Design | Population Type | Key Diagnostic Finding |
|---|---|---|---|
| Incidental Studies | |||
| Moraitou et al., 2014 [46] | Prospective, 2 centers | Type 1 GD (n = 24), type 2 GD (n = 3), healthy controls (n = 13) | Plasma lyso-Gb1 concentrations were elevated >200-fold in patients with type 1 GD relative to controls |
| Mirzaian et al., 2015 [44] | Prospective, single center | Type 1 untreated GD (n = 55), healthy controls (n = 53) | Plasma (median, 230.7 versus 1.3 nM) and urine (median, 1.20 versus 0.01 nM) lyso-Gb1 concentrations were elevated in untreated symptomatic patients with type 1 GD relative to controls |
| Ferraz et al., 2016 b [26] | Prospective, single center | Symptomatic type 1 GD (n = 69), healthy controls (n = 79) | Plasma lyso-Gb1 concentrations were elevated 300-fold in symptomatic patients with type 1 GD relative to controls |
| Franco et al., 2017 [40] | Prospective, multicenter | Type 1 GD and neuronopathic (n = 16) | The RBC membrane lyso-Gb1 concentration in untreated patients with type 1 GD was increased relative to healthy controls (median, 0.69 versus 0.15) |
| Kang et al., 2017 [3] | Prospective, single center | Mixed GD types (n = 9) | Plasma lyso-Gb1 concentrations were 266 ng/mL in eight patients with type 1 GD and 4.7 ng/mL in one child with GD (normal range, 0.17–1.18 ng/mL) |
| Diagnostic Studies Reporting Lyso-Gb1 as a Primary Endpoint | |||
| Dekker et al., 2011 [33] | Prospective, multicenter | Type 1 GD (n = 64), GD carriers (n = 34). Healthy age-matched controls (n = 28) | Plasma lyso-Gb1 concentrations were elevated >200-fold in patients with type 1 GD relative to controls (median, 231 versus 1.3 nM) |
| Rolfs et al., 2013 [50] | Retrospective, single center | Mixed GD (n = 129), b GD carriers (n = 13), healthy controls (n = 148), other LSDs (n = 261) a,c | Patients with GD displayed elevated plasma concentrations of lyso-Gb1 >12 ng/mL whereas the comparison control groups revealed concentrations below this pathological cut-off. The 12 ng/mL cut-off value had 100% sensitivity and specificity |
| Fuller et al., 2015 [41] | Prospective, single center | Mixed GD (n = 15), healthy adults (n = 50), no metabolic disorders (n = 1350), other metabolic disorders (n = 49) | Plasma lyso-Gb1 concentrations were elevated in patients with GD (median, 920 pmol/mL) compared with unaffected controls and patients with 16 other metabolic disorders (median, ≤9 pmol/mL) |
| Murugesan et al., 2016 [47] | Prospective | Untreated type 1 GD (n = 169), healthy controls (n = 41) | Plasma lyso-Gb1 concentrations were elevated >200-fold in patients with type 1 GD relative to controls (181 versus 1.5 ng/mL). A 4 ng/mL cut-off value had 100% sensitivity and specificity |
| Chipeaux et al., 2017 [38] | Prospective, multicenter | Type 1 GD (n = 15)d | Lyso-Gb1 was one to two orders of magnitude higher in both plasma and RBCs of patients with GD compared with healthy controls. Lyso-Gb1 was a more powerful biomarker than Gb1, sphingosine, and sphingosine-1-phosphate |
| Author(s), Year (Reference) | Study Design | Population Type | Key Prognostic Findings |
|---|---|---|---|
| Dekker et al., 2011 [33] | Prospective, multicenter, cross-sectional, observational | Type 1 GD (n = 64), GD carriers (n = 34), healthy controls (n = 28) | Plasma lyso-Gb1 concentrations were lower among N370S GBA homozygous individuals than N370S/L444P GBA patients. Only within the group of N370S GBA homozygous patients was a clear relation between disease severity and plasma lyso-Gb1 concentrations observed. a There was a positive correlation between plasma lyso-Gb1 and liver volume, and a negative correlation with bone marrow fat fraction |
| Rolfs et al., 2013 [50] | Retrospective, single center, observational | Mixed GD (n = 129), GD carriers (n = 13), healthy controls (n = 148), other LSDs (n = 261) b | There were correlations between plasma lyso-Gb1 concentrations and the GBA mutations N370S and L444P. Mutation L444P was associated with higher plasma lyso-Gb1 (median, 185 ng/mL) than the milder N370S mutation (median, 143 ng/mL). Plasma lyso-Gb1 concentrations were higher in homozygous (N370S/N370S, 143 ng/mL; L444P/L444P, 185 ng/mL) than in compound heterozygous (N370S, 77 ng/mL; L444P, 107 ng/mL) GD mutations |
| Ferraz et al., 2016b [26] | Prospective, single center, cross-sectional, observational | Type 1 GD (n = 69), controls (n = 79) | Lyso-Gb1 concentrations were excessive in cultured fibroblasts of a collodion patient with GD (homozygous for the recombination RecNci allele) with virtually no residual GBA activity versus more modest elevations among patients with type 1 GD and neuronopathic variants |
| Elstein et al., 2017 [39] | Exploratory pooled analysis of phase 3 clinical trials | Type 1 GD (n = 22) | Mean plasma lyso-Gb1 concentrations were higher for patients with ≥ 1 allele with the N370S mutation (N370S/N370S or N370S/other, 364 ng/mL; n = 17) than for patients with non-N370S mutations (185 ng/mL; n = 5) |
| Author(s), Year (Reference) | Study Design | Population Type | Treatment | Observation | Strength of Association a |
|---|---|---|---|---|---|
| Narita et al., 2016 [49] | Clinical trial, multicenter, open-label, pilot | Neuronopathic GD (n = 5), healthy controls (n = 37) | ERT plus ambroxol b | As CSF lyso-Gb1 concentrations decreased, myoclonus, seizures, and pupillary light reflex dysfunction markedly improved | Incidental |
| Smid et al., 2016 [51] | Observational, retrospective, longitudinal | Type 1 GD, treatment-naïve, and ERT experienced (n = 17) | ERT (n = 4); SRT: eliglustat (n = 6) or miglustat (n = 9) | As plasma lyso-Gb1 concentrations decreased, platelet counts, Hb, and bone marrow fat fraction increased or stabilized whereas spleen and liver volumes decreased or stabilized | Incidental |
| Mistry et al., 2017 [36] | Clinical trial, phase 3, randomized, multicenter, placebo-controlled, crossover | Type 1 GD and treatment-naïve (n = 40) | SRT: eliglustat | As plasma lyso-Gb1 concentration decreased, platelet counts and Hb increased whereas spleen and liver volumes decreased. Continued eliglustat for 9 more months resulted in incremental improvement of all disease parameters | Incidental |
| Arkadir et al., 2018 [37] | Observational, retrospective, multicenter, longitudinal | Type 1 GD, non-splenectomized, and N370S homozygotes (n = 20) | ERT: imiglucerase (n = 4), taliglucerase alfa (n = 4), or velaglucerase alfa (n = 17) | As plasma lyso-Gb1 concentrations decreased, platelet counts and Hb increased whereas spleen volume decreased from baseline | Incidental |
| Lukina et al., 2019 [43] | Clinical trial, phase 2, multicenter | Type 1 GD and treatment-naïve (n = 26) | SRT: eliglustat for 8 years | As plasma lyso-Gb1 concentrations decreased, platelet counts and Hb increased whereas spleen and liver volumes decreased from baseline. Lumbar spine T-score increased to normal range from baseline | Incidental |
| Mirzaian et al., 2015 [44] | Observational: prospective, single center, case control, cross-sectional | Type 1 GD (n = 55), healthy controls (n = 53) | ERT | Urine lyso-Gb1 concentration correlated with liver volume | Correlation |
| Murugesan et al., 2016 [47] | Observational, prospective, single-center, longitudinal, case control | Type 1 GD (n = 169), healthy controls (n = 41) | ERT (n = 155); SRT: eliglustat (n = 14) | Plasma lyso-Gb1 concentration correlated with hepatomegaly, splenomegaly, and splenectomy | Correlation |
| Chipeaux et al., 2017 [38] | Observational, prospective, multicenter, cross-sectional, case control | Type 1 GD, treatment-naïve, and splenectomized (n = 15); controls (n = 11) | None | Lyso-Gb1 concentrations in plasma and RBC membranes correlated inversely with Hct | Correlation |
| Franco et al., 2017 [40] | Observational, prospective, multicenter, cross-sectional, case control | Type 1 GD and neuronopathic (n = 31) | ERT (n = 15); untreated (n = 16) | Lyso-Gb1 content in GD RBCs correlated with low Hb levels. There were correlations between lyso-Gb1 overload in GD RBC membranes and abnormal deformability and morphology | Correlation |
| Elstein et al., 2017 [39] | Exploratory pooled analysis of phase 3 clinical trials | Type 1 GD and treatment-naïve (n = 22); ERT switch (n = 21) | ERT: velaglucerase alfa | Treatment-naïve patients: decreasing plasma lyso-Gb1 concentrations correlated with increasing platelet counts and decreasing spleen volumes. Patients who switched: there was a moderate correlation between plasma lyso-Gb1 and platelet counts | Correlation |
© 2020 by the authors. Licensee MDPI, Basel, Switzerland. This article is an open access article distributed under the terms and conditions of the Creative Commons Attribution (CC BY) license (http://creativecommons.org/licenses/by/4.0/).
Share and Cite
Revel-Vilk, S.; Fuller, M.; Zimran, A. Value of Glucosylsphingosine (Lyso-Gb1) as a Biomarker in Gaucher Disease: A Systematic Literature Review. Int. J. Mol. Sci. 2020, 21, 7159. https://doi.org/10.3390/ijms21197159
Revel-Vilk S, Fuller M, Zimran A. Value of Glucosylsphingosine (Lyso-Gb1) as a Biomarker in Gaucher Disease: A Systematic Literature Review. International Journal of Molecular Sciences. 2020; 21(19):7159. https://doi.org/10.3390/ijms21197159
Chicago/Turabian StyleRevel-Vilk, Shoshana, Maria Fuller, and Ari Zimran. 2020. "Value of Glucosylsphingosine (Lyso-Gb1) as a Biomarker in Gaucher Disease: A Systematic Literature Review" International Journal of Molecular Sciences 21, no. 19: 7159. https://doi.org/10.3390/ijms21197159