Article

Ultrastructural and Photosynthetic Responses of Pod Walls in Alfalfa to Drought Stress

1
Forage Seed Laboratory, Key Laboratory of Pratacultural Science, Beijing Municipality, China Agricultural University, Beijing 100193, China
2
College of Qinghai-Tibetan Plateau, Southwest Minzu University, Chengdu 610041, China
*
Author to whom correspondence should be addressed.
Int. J. Mol. Sci. 2020, 21(12), 4457; https://doi.org/10.3390/ijms21124457
Submission received: 3 June 2020 / Revised: 20 June 2020 / Accepted: 22 June 2020 / Published: 23 June 2020
(This article belongs to the Special Issue Plant Proteomic Research 3.0)

Abstract

:
Increasing photosynthetic ability as a whole is essential for acquiring higher crop yields. Nonleaf green organs (NLGOs) make important contributions to photosynthate formation, especially under stress conditions. However, there is little information on the pod wall in legume forage related to seed development and yield. This experiment is designed for alfalfa (Medicago sativa) under drought stress to explore the photosynthetic responses of pod walls after 5, 10, 15, and 20 days of pollination (DAP5, DAP10, DAP15, and DAP20) based on ultrastructural, physiological and proteomic analyses. Stomata were evidently observed on the outer epidermis of the pod wall. Chloroplasts had intact structures arranged alongside the cell wall, which on DAP5 were already capable of producing photosynthate. The pod wall at the late stage (DAP20) still had photosynthetic ability under well-watered (WW) treatments, while under water-stress (WS), the structure of the chloroplast membrane was damaged and the grana lamella of thylakoids were blurry. The chlorophyll a and chlorophyll b concentrations both decreased with the development of pod walls, and drought stress impeded the synthesis of photosynthetic pigments. Although the activity of ribulose-1,5-bisphosphate carboxylase (RuBisCo) decreased in the pod wall under drought stress, the activity of phosphoenolpyruvate carboxylase (PEPC) increased higher than that of RuBisCo. The proteomic analysis showed that the absorption of light is limited due to the suppression of the synthesis of chlorophyll a/b binding proteins by drought stress. Moreover, proteins involved in photosystem I and photosystem II were downregulated under WW compared with WS. Although the expression of some proteins participating in the regeneration period of RuBisCo was suppressed in the pod wall subjected to drought stress, the synthesis of PEPC was induced. In addition, some proteins, which were involved in the reduction period of RuBisCo, carbohydrate metabolism, and energy metabolism, and related to resistance, including chitinase, heat shock protein 81-2 (Hsp81-2), and lipoxygenases (LOXs), were highly expressed for the protective response to drought stress. It could be suggested that the pod wall in alfalfa is capable of operating photosynthesis and reducing the photosynthetic loss from drought stress through the promotion of the C4 pathway, ATP synthesis, and resistance ability.

1. Introduction

Photosynthesis is considered as the most important chemical reaction and provides over 90% of dry matter for crop yield formation [1,2]. Increasing crop yield by promoting photosynthesis has been the research hotspot until now [3]. Green leaves are commonly focused as the main source for producing photosynthate. However, nonleaf green organs (NLGOs) have been proven to be practically or potentially capable of assimilating CO2. Many scientists have previously reported that the silique shell of oil rape (Brassica napus) [4]; the boll shell of castor (Ricinus communis) [5]; the pod wall of legume crops, including chickpea (Cicer arietinum) [6], soybean (Glycine max) [7], and alfalfa (Medicago sativa) [8]; ears of cereal including rice (Oryza sativa) [9], barley (Hordeum vulgare) [10], and wheat (Triticum turgidum) [11]; flowers [12], stems [13], and roots [14] in some plants could photosynthesize and make an important contribution to yield formation. In addition, under drought conditions, the photosynthetic contribution of NLGOs turn greater, and NLGOs even become the primary photosynthetic organs for grain-filling [9,15].
Photosynthesis in leaves is sensitive to water deficit. Under water-deficit conditions, the flag leaves of cereal crops will wilt and senesce, while NLGOs are able to maintain relatively high water content due to some special features, including xeromorphic anatomy [9], lower stomatal conductance and transpiration rate [16], and a higher ability for osmotic adjustment [17]. In addition, NLGOs show better photosynthetic performance in the change of stomatal densities [18], chlorophyll concentration [5,19], and photosynthetic enzyme abilities [20] than leaves in response to water deficit. NLGOs have been proved to play an important role in regulating carbon partitioning during grain-filling to compensate for the reduction due to the decrease of photosynthetic ability in leaves [7]. Shreds of evidence based on anatomical, physiological, and molecular research have shown that the high photosynthetic efficiency pathway, C4-like or C3-C4 intermediate photosynthesis, might exist in the NLGOs of C3 crops [11]. Kranz anatomy is considered a crucial characteristic in C4 crops. The ear organs, including glume, lemma, and awn in C3 cereals, have two types of chloroplasts existing, respectively, in two types of cells, mesophyll cells and the cells arranged around the vascular bundles, similar to maize (Zea mays) leaves [11]. One of the key photosynthetic enzymes, phosphoenolpyruvate carboxylase (PEPC), has been detected with activity in NLGOs, and PEPC has a higher ability than ribulose-1,5-bisphosphate carboxylase (RuBisCo) under drought stress [21,22,23]. Besides PEPC, other enzymes, including NAD-dependent malic enzyme (NAD-ME), NADP-dependent malic enzyme (NADP-ME), and NADP-dependent malate dehydrogenase (NADP-MDH) involved in the C4 photosynthetic cycle, have been induced in NLGOs under drought stress [21]. Some genes, including ppc, aat, mdh, me2, gpt, and ppdk, specific to NAD-ME type-C4 photosynthesis, have been identified in wheat caryopsis [24]. However, other scientists have proposed the negative hypothesis that C4 photosynthesis is lacking in C3 crops. Singal et al. reported that CO2 was assimilated by C4 photosynthesis in the pericarp of wheat, but not in awn and glume [25]. A C4 photosynthesis metabolism occurring in C3 crops depends on ontogeny differences, cultivars, and environments like high or low CO2 and heat or drought stress [24,26]. Above all, the response mechanism of carbon fixation in NLGOs to drought stress is still unclear.
Alfalfa is widely cultured around the world to produce high-quality hay for feeding livestock, especially dairy cows. Seed producers have long focused on alfalfa seed yield increase. Moderate drought contributes to achieving higher seed yield during the flowering and seed maturation period. Nevertheless, little is known on the physiological response and the photosynthetic contribution of the pod wall in alfalfa under drought stress. Investigating and increasing the photosynthetic ability of NLGOs, especially under stress conditions, is a novel way to increase the photosynthetic ability of the whole plant and finally increase the grain yield. In this study, physiological, ultrastructural, and proteomic analyses were carried out to (1) investigate the photosynthetic characteristics of the pod wall in alfalfa, and (2) research the response mechanism of photosynthesis in the pod wall to drought stress.

2. Results

2.1. Changes of the Surface Characteristics and Ultrastructure of Pod Wall under Drought Stress

Stomata and epidermal hair were distinctly observed in the outer surface of the pod wall (Figure 1A,B). Stomata were composed of two semilunar guard cells encircled by several subsidiary cells. Stomata were open under both WW and WS, and the thick inner wall of stomata, the bright color part, could be clearly observed. In addition, a hump occurred around the base of epidermal hair, and lots of dots existed on the epidermal hair. Cells of the inner surface of the pod wall were tightly arranged together (Figure 1C).
Under WW, chloroplasts in the pod wall had the ability to photosynthesize from DAP5 to DAP20. Chloroplasts on DAP5 existed with the intact structure and were arranged close to the cell wall (Figure 2A). Chloroplast membrane structure was intact, and grana lamella was arrayed along the long axis of the chloroplast, some of which had already produced starch grains. More and bigger starch grains were produced in the chloroplasts on DAP10 (Figure 2B) and DAP15 (Figure 2C). The pod wall on DAP20 still had photosynthetic activity, while the cells had started to age and the nuclei were degrading. Few osmiophilic granules were found in cells (Figure 2D).
Under WS, chloroplasts were able to produce photosynthate on DAP5 and DAP10, while the structure of chloroplasts was gradually damaged from DAP15 to DAP20. The chloroplasts had intact membrane structures and had already started to produce starch grains on DAP5 (Figure 2E), and they produced more and bigger starch grains on DAP10 (Figure 2F). Lots of starch grains could still be observed on DAP15, while the evident changes occurred in the structure of chloroplasts, i.e., the membrane was partly broken, and the grana lamellae of thylakoids became blurry (Figure 2G). Few starch grains existed on DAP20, while lots of osmiophilic granules were presented. The membrane of chloroplasts was seriously broken, and the structure of thylakoids was blurring (Figure 2H).
Except for chloroplasts, the structure of other organelle or tissues changed under drought stress as well. The central vacuole was bigger in the cell under WW (Figure 2D), while the gap between the central vacuole and the cell wall become wider under WS (Figure 2H). The membrane structure of the mitochondrion was intact and clear on DAP5 under WS (Figure 2E), while it was broken and blurred on DAP20 (Figure 2H).

2.2. Changes of Chlorophyll Concentration in Pod Wall under Drought Stress

With the development of the pod wall, the concentration of chlorophyll a, chlorophyll b, and total chlorophyll decreased under both WW and WS treatments, and the concentration of chlorophyll a was higher than that of chlorophyll b, respectively. Furthermore, the concentration of chlorophyll a, chlorophyll b, and total chlorophyll in the treatment of WS decreased significantly (p < 0.05) compared with WW (Table 1).

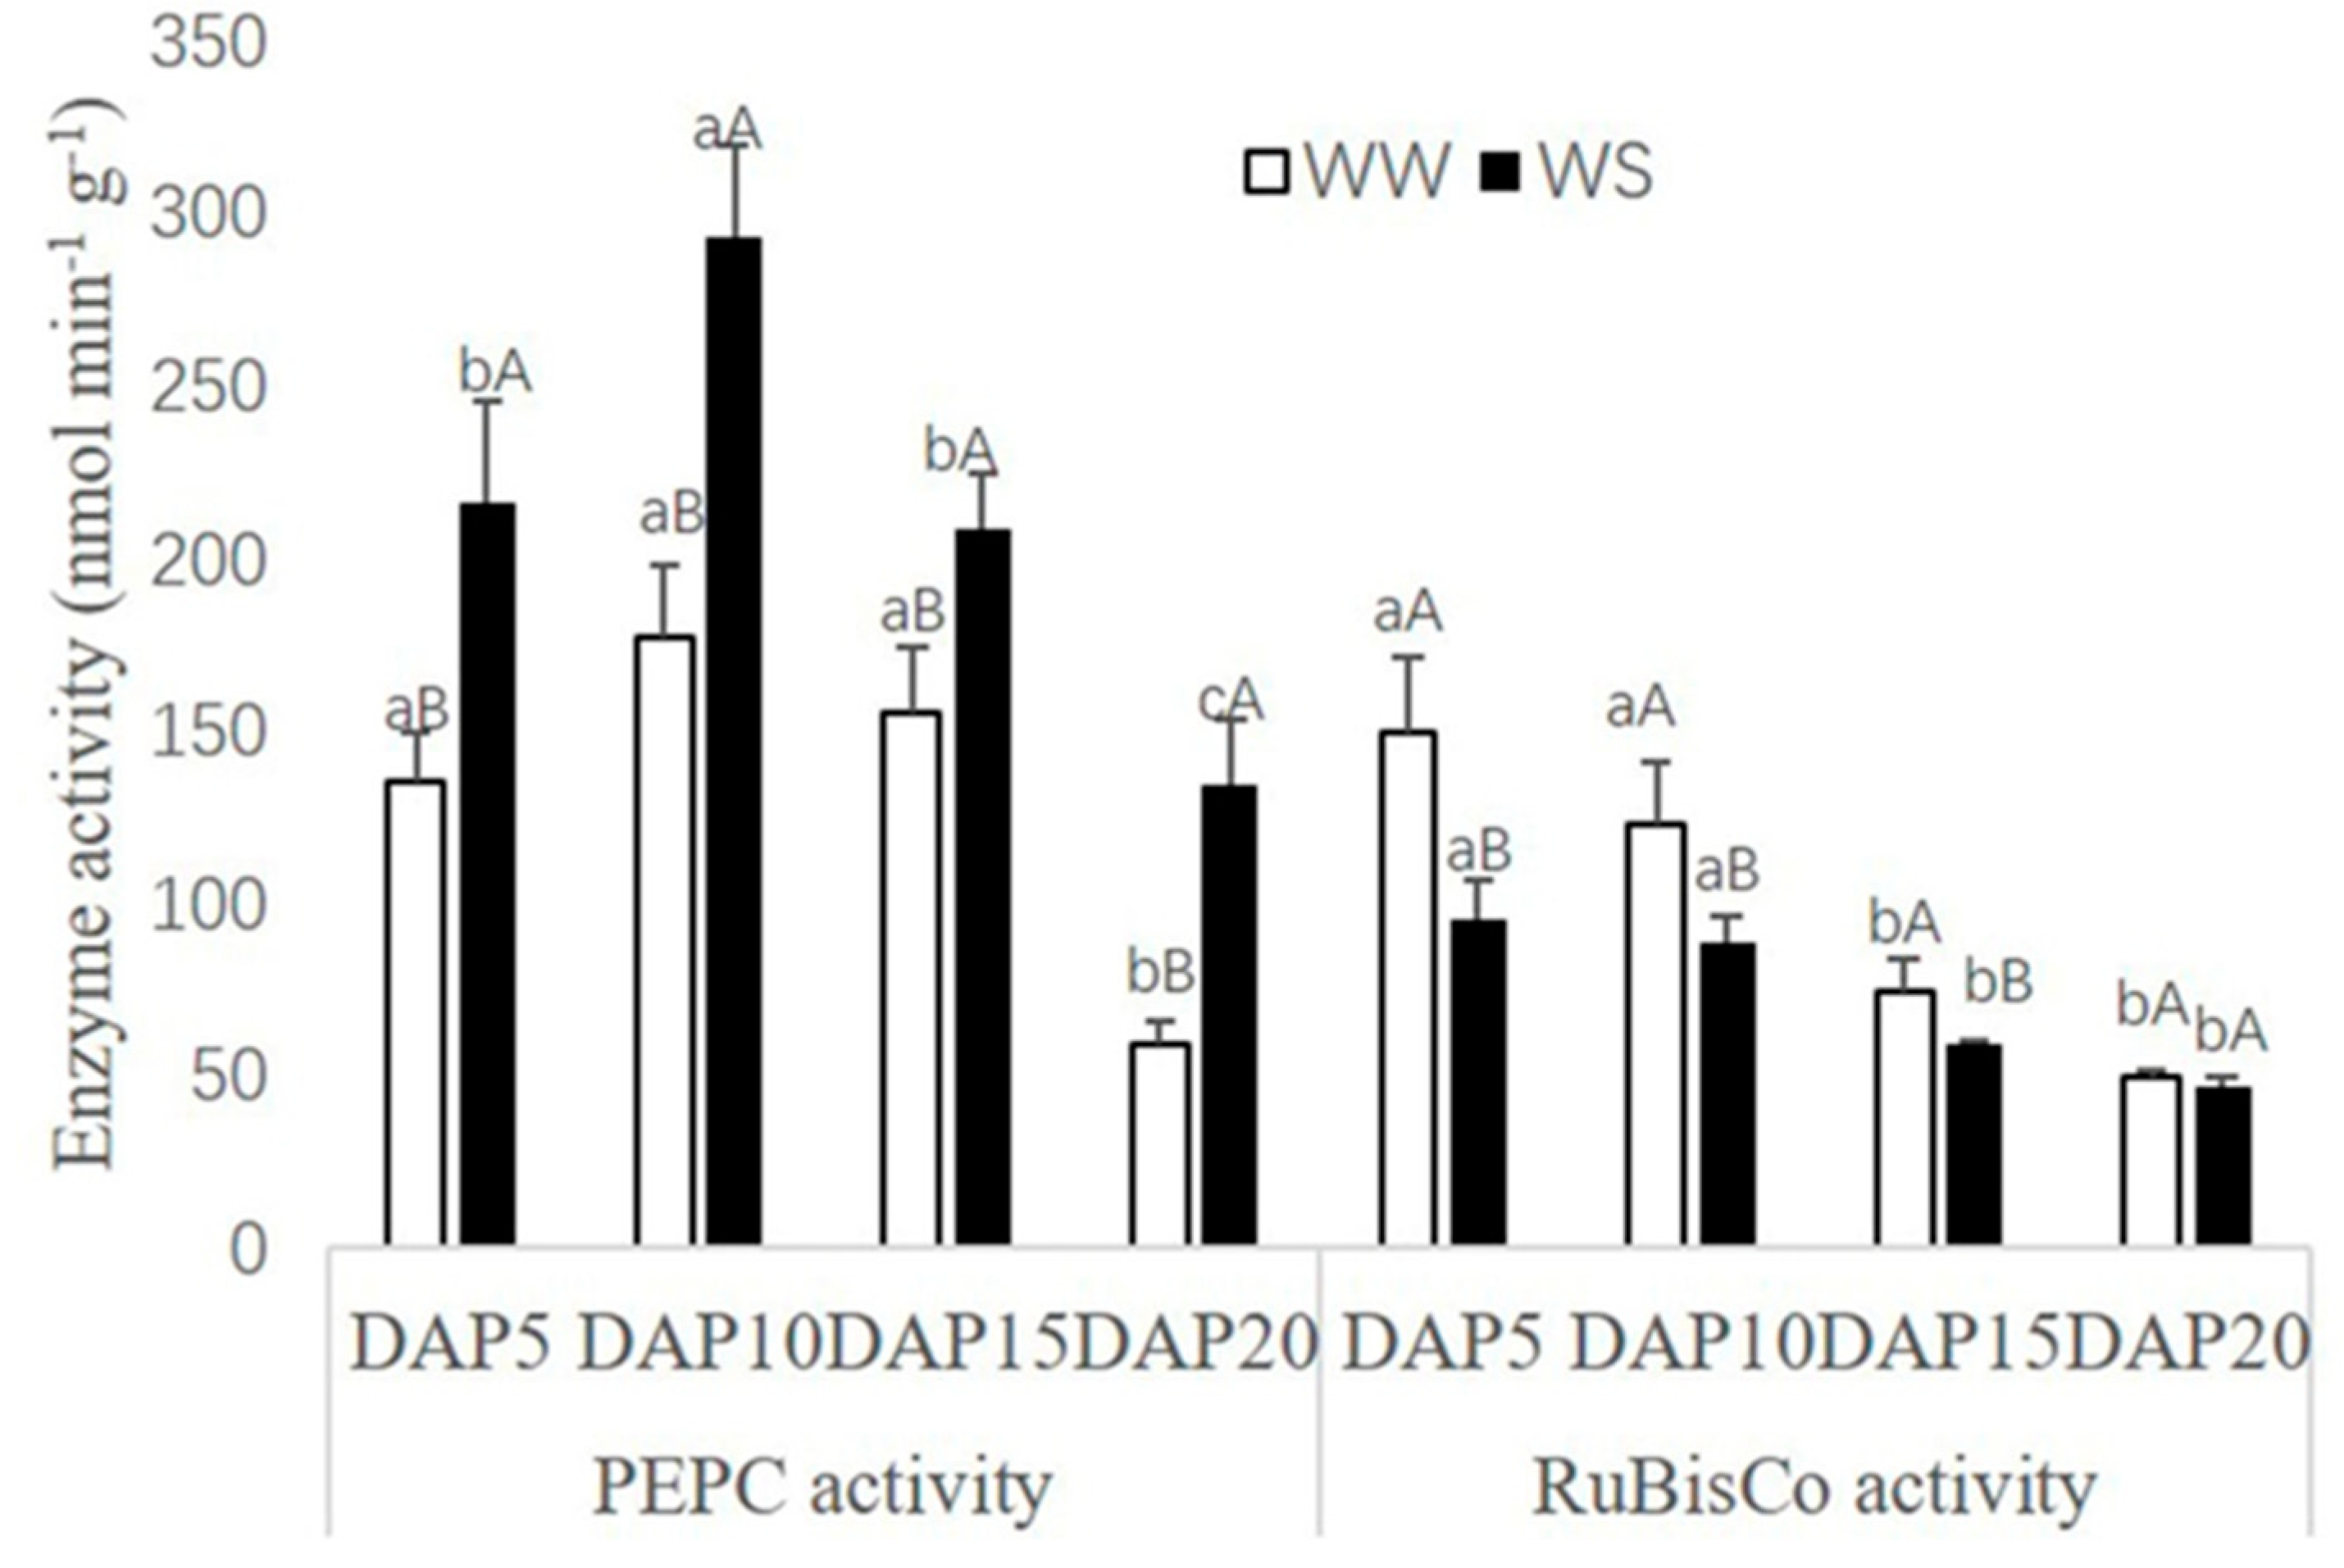
2.3. Changes of Photosynthetic Enzyme Activities in Pod Wall under Drought Stress

PEPC and RuBisCo activities in pod walls both present a declining trend with the pod development (Figure 3). However, there were different responses for PEPC and RuBisCo in the treatment of WS. As a comparison with WW, PEPC activities could be increased significantly (p < 0.05) in the treatment of WS, while RuBisCo activities were decreased.

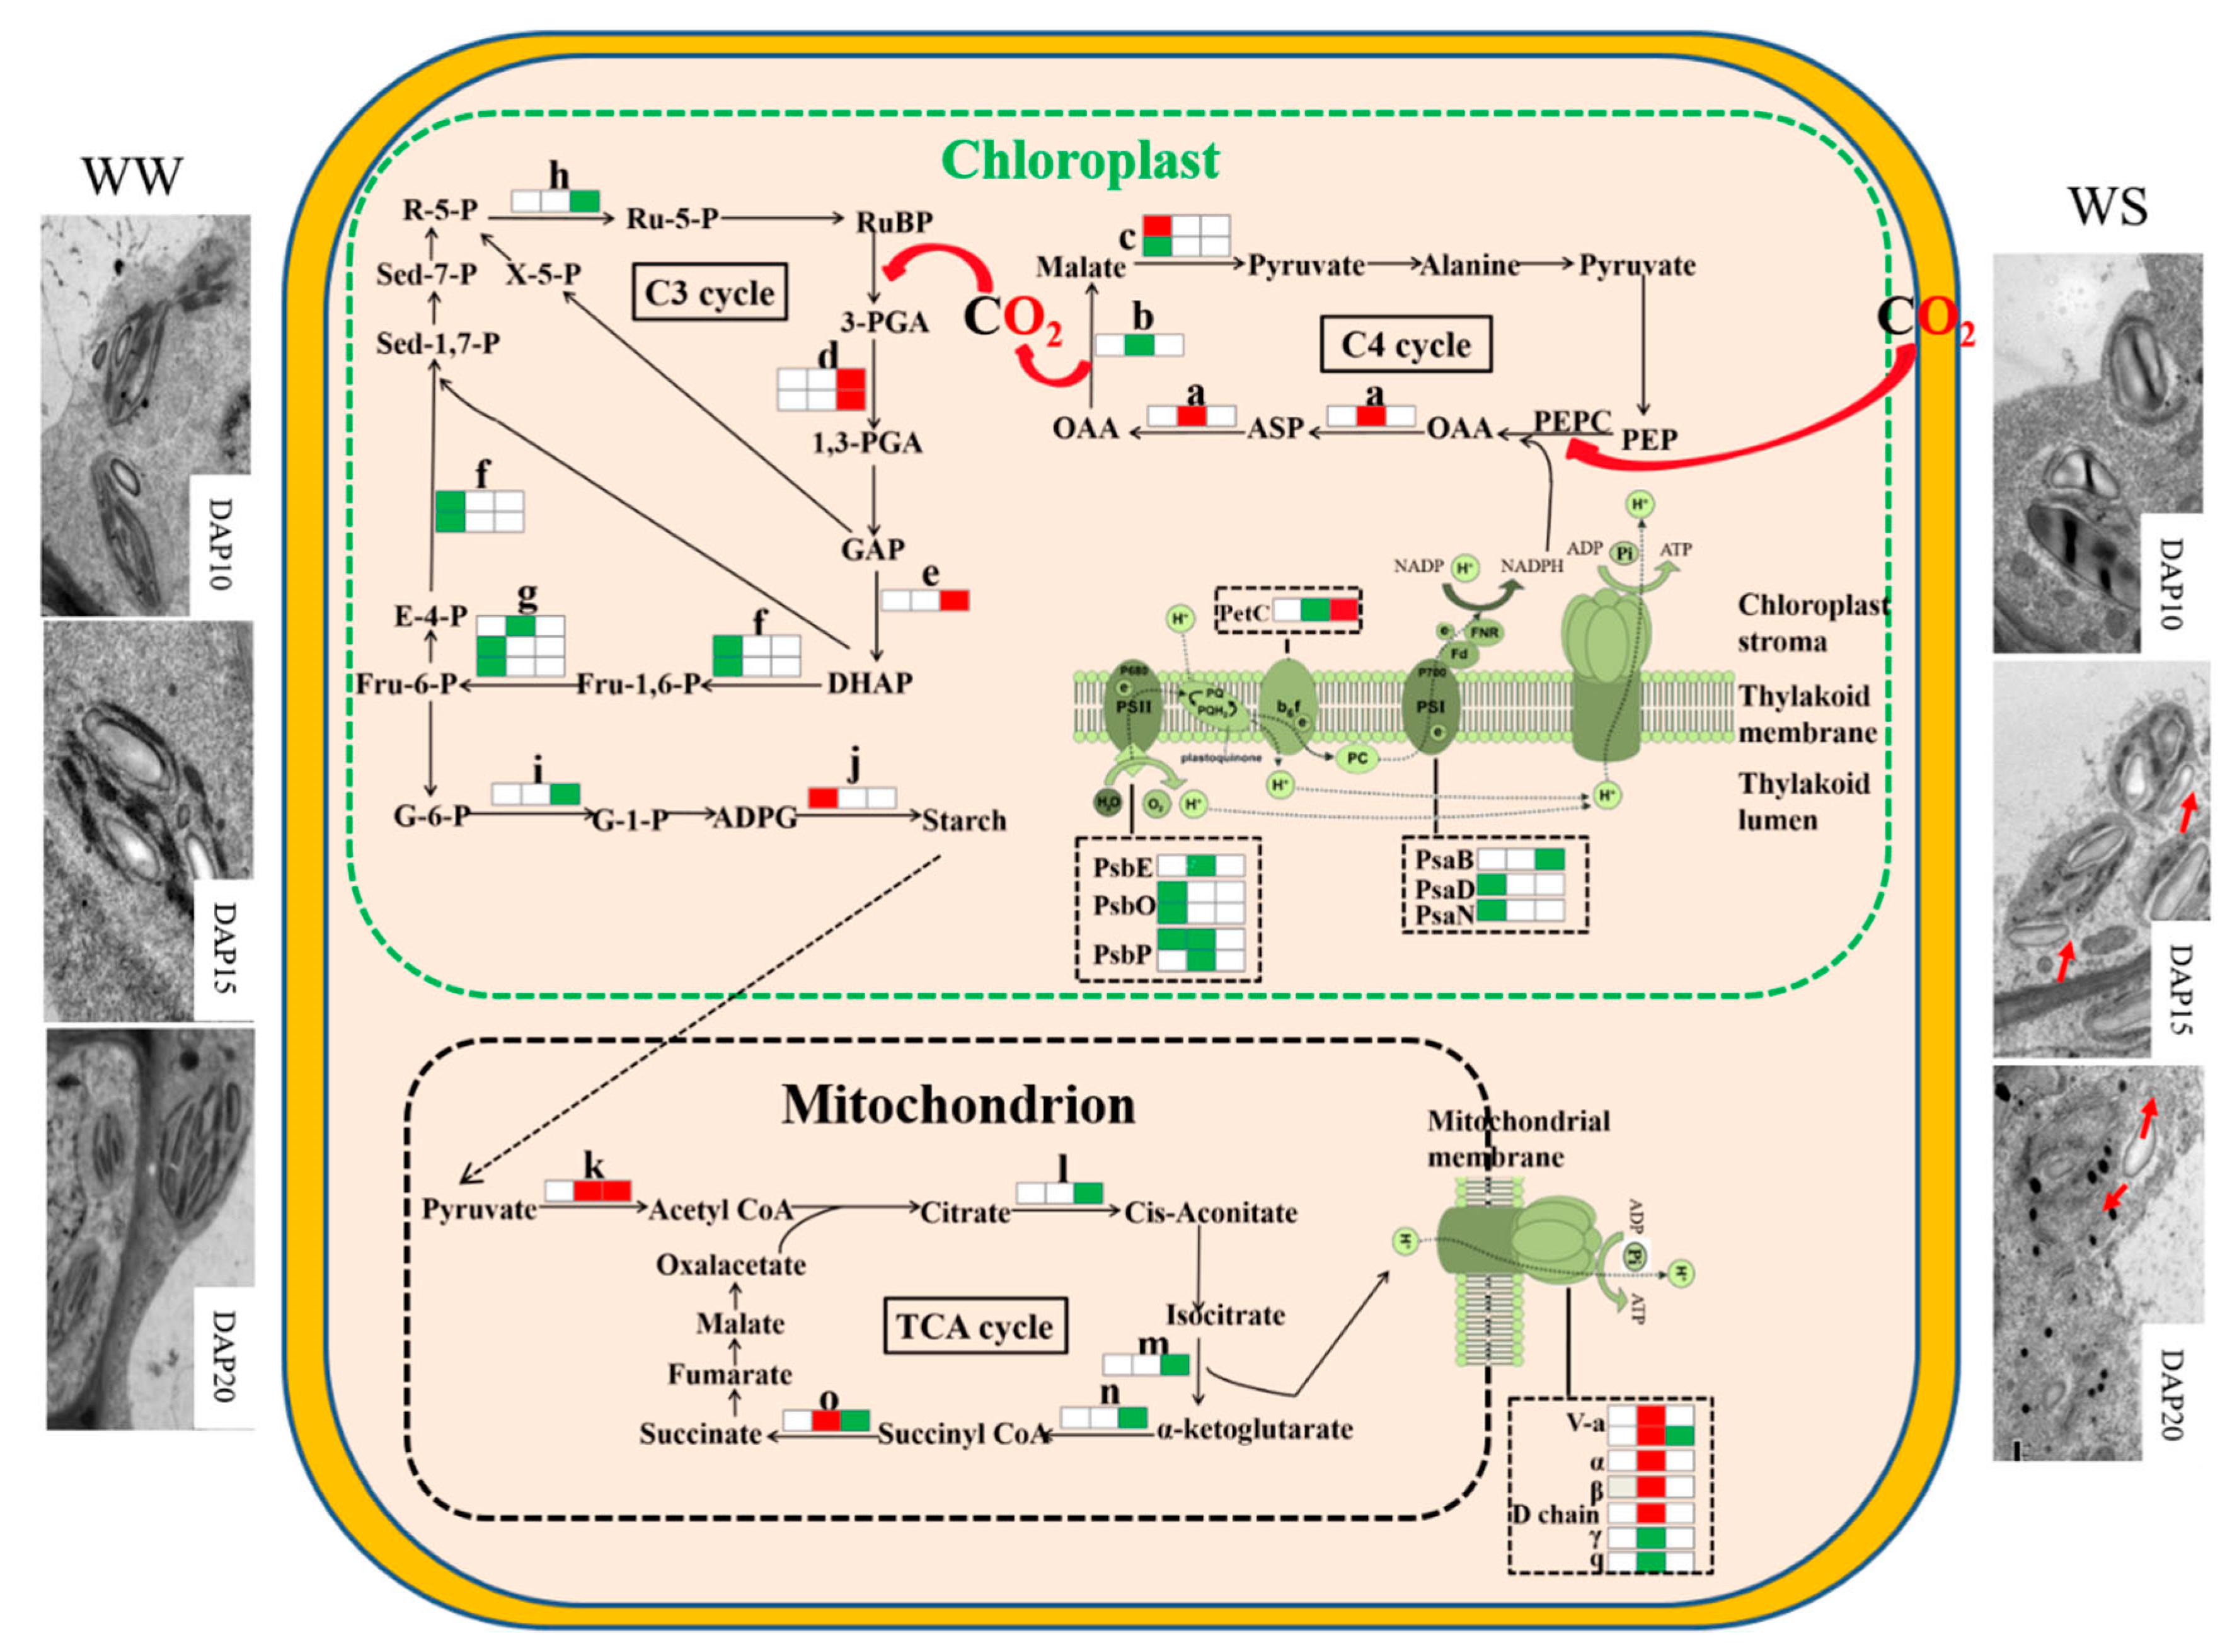
2.4. Proteomic Analysis on the Response of Pod Wall to Drought Stress

According to the Medicago database, a total of 4215 proteins were identified in the samples of pod walls (Supplementary File 1). Under the WW, 373 proteins were significantly upregulated (fold change > 2.0, p < 0.05) for WW15 vs. WW10, and 101 proteins were significantly downregulated for WW20 vs. WW10 (fold change < 0.5, p < 0.05, Figure 4). For the WS, there were 184 upregulated proteins obtained in WS20 vs. WS10, and the number of downregulated proteins was lowest in WS20 vs. WS15. In addition, 144 proteins were significantly downregulated in WS10 vs. WW10, while 48 proteins were significantly downregulated in WS15 vs. WW15.
According to the Kyoto Encyclopedia of Genes and Genomes (KEGG) enrichment analysis, during pod development, most of the identified chlorophyll a–b binding proteins involved in the photosynthesis–antenna proteins were significantly downregulated in pod walls under WW or WS (Figure 5, Supplementary File 2). The synthesis of chlorophyll a–b binding proteins in the pod wall was restricted by the drought stress on DAP10 (Figure 5, Supplementary File 3).
Under the treatment of WS, some proteins, including ribulose-phosphate 3-epimerase, ctosolic fructose-1 6-bisphosphatase, fuctose-1, 6-bisphosphatase, fructose-bisphosphate aldolase, glyoxysomal malate dehydrogenase, malate dehydrogenase, malic enzyme, and sedoheptulose-1,7-bisphosphatase, which are involved in carbon fixation of photosynthetic organisms, were significantly upregulated among different growth stages after pollination (Figure 5, Supplementary File 2). In contrast, some proteins, including 26S proteasome on-ATPase regulatory subunit 6, aspartate aminotransferase, and glutamate-glyoxylate aminotransferase, were significantly downregulated at different durations after pollination. Furthermore, under the treatment of WW, proteins such as fructose-1, 7-bisphosphatase, fructose-bisphosphate aldolase, malic enzyme, and PEPC were significantly upregulated at different durations after pollination, while proteins of cytosolic triosephosphate isomerase, glyceraldehyde-3-phosphate dehydrogenase, and phosphoglycerate kinase were significantly downregulated.
The synthesis of cytosolic fructose-1 6-bisphosphatase, fructose-1, 6-bisphosphatase, fructose-bisphosphate aldolase, and malic enzyme was inhibited by the drought stress on DAP10, and the synthesis of glyoxysomal malate dehydrogenase and ribose-5-phosphate isomerase A were both inhibited on DAP15 and DAP20, respectively (Figure 5, Supplementary File 3). Nevertheless, aspartate aminotransferase on DAP15 and cytosolic triosephosphate isomerase and phosphoglycerate kinase on DAP20 were significantly induced by drought stress.
Proteins involved in photosynthesis, including cytochrome b6-f complex iron-sulfur subunit, F0F1 ATP synthase subunit gamma, oxygen-evolving complex/thylakoid lumenal 25.6 kDa protein, and photosystem II oxygen-evolving enhancer protein, were significantly upregulated in the pod wall at different durations after pollination under WS, while light-harvesting complex I chlorophyll a/b binding protein, oxygen-evolving enhancer protein, photosystem I P700 chlorophyll a apoprotein a2, and photosystem II D2 protein were significantly downregulated (Figure 5, Supplementary File 2). Under WW, there were some significantly downregulated proteins, including cytochrome b559 subunit alpha, cytochrome b6-f complex iron-sulfur subunit, light-harvesting complex I chlorophyll a/b binding protein, oxygen-evolving enhancer protein, and photosystem II D2 protein at different durations after pollination.
For the treatment of WS, some proteins, including oxygen-evolving enhancer protein, photosystem II oxygen-evolving enhancer protein, photosystem I reaction center subunit II, and photosystem I reaction center subunit N in the pod wall on DAP10, were significantly upregulated (Figure 5, Supplementary File 3). However, there were some proteins presenting downregulation in the pod wall on DAP15, such as cytochrome b559 subunit alpha, cytochrome b6-f complex iron-sulfur subunit, ATP synthase subunit gamma, oxygen-evolving complex/thylakoid lumenal 25.6 kDa protein, photosystem I P700 chlorophyll a apoprotein a2, and photosystem I reaction center subunit II.
Meanwhile, some proteins were expressed differently and significantly in the amino sugar and nucleotide sugar metabolism, the ascorbate and aldarate metabolism, the beta-alanine metabolism, the carbon metabolism, the starch and sucrose metabolism, the citrate cycle, the glycine, serine, and threonine metabolism, the linoleic acid metabolism, oxidative phosphorylation, phagosome, plant–pathogen interaction, proteasome, and the alpha-linolenic acid metabolism in pod walls under drought stress (Table 2).

3. Discussion

3.1. Observation of Surface and Ultrastructure in the Pod Wall

Stomata were distinctly observed on the outer surface of the pod wall (Figure 1). Stoma acted in respiration and transpiration and allowed CO2 to enter for operating photosynthesis as well. Previous research has shown that stoma was also found on other NLGOs, such as the exposed peduncles of wheat [22], the silique shell of oilseed rape [4], and the capsule wall of castor [5]. In addition, chloroplast, the important site for doing the light reaction of photosynthesis, was found in cells of the pod wall (Figure 2). At the early stage of pod development, the structure of chloroplasts in the pod wall is well-organized and intact, and the photosynthate, starch grains, are already observed in the chloroplasts (Figure 2A,E). Similar results were reported when observing the ultrastructure of the pod wall of pea [27] and chickpea [6]. Under WW, the pod wall at the late stage even could produce starch grains (Figure 2D). NLOG could maintain functional activity at the late stage when the photosynthetic activity of leaves declined [8,22,28]. However, drought stress could damage the structure of chloroplast membranes and thylakoids, and few starch grains were produced (Figure 2H). In addition, the epidermal hair, existing on the outer surface of the pod wall, likely acts to prevent damage from direct sunlight and protect against water loss.

3.2. Response of Chlorophyll Concentration and Photosynthetic Enzyme Activities

In the pod wall of alfalfa, chlorophyll a and chlorophyll b could be detected, and the concentration of chlorophyll a, chlorophyll b and total chlorophyll decreased with the development of pods (Table 1). Similarly, the concentration of chlorophyll a, chlorophyll b, and total chlorophyll in cotton (Gossypium hirsutum) leaves and NLGOs, including bracts, stems and boll shells, decreased with bolls developing, and the decreasing rate of the concentration in stems and boll shells was lower than that in leaves at the late stage of boll [28]. The chlorophyll biosynthesis was inhibited in the pod wall under drought stress (Table 1), while the content change was lower in NLOG than in leaves to maintain relatively high photosynthetic capacity [15,20,23]. Except for chlorophyll, photosynthetic enzymes are crucial for operating photosynthesis as well. The activities of key enzymes in the C3 and C4 cycles in the pod wall were determined in the present study and the activities of PEPC and RuBisCo both decreased with the development of pods (Figure 3). In addition, the activity of PEPC was higher than that of RuBisCo, and drought stress could induce the activity of PEPC (Figure 3). Previous studies reported that PEPC could make more contributions to photosynthesis than RuBisCo in NLGOs [22]. Although the activity of RuBisCo decreased under drought stress in NLGOs, the increasing activity of PEPC could, in part, compensate to ensure dry matter production [21,23].

3.3. The Differential Expression of Proteins under Drought Stress

3.3.1. Photosynthesis-Antenna Proteins

Six proteins identified in the pod wall were chlorophyll a–b binding proteins, which are the apoproteins of the light-harvesting complex of photosystem Ⅱ that existed on the membrane of chloroplasts [29]. I3SZG9 (Lhca3) is the PSI inner antenna protein (LCHI); Lhcb 1, Lhcb 4, Lhcb 5, and Lhcb 6 belong to the PSII inner antenna proteins (LCHII). In the plants, 50% of chlorophyll associated with LCHII play important roles in the regulation of light energy distribution and photoprotective reaction. In this study, two types of antenna proteins identified in the pod wall were downregulated with the development of pod, and their synthesis was limited by the drought stress (Figure 5; Table 1). Similarly, the antenna proteins were downregulated in sugarcane (Saccharum officinarum) [30] and cucumber (Cucumis sativus) [31] under drought stress, which implied that drought stress impeded the synthesis of antenna proteins, suppressing the absorption of light. In addition, the downregulation of these proteins could decrease energy and substance consumption to promote the operation of other physiological activities for resisting drought stress [32].

3.3.2. Photosynthesis

According to KEGG enrichment analysis for photosynthesis, the identified protein complex participates in the reactions taking place on the thylakoid membrane. Proteins, including PetC, PsbS, PsbQ, PsbO, and PsbC, were downregulated under WW (Figure 5, Supplementary File 2), which means that the photosynthetic ability of the pod wall decreases as the pod developes. In addition, the PSII components, including PsbE, PsbP, and PsbO, were downregulated under drought stress (Figure 5, Supplementary File 2). PsbE is cytochrome b559 subunit α, and the set of these three proteins, PsbP, PsbO, and PsbQ, was bound to the luminal surface of PSII, oxidizing water molecules to release O2 [33]. PsaD, PsaN, and PsaB are subunits of the PSI complex, and their synthesis is suppressed by the drought stress as well. F0F1 ATP synthase subunit γ (F0F1-ATPases), largely existing in chloroplasts, mitochondria, and cell nuclei, was downregulated in this study, which resulted in the reduction of ATP synthesis [34] and the decline of photosynthetic ability [35]. The downregulation of F0F1-ATPases by drought stress was also found in poplar (Populus yunnanensis) [36] and soybean [37]. Drought stress damages the electron transfer system on the thylakoid to reduce the photosynthetic ability of the pod wall through suppressing the synthesis of F0F1-ATPases, cytochrome b6-f complex, and the proteins involved in the photosystem [37].

3.3.3. Carbon Fixation in Photosynthetic Organisms

Under WW, PEPC, the key enzyme in the C4 cycle, was significantly upregulated in the pod wall on DAP15, compared with that on DAP10 (Figure 5, Supplementary File 2). Drought stress inhibited the synthesis of RuBisCo in leaves in alfalfa [38]. The induced proteins in the C4 cycle could compensate for the decrease of photosynthetic ability resulting from the inhibition of proteins in the C3 cycle under drought stress [39]. NLGOs of C3 plants might operate C3–C4 intermediate photosynthesis or C4-similar photosynthesis [11]. Two cell types (mesophyll and Kranz cells) were localized in the ears of wheat [11], in which the activity of PEPC was higher than in flag leaves, and the activity of PEPC was higher than that of RuBisCo [40]. In addition, compared with WW, another C4-pathway enzyme, aspartate aminotransferase, was significantly upregulated in the pod wall on DAP15 under WS (Figure 5, Supplementary File 3). The upregulation of aspartate aminotransferase contributed to increasing the stress resistance of plants and maintaining high photosynthetic abilities under stress [41]. Some enzymes participating in the reduction period of the C3 cycle were upregulated under drought stress, while others involved in the regeneration period of RuBisCo were downregulated (Figure 5, Supplementary File 3). Fructose-1, 6-bisphosphatase and fructose-bisphosphate aldolase were downregulated in pod walls on DAP10 under WS in comparison with WW, while triosephosphate isomerase and phosphoglycerate kinase were upregulated in pod walls on DAP20. Phosphoglycerate kinase, belonging to an upstream acting enzyme in the C3 cycle, had interaction with PEPC and aspartate aminotransferase in the C4 cycle under drought stress, which was found in maize [42]. Drought stress could induce the synthesis of triosephosphate isomerase in rice [43] and maize [44] to ensure the operation of photosynthesis.

3.3.4. Carbohydrate Metabolism

Starch grains were observed to be filling the chloroplasts in the pod wall on DAP10 under WS (Figure 2), which meant that starch synthase was induced in pod walls on DAP10 by drought stress (Table 2). The recent research reported that total carbohydrate content decreased in the pod wall of soybean under drought stress, but not the starch content [7]. Enhance expression of starch synthase presented the protective response to drought stress in the pod wall.
Identified proteins, including pyruvate dehydrogenase (PDH) E1 beta subunit and ATP-citrate lyase/succinyl (ACL)-CoA ligase involved in the citrate cycle, were upregulated in pod walls on DAP15 under WS (Table 2). PDH produces chemical energy, and drought stress could promote the expression of relative encoding genes in rice [45]. PDH is one component of the pyruvate dehydrogenase complex (PDC) that can oxidize pyruvate into acetyl-CoA and NADH. In addition, the overexpression of the ACL gene could enhance drought resistance in tobacco (Nicotiana tabacum) [46]. Some other proteins involved in the citrate cycle, including methylenetetrahydrofolate reductase, E1 subunit-like 2-oxoglutarate dehydrogenase, aconitate hydratase, isocitrate dehydrogenase [NADP] and ATP-citrate lyase/succinyl-CoA ligase, were downregulated in pod walls on DAP20 under drought stress (Table 2). The downregulation of these proteins impedes the carbohydrate metabolism in the pod wall at the late growth stage. Previous research has shown that the stagnate of carbohydrate metabolism in the plants under drought stress could cause the accumulation of sugar [47], which contributes to improving the osmotic potential to enhance drought tolerance [38].

3.3.5. Energy Metabolism

Identified proteins, including archaeal/vacuolar-type H+-ATPase subunit A, ATP synthase subunit beta, ATP synthase subunit alpha, and ATP synthase D chain, were upregulated in pod walls on DAP15 (Table 2). Budak et al. reported that ATP synthase subunit CF1 and ATP synthase subunit alpha had a higher expression level in wild wheat, with stronger drought resistance [48]. Under drought stress, the upregulation of these proteins involved in ATP synthesis could ensure energy metabolism in the plants for maintaining the operation of main physiological activities [49]. Photosynthesis is sensitive to drought stress, while respiration is not. The normal operation of respiration could provide the necessary energy for decreasing the damage from drought stress [7].

3.3.6. Other Metabolism

Chitinase plays an important role in resistance to stress [50,51]. The activity of chitinase is low in the plant, but drought stress can induce the expression of the chitinase gene in wheat [50] and faba beans (Vicia faba) [51]. Similar results were found in the present study, where chitinase was upregulated in the pod wall on DAP15 under drought stress (Table 2). Heat shock protein 90 (Hsp90) complex regulated proteins fold and degrade and maintain stable plant cells [52]. Heat shock protein 81-2 (Hsp81-2) is a member of Hsp90 family and can be induced by drought stress in arabidopsis (Arabidopsis thaliana) [53]. In the present study, Hsp81-2 involved in plant–pathogen interaction was identified and upregulated in the pod wall on DAP10 and DAP15 under drought stress. Most of the lipoxygenases (LOXs) identified were upregulated in the pod wall on DAP10 (Table 2). LOX participates in many activities in the plants, and drought stress caused the rapid accumulation of LOX mRNA in barley [54]. The overexpression of CaLOX1 enhanced the resistance to drought stress in arabidopsis [55].
In summary, the structure of chloroplast in the pod wall is damaged at the late stage of development under drought stress, but not at the early stage. The synthesis of some proteins involved in photosystem I, photosystem II, and the regeneration period of RuBisCo in the pod wall at the early stage and TCA cycle at the late stage are impeded under drought stress (Figure 6). Nevertheless, drought stress can induce the activity of PEPC and promote the synthesis of some proteins participating in the pathway of the C4 cycle and energy metabolism at the early stage and the reduction period of RuBisCo at the late stage.
This study provides the ultrastructural, physiological, and proteomic changes in alfalfa pod walls under drought stress. The results suggest that the pod wall shows the capability of conducting photosynthesis and regulating the C4 photosynthetic pathway, ATP synthesis, and resistance metabolism to ensure the operation of physiological reactions under drought stress.

4. Material and Method

4.1. Material

M. sativa cv. Zhongmu No. 2 seeds were sown in the plastic pots (weight 0.5 kg, height 30 cm, base diameter 19 cm, and top diameter 25 cm) in a greenhouse in October 2015. Each pot was filled with a mixture soil of vermiculite, peat, and black soil by 2:1:1 (total soil weight 3.5 kg, water content 23%). Four seedlings with a similar growth status were kept in each pot when the seedlings’ height was around 10 cm. They were equivalently and adequately watered every two days. All plants were cut till 10 cm, and then pots were moved out of and nearby the greenhouse, without any shelter, in April 2016. Every day, each pot was weighed with an electronic scale and watered to 7 kg. From 18 April (before visible bud stage), a drought stress treatment, denoted by WS, was started by watering each pot to 4.5 kg, while the control, denoted by WW, was still watered to 7 kg. Plants in WW and WS treatments were pollinated artificially every 5 days from 6 June till 21 June. After pollination, the flowers pollinated were marked with hang tags. On 26 June, the pod walls of marked pods with 3 replicates were collected on day 5 (DAP5), day 10 (DAP10), day 15 (DAP15), and day 20 (DAP20) after pollination under WW and WS treatments.

4.2. Surface and Ultrastructure Characteristics Observation for Pod Wall

The pod walls of DAP10 under WW and WS treatments were used as samples to observe the surface characteristics by using a scanning electron microscope (manufacture Hitachi S-570, city Japan). The pod walls of DAP5, DAP10, DAP15, and DAP20 under WW and WS treatments were used as samples for taking images with a transmission electron microscope (manufacture Hitachi H-7500, city Japan) to observe ultrastructure characteristics. Pretreatments of the pod walls for observation by using the scanning and transmission electron microscopes were conducted according to [56].

4.3. Chlorophyll Concentration of Pod Walls Measurement

The pod walls on DAP5, DAP10, DAP15, and DAP20 under WW and WS treatments were sampled and cut into filaments, respectively. Chlorophyll a and chlorophyll b concentrations in each sample with three repetitions were determined by soaking in extracting solution, filling in the 10 mL centrifuge tube. The extracting solution was the mixture of acetone and absolute ethyl alcohol by the volume rate of 2:1. Absorbancy of extracting solution at 663 and 645 nm was determined by using a ultraviolet spectrophotometer (manufacture UH5300, city Japan) to calculate the concentration of chlorophyll a and chlorophyll b. The gross chlorophyll concentration was the sum of chlorophyll a and chlorophyll b.

4.4. Photosynthetic Enzyme Activities Assays

The pod walls on DAP5, DAP10, DAP15, and DAP20 under WW and WS treatments were sampled with three repetitions. Each sample was homogenized in extracting solutions using a pestle and mortar in ice. The extracting solution contained 1 M Tris-H2SO4 (pH 7.8), 5% glycerol, 7 mM DTT, and 1 mM EDTA. The homogenate was filtered, and then the filtrate was centrifuged at 8000× g for 10 min at 4 °C. The supernatant was saved in an ice bath for subsequent enzyme assay. Photosynthetic enzyme activities were determined using an ultraviolet spectrophotometer (UH5300, Hitachi, Japan) at 340 nm. The reaction solution for phosphoenolpyruvate carboxylase (PEPC) contained 0.1 mol L−1 Tris-H2SO4 (pH 9.2), 0.1 M MgCl2, 100 mM NaHCO3, 40 mM PEP, 1 mg mL−1 NADH and MDH [57]. The reaction mixture for ribulose-1,5-bisphosphate carboxylase (RuBisCo) contained 100 mM Tris-HCl (pH 7.8), 160 U/mL CPK, 160 U mL−1 GAPDH, 50 mM ATP, 50 mM phosphocreatine, and 160 U mL−1 phosphoglyceric kinase [58].

4.5. Proteomic Analysis

The pod walls on DAP10, DAP15, and DAP20 under WW (denoted by WW10, WW15, and WW20, respectively) and WS (denoted by WS10, WS15, and WS20, respectively) treatments were collected and stored at −80 °C. Then, 0.05 g tissues of each sample with 3 repetitions were ground in liquid nitrogen before the addition of 200 μL plant total protein lysis buffer containing 20 mM Tris-HCl (pH7.5), 250 mM sucrose, 10 mM EGTA, 1% Triton X-100, protease inhibitor, and 1 M DTT. The mixture was incubated on ice for 20 min. Plant cell debris was removed via centrifugation at a speed of relative centrifugal force of 15,000× g for 15 min at 4 °C. The supernatant was collected, and the rest was centrifugated again, as above. The protein concentration was determined with a Bio-Rad Protein Assay kit based on the Bradford method, using BSA as a standard at a wavelength of 595 nm. All independent protein extractions were performed.
Briefly, 60 μg protein samples were reduced with 5 μL 1 M DTT for 1 h at 37 °C, alkylated with 20 μL 1 M iodoacetamide (IAA) for 1 h in the dark, and then digested with sequencing-grade modified trypsin (Promega) for 20 h at 37 °C. Digested peptides were separated with chromatography using an Easy-nLC1000 system (Thermo Scientific) autosampler. The peptide mixture was loaded on a self-made C18 trap column (C18 3 μm, 0.10 × 20 mm) in solution A (0.1% formic acid), then separated with a self-made Capillary C18 column (1.9 μm, 0.15 × 120 mm), with a gradient solution B (100% acetonitrile and 0.1% formic acid) at a flow rate of 600 nL/min. The gradient consisted of the following steps: 0–10% solution B for 16 min, 10–22% for 35 min, 22–30% for 20 min, then increasing to 95% solution B in 1 min and holding for 6 min. Separated peptides were examined in the Orbitrap Fusion mass spectrometer (Thermo Scientific, Waltham, MA, USA), with a Michrom captive spray nanoelectrospray ionization (NSI) source. Spectra were scanned over the m/z range 300–4000 Da at 120,000 resolution. An 18-s exclusion time and 32% normalization collision energy were set at the dynamic exclusion window.

4.6. Statistical Analysis

The significance of differences between mean values of physiological parameters, including the chlorophyll concentration and the enzyme activities under WW and WS, were analyzed using an LSD test by software SAS version 8.0.
RAW files of mass spectrometry were extracted using the MASCOT version 2.3.02 (Matrix Science, London, UK). Mass spectrometry data were searched, identified, and quantitatively analyzed using the software of Sequest HT and Proteome Discover 2.0 (Thermo Scientific). The database used in this study was uniprot-Medicago.fasta. Protein species with at least two unique peptides were selected for protein species quantitation, and the relative quantitative protein ratios between the two samples were calculated by comparing the average abundance values (three biological replicates). Protein species detected in only one material (A-line or B-line), with at least two replicates considered to be presence/absence protein species. Additionally, Student’s t-tests were performed to determine the significance of changes between samples. A fold-change of >2 and p-value < 0.05 in at least two replicates were used as the thresholds to define differently accumulated protein species.

Supplementary Materials

Supplementary materials can be found at https://www.mdpi.com/1422-0067/21/12/4457/s1.

Author Contributions

H.W. and P.M. designed the experiments; H.W. did the experiments wrote the manuscript. Q.Z. and P.M. reviewed and edited the manuscript. All authors have read and agreed to the published version of the manuscript.

Funding

This research was financially supported by the China Agriculture Research System (CARS-34) and the earmarked fund for the Beijing Common Construction Project.

Conflicts of Interest

The authors declare no conflict of interest.

References

  1. Loomis, R.S.; Williams, W.A. Maximum crop productivity: An extimate. Crop Sci. 1963, 3, 67–72. [Google Scholar] [CrossRef]
  2. Shen, Y. The Most Improtant Chemistry Reaction on the Earth-Photosynthesis; Tsinghua University Press: Beijing, China, 2000; pp. 2–13. [Google Scholar]
  3. Long, S.; Marshall-Colon, A.; Zhu, X. Meeting the global food demand of the future by engineering crop photosynthesis and yield potential. Cell 2015, 161, 56–66. [Google Scholar] [CrossRef] [PubMed] [Green Version]
  4. Wang, C.; Yang, J.; Hai, J.; Chen, W.; Zhao, X. Photosynthetic features of leaf and silique of ‘Qinyou 7′oilseed rape (Brassica napus L.) at reproductive growth stage. Oil Crop. Sci. 2018, 3, 176. [Google Scholar]
  5. Zhang, Y.; Mulpuri, S.; Liu, A. Photosynthetic capacity of the capsule wall and its contribution to carbon fixation and seed yield in castor (Ricinus communis L.). Acta Physiol. Plant. 2016, 38, 245. [Google Scholar] [CrossRef]
  6. Furbank, R.T.; White, R.; Palta, J.A.; Turner, N.C. Internal recycling of respiratory CO2 in pods of chickpea (Cicer arietinum L.): The role of pod wall, seed coat, and embryo. J. Exp. Bot. 2004, 55, 1687–1696. [Google Scholar] [CrossRef] [Green Version]
  7. Sengupta, D.; Kariyat, D.; Marriboina, S.; Reddy, A.R. Pod-wall proteomics provide novel insights into soybean seed-filling process under chemical-induced terminal drought stress. J. Sci. Food Agric. 2019, 99, 2481–2493. [Google Scholar] [CrossRef] [PubMed]
  8. Wang, H.; Hou, L.; Wang, M.; Mao, P. Contribution of the pod wall to seed grain filling in alfalfa. Sci. Rep. 2016, 6, 26586. [Google Scholar] [CrossRef] [Green Version]
  9. Tambussi, E.A.; Bort, J.; Guiamet, J.J.; Nogués, S.; Araus, J.L. The photosynthetic role of ears in C3 cereals: Metabolism, water use efficiency and contribution to grain yield. Crit. Rev. Plant Sci. 2007, 26, 1–16. [Google Scholar] [CrossRef]
  10. Jiang, Q.; Roche, D.; Durham, S.; Hole, D. Awn contribution to gas exchanges of barley ears. Photosynthetica 2006, 44, 536–541. [Google Scholar] [CrossRef]
  11. Baluar, N.; Badicean, D.; Peterhaensel, C.; Mereniuc, L.; Vorontsov, V.; Terteac, D. The peculiarities of carbon metabolism in the ears of C3 cereals CO2 exchange kinetics, chloroplasts structure and ultra-structure in the cells from photosynthetic active components of the ear. J. Tissue Cult. Bioeng. 2018, 1, 1–14. [Google Scholar]
  12. AuBuchon-Elder, T.; Coneva, V.; Goad, D.M.; Allen, D.K.; Kellogg, E.A. Sterile spikelets assimilate carbon in sorghum and related grasses. BioRxiv 2018. [Google Scholar] [CrossRef]
  13. Ávila-Lovera, E.; Zerpa, A.J.; Santiago, L.S. Stem photosynthesis and hydraulics are coordinated in desert plant species. New Phytol. 2017, 216, 1119–1129. [Google Scholar] [CrossRef] [PubMed] [Green Version]
  14. Kitaya, Y.; Yabuki, K.; Kiyota, M.; Tani, A.; Hirano, T.; Aiga, I. Gas exchange and oxygen concentration in pneumatophores and prop roots of four mangrove species. Trees-Struct. Funct. 2002, 16, 155–158. [Google Scholar] [CrossRef]
  15. Zhang, C.; Zhan, D.; Luo, H.; Zhang, Y.; Zhang, W. Photorespiration and photoinhibition in the bracts of cotton under water stress. Photosynthetica 2016, 54, 12–18. [Google Scholar] [CrossRef]
  16. Li, Y.; Li, H.; Li, Y.; Zhang, S. Improving water-use efficiency by decreasing stomatal conductance and transpiration rate to maintain higher ear photosynthetic rate in drought-resistant wheat. Crop J. 2017, 5, 231–239. [Google Scholar] [CrossRef]
  17. Abebe, T.; Melmaiee, K.; Berg, V.; Wise, R.P. Drought response in the spikes of barley: Gene expression in the lemma, palea, awn, and seed. Funct. Interg. Genomic. 2010, 10, 191–205. [Google Scholar] [CrossRef] [PubMed]
  18. Zhang, Y.; Wang, Z.; Wu, Y.; Zhang, X. Stomatal characteristics of different green organs in wheat under different irrigation regimes. Acta Agron. Sin. 2006, 32, 70–75. [Google Scholar]
  19. Hu, Y.; Zhang, Y.; Yi, X.; Zhan, D.; Luo, H.; Soon, C.W.; Zhang, W. The relative contribution of non-foliar organs of cotton to yield and related physiological characteristics under water deficit. J. Integr. Agric. 2014, 13, 975–989. [Google Scholar] [CrossRef]
  20. Lou, L.; Li, X.; Chen, J.; Li, Y.; Tang, Y.; Lv, J. Photosynthetic and ascorbate-glutathione metabolism in the flag leaves as compared to spikes under drought stress of winter wheat (Triticum aestivum L.). PLoS ONE 2018, 13, e0194625. [Google Scholar] [CrossRef] [Green Version]
  21. Wei, A.; Wang, Z.; Zhai, Z.; Cong, Y. Effect of soil drought on C4 photosynthetic enzyme activities of flag leaf and ear in wheat. Agric. Sci. China 2003, 36, 508–512. [Google Scholar]
  22. Kong, L.; Wang, F.; Feng, B.; Li, S.; Si, J.; Zhang, B. The structural and photosynthetic characteristics of the exposed peduncle of wheat (Triticum aestivum L.): An important photosynthate source for grain-filling. BMC Plant Biol. 2010, 10, 141. [Google Scholar] [CrossRef] [Green Version]
  23. Jia, S.; Lv, J.; Jiang, S.; Liang, T.; Liu, C.; Jing, Z. Response of wheat ear photosynthesis and photosynthate carbon distribution to water deficit. Photosynthetica 2015, 53, 95–109. [Google Scholar] [CrossRef] [Green Version]
  24. Rangan, P.; Furtado, A.; Henry, R.J. New evidence for grain specific C4 photosynthesis in wheat. Sci. Rep. 2016, 6, 31721. [Google Scholar] [CrossRef] [PubMed] [Green Version]
  25. Singal, H.R.; Sheoran, I.S.; Singh, R. In vitro enzyme activities and products of 14CO2 assimilation in flag leaf and ear parts of wheat (Triticum aestivum L.). Photosynth. Res. 1986, 8, 113–122. [Google Scholar] [CrossRef]
  26. Gu, S.; Yin, L.; Wang, Q. Phosphoenolpyruvate carboxylase in the stem of the submersed species Egeria densa may be involved in an inducible C 4-like mechanism. Aquat. Bot. 2015, 125, 1–8. [Google Scholar] [CrossRef]
  27. Atkins, C.A.; Kuo, J.; Pate, J.S.; Flinn, A.M.; Steele, T.W. Photosynthetic pod wall of pea (Pisum sativum L.) distribution of carbon dioxide-fixing enzymes in relation to pod structure. Plant Physiol. 1977, 60, 779–786. [Google Scholar] [CrossRef] [Green Version]
  28. Hu, Y.; Zhang, Y.; Luo, H.; Li, W.; Oguchi, R.; Fan, D.; Soon, C.W.; Zhang, W. Important photosynthetic contribution from the non-foliar green organs in cotton at the late growth stage. Planta 2012, 235, 325–336. [Google Scholar] [CrossRef] [Green Version]
  29. Liu, R.; Xu, Y.; Jiang, S.; Lu, K.; Lu, Y.; Feng, X.; Zhen, W.; Shan, L.; Yu, Y.; Wang, X.; et al. Light-harvesting chlorophyll a/b-binding proteins, positively involved in abscisic acid signalling, require a transcription repressor, WRKY40, to balance their function. J. Exp. Bot. 2013, 64, 5443–5456. [Google Scholar] [CrossRef] [PubMed] [Green Version]
  30. Liang, P. Physiological and Molecular Basis of Drought Resistance Enhanced by Si Application in Sugarcane. Ph.D. Thesis, Guangxi University, Nanning, China, 2012. [Google Scholar]
  31. Cui, Q. Analysis of the Chloroplast Proteome of Cucumber Leaves under Elevated CO2 Concentration and Drought Stress. Masters’ Thesis, Shandong Agricultural University, Taian, China, 2017. [Google Scholar]
  32. Hossain, M.A.; Wani, S.H.; Bhattacharjee, S.; Burritt, D.J.; Tran, L.S.P. Drought Stress Tolerance in Plants, Physiology and Biochemistry; Springer: Berlin/Heidelberg, Germany, 2016; Volume 1, pp. 155–157. [Google Scholar]
  33. Ifuku, K. Localization and functional characterization of the extrinsic subunits of photosystem II: An update. Biosci. Biotechnol. Biochem. 2015, 79, 1223–1231. [Google Scholar] [CrossRef] [PubMed] [Green Version]
  34. Caruso, G.; Cavaliere, C.; Foglia, P.; Gubbiotti, R.; Samperi, R.; Laganà, A. Analysis of drought responsive proteins in wheat (Triticum durum) by 2D-PAGE and MALDI-TOF mass spectrometry. Plant Sci. 2009, 177, 570–576. [Google Scholar] [CrossRef]
  35. Xiao, X.; Yang, F.; Zhang, S.; Korpelainen, H.; Li, C. Physiological and proteomic responses of two contrasting Populus cathayana populations to drought stress. Physiol. Plant. 2009, 136, 150–168. [Google Scholar] [CrossRef]
  36. Li, X.; Yang, Y.; Sun, X.; Lin, H.; Chen, J.; Ren, J.; Hu, X.; Yang, Y. Comparative physiological and proteomic analyses of poplar (Populus yunnanensis) plantlets exposed to high temperature and drought. PLoS ONE 2014, 9, e107605. [Google Scholar] [CrossRef]
  37. Das, A.; Eldakak, M.; Paudel, B.; Kim, D.W.; Hemmati, H.; Basu, C.; Rohila, J.S. Leaf proteome analysis reveals prospective drought and heat stress response mechanisms in soybean. BioMed Res. Int. 2016, 6021047. [Google Scholar] [CrossRef] [Green Version]
  38. Aranjuelo, I.; Molero, G.; Erice, G.; Avice, J.C.; Nogués, S. Plant physiology and proteomics reveals the leaf response to drought in alfalfa (Medicago sativa L.). J. Exp. Bot. 2010, 62, 111–123. [Google Scholar] [CrossRef] [Green Version]
  39. Zhang, Y.; Zhang, Y.; Wang, Z. Photosynthetic diurnal variation characteristics of leaf and non-leaf organs in winter wheat under different irrigation regimes. Acta Ecol. Sin. 2011, 31, 1312–1322. [Google Scholar]
  40. Feng, B. Physiological Basis and Response Mechanisms of Different Green Organs under High Temperature after Anthesis in Winter Wheat. Ph.D. Thesis, Shandong Agricultural University, Taian, China, 2014. [Google Scholar]
  41. Pei, C.; Zhang, Z.; Ma, J. Differentially expressed proteins analysis of seedling leaf of southern type alfalfa (Medicago sativa ‘Millenium’) under salt stress. J. Agric. Biotechnol. 2016, 24, 1629–1642. [Google Scholar]
  42. Li, H. Phosphoproteomic Differentiation of Maize Seedlings in Response to Drought Stress and Abscisic and Induction. Masters’ Thesis, Sichuan Agricultural University, Chengdu, China, 2016. [Google Scholar]
  43. Umeda, M.; Hara, C.; Matsubayashi, Y.; Li, H.; Liu, Q.; Tadokoro, F.; Aotsuka, S.; Uchimiya, H. Expressed sequence tags from cultured cells of rice (Oryza sativa L.) under stressed conditions: Analysis of transcripts of genes engaged in ATP-generating pathways. Plant Mol. Biol. 1994, 25, 469–478. [Google Scholar] [CrossRef]
  44. Riccardi, F.; Gazeau, P.; de Vienne, D.; Zivy, M. Protein changes in response to progressive water deficit in maize: Quantitative variation and polypeptide identification. Plant Physiol. 1998, 117, 1253–1263. [Google Scholar] [CrossRef] [Green Version]
  45. Silveira, R.D.D.; Abreu, F.R.M.; Mamidi, S.; McClean, P.E.; Vianello, R.P.; Lanna, A.C.; Carneiro, N.P.; Brondani, C. Expression of drought tolerance genes in tropical upland rice cultivars (Oryza sativa). Genet. Mol. Res. 2015, 14, 8181–8200. [Google Scholar] [CrossRef]
  46. Phan, T.T.; Li, J.; Sun, B.; Jia, Y.; Wen, H.; Chan, H.; Li, T.; Li, Y. ATP-citrate lyase gene (SOACLA-1), a novel ACLA gene in sugarcane, and its overexpression enhance drought tolerance of transgenic tobacco. Sugar Technol. 2017, 19, 258–269. [Google Scholar] [CrossRef]
  47. Stitt, M.; Gibon, Y.; Lunn, J.E.; Piques, M. Multilevel genomics analysis of carbon signalling during low carbon availability: Coordinating the supply and utilisation of carbon in a fluctuating environment. Funct. Plant Biol. 2007, 34, 526–549. [Google Scholar] [CrossRef]
  48. Budak, H.; Akpinar, B.A.; Unver, T.; Turktas, M. Proteome changes in wild and modern wheat leaves upon drought stress by two-dimensional electrophoresis and nanoLC-ESI–MS/MS. Plant Mol. Biol. 2013, 83, 89–103. [Google Scholar] [CrossRef] [PubMed]
  49. Wang, X.; Cai, X.; Xu, C.; Wang, Q.; Dai, S. Drought-responsive mechanisms in plant leaves revealed by proteomics. Int. J. Mol. Sci. 2016, 17, 1706. [Google Scholar] [CrossRef] [PubMed] [Green Version]
  50. Gregorova, Z.; Kovacik, J.; Klejdus, B.; Maglovski, M.; Kuna, R.; Hauptvogel, P.; Matušíková, I. Drought-induced responses of physiology, metabolites, and PR proteins in Triticum aestivum. J. Agric. Food Chem. 2015, 63, 8125–8133. [Google Scholar] [CrossRef]
  51. Li, P.; Zhang, Y.; Wu, X.; Liu, Y. Drought stress impact on leaf proteome variations of faba bean (Vicia faba L.) in the Qinghai–Tibet Plateau of China. 3 Biotech 2018, 8, 110. [Google Scholar] [CrossRef] [Green Version]
  52. Xu, Z.; Li, Z.; Chen, Y.; Chen, M.; Li, L.; Ma, Y. Heat shock protein 90 in plants: Molecular mechanisms and roles in stress responses. Int. J. Mol. Sci. 2012, 13, 15706–15723. [Google Scholar] [CrossRef]
  53. Hasegawa, Y.; Seki, M.; Mochizuki, Y.; Heida, N.; Hirosawa, K.; Okamoto, N.; Sakurai, T.; Satou, M.; Akiyama, K.; Iida, K.; et al. A flexible representation of omic knowledge for thorough analysis of microarray data. Plant Methods 2006, 2, 5. [Google Scholar] [CrossRef] [Green Version]
  54. Ashoub, A.; Beckhaus, T.; Berberich, T.; Karas, M.; Brüggemann, W. Comparative analysis of barley leaf proteome as affected by drought stress. Planta 2013, 237, 771–781. [Google Scholar] [CrossRef]
  55. Lim, C.W.; Han, S.W.; Hwang, I.S.; Kim, D.S.; Hwang, B.K.; Lee, S.C. The pepper lipoxygenase CaLOX1 plays a role in osmotic, drought and high salinity stress response. Plant Cell Physiol. 2015, 56, 930–942. [Google Scholar] [CrossRef] [Green Version]
  56. Kang, L. Biological Electron Microscopy Techniques; China Science and Technology University Press: Hefei, China, 2004. [Google Scholar]
  57. Blanke, M.M.; Ebert, G. Phosphoenolpyruvate carboxylase and carbon economy of apple seedlings. J. Exp. Bot. 1992, 43, 965–968. [Google Scholar] [CrossRef]
  58. Lilley, R.M.C.; Walker, D.A. An improved spectrophotometric assay for ribulosebisphosphate carboxylase. Biochim. Biophys. Acta 1974, 358, 226–229. [Google Scholar] [CrossRef]
Figure 1. The scanning electron micrograph of the outer (A,B) and the inner surface (C) of the pod wall on the 10th day after pollination (DAP10) under well-watered (A) and water-stressed treatments (B). ST, stoma; EH, epidermal hair; D, dots; H, hump.
Ijms 21 04457 g001
Figure 2. The transmission electron micrograph of cells in the pod wall on DAP5 (A,E), DAP10 (B,F), DAP15 (C,G), and DAP20 (D,H) under well-watered (AD) and water-stressed treatment (EH). CW, cell wall; CP, chloroplast; SG, starch grain; OG, osmiophilic granules; V, central vacuole; CN, cell nucleus; M, mitochondrion; T, thylakoid.
Ijms 21 04457 g002
Figure 3. Effect of drought stress on photosynthetic enzyme activity (nmol min−1 g−1) in the pod wall. Different small letters up the white bar and different capitals up the black bar within one photosynthetic enzyme mean a significant difference at the 0.05 probability level. WW, well-watered; WS, water-stressed.
Ijms 21 04457 g003
Figure 4. Number of proteins differently expressed in pod walls under drought stress. The white and black squares represent, respectively, significant upregulation and downregulation at the 0.05 probability level.
Ijms 21 04457 g004
Figure 5. Cluster analysis of proteins involved in the significant pathway related to photosynthesis in pod walls at different durations after pollination under WW and WS. I, photosynthesis—antenna proteins; II, carbon fixation in photosynthetic organisms; III, photosynthesis.
Ijms 21 04457 g005
Figure 6. The pathways of proteomic mechanisms in the pod wall under drought stress. a, Aspartate aminotransferase; b, malate dehydrogenase; c, malic enzyme; d, phosphoglycerate kinase; e, triosephosphate isomerase; f, fructose-1,6-bisphosphate aldolase; g, fructose-1,6-bisphosphatase; h, ribose-5-phosphate isomerase; i, glucose-6-phosphate isomerase; j, starch synthase; k, pyruvate dehydrogenase E1 beta subunit; l, aconitate hydratase; m, isocitrate dehydrogenase (NADP); n, E1 subunit-like 2-oxoglutarate dehydrogenase, o, ATP-citrate lyase/succinyl-CoA ligase. Three squares from left to right represent WS10 vs. WW10, WS15 vs. WW15, and WS20 vs. WW20, respectively. The red squares represent significant upregulation at the 0.05 probability level. The green squares represent significant low-regulation at the 0.05 probability level. The white squares represent no significance. The red arrows show the damaged part of the chloroplast membrane in the pod wall under WS. Define the Dotted black arrow if possible
Ijms 21 04457 g006
Table 1. Effect of drought stress on the concentration of chlorophyll in the pod wall.
Days after PollinationChlorophyll a
(mg g−1)
Chlorophyll b
(mg g−1)
Total Chlorophyll
(mg g−1)
WWWS WWWSWWWS
DAP50.314 aA0.141 aB0.137 aA0.055 aB0.451 aA0.196 aB
DAP100.138 bA0.085 abB0.064 bA0.044 abA0.202 bA0.128 bB
DAP150.094 bA0.041 bcB0.055 bA0.025 bcB0.149 bA0.066 cB
DAP200.024 cA0.012 cB0.019 cA0.010 cB0.043 cA0.022 dB
WW, well-watered; WS, water-stressed. Different small letters in the same column and different capitals in the same row meant a significant difference at the 0.05 probability level.
Table 2. Different expression of proteins involved in some pathways in the pod wall under drought stress.
KEGGAccessionProteinsFold
WS10 vs. WW10WS15 vs. WW15WS20 vs. WW20
Amino sugar and nucleotide sugar metabolismA0A072UKS2PfkB family carbohydrate kinaseNSNS0.4
A0A072VQZ5UDP-D-apiose/UDP-D-xylose synthaseNSNS0.2
G7JUS9UDP-glucuronic acid decarboxylase NS3.30.4
G7ID31ChitinaseNSNS5.0
G7LA76Chitinase (Class Ib)/HeveinNSNS3.3
Ascorbate and aldarate metabolismA0A072TLF4Myo-inositol oxygenase0.4NSNS
A0A072U2G7NAD-dependent aldehyde dehydrogenase family protein0.23.3NS
A0A072UQP6UDP-glucose 6-dehydrogenase2.5NSNS
G7L571UDP-glucose 6-dehydrogenaseNS2.5NS
A0A072V120UTP-glucose-1-phosphate uridylyltransferaseNS2.5NS
A0A072V151L-ascorbate oxidase5.0NSNS
A0A072VNM9GME GDP-D-mannose-3, 5-epimeraseNS3.30.1
G7L1 × 0GME GDP-D-mannose-3, 5-epimerase 2.5NS0.3
G7JTZ5Aldo/keto reductase family oxidoreductase0.5NSNS
G7KAG7Thylakoid lumenal 29 kDa protein 0.3NSNS
beta-Alanine metabolismA0A072UCM6Glutamate decarboxylaseNSNS0.2
Carbon metabolismG7IT85Phosphoglycerate kinase NSNS3.3
G7IT86Phosphoglycerate kinase NSNS3.3
G7KJZ8Glucose-6-phosphate isomerase NSNS0.4
G7L1U4Ribose-5-phosphate isomerase A NSNS0.4
I3S3S0Cytosolic triosephosphate isomeraseNSNS2.0
A0A072VS77Methylenetetrahydrofolate reductaseNS3.30.3
Starch and sucrose metabolismA0A072UCM8Phosphotransferase 0.3NSNS
A0A072UKS2PfkB family carbohydrate kinase NSNS0.4
A0A072UU47Glycoside hydrolase family 1 protein 3.3NSNS
A0A072VLQ9Starch synthase2.5NSNS
G7IJV7Glycoside hydrolase family 3 protein 0.3NSNS
G7KJZ8Glucose-6-phosphate isomeraseNSNS0.4
Citrate cycle (TCA cycle)G7KVS0E1 subunit-like 2-oxoglutarate dehydrogenaseNSNS0.3
G7JYQ8Aconitate hydrataseNSNS0.3
B7FJJ4Pyruvate dehydrogenase E1 beta subunitNS2.02.5
G7KHI5Isocitrate dehydrogenase [NADP] NSNS0.2
A2Q2V1ATP-citrate lyase/succinyl-CoA ligaseNS2.50.1
Glycine, serine and threonine metabolismA0A072URB1Amine oxidaseNSNS5.0
A0A072V290Amine oxidaseNSNS3.3
G7J7B0Amine oxidaseNSNS5.0
A9YWS0Serine hydroxymethyltransferaseNSNS0.2
G7I9Z0Glycine dehydrogenase [decarboxylating] proteinNSNS0.4
G7JJ96AminomethyltransferaseNSNS0.3
G7JNS2NAD-dependent aldehyde dehydrogenase family proteinNSNS0.4
G7L9H1Phosphoserine aminotransferaseNSNS0.3
Linoleic acid metabolismA0A072UMH4Lipoxygenase0.5NSNS
G7J629Lipoxygenase0.4NSNS
G7LIX7Lipoxygenase5.0NSNS
G7LIY0Lipoxygenase5.0NS0.4
G7LIY2Lipoxygenase10.0NSNS
G7J632Lipoxygenase2.52.5NS
Oxidative phosphorylationA0A072URM9Archaeal/vacuolar-type H+-ATPase subunit ANS2.0NS
A0A072V4G2F0F1 ATP synthase subunit gammaNS0.5NS
A0A072W1H5ATP synthase subunit beta NS2.5NS
A0A126TGR5ATP synthase subunit alphaNS2.0NS
B7FN64NADH dehydrogenaseNS0.4NS
G7JIL4V-type proton ATPase subunit aNS2.50.3
G7I9M9ATP synthase D chainNS5.0NS
PhagosomeA0A072VSL4Archaeal/vacuolar-type H+-ATPase subunit BNSNS0.4
B7FMK2Archaeal/vacuolar-type H+-ATPase subunit ENSNS3.3
G7KSI7Archaeal/vacuolar-type H+-ATPase subunit BNSNS0.3
G7LIN7Tubulin beta-1 chainNSNS5.0
Plant–pathogen interactionB7FNA2EF hand calcium-binding family proteinNSNS2.5
G7I7Q4Heat shock protein 81-2 NS2.50.2
G7IDZ4Heat shock protein 81-2 NSNS0.1
A0A072U9J1Heat shock protein 81-2 2.55.00.3
ProteasomeA0A072TQB8Glyceraldehyde-3-phosphate dehydrogenaseNSNS10
B7FGZ8Proteasome subunit beta typeNSNS2.5
G7JTX36S proteasome regulatory subunit S2 1BNS5.00.3
I3RZQ6Proteasome subunit alpha typeNSNS3.3
I3SSX1Proteasome subunit alpha typeNSNS2.5
alpha-linolenic acid metabolismG7J5N1Uncharacterized protein 3.3NSNS
Q711Q9Allene oxide cyclase2.50.1NS
Fold change over 2.0 means significant (p < 0.05) upregulation and below 0.5 means significant (p < 0.05) downregulation. NS, nonsignificant.

