Targeted Metabolomic Analysis of a Mucopolysaccharidosis IIIB Mouse Model Reveals an Imbalance of Branched-Chain Amino Acid and Fatty Acid Metabolism

 ,
,  ,
,  , and
, and 
Abstract
:
1. Introduction
2. Results
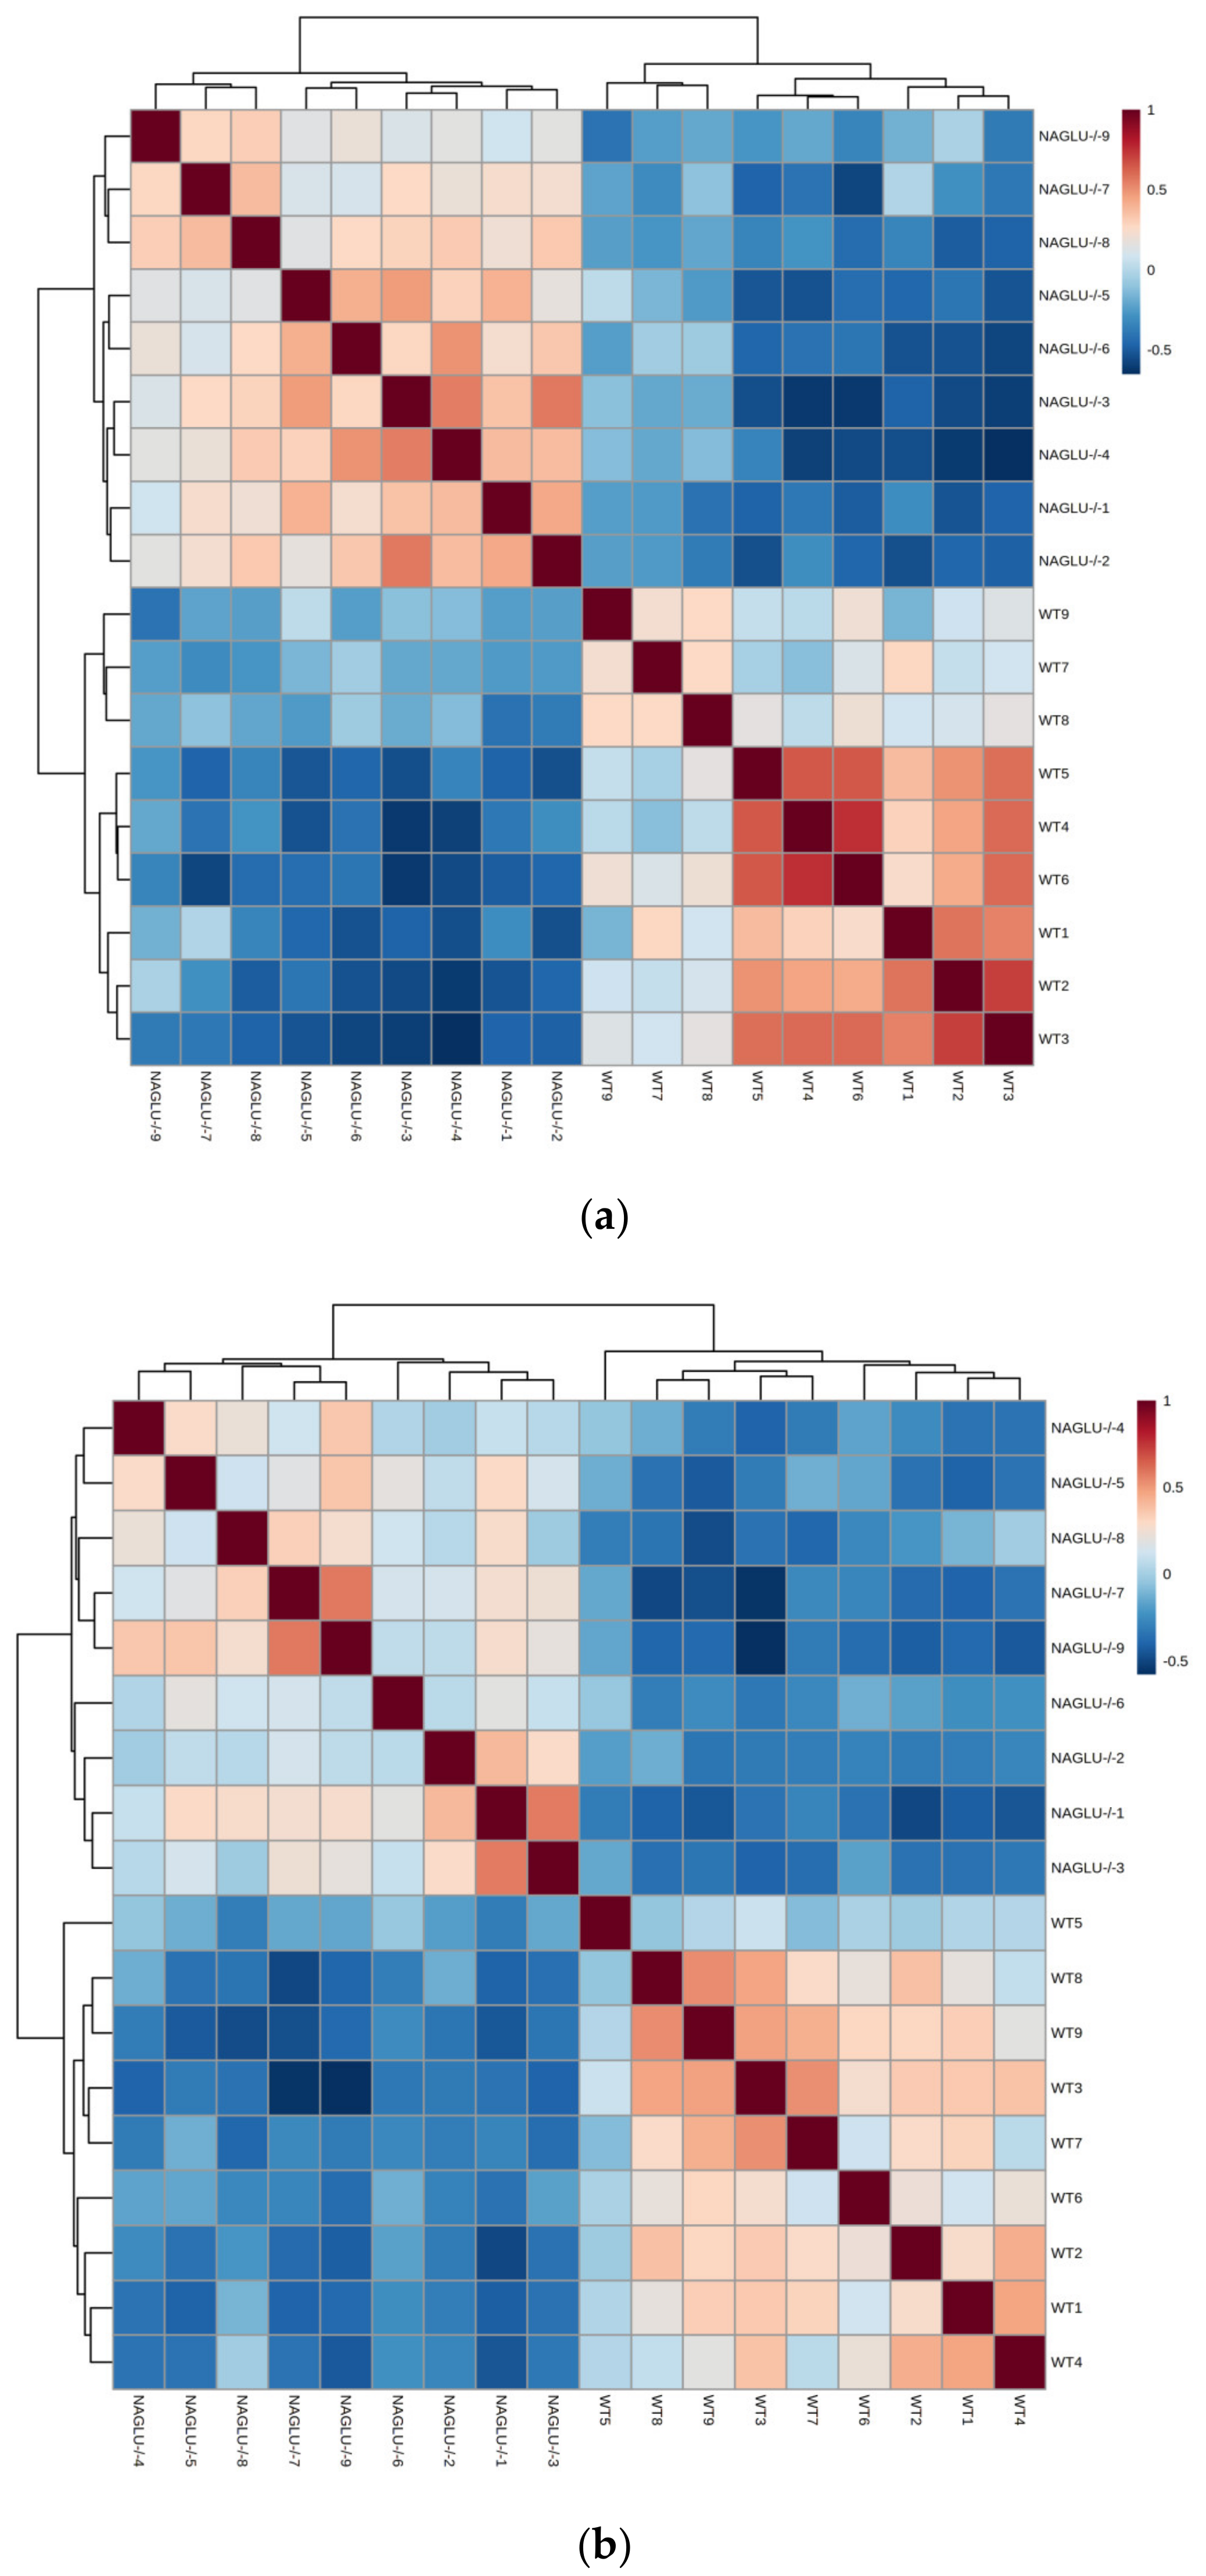
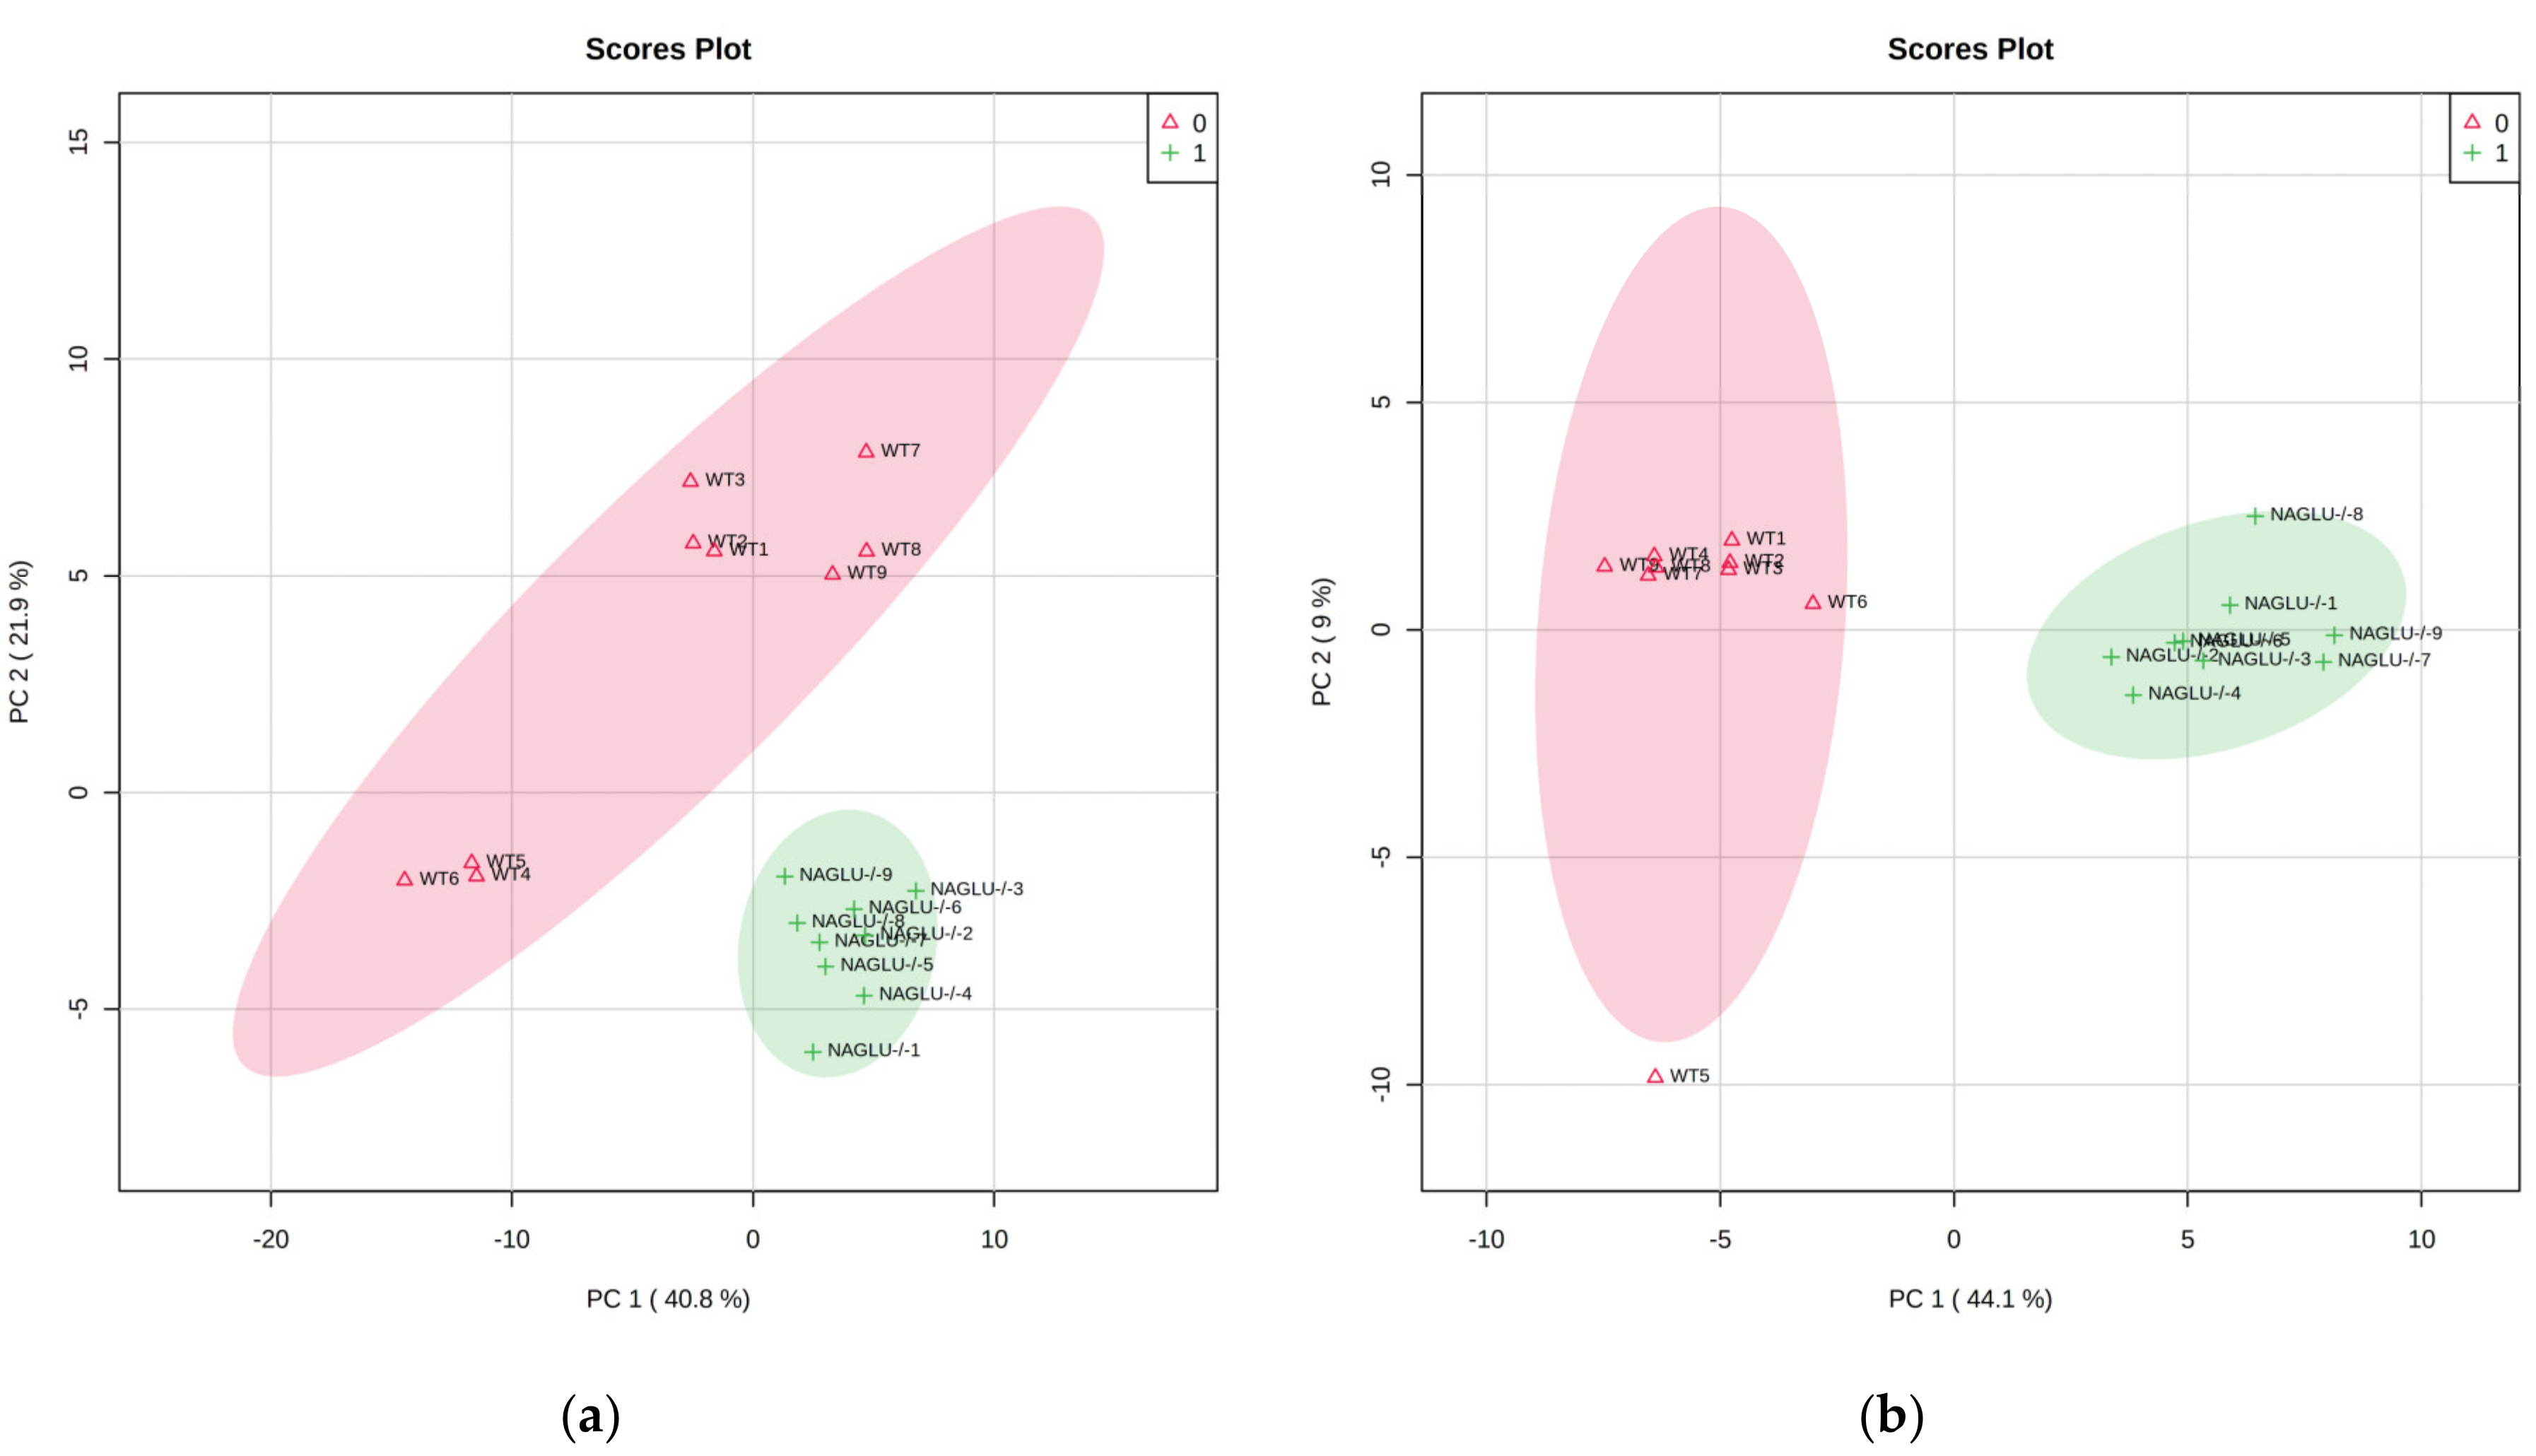
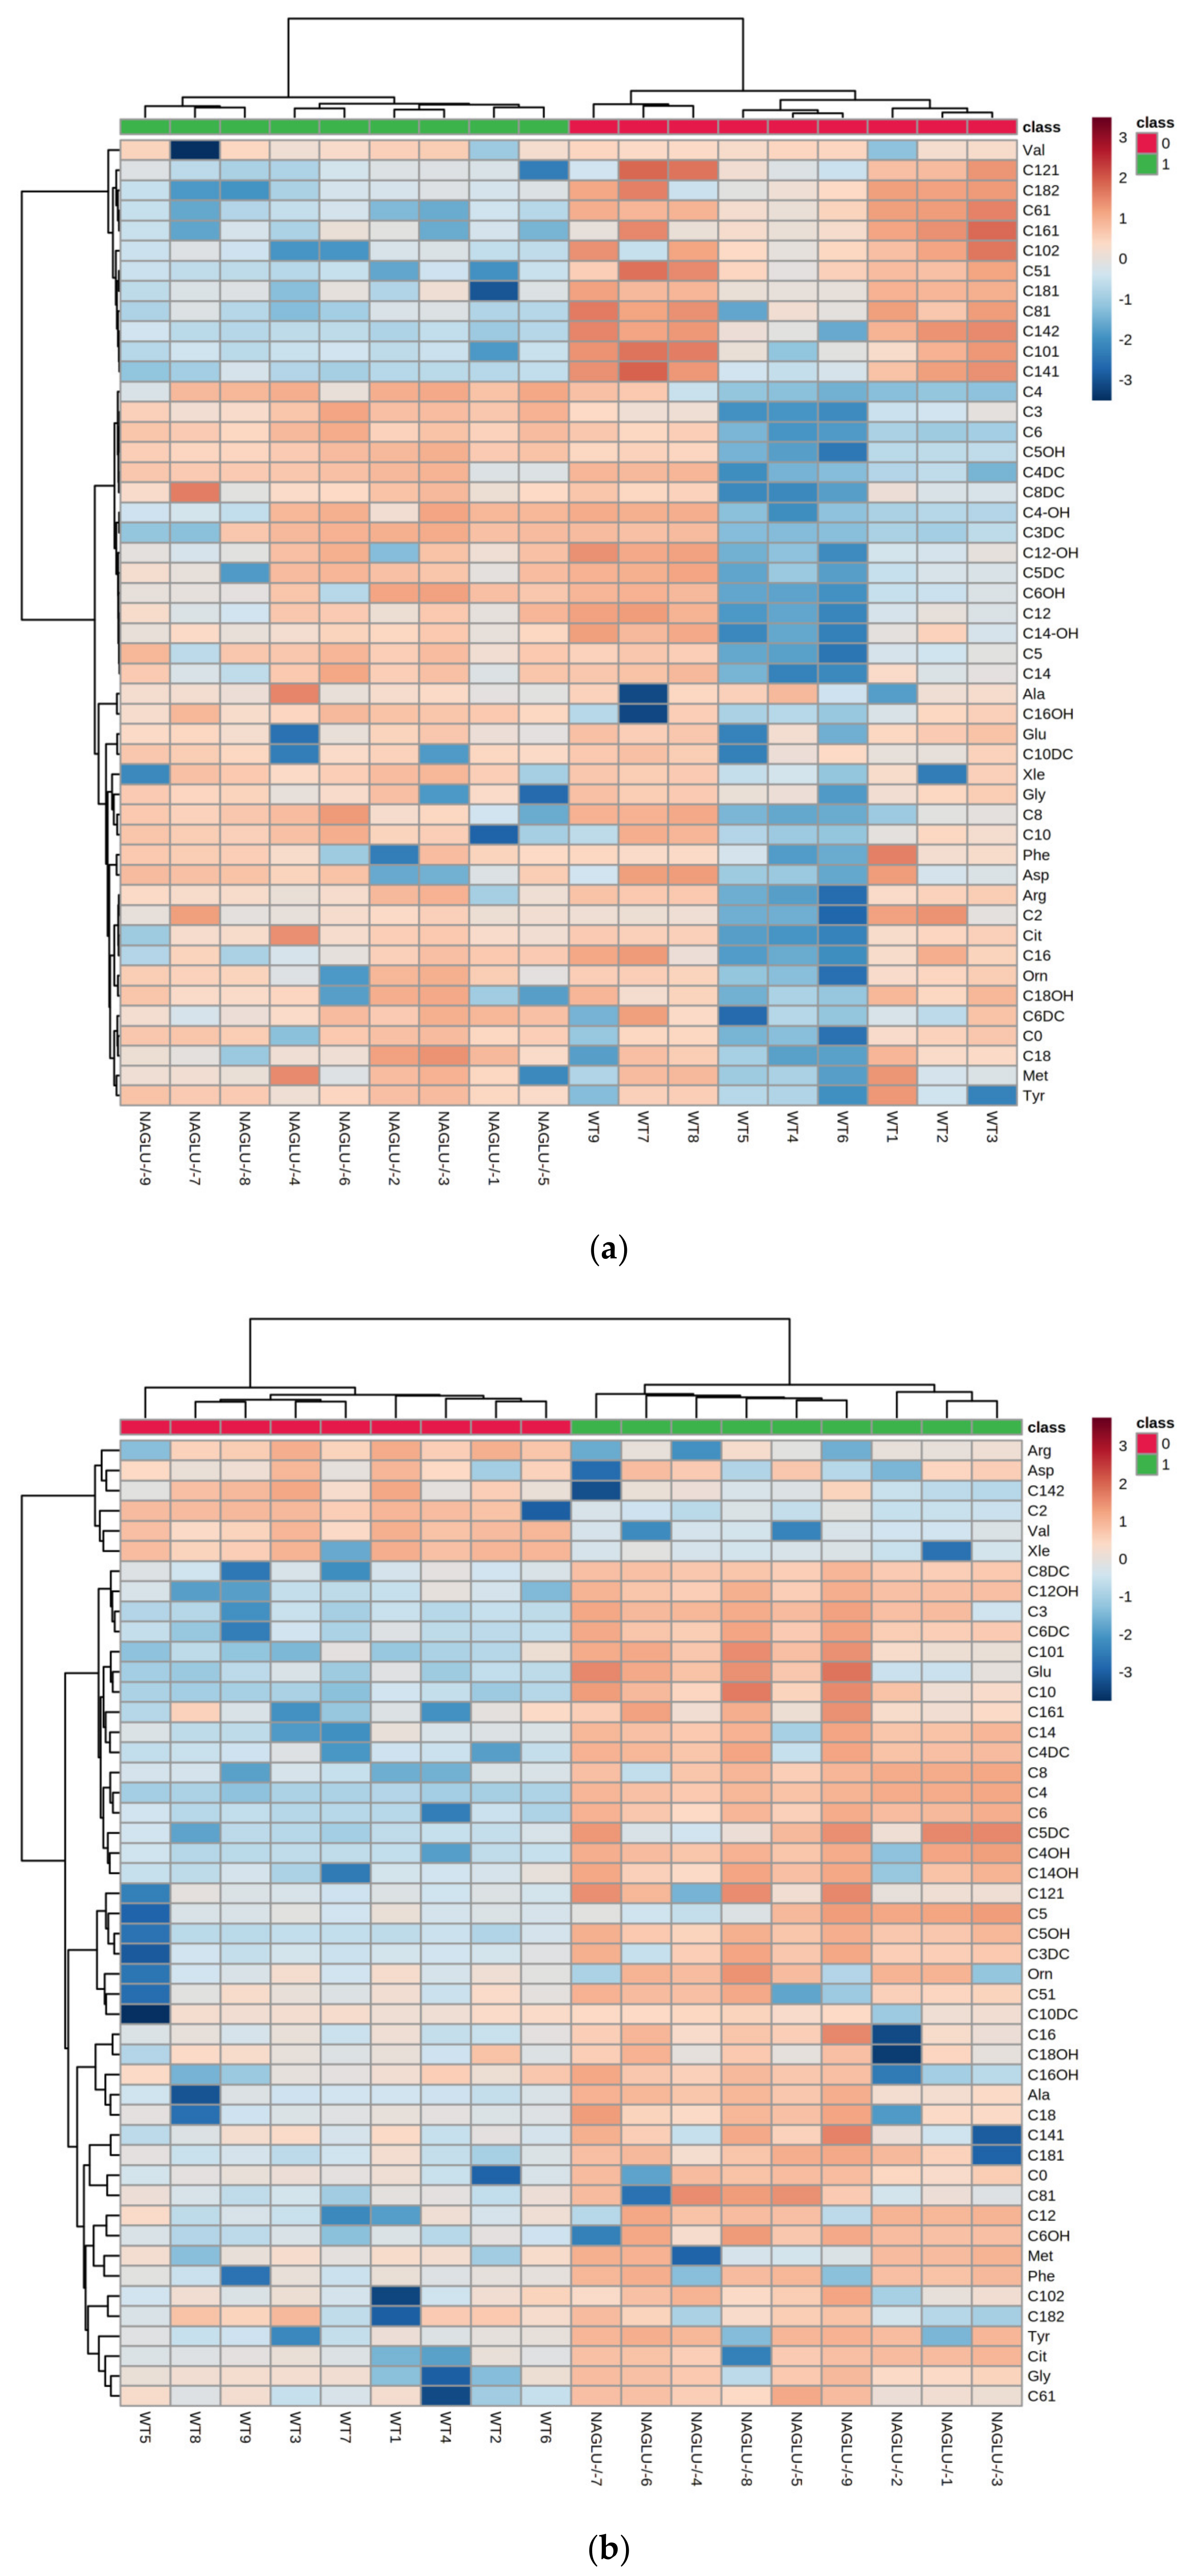
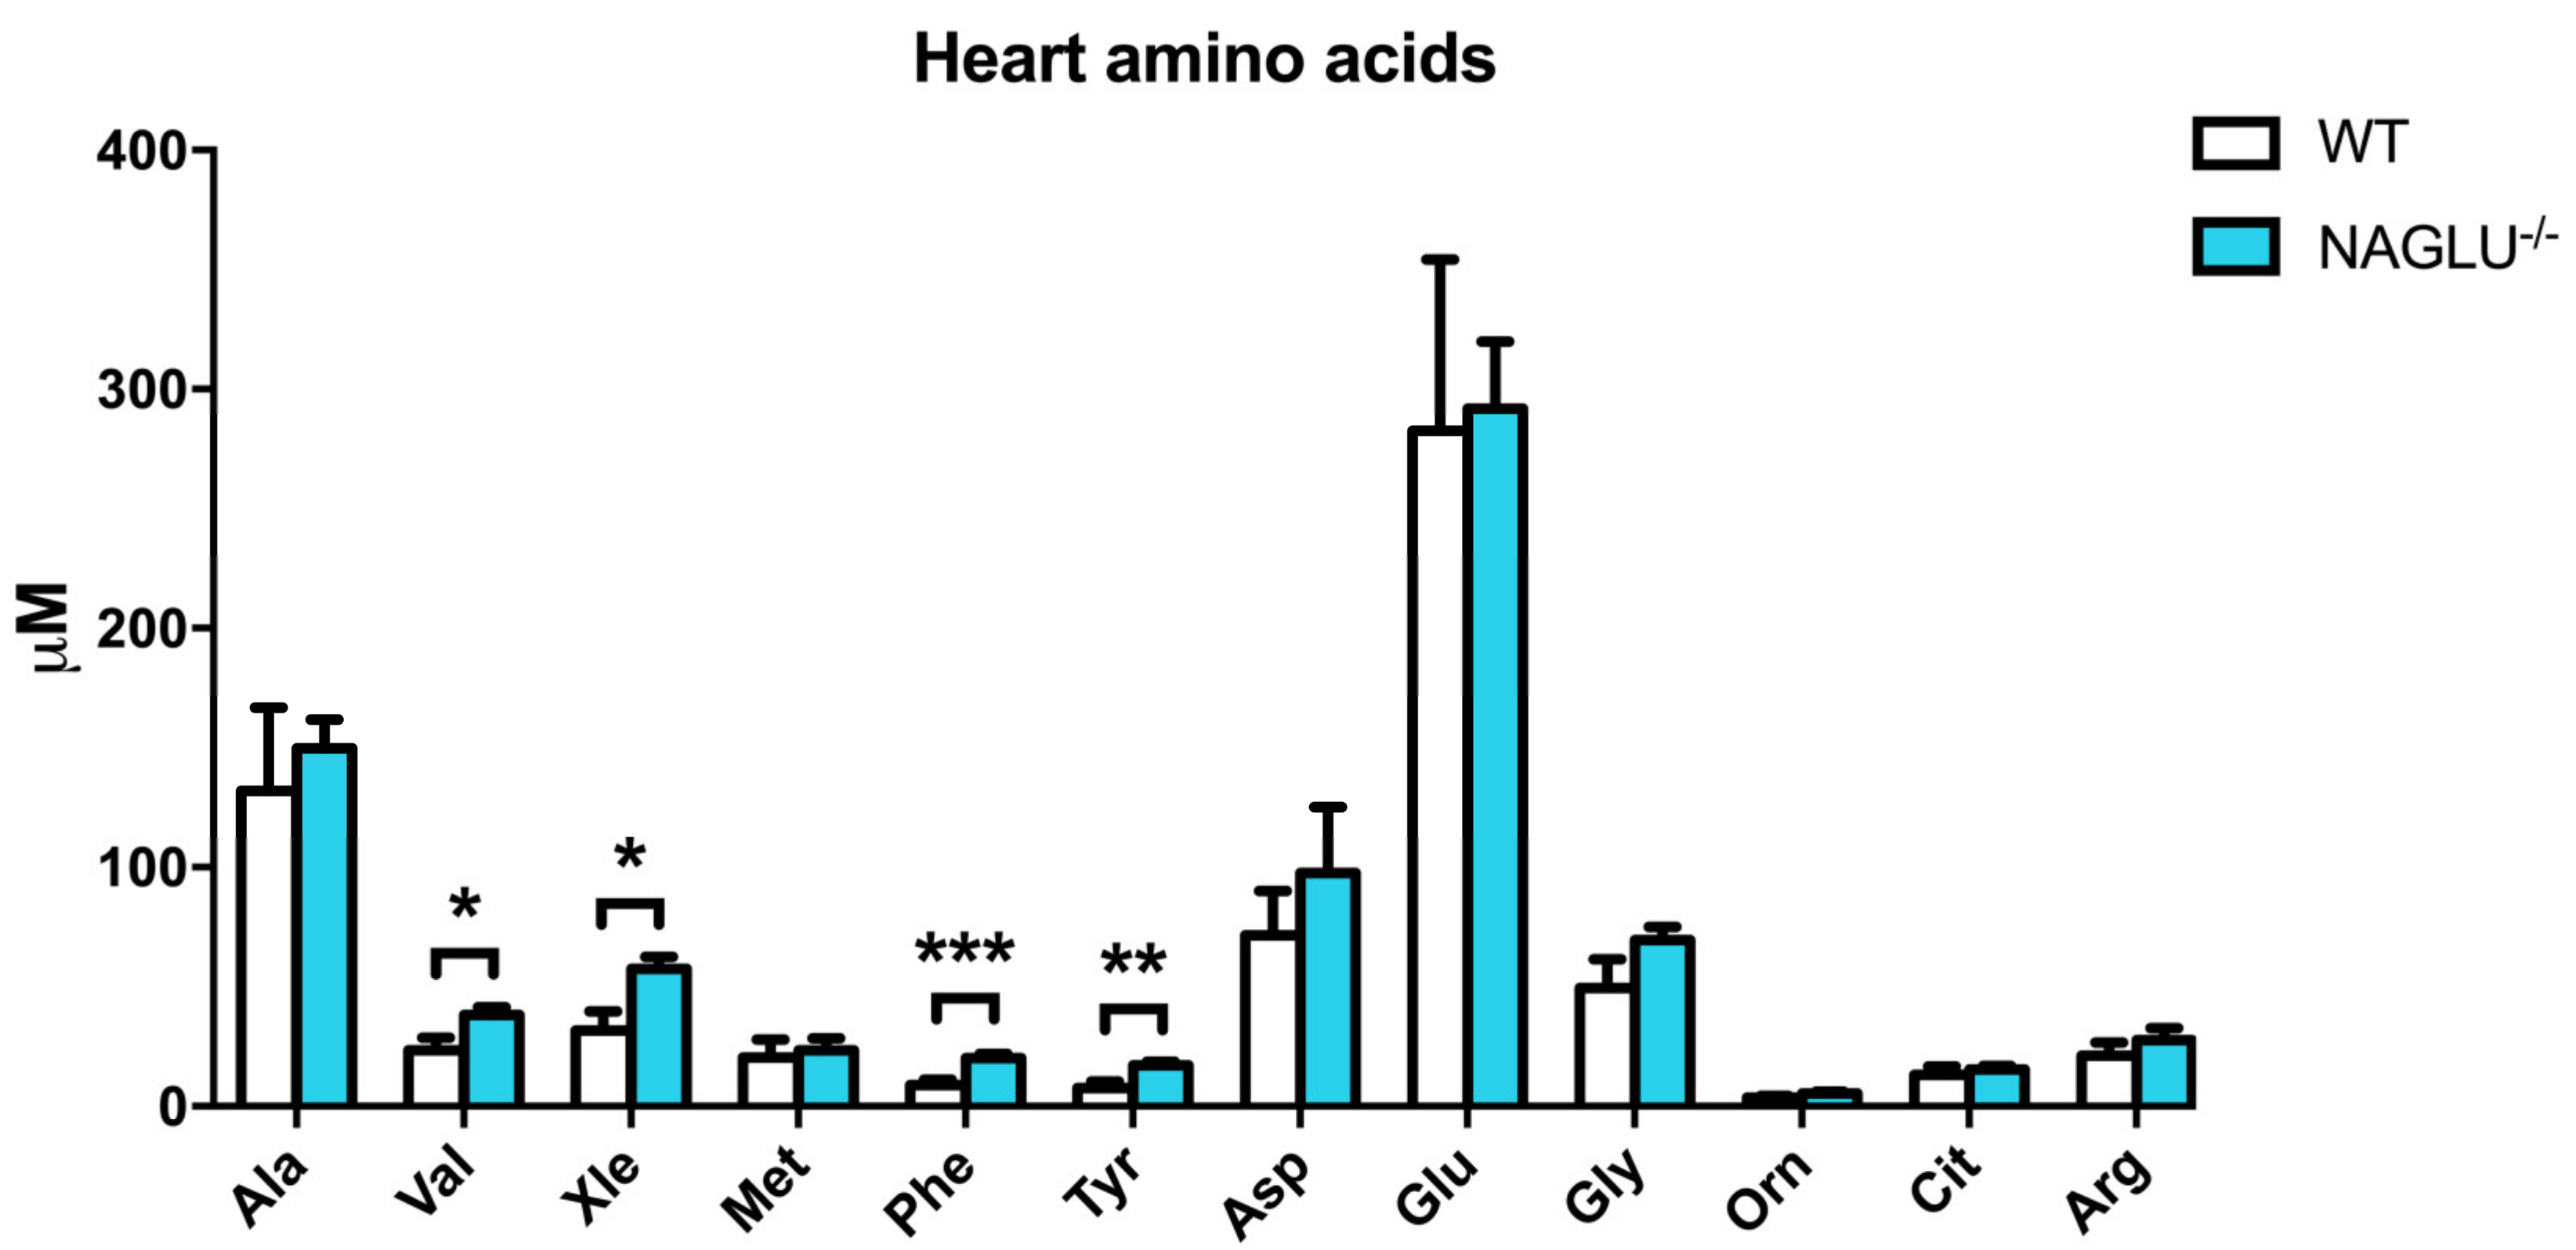
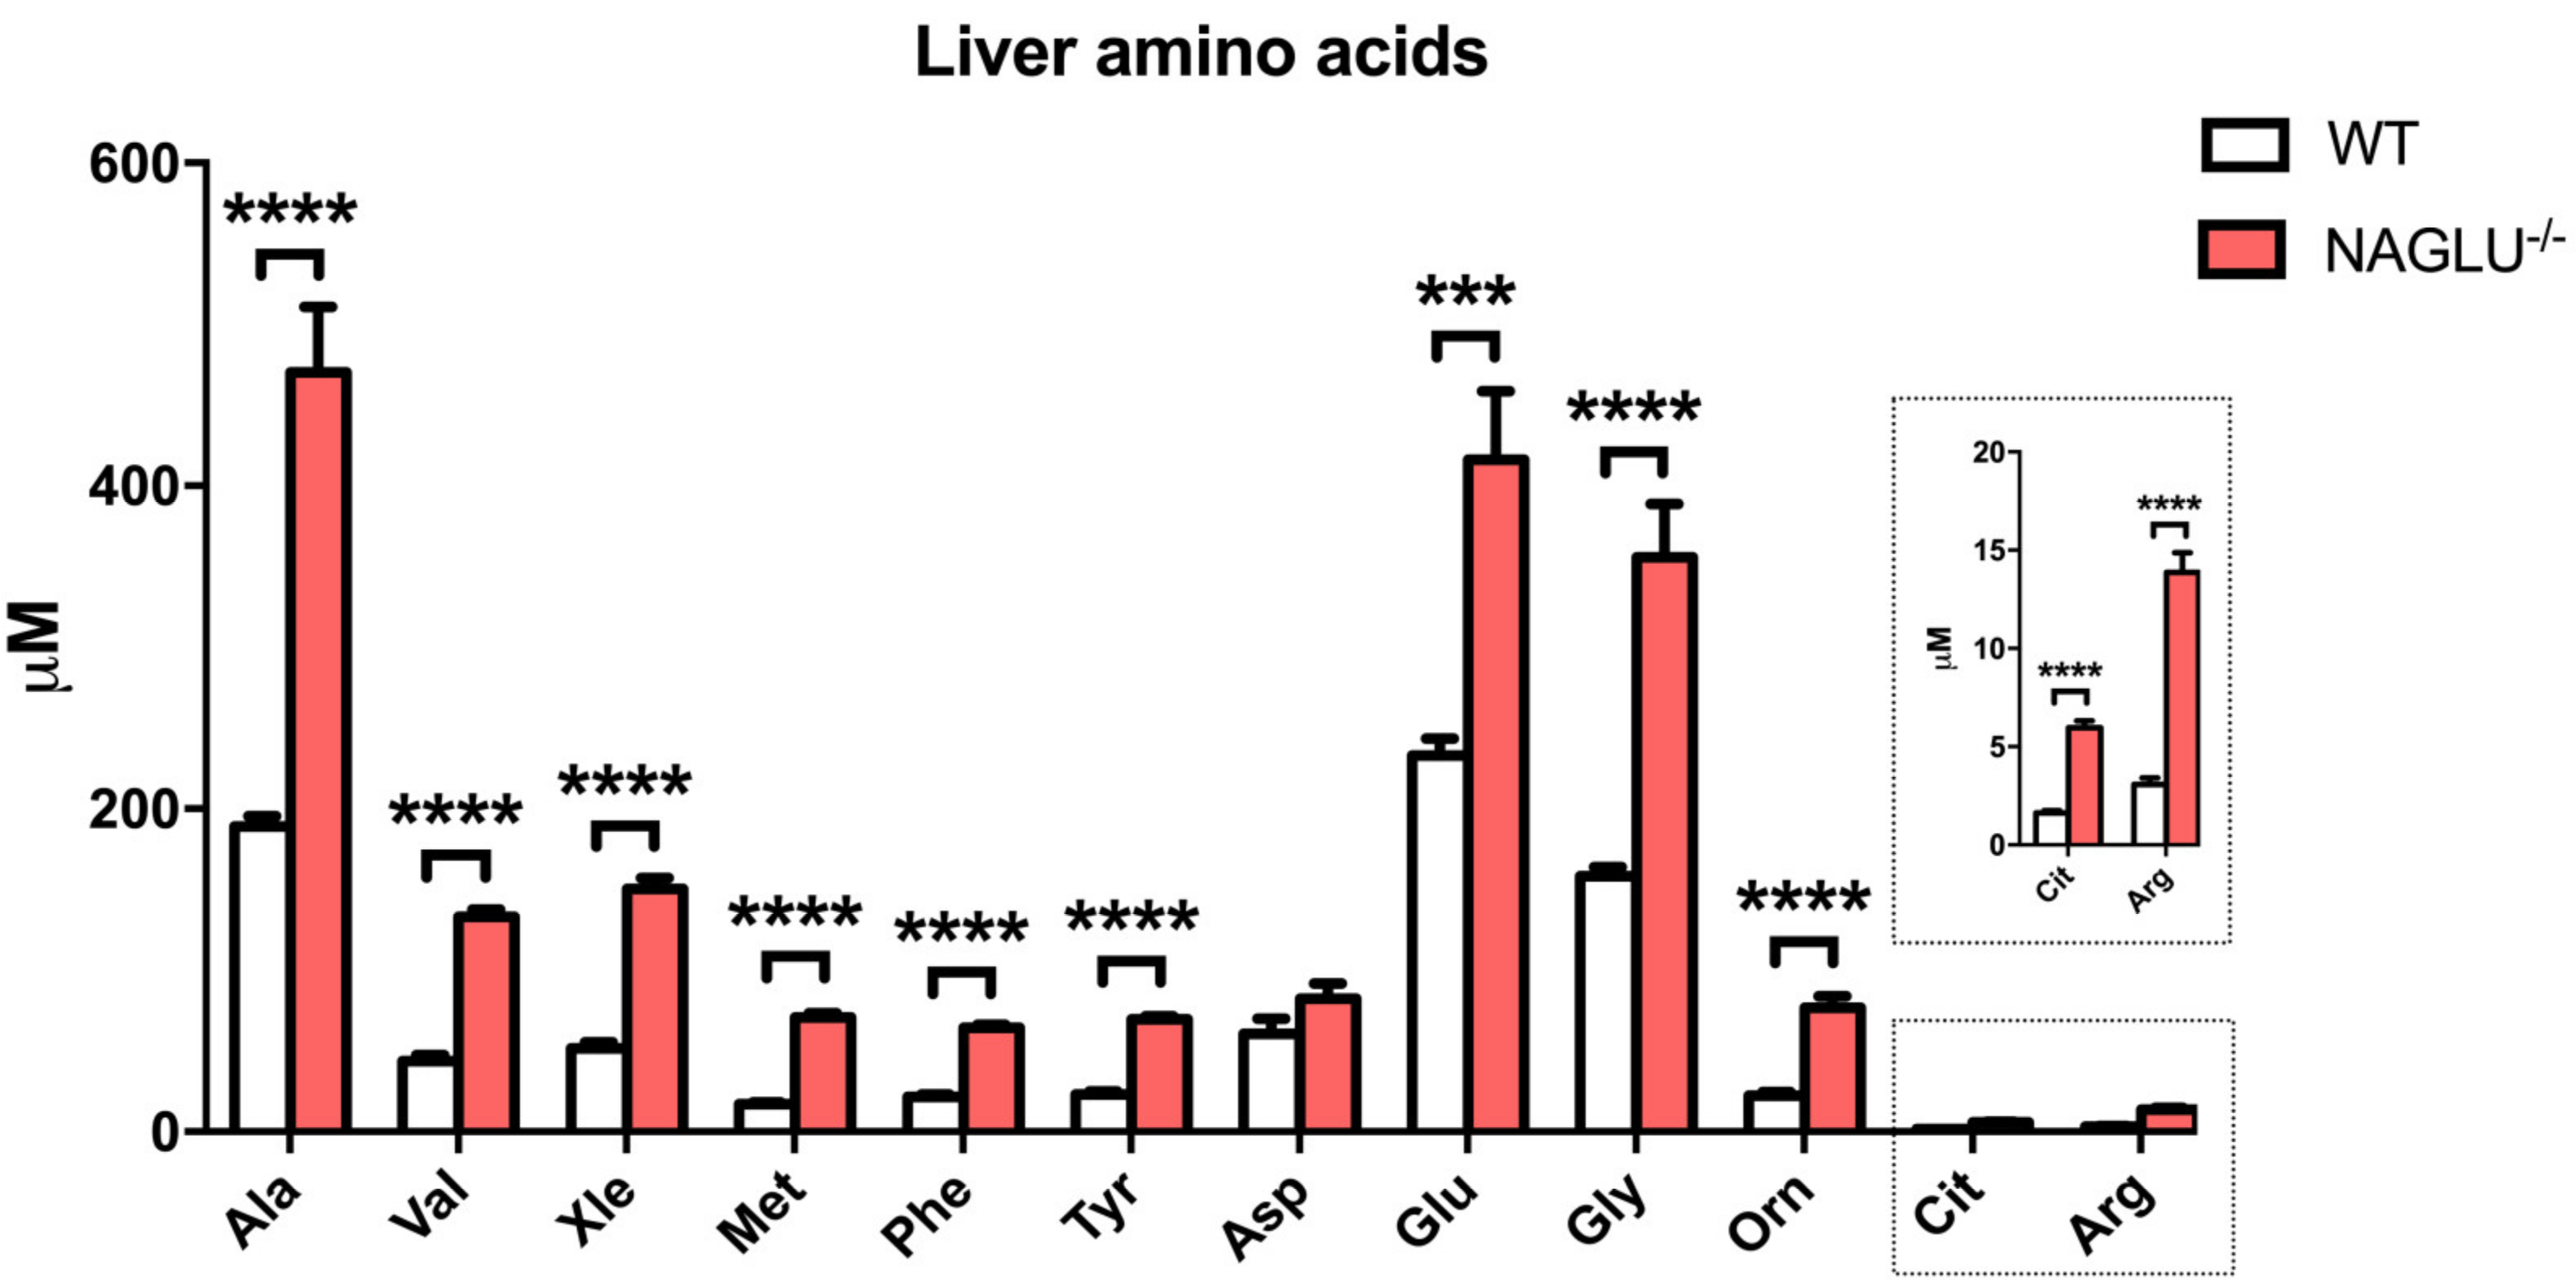
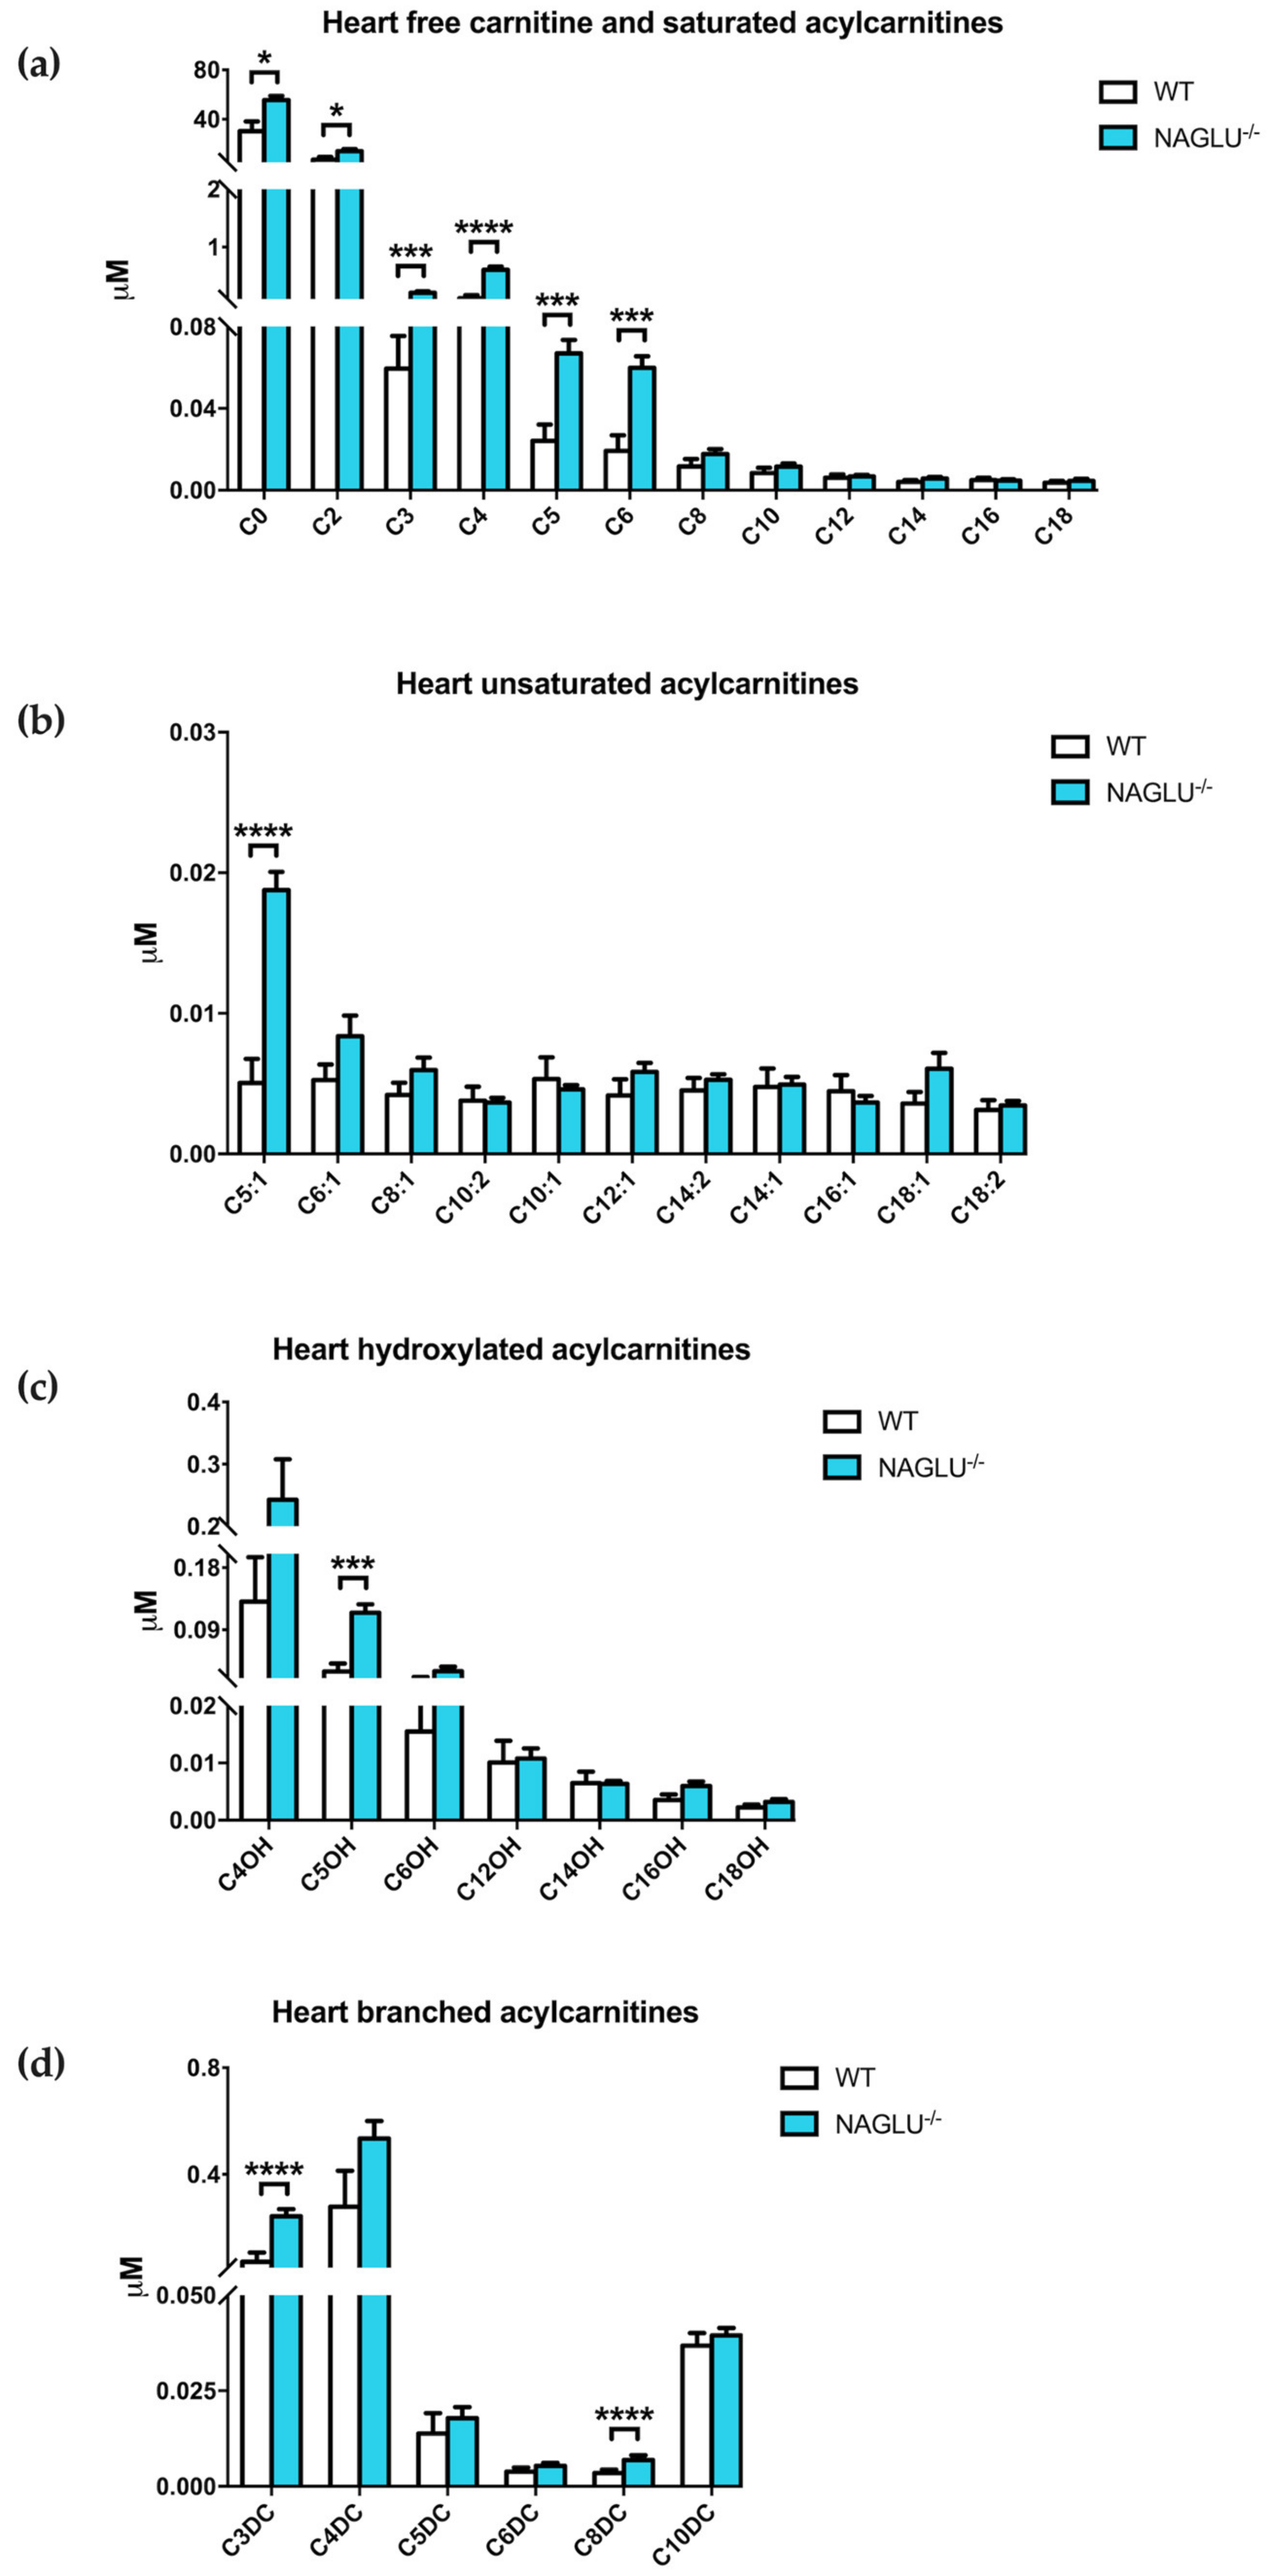
2.1. Metabolomic Profiles of Heart and Liver of MPS IIIB Mice
2.2. Heart- and Liver-Specific Metabolomic Changes in MPS IIIB Mice
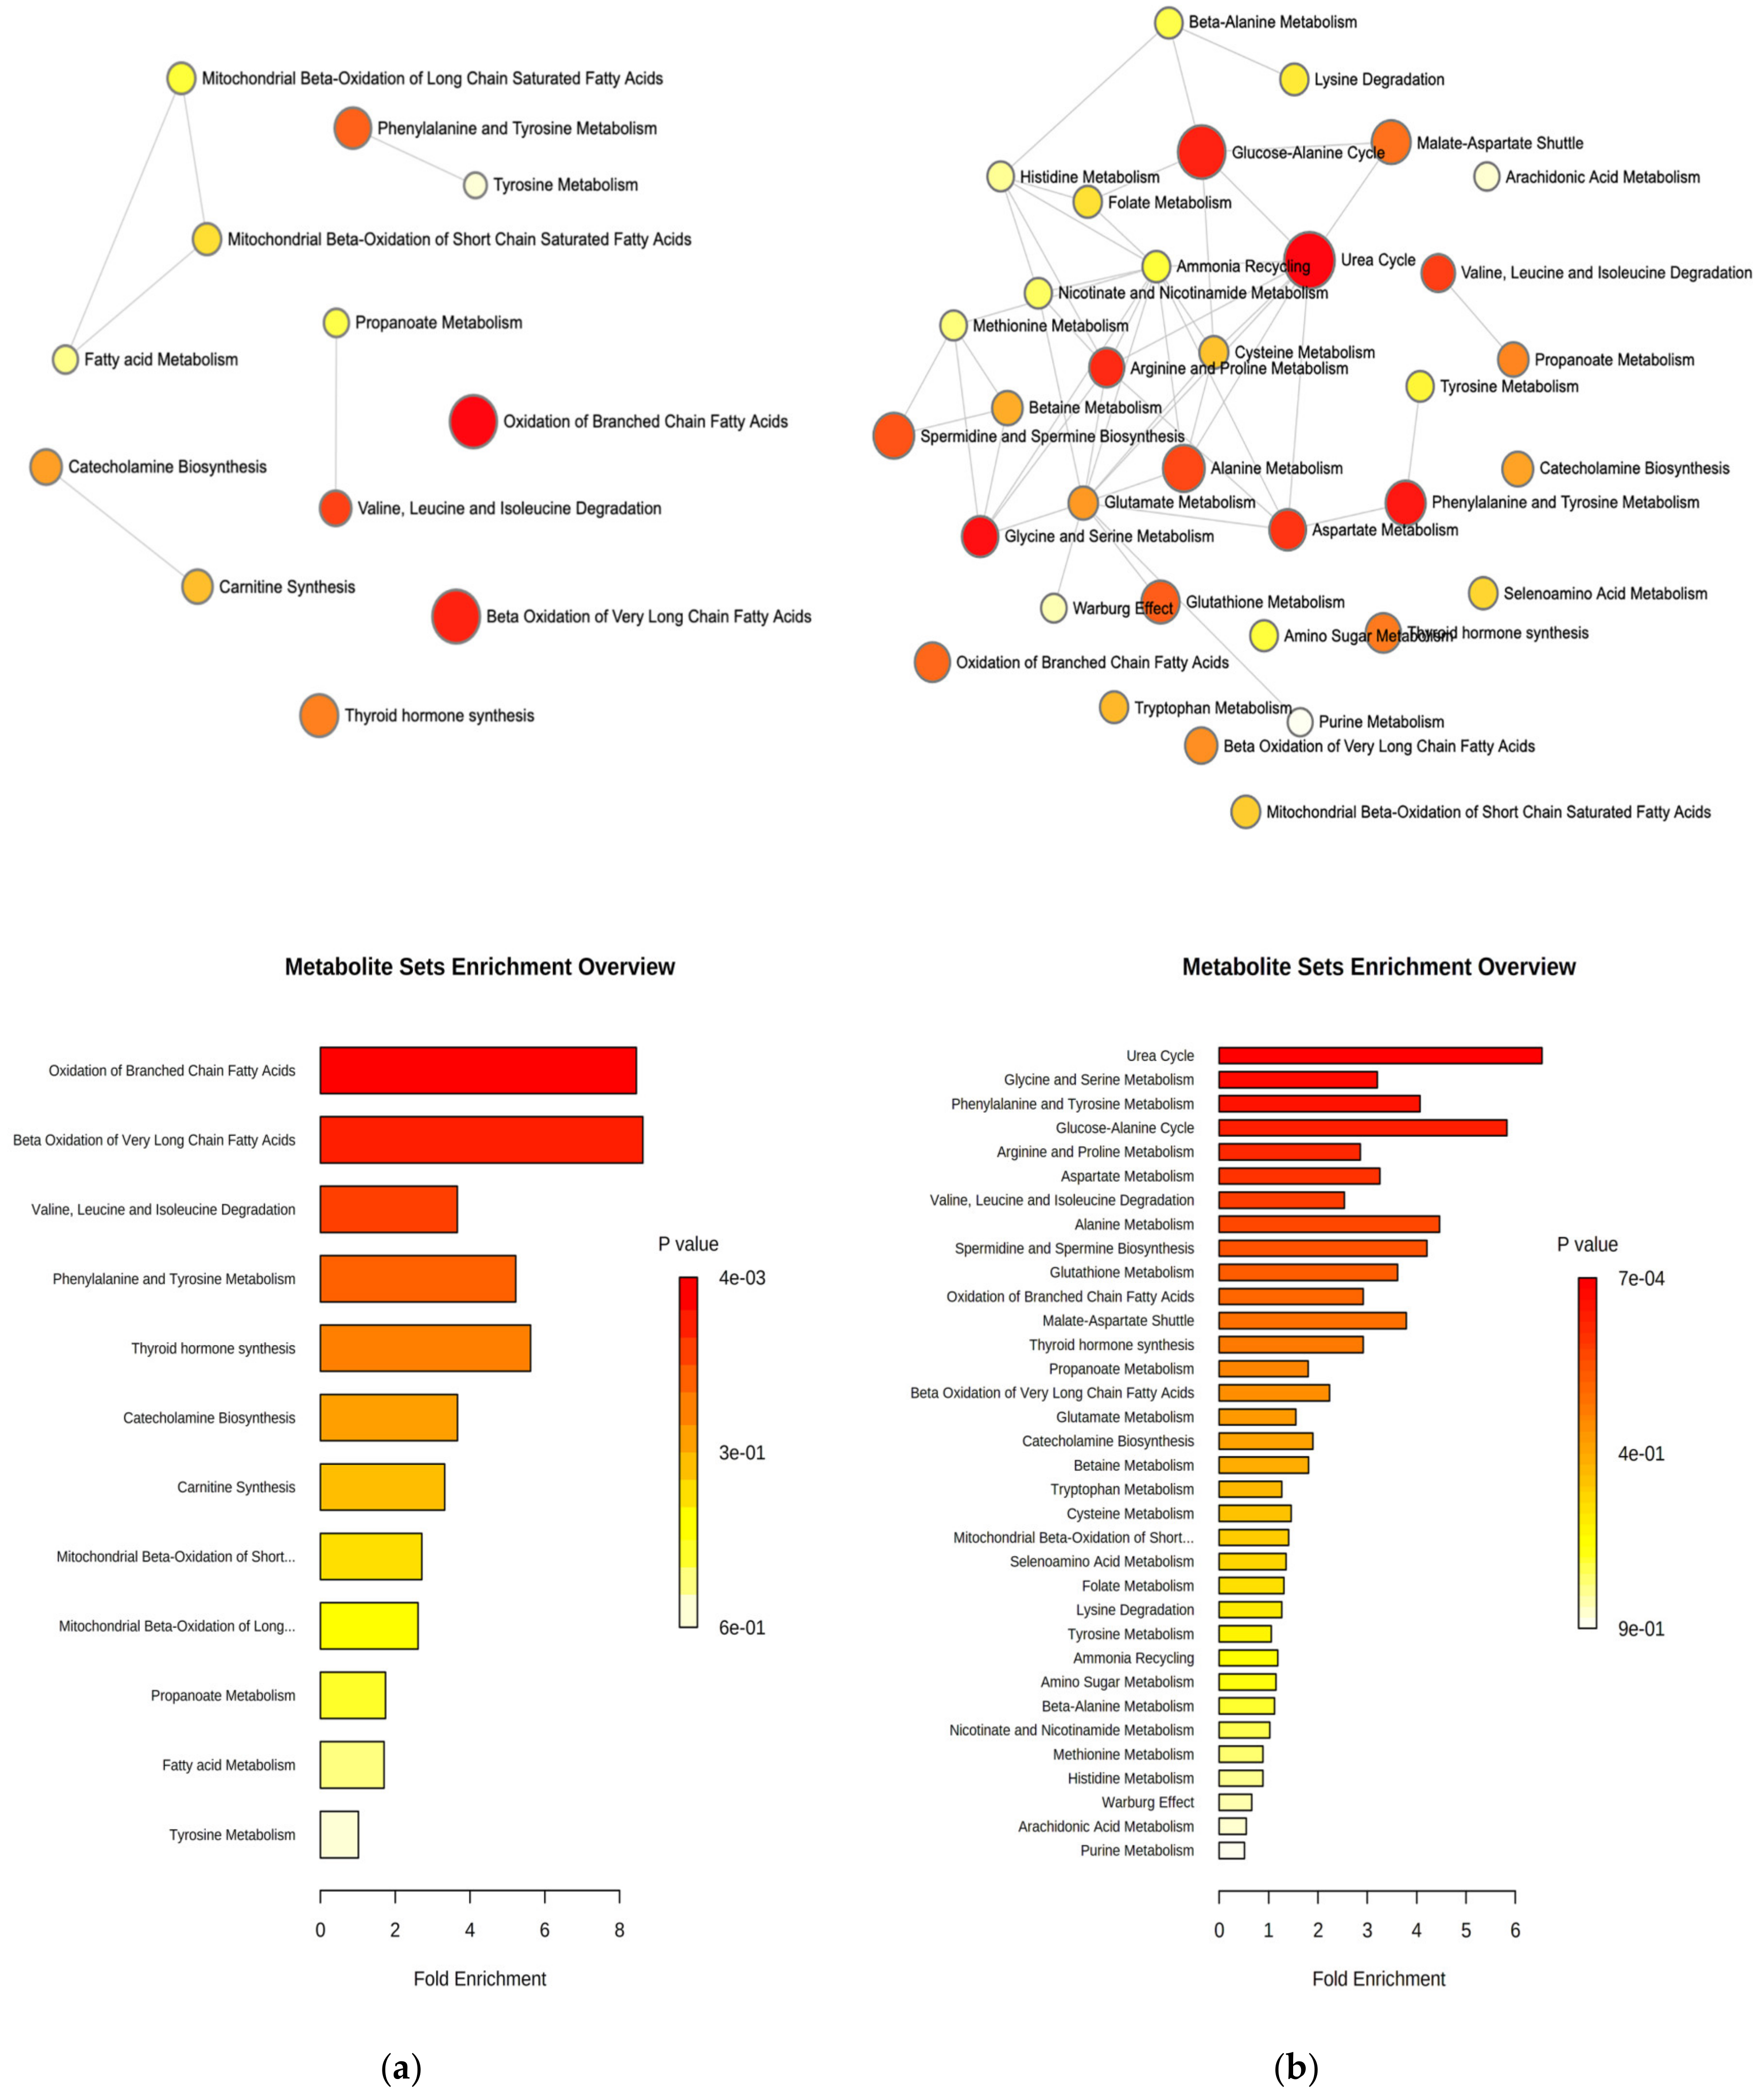
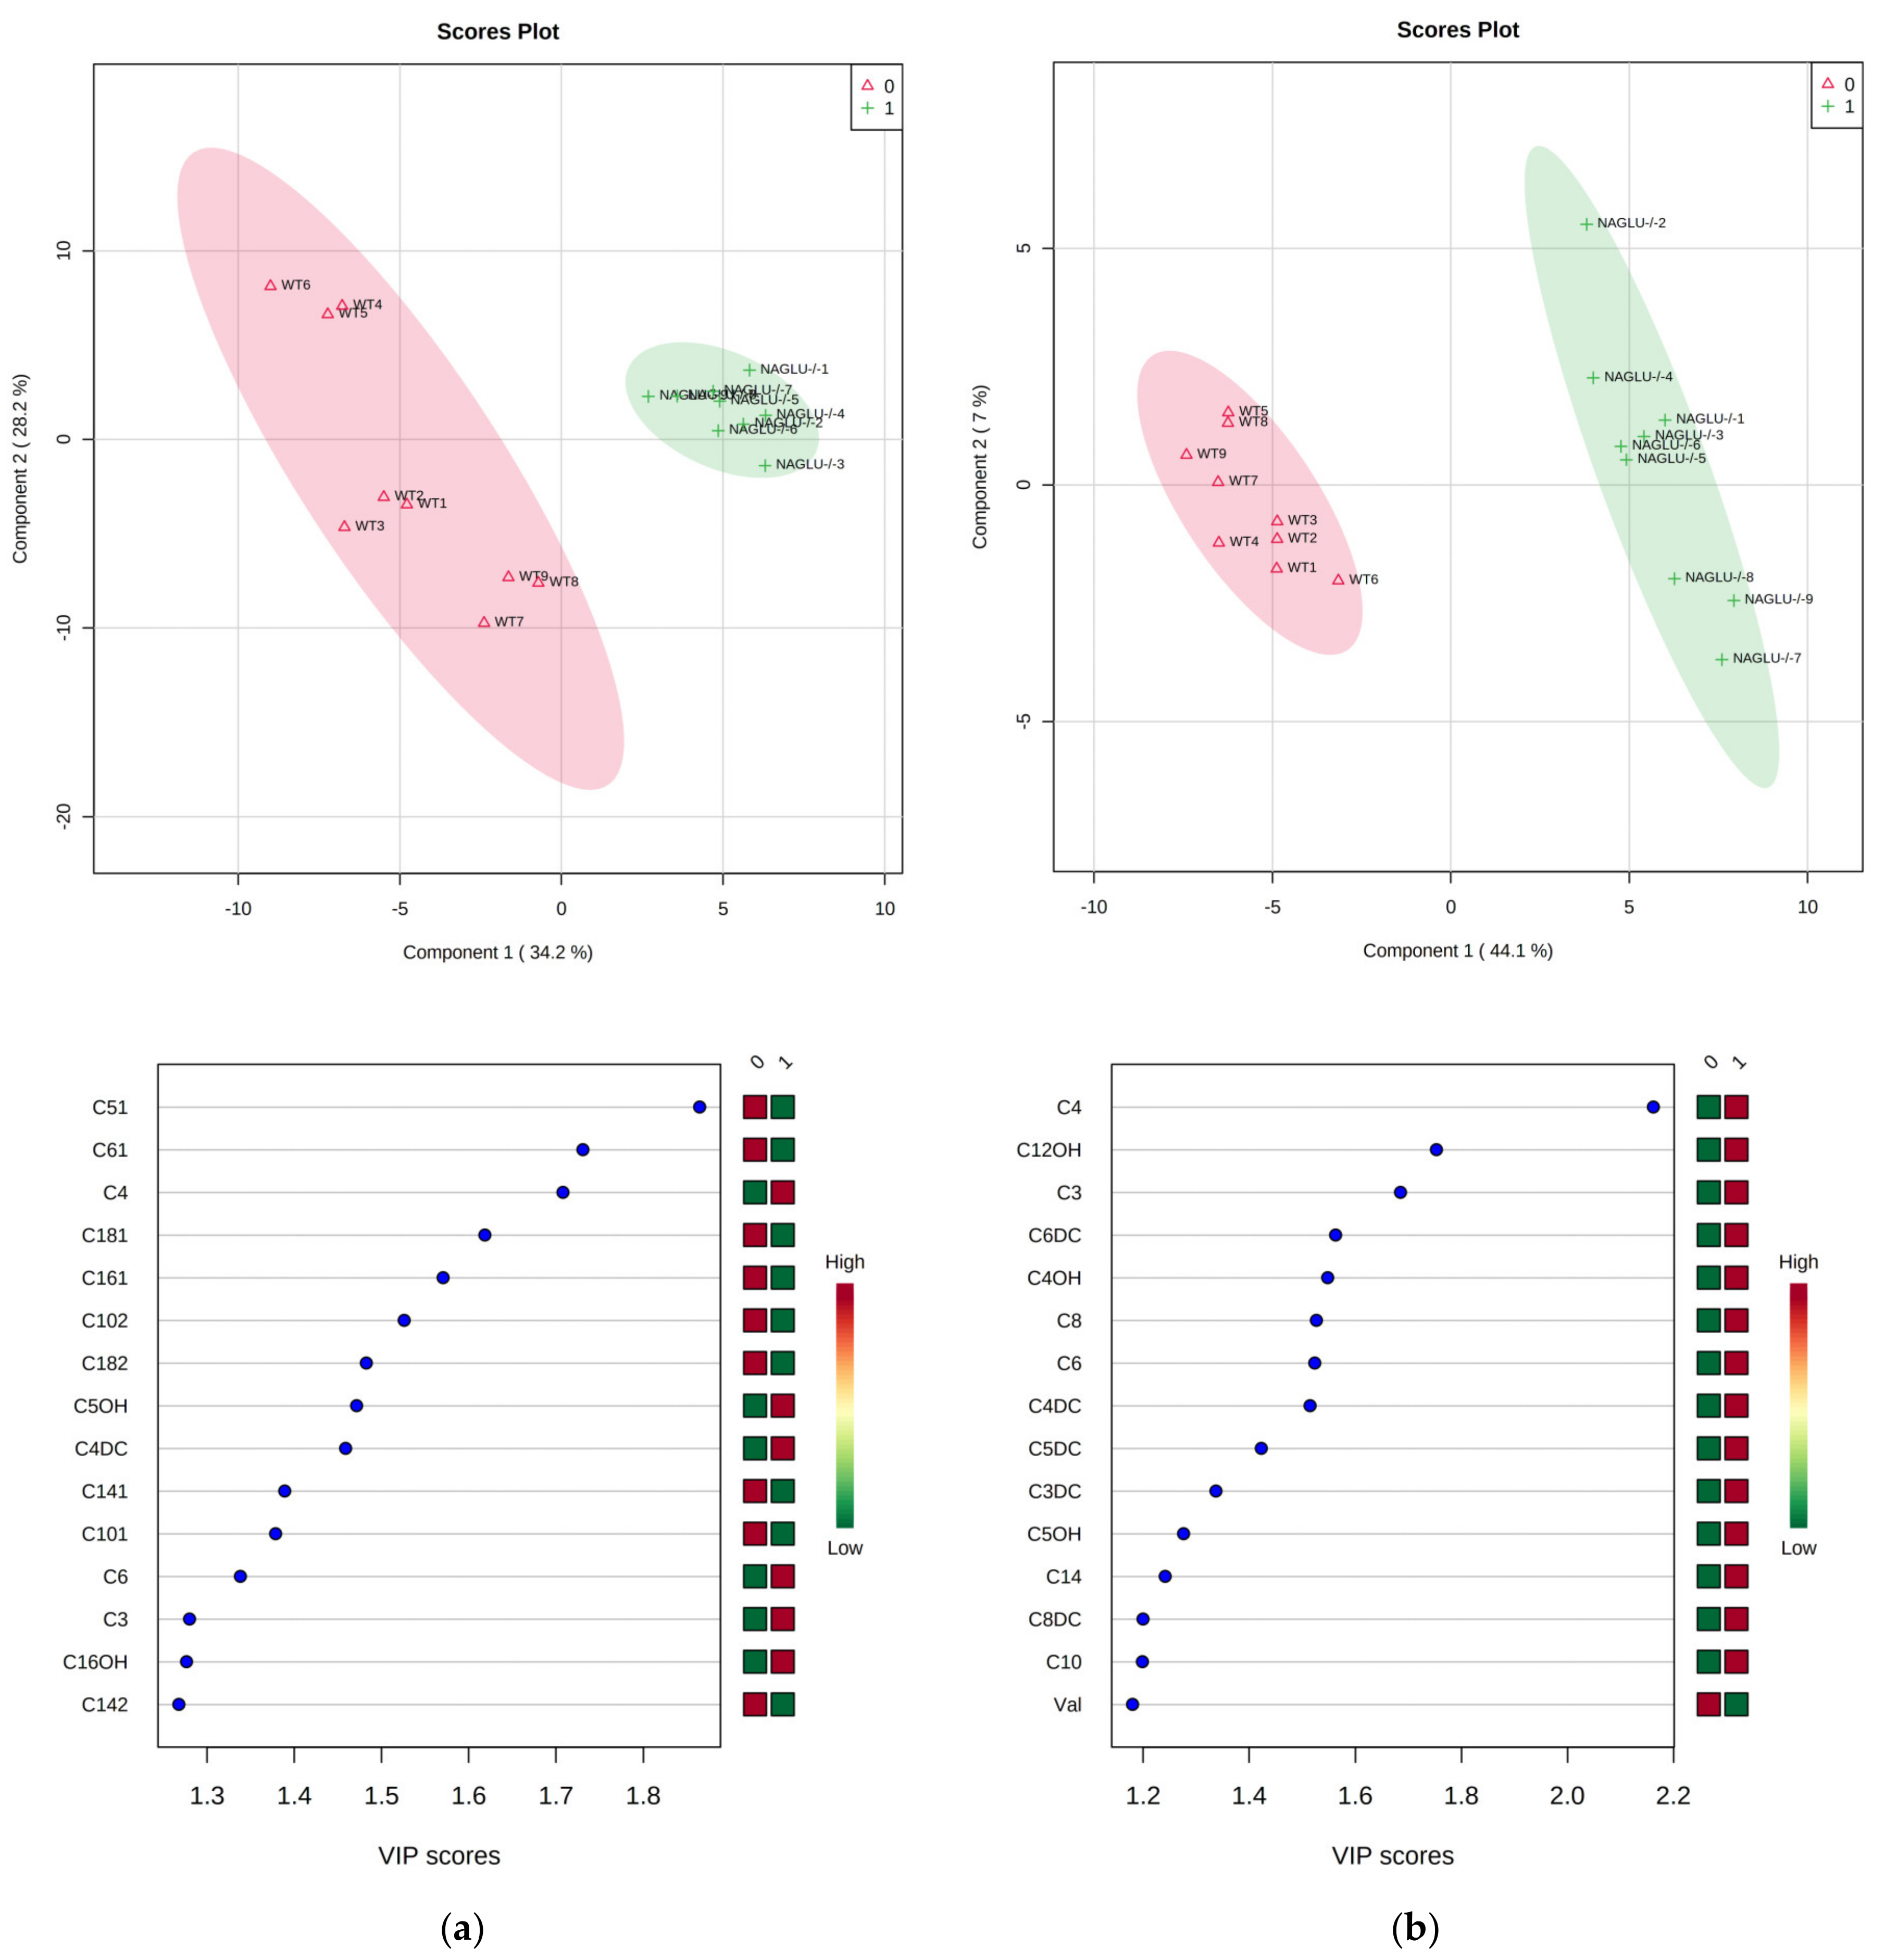
2.3. Pathway Analysis and Discriminant Metabolites Identification
3. Discussion
4. Materials and Methods
4.1. Animals
4.2. Extraction and Derivatization of the Metabolites
4.3. Metabolite LC-MS/MS Measurements
4.4. Metabolite Statistical Analysis and Feature Selection
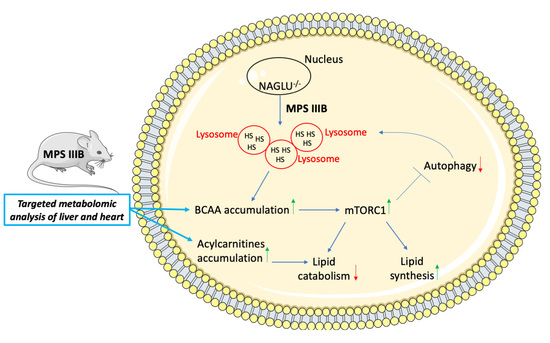
5. Conclusions
Supplementary Materials
Author Contributions
Funding
Acknowledgments
Conflicts of Interest
References
- Sun, A. Lysosomal storage disease overview. Ann. Transl. Med. 2018, 6, 476. [Google Scholar] [CrossRef] [PubMed]
- Platt, F.M.; d’Azzo, A.; Davidson, B.L.; Neufeld, E.F.; Tifft, C.J. Lysosomal storage diseases. Nat. Rev. Dis Primers 2018, 4, 27. [Google Scholar] [CrossRef] [PubMed]
- Vitner, E.B.; Platt, F.M.; Futerman, A.H. Common and uncommon pathogenic cascades in lysosomal storage diseases. J. Biol. Chem. 2010, 285, 20423–20427. [Google Scholar] [CrossRef] [Green Version]
- Ward, C.; Martinez-Lopez, N.; Otten, E.G.; Carroll, B.; Maetzel, D.; Singh, R.; Sarkar, S.; Korolchuk, V.I. Autophagy, lipophagy and lysosomal lipid storage disorders. Biochim. Biophys. Acta 2016, 1861, 269–284. [Google Scholar] [CrossRef] [PubMed] [Green Version]
- Seranova, E.; Connolly, K.J.; Zatyka, M.; Rosenstock, T.R.; Barrett, T.; Tuxworth, R.I.; Sarkar, S. Dysregulation of autophagy as a common mechanism in lysosomal storage diseases. Essays Biochem. 2017, 61, 733–749. [Google Scholar] [CrossRef] [Green Version]
- Neufeld, E.; Muenzer, J. The Mucopolysaccharidoses—The Online Metabolic and Molecular Bases of Inherited Disease—OMMBID—McGraw-Hill Medical. Metab. Mol. Bases Inherit. Dis. 2001. [Google Scholar] [CrossRef]
- Oussoren, E.; Brands, M.M.; Ruijter, G.J.; der Ploeg, A.T.; Reuser, A.J. Bone, joint and tooth development in mucopolysaccharidoses: Relevance to therapeutic options. Biochim. Biophys. Acta 2011, 1812, 1542–1556. [Google Scholar] [CrossRef] [Green Version]
- Clarke, L.A.; Hollak, C.E. The clinical spectrum and pathophysiology of skeletal complications in lysosomal storage disorders. Best Pr. Res. Clin. Endocrinol. Metab. 2015, 29, 219–235. [Google Scholar] [CrossRef]
- Schiattarella, G.G.; Cerulo, G.; De Pasquale, V.; Cocchiaro, P.; Paciello, O.; Avallone, L.; Belfiore, M.P.; Iacobellis, F.; Di Napoli, D.; Magliulo, F.; et al. The murine model of mucopolysaccharidosis IIIB develops cardiopathies over time leading to heart failure. PLoS ONE 2015, 10, e0131662. [Google Scholar] [CrossRef] [Green Version]
- De Pasquale, V.; Sarogni, P.; Pistorio, V.; Cerulo, G.; Paladino, S.; Pavone, L.M. Targeting Heparan Sulfate Proteoglycans as a Novel Therapeutic Strategy for Mucopolysaccharidoses. Mol. Methods Clin. Dev. 2018, 10, 8–16. [Google Scholar] [CrossRef]
- Bigger, B.W.; Begley, D.J.; Virgintino, D.; Pshezhetsky, A.V. Anatomical changes and pathophysiology of the brain in mucopolysaccharidosis disorders. Mol. Genet. Metab. 2018, 125, 322–331. [Google Scholar] [CrossRef] [PubMed]
- Stapleton, M.; Arunkumar, N.; Kubaski, F.; Mason, R.W.; Tadao, O.; Tomatsu, S. Clinical presentation and diagnosis of mucopolysaccharidoses. Mol. Genet. Metab. 2018, 125, 4–17. [Google Scholar] [CrossRef] [PubMed]
- De Pasquale, V.; Pezone, A.; Sarogni, P.; Tramontano, A.; Schiattarella, G.G.; Avvedimento, V.E.; Paladino, S.; Pavone, L.M. EGFR activation triggers cellular hypertrophy and lysosomal disease in NAGLU-depleted cardiomyoblasts, mimicking the hallmarks of mucopolysaccharidosis IIIB. Cell Death Dis. 2018, 9, 40. [Google Scholar] [CrossRef] [PubMed]
- De Pasquale, V.; Pavone, L.M. Heparan sulfate proteoglycans: The sweet side of development turns sour in mucopolysaccharidoses. Biochim. Biophys. Acta 2019, 1865, 165539. [Google Scholar] [CrossRef]
- De Pasquale, V.; Moles, A.; Pavone, L.M. Cathepsins in the pathophysiology of mucopolysaccharidoses: New perspectives for therapy. Cells 2020, 9, 979. [Google Scholar] [CrossRef] [Green Version]
- Fecarotta, S.; Tarallo, A.; Damiano, C.; Minopoli, N.; Parenti, G. Pathogenesis of mucopolysaccharidoses, an update. Int. J. Mol. Sci. 2020, 21, 2515. [Google Scholar] [CrossRef] [Green Version]
- Kielian, T. Lysosomal storage disorders: Pathology within the lysosome and beyond. J. Neurochem. 2019, 148, 568–572. [Google Scholar] [CrossRef]
- Parker, H.; Bigger, B.W. The role of innate immunity in mucopolysaccharide diseases. J. Neurochem. 2019, 148, 639–651. [Google Scholar] [CrossRef] [Green Version]
- Breiden, B.; Sandhoff, K. Mechanism of secondary ganglioside and lipid accumulation in lysosomal disease. Int. J. Mol. Sci. 2020, 21, 2566. [Google Scholar] [CrossRef] [Green Version]
- Gaffke, L.; Pierzynowska, K.; Podlacha, M.; Hoinkis, D.; Rintz, E.; Brokowska, J.; Cyske, Z.; Wegrzyn, G. Underestimated aspect of mucopolysaccharidosis pathogenesis: Global changes in cellular processes revealed by transcriptomic studies. Int. J. Mol. Sci. 2020, 21, 1204. [Google Scholar] [CrossRef] [Green Version]
- Li, H.H.; Yu, W.H.; Rozengurt, N.; Zhao, H.Z.; Lyons, K.M.; Anagnostaras, S.; Fanselow, M.S.; Suzuki, K.; Vanier, M.T.; Neufeld, E.F. Mouse model of Sanfilippo syndrome type B produced by targeted disruption of the gene encoding alpha-N-acetylglucosaminidase. Proc. Natl. Acad. Sci. USA 1999, 96, 14505–14510. [Google Scholar] [CrossRef] [PubMed] [Green Version]
- De Pasquale, V.; Costanzo, M.; Siciliano, R.A.; Mazzeo, M.F.; Pistorio, V.; Bianchi, L.; Marchese, E.; Ruoppolo, M.; Pavone, L.M.; Caterino, M. Proteomic analysis of mucopolysaccharidosis IIIB mouse brain. Biomolecules 2020, 10, 355. [Google Scholar] [CrossRef] [PubMed] [Green Version]
- Malinowska, M.; Wilkinson, F.L.; Bennett, W.; Langford-Smith, K.J.; O’Leary, H.A.; Jakobkiewicz-Banecka, J.; Wynn, R.; Wraith, J.E.; Wegrzyn, G.; Bigger, B.W. Genistein reduces lysosomal storage in peripheral tissues of mucopolysaccharide IIIB mice. Mol. Genet. Metab. 2009, 98, 235–242. [Google Scholar] [CrossRef] [PubMed]
- Wagner, V.F.; Northrup, H. Mucopolysaccharidosis Type III. In GeneReviews® [Internet]; Adam, M.P., Ardinger, H.H., Pagon, R.A., Wallace, S.E., Bean, L.J.H., Stephens, K., Amemiya, A., Eds.; Seattle (WA), University of Washington: Seattle, DC, USA, 2019; pp. 1993–2020. [Google Scholar]
- Belfiore, M.P.; Iacobellis, F.; Acampora, E.; Caiazza, M.; Rubino, M.; Monda, E.; Magaldi, M.R.; Tarallo, A.; Sasso, M.; Pasquale, V.D.; et al. Aortopathies in mouse models of Pompe, Fabry and Mucopolysaccharidosis IIIB lysosomal storage diseases. PLoS ONE 2020, 15, e0233050. [Google Scholar] [CrossRef]
- Costanzo, M.; Zacchia, M.; Bruno, G.; Crisci, D.; Caterino, M.; Ruoppolo, M. Integration of proteomics and metabolomics in exploring genetic and rare metabolic diseases. Kidney Dis. 2017, 3, 66–77. [Google Scholar] [CrossRef] [Green Version]
- Tebani, A.; Afonso, C.; Bekri, S. Advances in metabolome information retrieval: Turning chemistry into biology. Part I: Analytical chemistry of the metabolome. J. Inherit. Metab. Dis. 2018, 41, 379–391. [Google Scholar] [CrossRef] [Green Version]
- Tebani, A.; Afonso, C.; Bekri, S. Advances in metabolome information retrieval: Turning chemistry into biology. Part II: Biological information recovery. J. Inherit. Metab. Dis. 2018, 41, 393–406. [Google Scholar] [CrossRef] [Green Version]
- Fu, H.; Meadows, A.S.; Pineda, R.J.; Mohney, R.P.; Stirdivant, S.; McCarty, D.M. Serum global metabolomics profiling reveals profound metabolic impairments in patients with MPS IIIA and MPS IIIB. Metab. Brain Dis. 2017, 32, 1403–1415. [Google Scholar] [CrossRef]
- Tebani, A.; Schmitz-Afonso, I.; Abily-Donval, L.; Héron, B.; Piraud, M.; Ausseil, J.; Brassier, A.; De Lonlay, P.; Zerimech, F.; Vaz, F.M.; et al. Urinary metabolic phenotyping of mucopolysaccharidosis type I combining untargeted and targeted strategies with data modeling. Clin. Chim. Acta 2017, 475, 7–14. [Google Scholar] [CrossRef]
- Tebani, A.; Abily-Donval, L.; Schmitz-Afonso, I.; Héron, B.; Piraud, M.; Ausseil, J.; Zerimech, F.; Gonzalez, B.; Marret, S.; Afonso, C.; et al. Unveiling metabolic remodeling in mucopolysaccharidosis type III through integrative metabolomics and pathway analysis. J. Transl. Med. 2018, 16, 248. [Google Scholar] [CrossRef]
- Tebani, A.; Abily-Donval, L.; Schmitz-Afonso, I.; Piraud, M.; Ausseil, J.; Zerimech, F.; Pilon, C.; Pereira, T.; Marret, S.; Afonso, C.; et al. Analysis of mucopolysaccharidosis type VI through integrative functional metabolomics. Int. J. Mol. Sci. 2019, 20, 446. [Google Scholar] [CrossRef] [PubMed] [Green Version]
- Newgard, C.B. Interplay between lipids and branched-chain amino acids in development of insulin resistance. Cell Metab. 2012, 15, 606–614. [Google Scholar] [CrossRef] [PubMed] [Green Version]
- Li, S.; Gao, D.; Jiang, Y. Function, Detection and Alteration of Acylcarnitine Metabolism in Hepatocellular Carcinoma. Metabolites 2019, 9, 36. [Google Scholar] [CrossRef] [Green Version]
- Neinast, M.D.; Jang, C.; Hui, S.; Murashige, D.S.; Chu, Q.; Morscher, R.J.; Li, X.; Zhan, L.; White, E.; Anthony, T.G.; et al. Quantitative analysis of the whole-body metabolic fate of branched-chain aminoacids. Cell Metab. 2019, 29, 417–429. [Google Scholar] [CrossRef] [PubMed] [Green Version]
- Woloszynek, J.C.; Kovacs, A.; Ohlemiller, K.K.; Roberts, M.; Sands, M.S. Metabolic adaptations to interrupted glycosaminoglycan recycling. J. Biol. Chem. 2009, 284, 29684–29691. [Google Scholar] [CrossRef] [PubMed] [Green Version]
- Fu, H.; Meadows, A.S.; Ware, T.; Mohney, R.P.; McCarty, D.M. Near-complete correction of profound metabolomic impairments corresponding to functional benefit in MPS IIIB mice after IV rAAV9-hNAGLU gene delivery. Mol. Ther. 2017, 25, 792–802. [Google Scholar] [CrossRef] [PubMed] [Green Version]
- Liu, Y.; Dong, W.; Shao, J.; Wang, Y.; Zhou, M.; Sun, H. Branched-chain amino acid negatively regulates KLF15 expression via PI3K-AKT Pathway. Front. Physiol. 2017, 8, 853. [Google Scholar] [CrossRef] [Green Version]
- Nie, C.; He, T.; Zhang, W.; Zhang, G.; Ma, X. Branched chain amino acids: Beyond nutrition metabolism. Int. J. Mol. Sci. 2018, 19, 954. [Google Scholar] [CrossRef] [Green Version]
- Woloszynek, J.C.; Roberts, M.; Coleman, T.; Vogler, C.; Sly, W.; Semenkovich, C.F.; Sands, M.S. Numerous transcriptional alterations in liver persist after short-term enzyme-replacement therapy in a murine model of mucopolysaccharidosis type VII. Biochem. J. 2004, 379 Pt 2, 461–469. [Google Scholar] [CrossRef]
- Woloszynek, J.C.; Coleman, T.; Semenkovich, C.F.; Sands, M.S. Lysosomal dysfunction results in altered energy balance. J. Biol. Chem. 2007, 282, 35765–35771. [Google Scholar] [CrossRef] [Green Version]
- Kiselyov, K.; Jennigs, J.J., Jr.; Rbaibi, Y.; Chu, C.T. Autophagy, mitochondria and cell death in lysosomal storage diseases. Autophagy 2007, 3, 259–262. [Google Scholar] [CrossRef] [PubMed] [Green Version]
- Settembre, C.; Fraldi, A.; Rubinsztein, D.C.; Ballabio, A. Lysosomal storage diseases as disorders of autophagy. Autophagy 2008, 4, 113–114. [Google Scholar] [CrossRef] [PubMed] [Green Version]
- Pshezhetsky, A.V. Lysosomal storage of heparan sulfate causes mitochondrial defects, altered autophagy, and neuronal death in the mouse model of mucopolysaccharidosis III type C. Autophagy 2016, 12, 1059–1060. [Google Scholar] [CrossRef] [PubMed] [Green Version]
- Bartolomeo, R.; Cinque, L.; De Leonibus, C.; Forrester, A.; Salzano, A.C.; Monfregola, J.; De Gennaro, E.; Nusco, E.; Azario, I.; Lanzara, C.; et al. mTORC1 hyperactivation arrests bone growth in lysosomal storage disorders by suppressing autophagy. J. Clin. Investig. 2017, 127, 3717–3729. [Google Scholar] [CrossRef] [Green Version]
- Yin, Z.; Pascual, C.; Klionsky, D.J. Autophagy: Machinery and regulation. Microb. Cell 2016, 3, 588–596. [Google Scholar] [CrossRef]
- Goberdhan, D.C.; Wilson, C.; Harris, A.L. Amino acid sensing by mTORC1: Intracellular transporters mark the spot. Cell Metab. 2016, 23, 580–589. [Google Scholar] [CrossRef] [Green Version]
- Zhuang, Y.; Wang, X.X.; He, J.; He, S.; Yin, Y. Recent advances in understanding of amino acid signaling to mTORC1 activation. Front. Biosci. 2019, 24, 971–982. [Google Scholar]
- Kroemer, G.; Mariño, G.; Levine, B. Autophagy and the integrated stress response. Mol. Cell 2010, 40, 280–293. [Google Scholar] [CrossRef] [Green Version]
- Kim, E.; Goraksha-Hicks, P.; Li, L.; Neufeld, T.P.; Guan, K.L. Regulation of TORC1 by Rag GTPases in nutrient response. Nat. Cell Biol. 2008, 10, 935–945. [Google Scholar] [CrossRef] [Green Version]
- Sancak, Y.; Peterson, T.R.; Shaul, Y.D.; Lindquist, R.A.; Thoreen, C.C.; Bar-Peled, L.; Sabatini, D.M. The Rag GTPases bind raptor and mediate amino acid signaling to mTORC1. Science 2008, 320, 1496–1501. [Google Scholar] [CrossRef] [Green Version]
- Efeyan, A.; Zoncu, R.; Sabatini, D.M. Amino acids and mTORC1: From lysosomes to disease. Trends Mol. Med. 2012, 18, 524–533. [Google Scholar] [CrossRef] [PubMed]
- Kim, J.; Kundu, M.; Viollet, B.; Guan, K.L. AMPK and mTOR regulate autophagy through direct phosphorylation of Ulk1. Nat. Cell Biol. 2011, 13, 132–141. [Google Scholar] [CrossRef] [Green Version]
- Bar-Peled, L.; Chantranupong, L.; Cherniack, A.D.; Chen, W.W.; Ottina, K.A.; Grabiner, B.C.; Spear, E.D.; Carter, S.L.; Meyerson, M.; Sabatini, D.M. A tumor suppressor complex with GAP activity for the Rag GTPases that signal amino acid sufficiency to mTORC1. Science 2013, 340, 1100–1106. [Google Scholar] [CrossRef] [PubMed] [Green Version]
- Dyachok, J.; Earnest, S.; Iturraran, E.N.; Cobb, M.H.; Ross, E.M. Amino Acids Regulate mTORC1 by an Obligate Two-step Mechanism. J. Biol. Chem. 2016, 291, 22414–22426. [Google Scholar] [CrossRef] [PubMed] [Green Version]
- Condon, K.J.; Sabatini, D.M. Nutrient regulation of mTORC1 at a glance. J. Cell Sci. 2019, 132. [Google Scholar] [CrossRef]
- Lieberman, A.P.; Puertollano, R.; Raben, N.; Slaugenhaupt, S.; Walkley, S.U.; Ballabio, A. Autophagy in lysosomal storage disorders. Autophagy 2012, 8, 719–730. [Google Scholar] [CrossRef] [Green Version]
- Settembre, C.; Di Malta, C.; Polito, V.A.; Garcia Arencibia, M.; Vetrini, F.; Erdin, S.U.; Huynh, T.; Medina, D.; Colella, P.; Sardiello, M.; et al. TFEB links autophagy to lysosomal biogenesis. Science 2011, 332, 1429–1433. [Google Scholar] [CrossRef] [Green Version]
- Rabanal-Ruiz, Y.; Otten, E.G.; Korolchuk, V.I. mTORC1 as the main gateway to autophagy. Essays Biochem. 2017, 61, 565–584. [Google Scholar] [CrossRef] [Green Version]
- Bajaj, L.; Lotfi, P.; Pal, R.; Ronza, A.D.; Sharma, J.; Sardiello, M. Lysosome biogenesis in health and disease. Neurochem. 2019, 148, 573–589. [Google Scholar] [CrossRef] [Green Version]
- Plotegher, N.; Duchen, M.R. Mitochondrial dysfunction and neurodegeneration in lysosomal storage disorders. Trends Mol. Med. 2017, 23, 116–134. [Google Scholar] [CrossRef]
- Bakula, D.; Scheibye-Knudsen, M. MitophAging: Mitophagy in aging and disease. Front. Cell Dev. Biol. 2020, 8, 239. [Google Scholar] [CrossRef] [PubMed] [Green Version]
- Heon-Roberts, R.; Nguyen, A.L.A.; Pshezhetsky, A.V. Molecular bases of neurodegeneration and cognitive decline, the major burden of Sanfilippo disease. J. Clin. Med. 2020, 9, 344. [Google Scholar] [CrossRef] [PubMed] [Green Version]
- Martins, C.; Hulkova, H.; Dridi, L.; Dormoy-Raclet, V.; Grigoryeva, L.; Choi, Y.; Langford-Smith, A.; Wilkinson, F.L.; Ohmi, K.; DiCristo, G.; et al. Neuroinflammation, mitochondrial defects and neurodegeneration in mucopolysaccharidosis III type C mouse model. Brain 2015, 138, 336–355. [Google Scholar] [CrossRef] [PubMed] [Green Version]
- Cerulo, G.; Tafuri, S.; De Pasquale, V.; Rea, S.; Romano, S.; Costagliola, A.; Della Morte, R.; Avallone, L.; Pavone, L.M. Serotonin activates cell survival and apoptotic death responses in cultured epithelial thyroid cells. Biochimie 2014, 105, 211–215. [Google Scholar] [CrossRef] [PubMed]
- Pavone, L.M.; Rea, S.; Trapani, F.; De Pasquale, V.; Tafuri, S.; Papparella, S.; Paciello, O. Role of serotonergic system in the pathogenesis of fibrosis in canine idiopathic inflammatory myopathies. Neuromuscul. Disord. 2012, 22, 549–557. [Google Scholar] [CrossRef] [Green Version]
- Persico, M.; Ramunno, A.; Maglio, V.; Franceschelli, S.; Esposito, C.; Carotenuto, A.; Brancaccio, D.; De Pasquale, V.; Pavone, L.M.; Varra, M.; et al. New anticancer agents mimicking protein recognition motifs. J. Med. Chem. 2013, 56, 6666–6680. [Google Scholar] [CrossRef]
- Spina, A.; Rea, S.; De Pasquale, V.; Mastellone, V.; Avallone, L.; Pavone, L.M. Fate map of serotonin transporter-expressing cells in developing mouse thyroid. Anat. Rec. 2011, 294, 384–390. [Google Scholar] [CrossRef]
- Ruoppolo, M.; Caterino, M.; Albano, L.; Pecce, R.; Di Girolamo, M.G.; Crisci, D.; Costanzo, M.; Milella, L.; Franconi, F.; Campesi, I. Targeted metabolomic profiling in rat tissues reveals sex differences. Sci. Rep. 2018, 8, 4663. [Google Scholar] [CrossRef]
- Caterino, M.; Chandler, R.J.; Sloan, J.L.; Dorko, K.; Cusmano-Ozog, K.; Ingenito, L.; Strom, S.C.; Imperlini, E.; Scolamiero, E.; Venditti, C.P.; et al. The proteome of methylmalonic acidemia (MMA): The elucidation of altered pathways in patient livers. Mol. Biosyst. 2016, 12, 566–574. [Google Scholar] [CrossRef] [Green Version]
- Costanzo, M.; Cevenini, A.; Marchese, E.; Imperlini, E.; Raia, M.; Del Vecchio, L.; Caterino, M.; Ruoppolo, M. Label-Free Quantitative Proteomics in a Methylmalonyl-CoA Mutase-Silenced Neuroblastoma Cell Line. Int. J. Mol. Sci. 2018, 19, 3580. [Google Scholar] [CrossRef] [Green Version]
- Scolamiero, E.; Cozzolino, C.; Albano, L.; Ansalone, A.; Caterino, M.; Durante, A.; Franzese, G.; Gallo, G.; Giliberti, P.; Ingenito, L.; et al. Targeted metabolomics in the expanded newborn screening for inborn errors of metabolism. Mol. Biosyst. 2015, 11, 1525–1535. [Google Scholar] [CrossRef] [PubMed]
- Scolamiero, E.; Villani, G.R.; Ingenito, L.; Pecce, R.; Albano, L.; Caterino, M.; Di Girolamo, M.G.; Di Stefano, C.; Franzese, I.; Gallo, G.; et al. Maternal vitamin B12 deficiency detected in expanded newborn screening. Clin. Biochem. 2014, 47, 312–317. [Google Scholar] [CrossRef] [PubMed]
- Giacco, A.; Delli Paoli, G.; Senese, R.; Cioffi, F.; Silvestri, E.; Moreno, M.; Ruoppolo, M.; Caterino, M.; Costanzo, M.; Lombardi, A.; et al. The saturation degree of fatty acids and their derived acylcarnitines determines the direct effect of metabolically active thyroid hormones on insulin sensitivity in skeletal muscle cells. FASEB J. 2019, 33, 1811–1823. [Google Scholar] [CrossRef] [Green Version]
- Caterino, M.; Ruoppolo, M.; Villani, G.R.D.; Marchese, E.; Costanzo, M.; Sotgiu, G.; Dore, S.; Franconi, F.; Campesi, I. Influence of Sex on Urinary Organic Acids: A Cross-Sectional Study in Children. Int. J. Mol. Sci. 2020, 21, 582. [Google Scholar] [CrossRef] [PubMed] [Green Version]


| Amino Acid Concentrations | p-Value | ||
|---|---|---|---|
| WT | NAGLU−/− | ||
| Val | 24.4 ± 5.2 | 38.3 ± 3.2 | 0.0278 |
| Xle | 33.4 ± 8.1 | 57.4 ± 5.2 | 0.0164 |
| Phe | 9.8 ± 2.2 | 20.2 ± 1.6 | 0.0008 |
| Tyr | 8.9 ± 2.6 | 17.2 ± 1.5 | 0.0059 |
| Amino Acid Concentrations | p-Value | ||
|---|---|---|---|
| WT | NAGLU−/− | ||
| Ala | 189.1± 6.2 | 470.4 ± 40.4 | <0.0001 |
| Val | 43.9 ± 3.8 | 133.1 ± 4.5 | <0.0001 |
| Xle | 51.5 ± 4.0 | 150.3 ± 6.8 | <0.0001 |
| Met | 17.0 ± 1.3 | 70.6 ± 3.0 | <0.0001 |
| Phe | 21.5 ± 1.5 | 64.4 ± 2.0 | <0.0001 |
| Tyr | 23.0 ± 1.9 | 69.8 ± 1.8 | 0.0007 |
| Glu | 232.8 ± 10.8 | 416.2 ± 42.4 | <0.0001 |
| Gly | 158.1 ± 5.6 | 355.6 ± 33.2 | <0.0001 |
| Orn | 22.4 ± 2.0 | 76.8 ± 7.1 | <0.0001 |
| Cit | 1.6 ± 0.1 | 6.0 ± 0.3 | <0.0001 |
| Arg | 3.1 ± 0.3 | 13.9 ± 1.0 | <0.0001 |
| Saturated Acylcarnitine Concentrations | p-Value | ||
|---|---|---|---|
| WT | NAGLU−/− | ||
| C0 | 31.1808 ± 7.8309 | 55.4627 ± 3.5891 | 0.0103 |
| C2 | 8.1067 ± 1.9993 | 14.0801 ± 1.7085 | 0.0205 |
| C3 | 0.0763 ± 0.0160 | 0.2101 ± 0.0256 | 0.0001 |
| C4 | 0.1532 ± 0.0539 | 0.6067 ± 0.0557 | <0.0001 |
| C5 | 0.0258 ± 0.0079 | 0.0669 ± 0.0065 | 0.0007 |
| C6 | 0.0235 ± 0.0075 | 0.0599 ± 0.0057 | 0.0005 |
| Unsaturated Acylcarnitine Concentrations | |||
| C5:1 | 0.0063 ± 0.0017 | 0.0188 ± 0.0013 | <0.0001 |
| Hydroxylated Acylcarnitine Concentrations | |||
| C5OH | 0.0395 ± 0.0115 | 0.1147 ± 0.0125 | 0.0001 |
| Branched Acylcarnitine Concentrations | |||
| C3DC | 0.0926 ± 0.0348 | 0.2430 ± 0.0268 | <0.0001 |
| C8DC | 0.0035 ± 0.0008 | 0.0069 ± 0.0013 | <0.0001 |
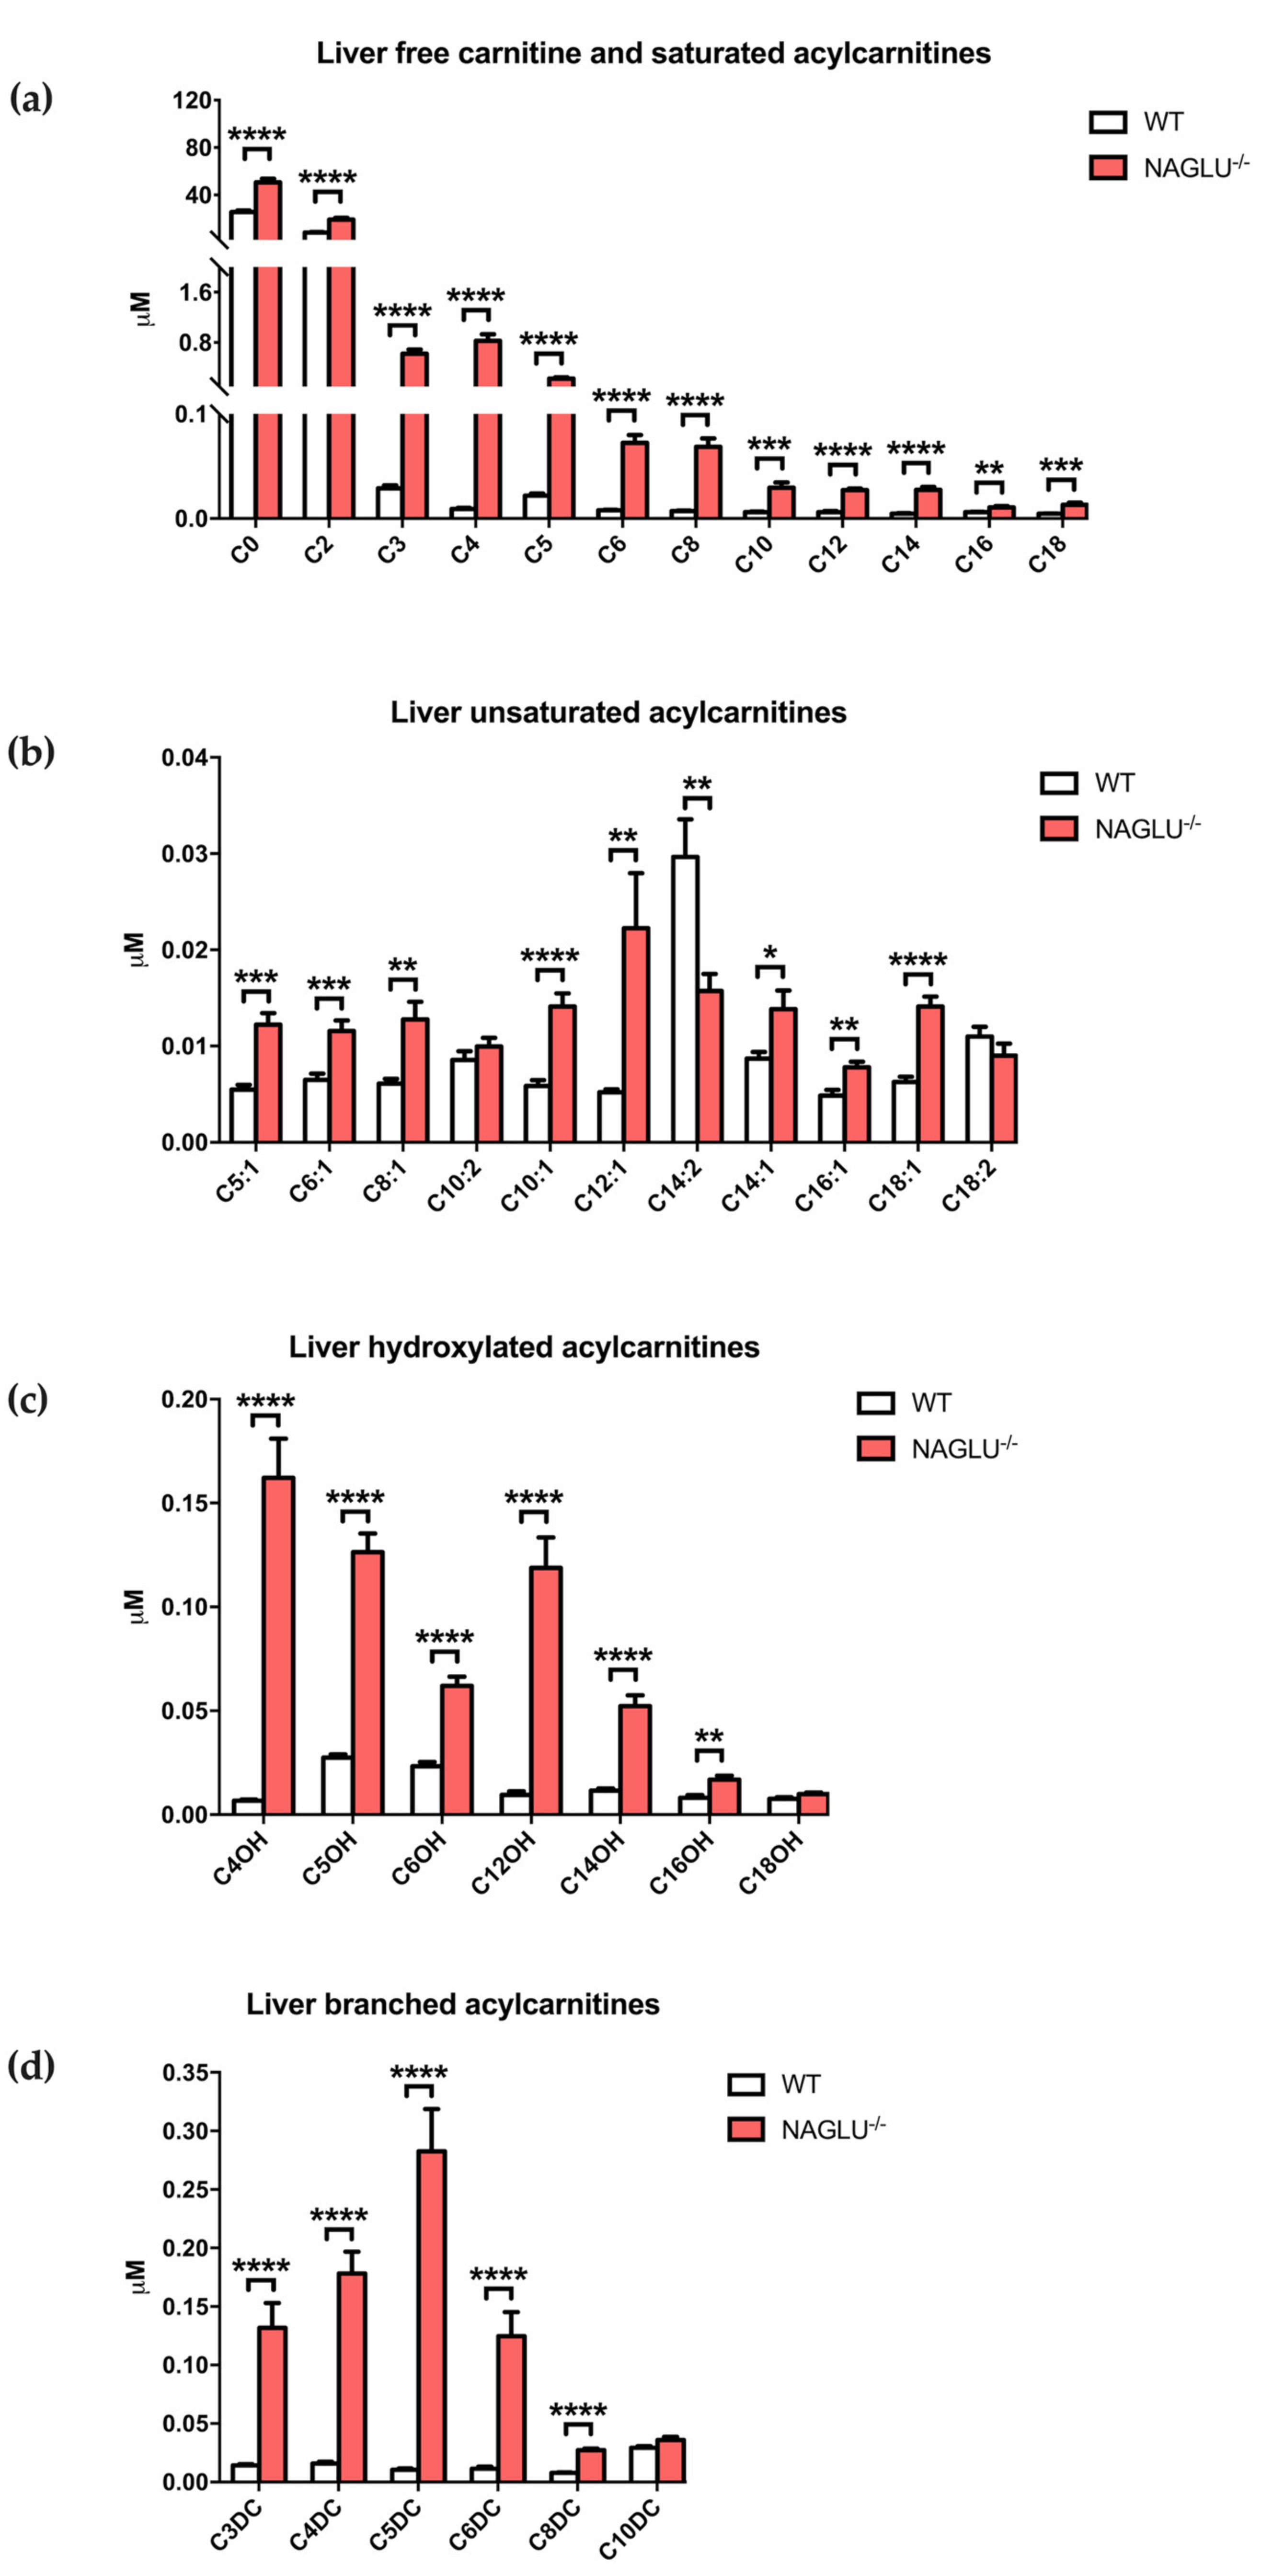
| Saturated Acylcarnitine Concentrations | p-Value | ||
|---|---|---|---|
| WT | NAGLU−/− | ||
| C0 | 25.5149 ± 1.4088 | 50.6110 ± 3.1383 | <0.0001 |
| C2 | 8.3791 ± 0.3831 | 19.1520 ± 1.4497 | <0.0001 |
| C3 | 0.0290 ± 0.0028 | 0.6242 ± 0.0672 | <0.0001 |
| C4 | 0.0092 ± 0.0008 | 0.8251 ± 0.1065 | <0.0001 |
| C5 | 0.0219 ± 0.0019 | 0.2256 ± 0.0234 | <0.0001 |
| C6 | 0.0078 ± 0.0006 | 0.0722 ± 0.0075 | <0.0001 |
| C8 | 0.0071 ± 0.0004 | 0.0686 ± 0.0079 | <0.0001 |
| C10 | 0.0060 ± 0.0005 | 0.0294 ± 0.0050 | 0.0003 |
| C12 | 0.0061 ± 0.0011 | 0.0271 ± 0.0016 | <0.0001 |
| C14 | 0.0047 ± 0.0005 | 0.0274 ± 0.0027 | <0.0001 |
| C16 | 0.0061 ± 0.0004 | 0.0107 ± 0.0013 | 0.0028 |
| C18 | 0.0047 ± 0.0003 | 0.0132 ± 0.0021 | 0.0008 |
| Unsaturated Acylcarnitine Concentrations | |||
| C5:1 | 0.0055 ± 0.0005 | 0.0122 ± 0.0012 | 0.0001 |
| C6:1 | 0.0065 ± 0.0007 | 0.0116 ± 0.0011 | 0.001 |
| C8:1 | 0.0061 ± 0.0005 | 0.0128 ± 0.0018 | 0.0028 |
| C10:1 | 0.0058 ± 0.0006 | 0.0141 ± 0.0014 | <0.0001 |
| C12:1 | 0.0052 ± 0.0003 | 0.0222 ± 0.0057 | 0.0091 |
| C14:2 | 0.0297 ± 0.0039 | 0.0157 ± 0.0018 | 0.0051 |
| C14:1 | 0.0087 ± 0.0007 | 0.0139 ± 0.0019 | 0.0234 |
| C16:1 | 0.0049 ± 0.0006 | 0.0078 ± 0.0006 | 0.0027 |
| C18:1 | 0.0063 ± 0.0005 | 0.0141 ± 0.0010 | <0.0001 |
| Hydroxylated Acylcarnitine Concentrations | |||
| C4OH | 0.0068 ± 0.0005 | 0.1621 ± 0.0189 | <0.0001 |
| C5OH | 0.0275 ± 0.0015 | 0.1263 ± 0.0090 | <0.0001 |
| C6OH | 0.0234 ± 0.0019 | 0.0621 ± 0.0043 | <0.0001 |
| C12OH | 0.0096 ± 0.0017 | 0.1188 ± 0.0146 | <0.0001 |
| C14OH | 0.0115 ± 0.0011 | 0.0522 ± 0.0052 | <0.0001 |
| C16OH | 0.0082 ± 0.0012 | 0.0168 ± 0.0020 | 0.0018 |
| Branched Acylcarnitine Concentrations | |||
| C3DC | 0.0143 ± 0.0011 | 0.1317 ± 0.0214 | <0.0001 |
| C4DC | 0.0158 ± 0.0015 | 0.1781 ± 0.0186 | <0.0001 |
| C5DC | 0.0104 ± 0.0012 | 0.2825 ± 0.0363 | <0.0001 |
| C6DC | 0.0113 ± 0.0018 | 0.1246 ± 0.0206 | <0.0001 |
| C8DC | 0.0078 ± 0.0005 | 0.0273 ± 0.0014 | <0.0001 |
© 2020 by the authors. Licensee MDPI, Basel, Switzerland. This article is an open access article distributed under the terms and conditions of the Creative Commons Attribution (CC BY) license (http://creativecommons.org/licenses/by/4.0/).
Share and Cite
De Pasquale, V.; Caterino, M.; Costanzo, M.; Fedele, R.; Ruoppolo, M.; Pavone, L.M. Targeted Metabolomic Analysis of a Mucopolysaccharidosis IIIB Mouse Model Reveals an Imbalance of Branched-Chain Amino Acid and Fatty Acid Metabolism. Int. J. Mol. Sci. 2020, 21, 4211. https://doi.org/10.3390/ijms21124211
De Pasquale V, Caterino M, Costanzo M, Fedele R, Ruoppolo M, Pavone LM. Targeted Metabolomic Analysis of a Mucopolysaccharidosis IIIB Mouse Model Reveals an Imbalance of Branched-Chain Amino Acid and Fatty Acid Metabolism. International Journal of Molecular Sciences. 2020; 21(12):4211. https://doi.org/10.3390/ijms21124211
Chicago/Turabian StyleDe Pasquale, Valeria, Marianna Caterino, Michele Costanzo, Roberta Fedele, Margherita Ruoppolo, and Luigi Michele Pavone. 2020. "Targeted Metabolomic Analysis of a Mucopolysaccharidosis IIIB Mouse Model Reveals an Imbalance of Branched-Chain Amino Acid and Fatty Acid Metabolism" International Journal of Molecular Sciences 21, no. 12: 4211. https://doi.org/10.3390/ijms21124211