Pilot Scale Study: First Demonstration of Hydrophobic Membranes for the Removal of Ammonia Molecules from Rendering Condensate Wastewater

 , , , ,
Abstract
: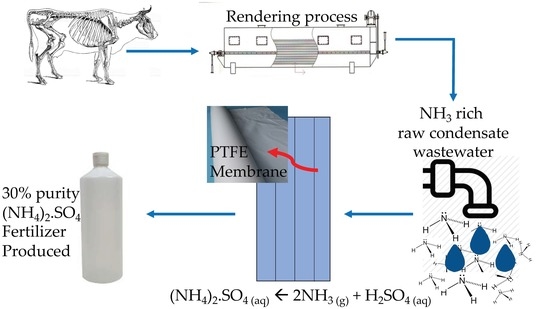
1. Introduction
2. Results and Discussion
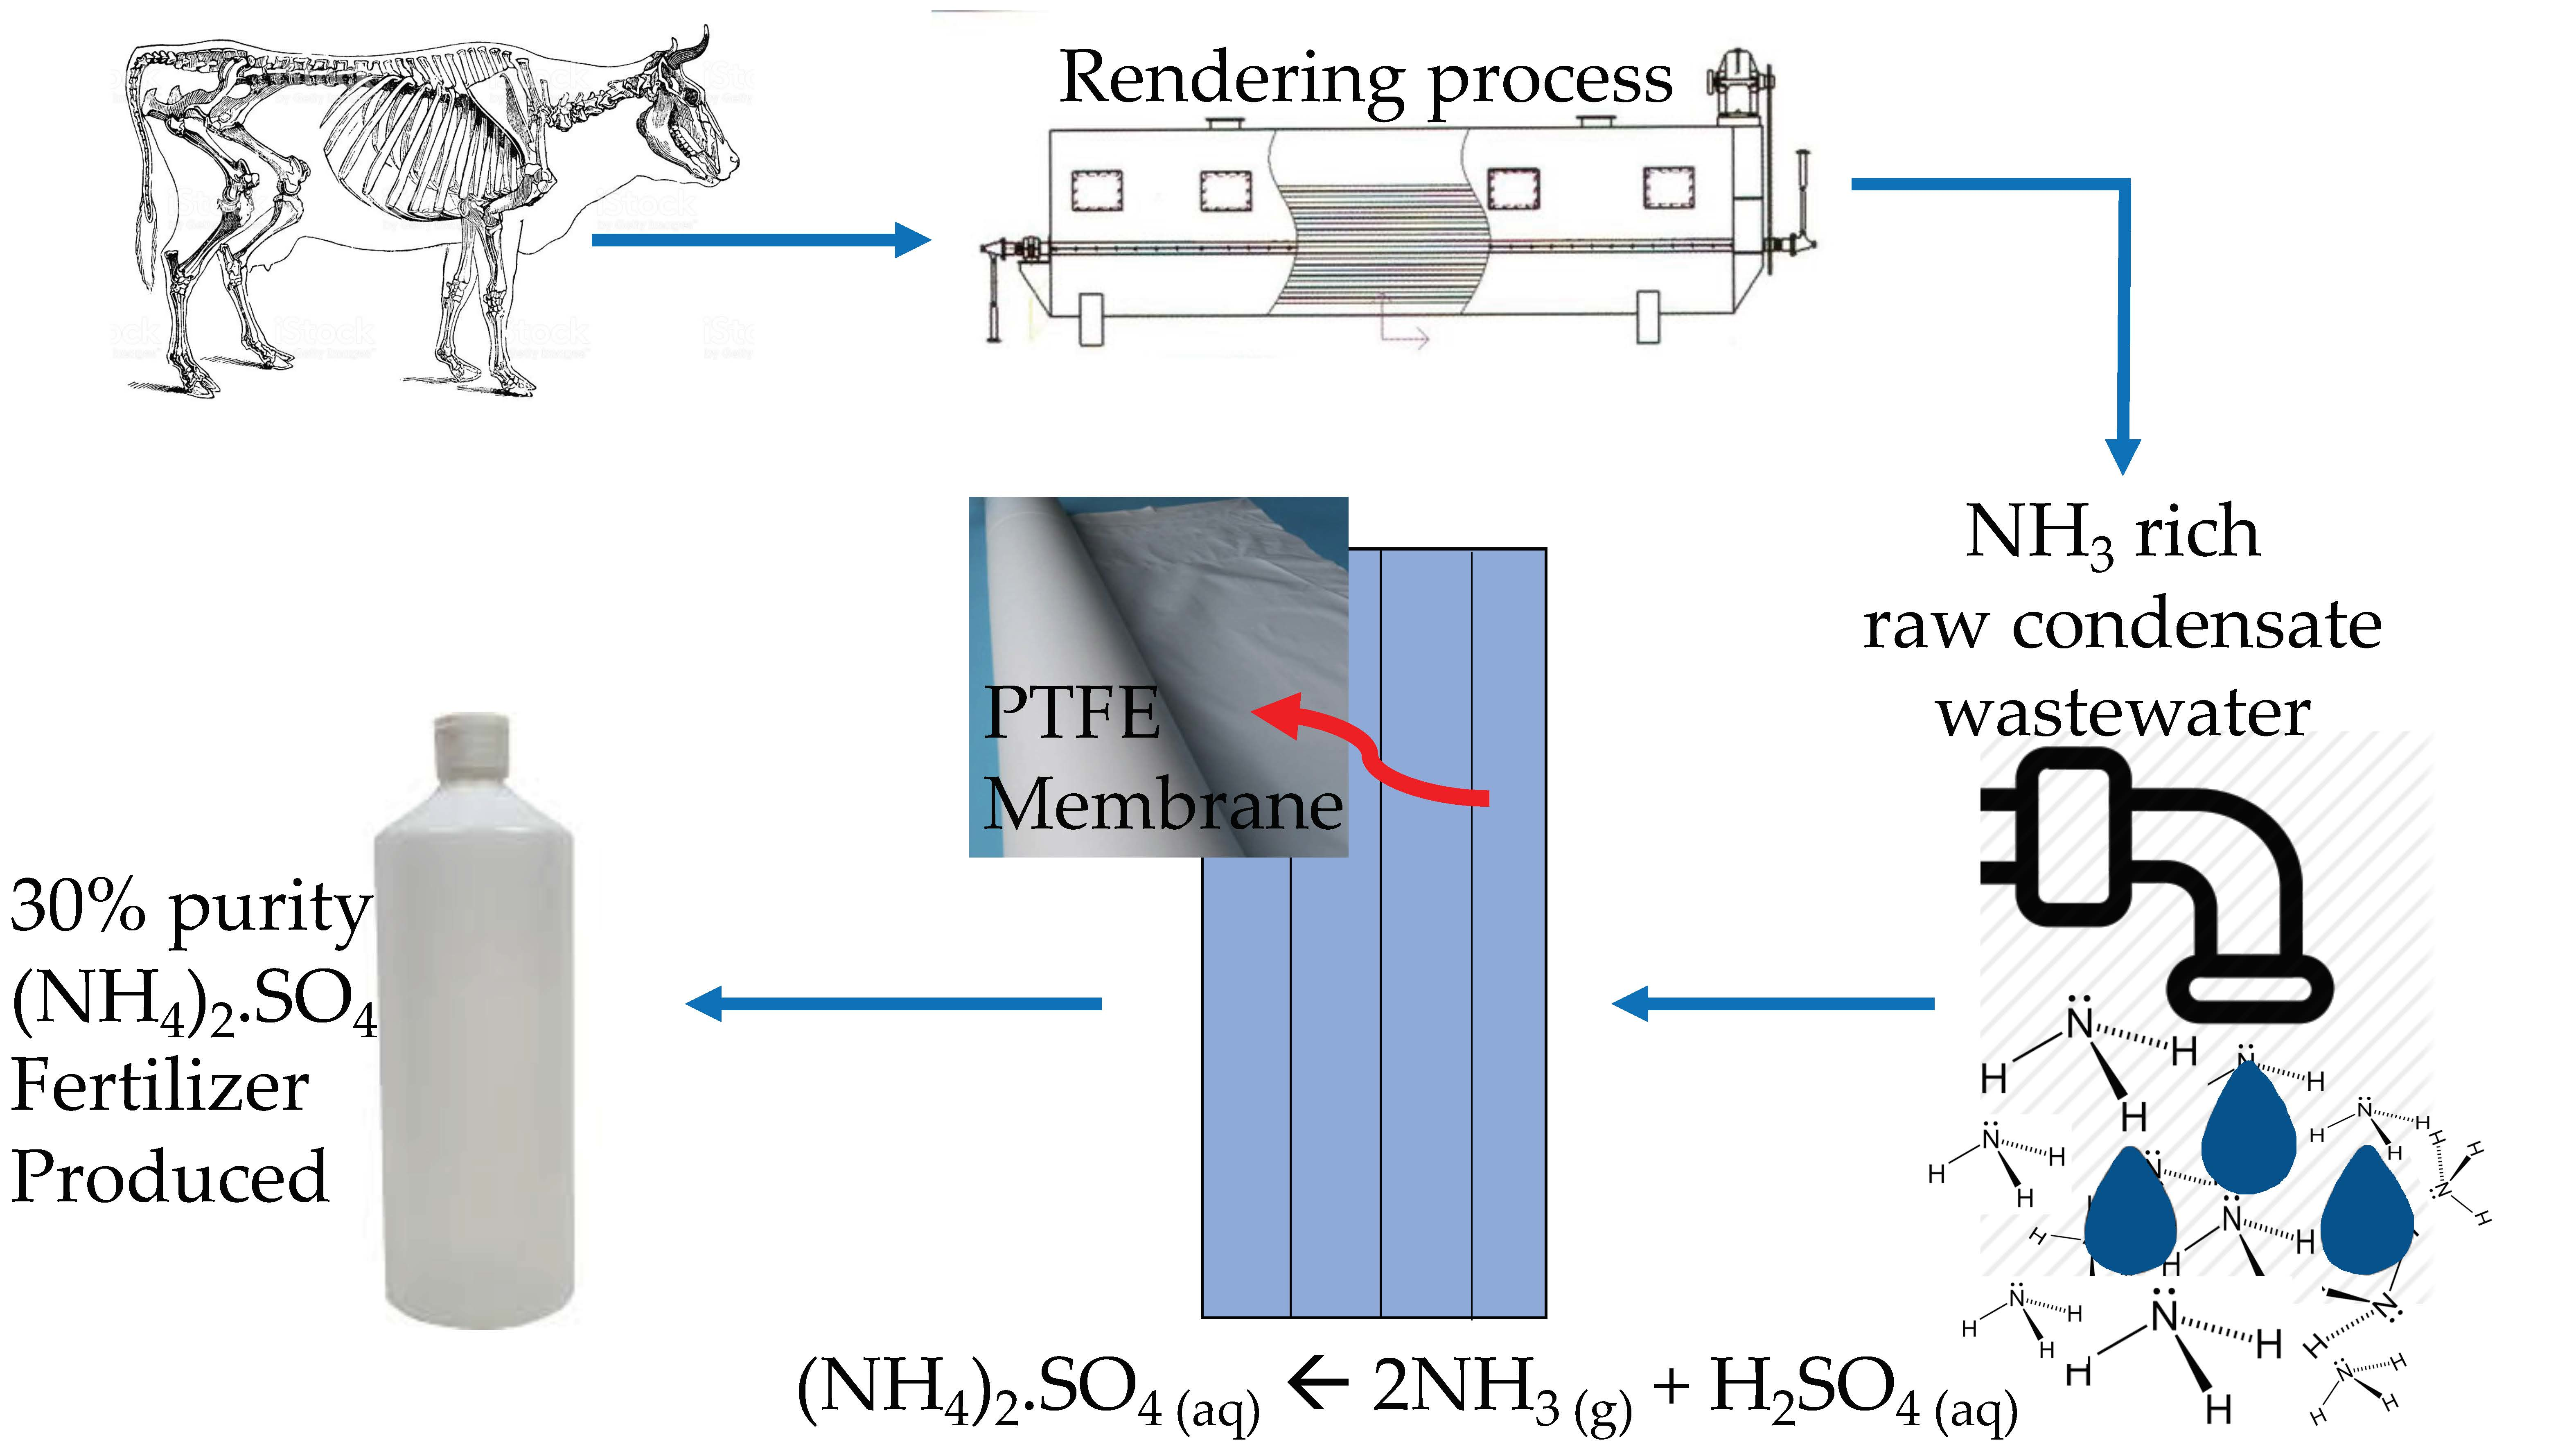
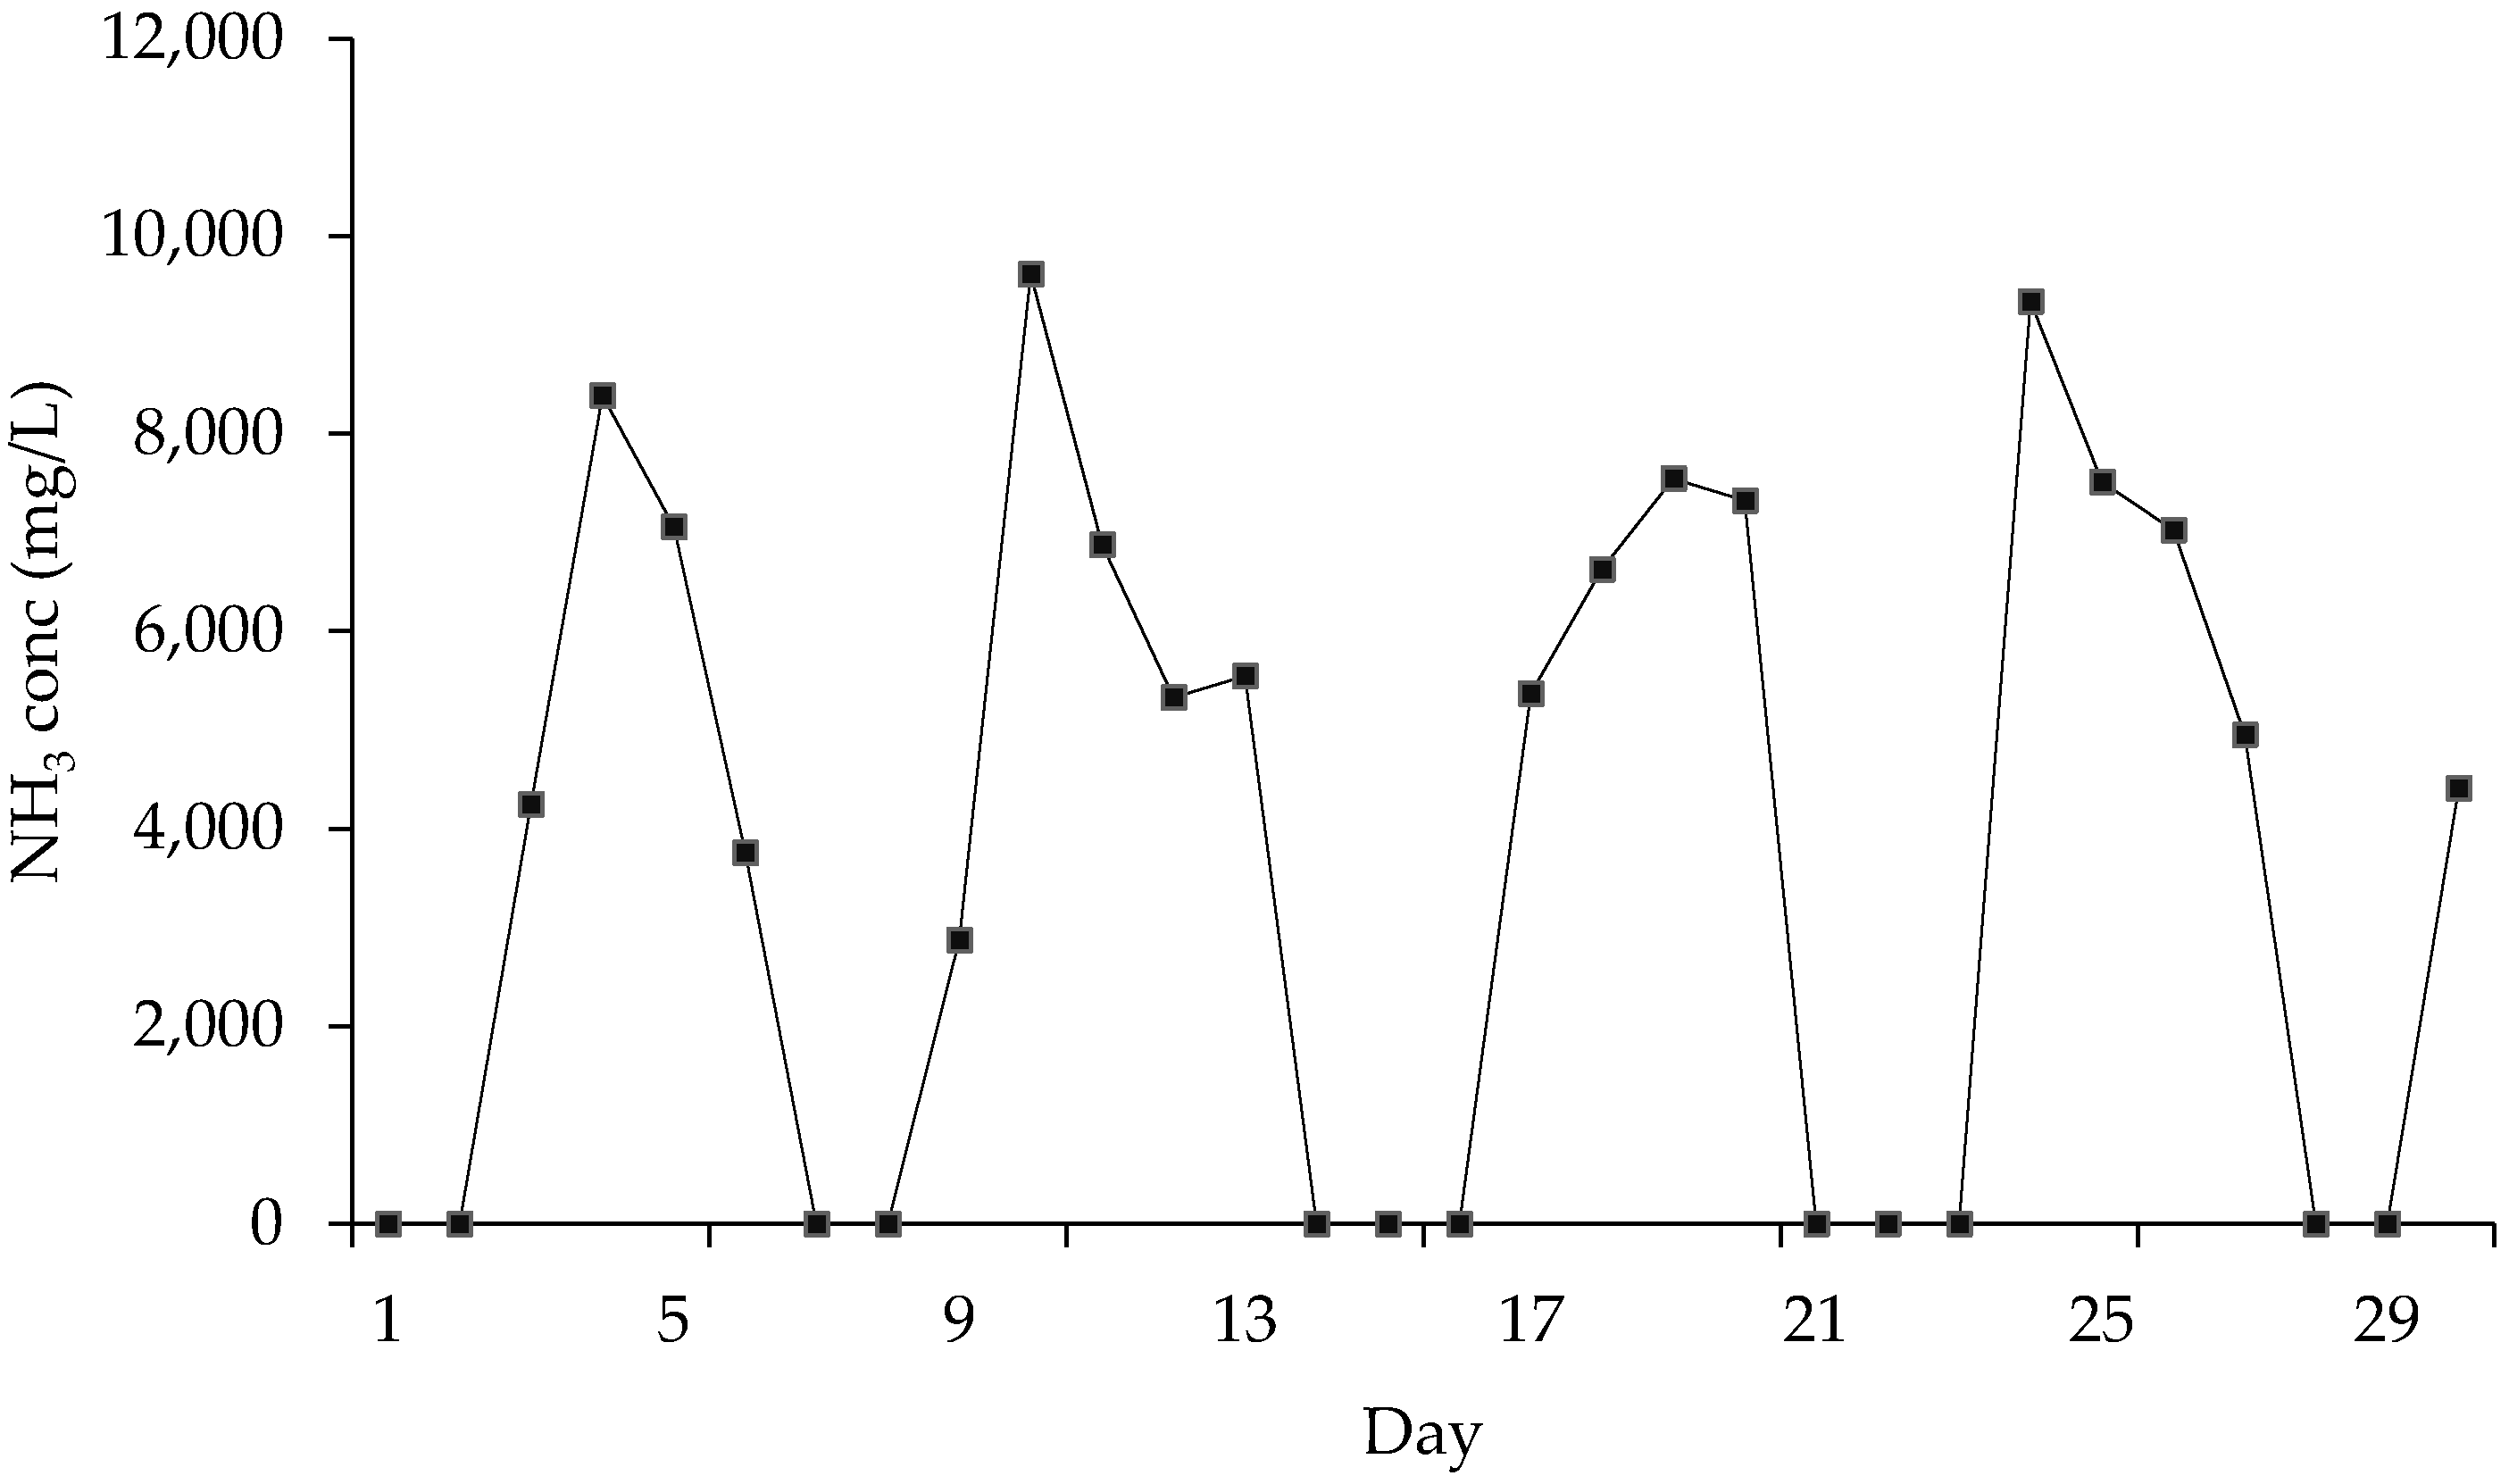
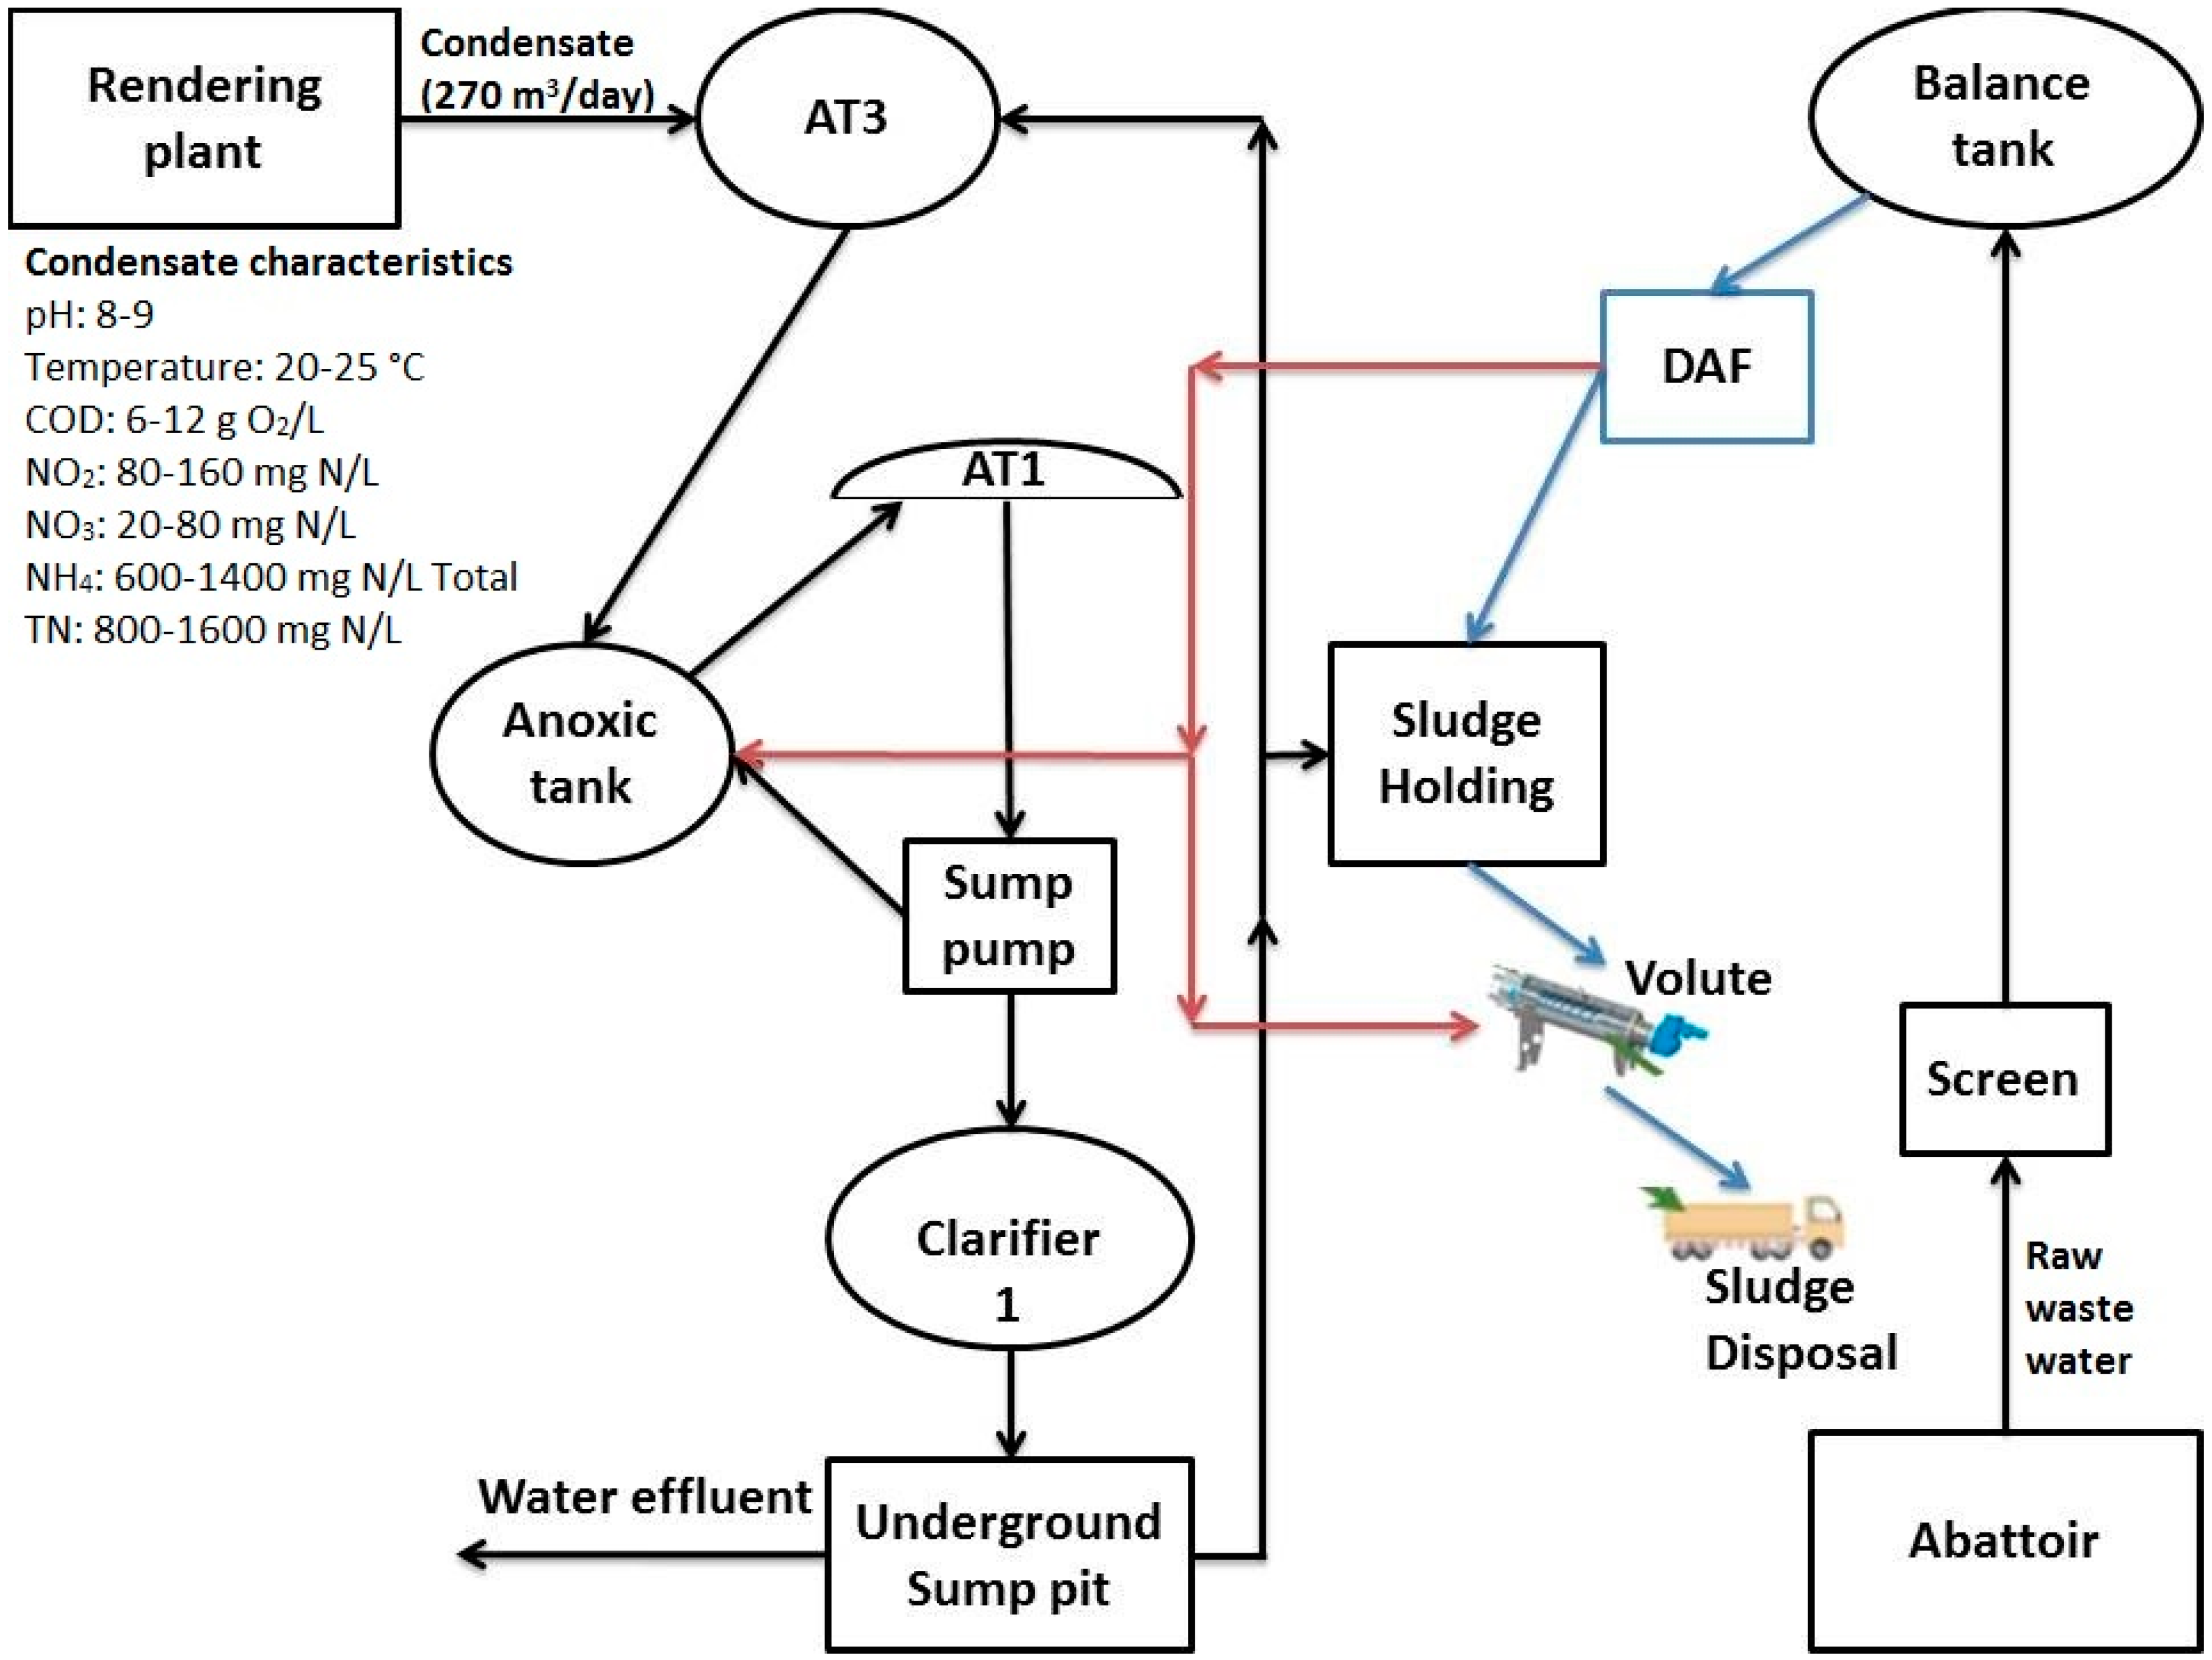
2.1. Physiochemical Characterisation of RCWW
2.2. Effect of RCWW on Membrane Materials
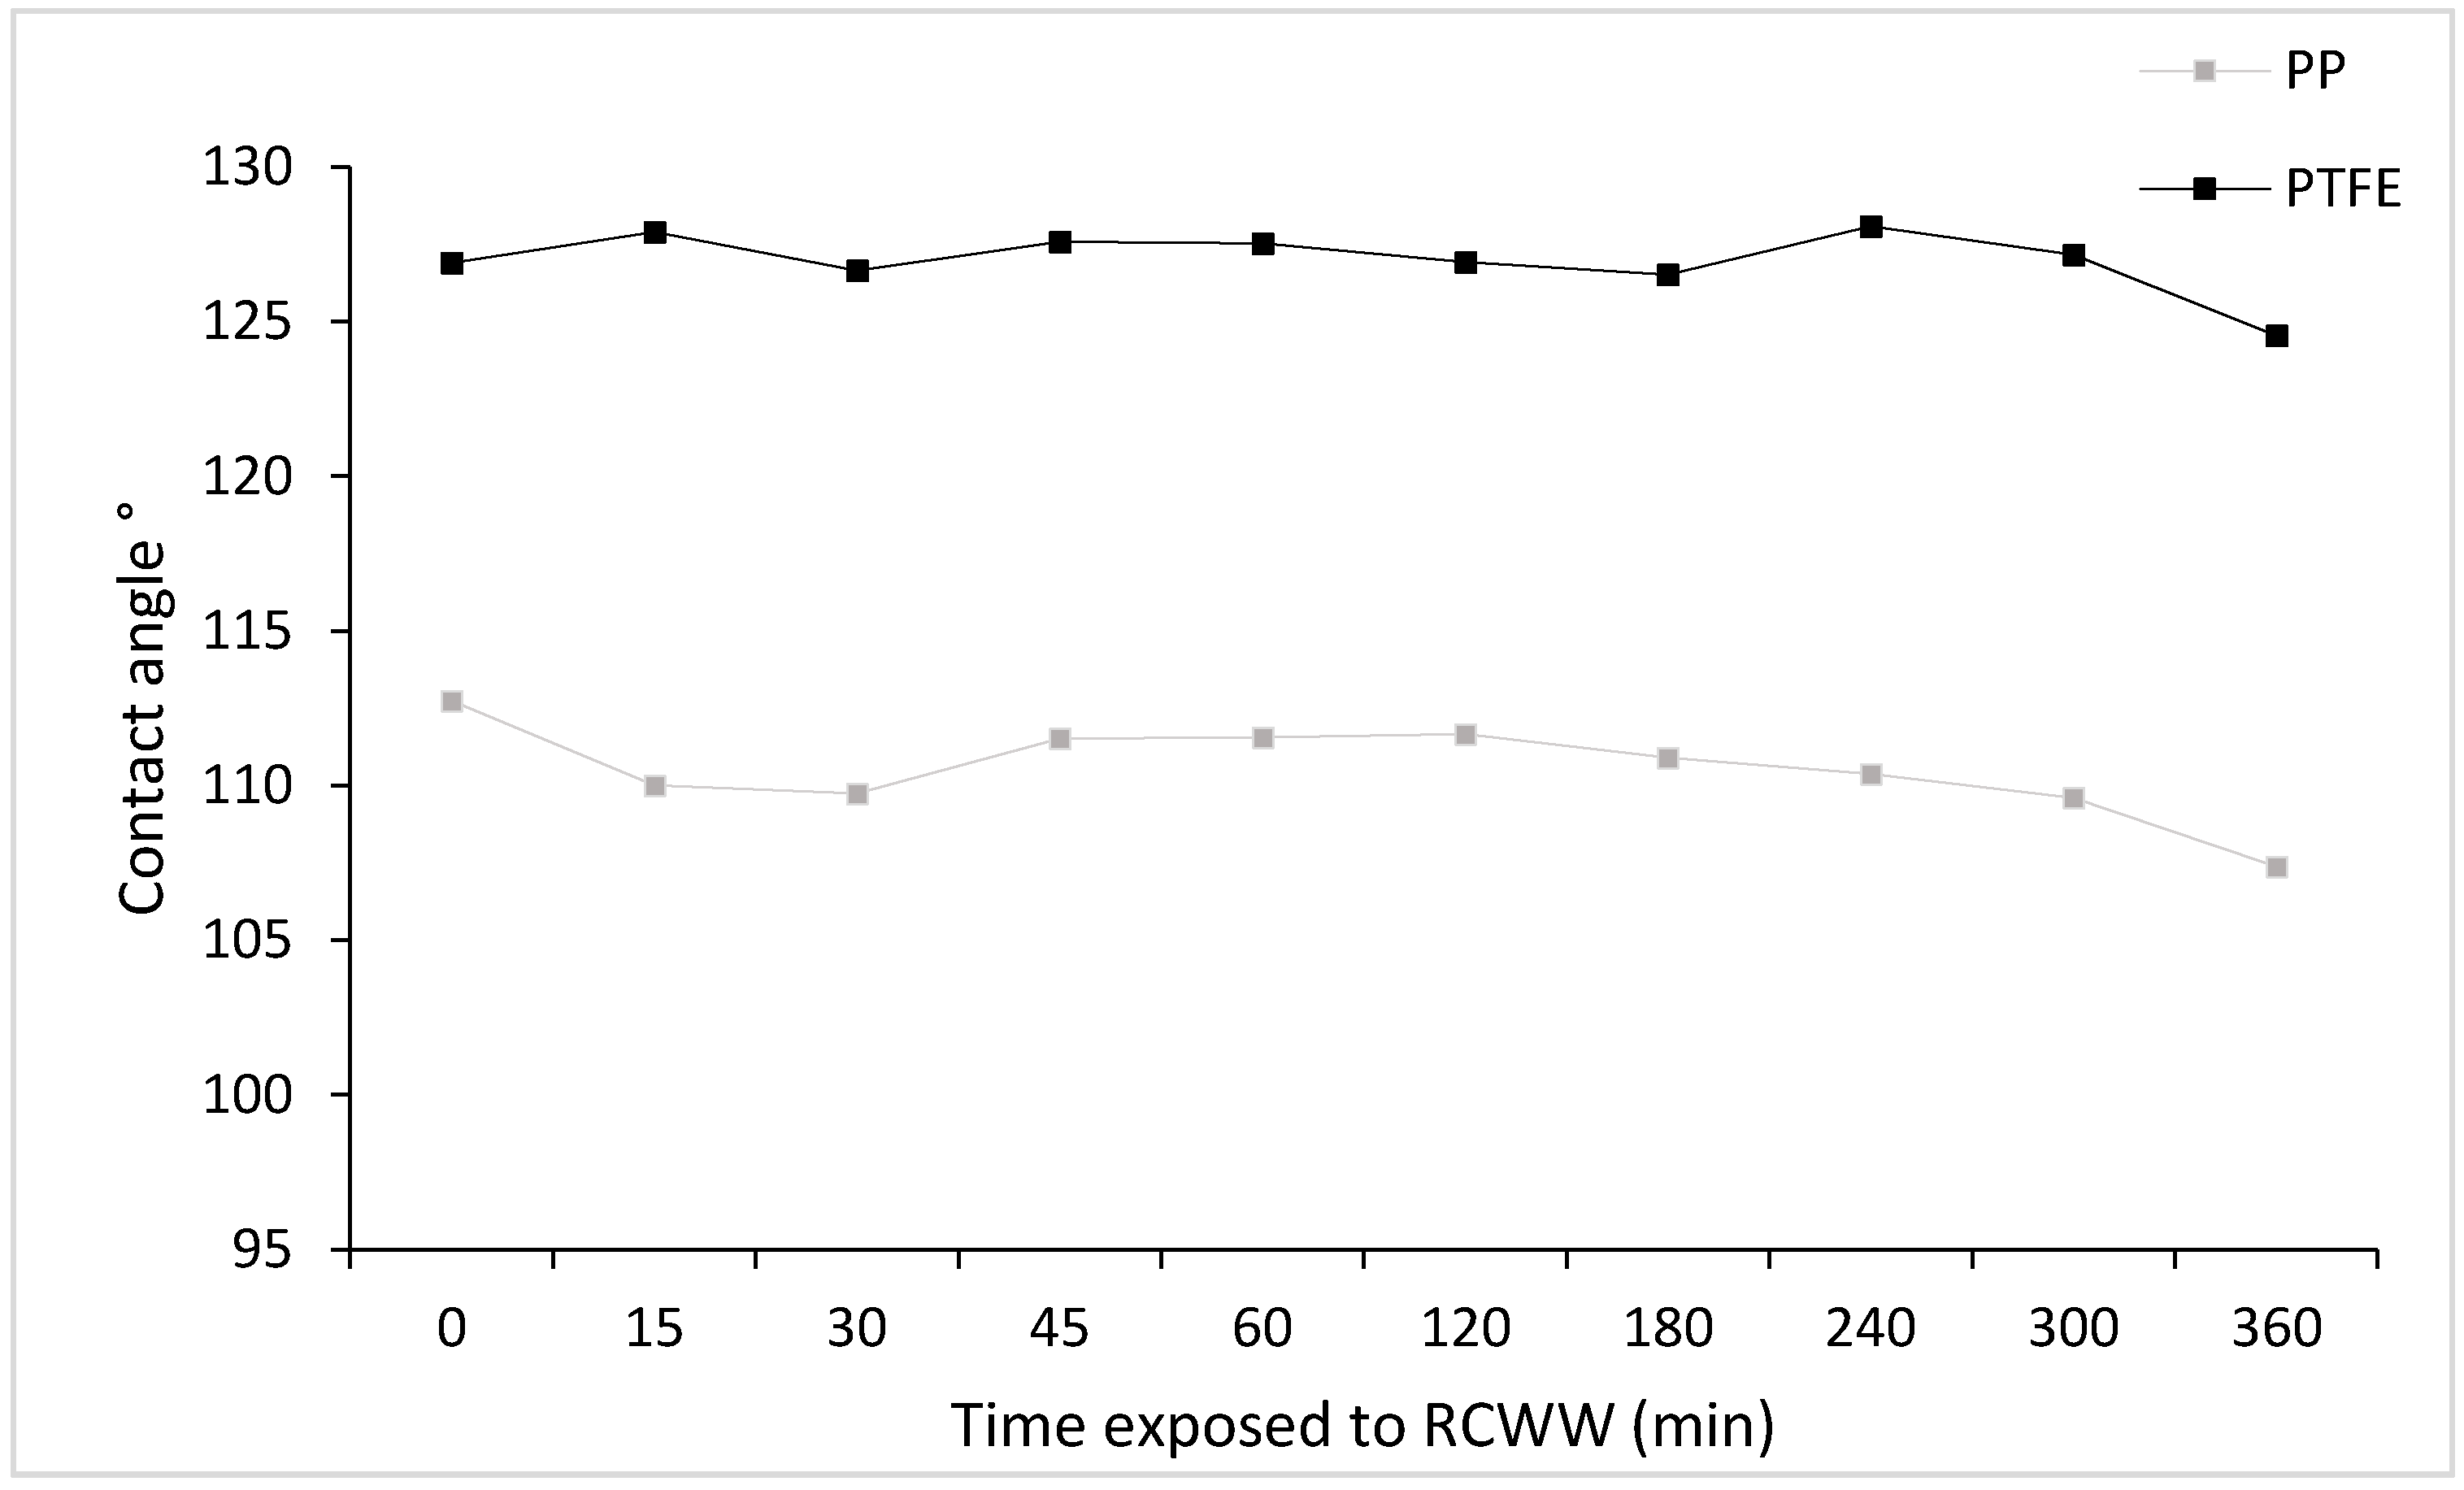
2.2.1. Membrane Wetting
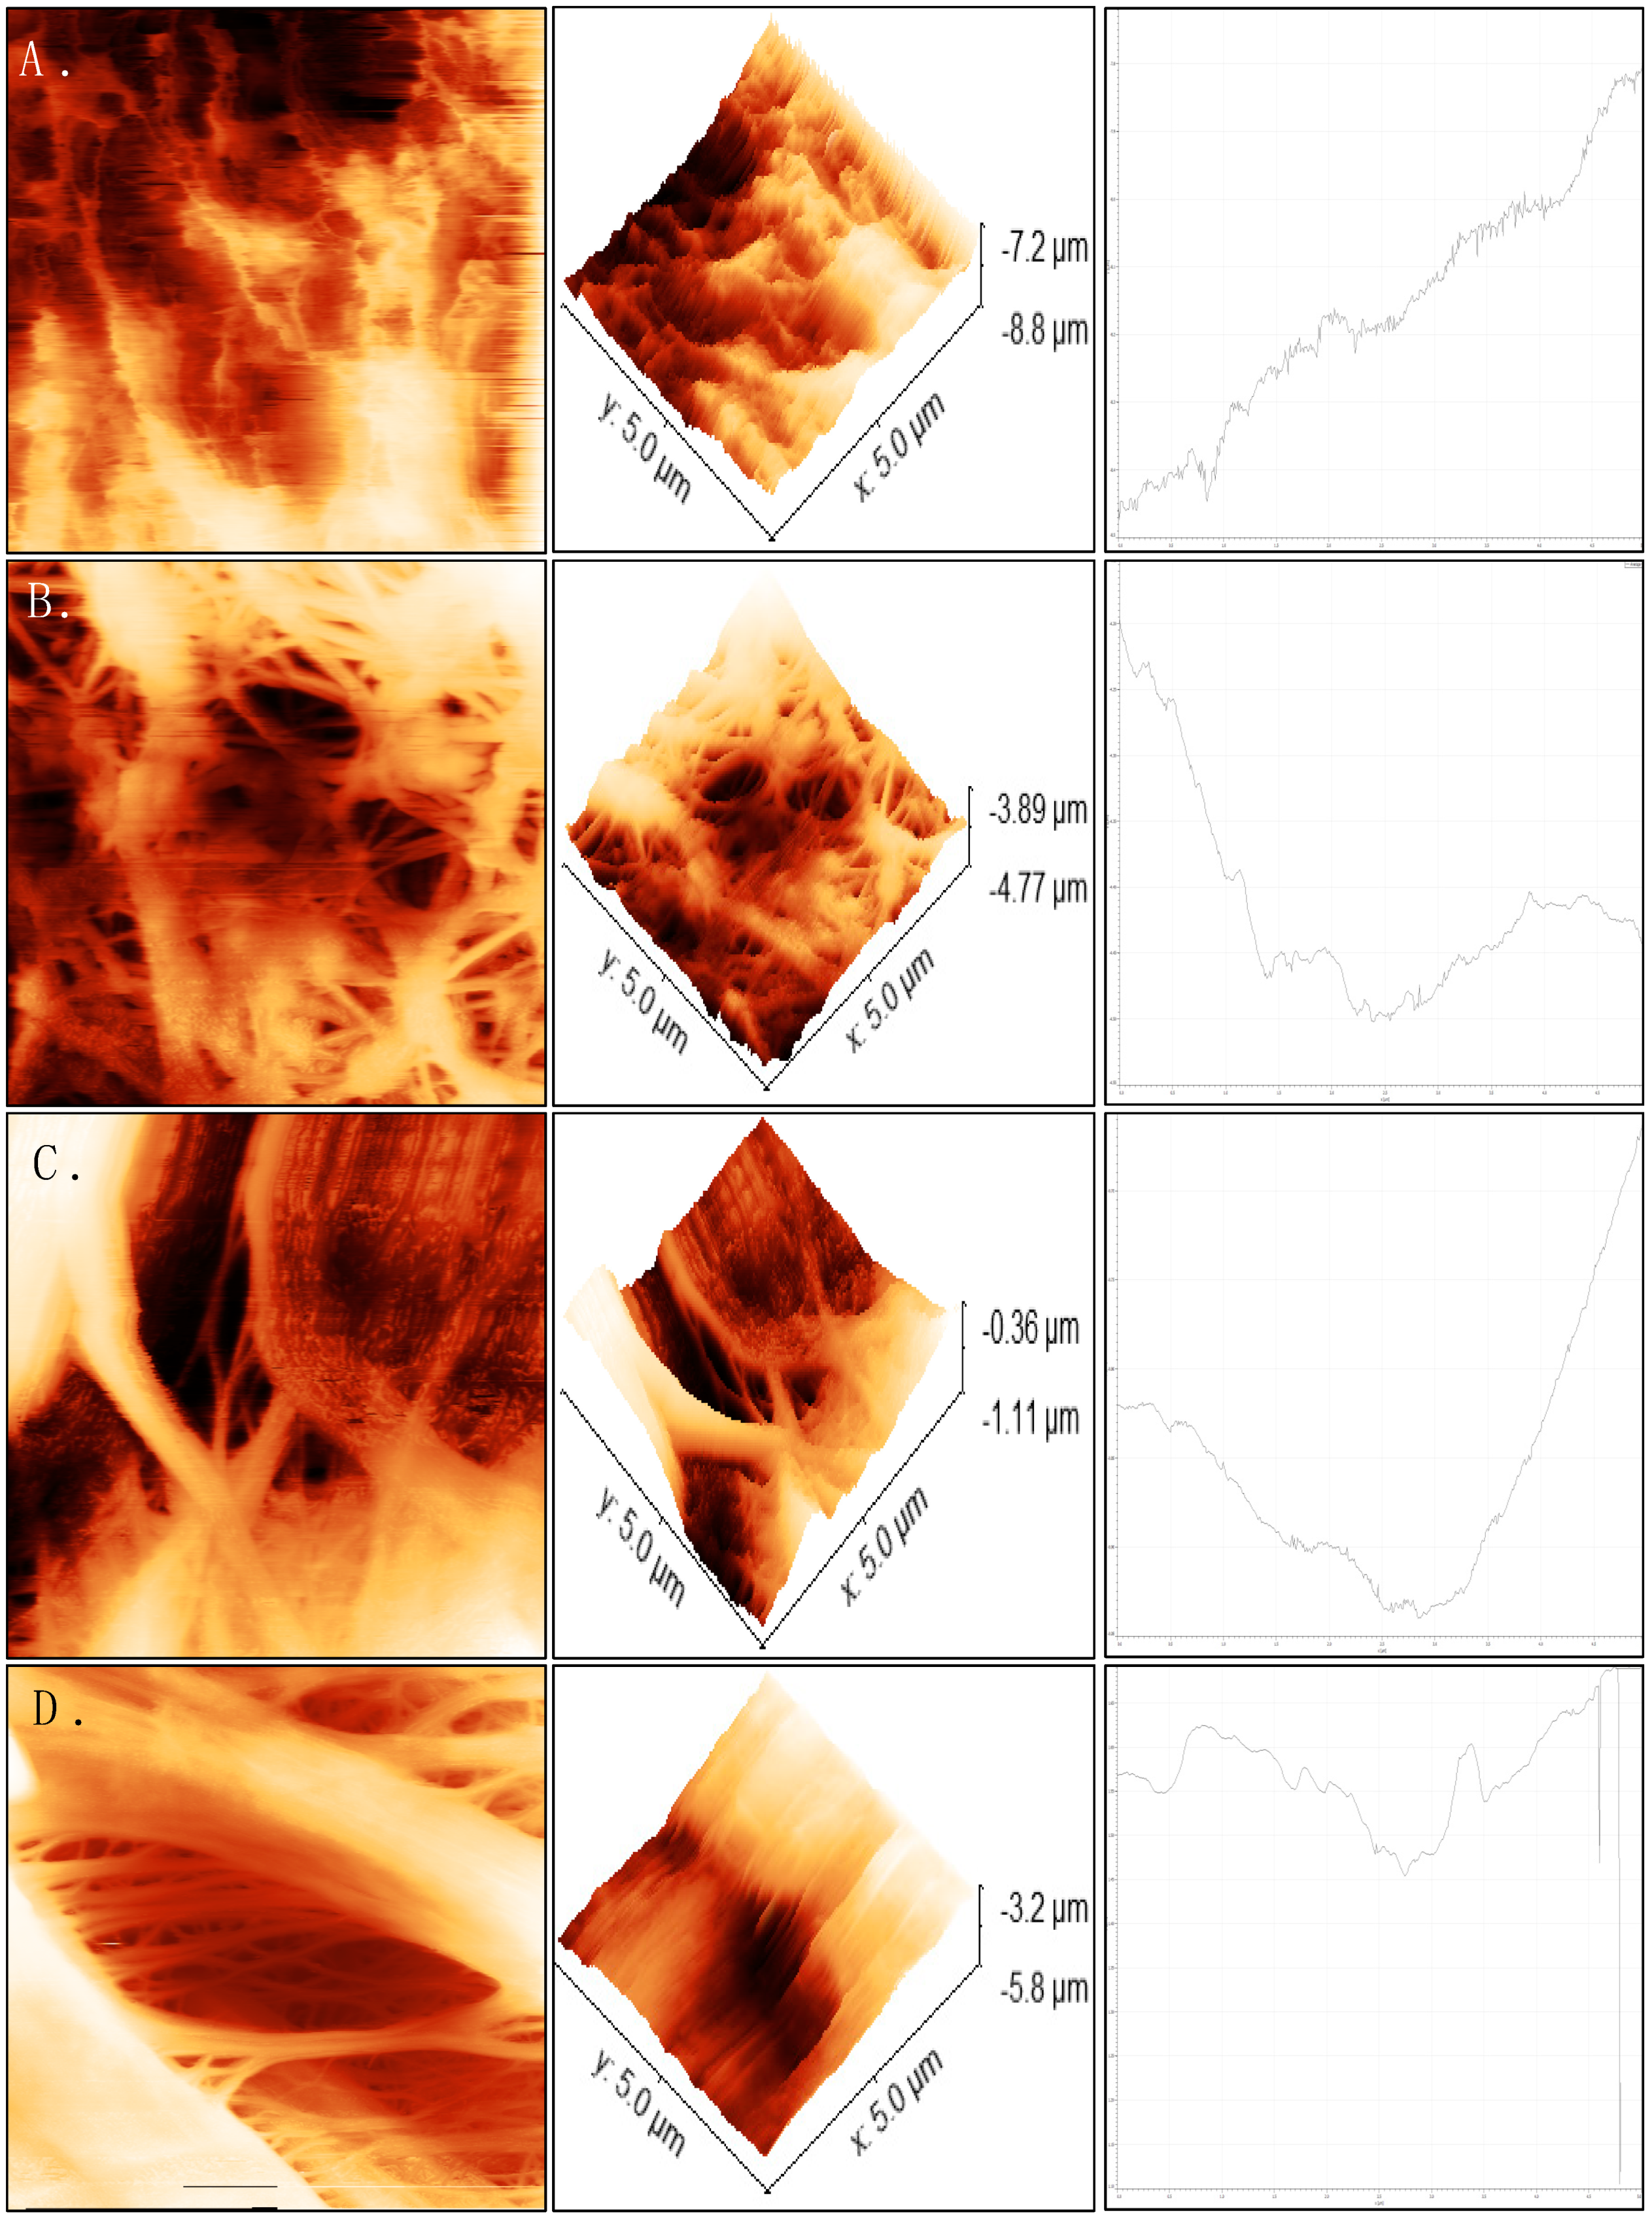
2.2.2. Membrane Roughness
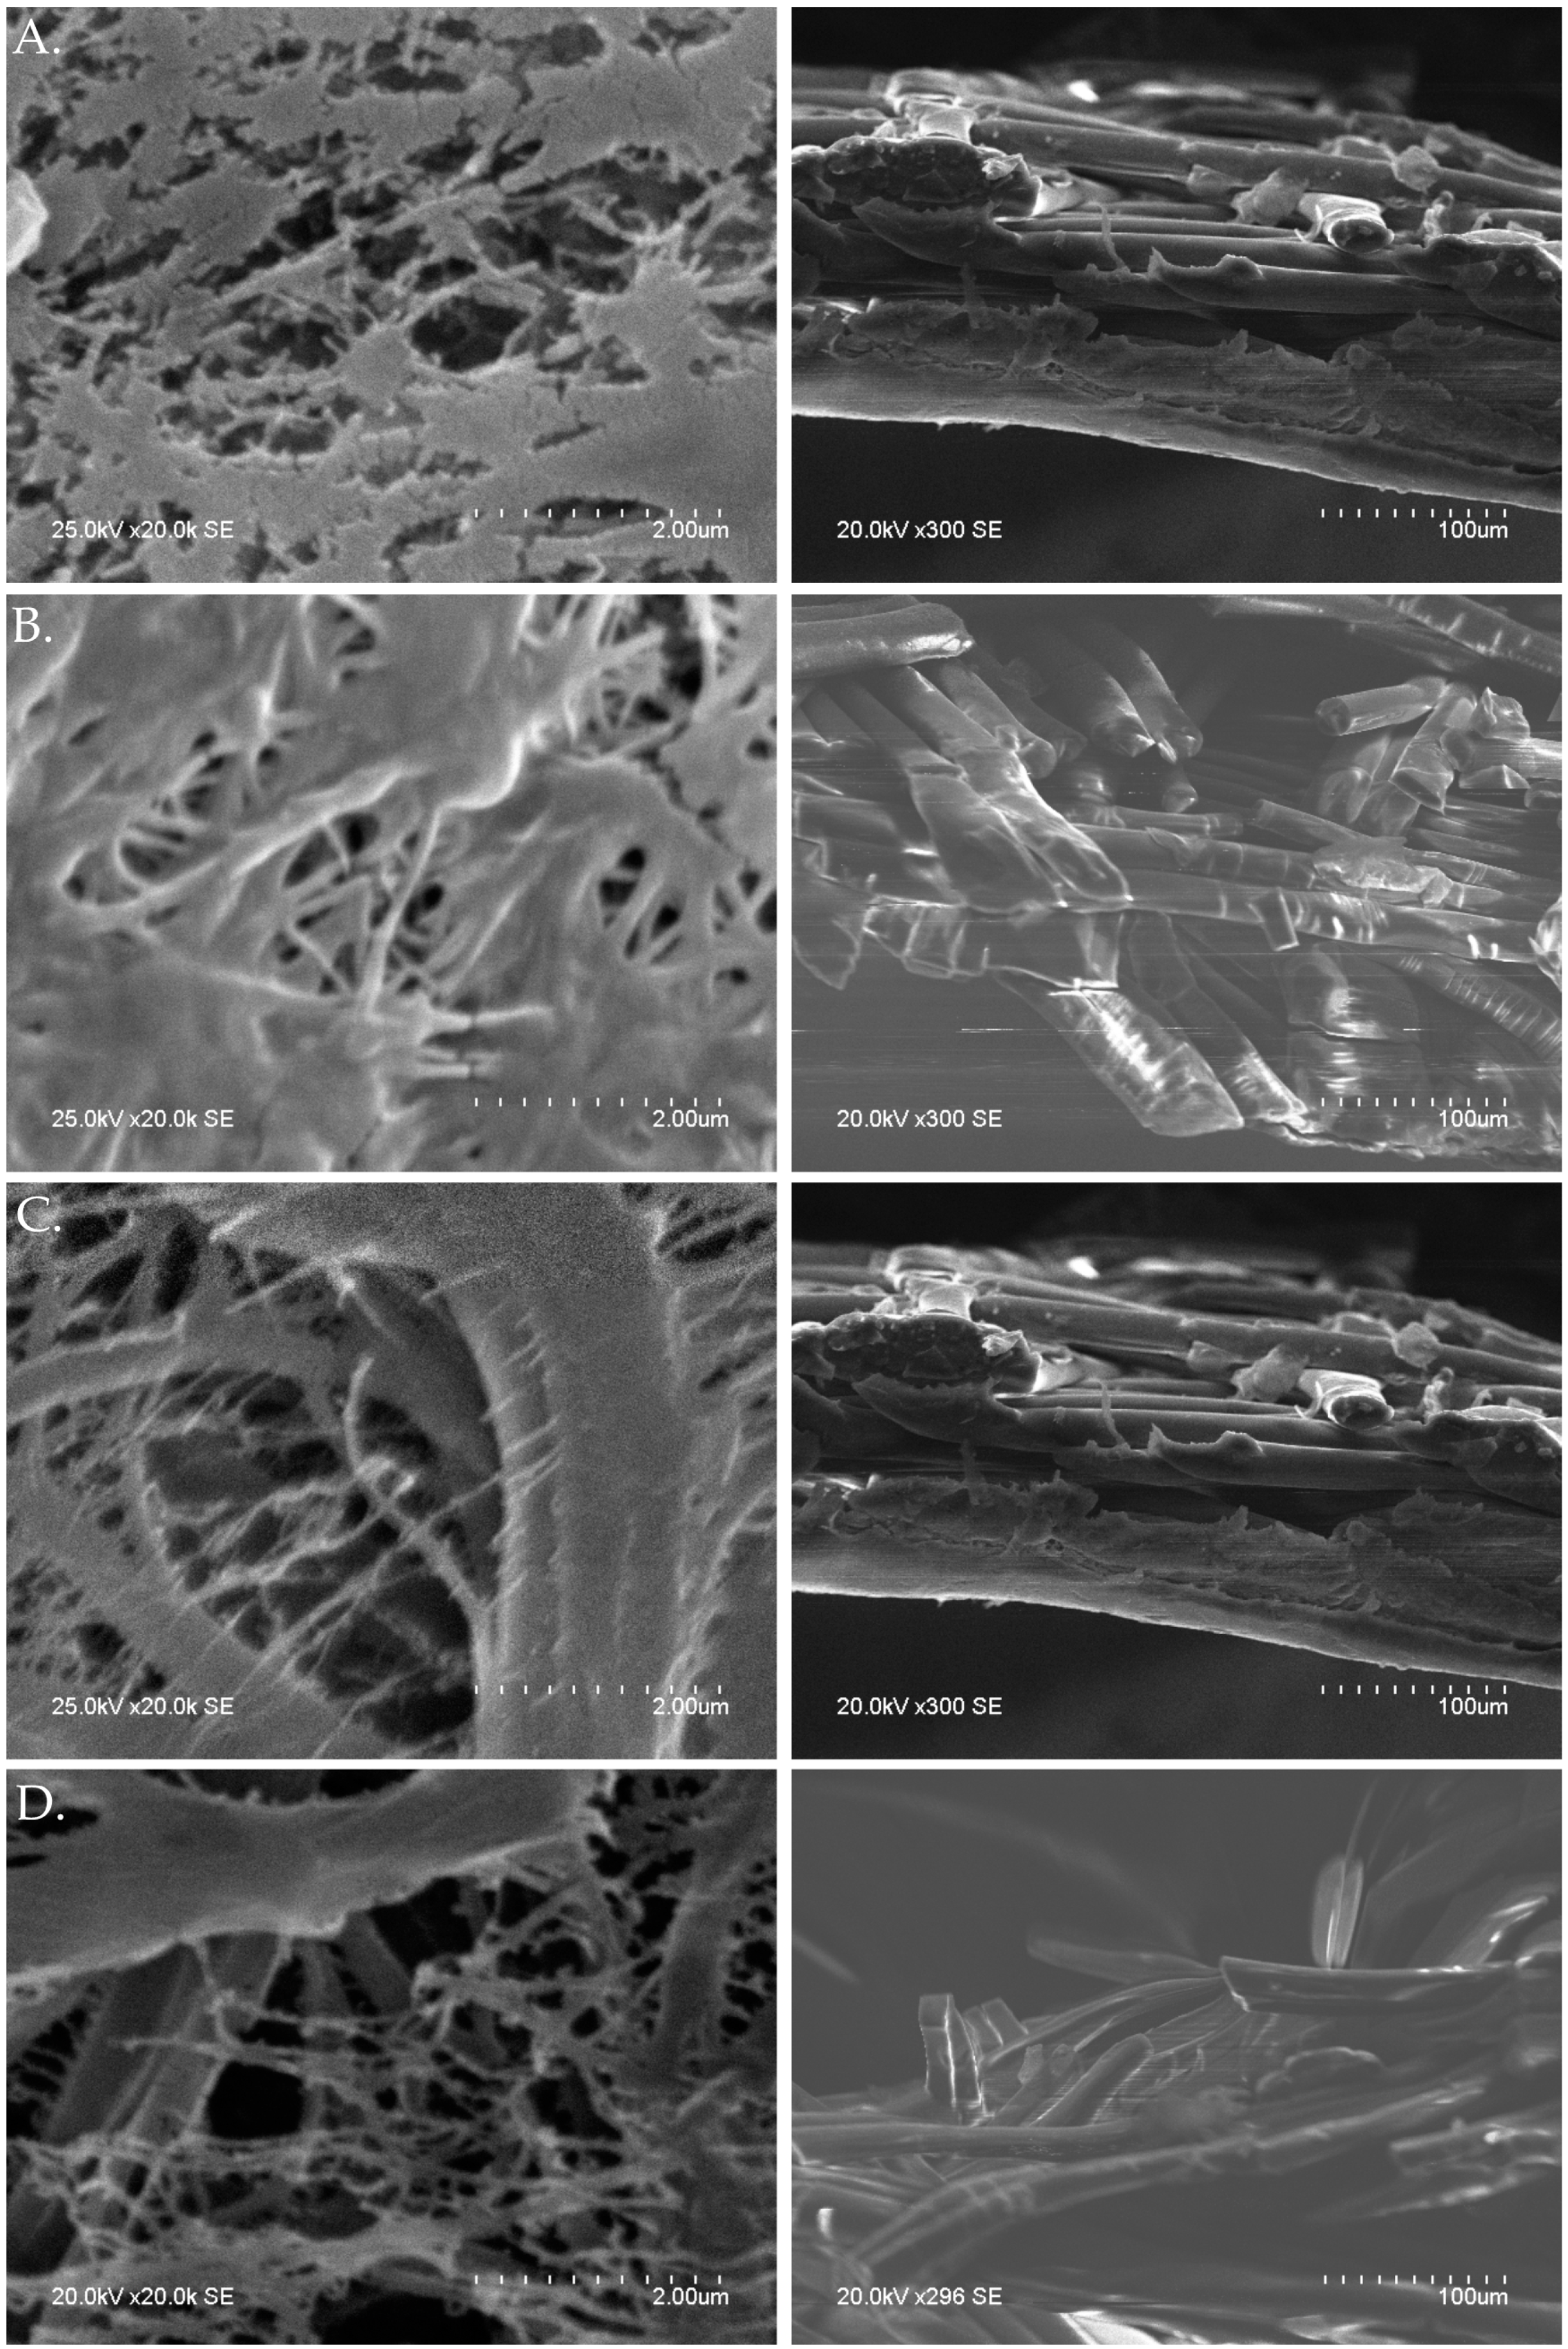
2.2.3. Membrane Morphology
2.3. Membrane Performance
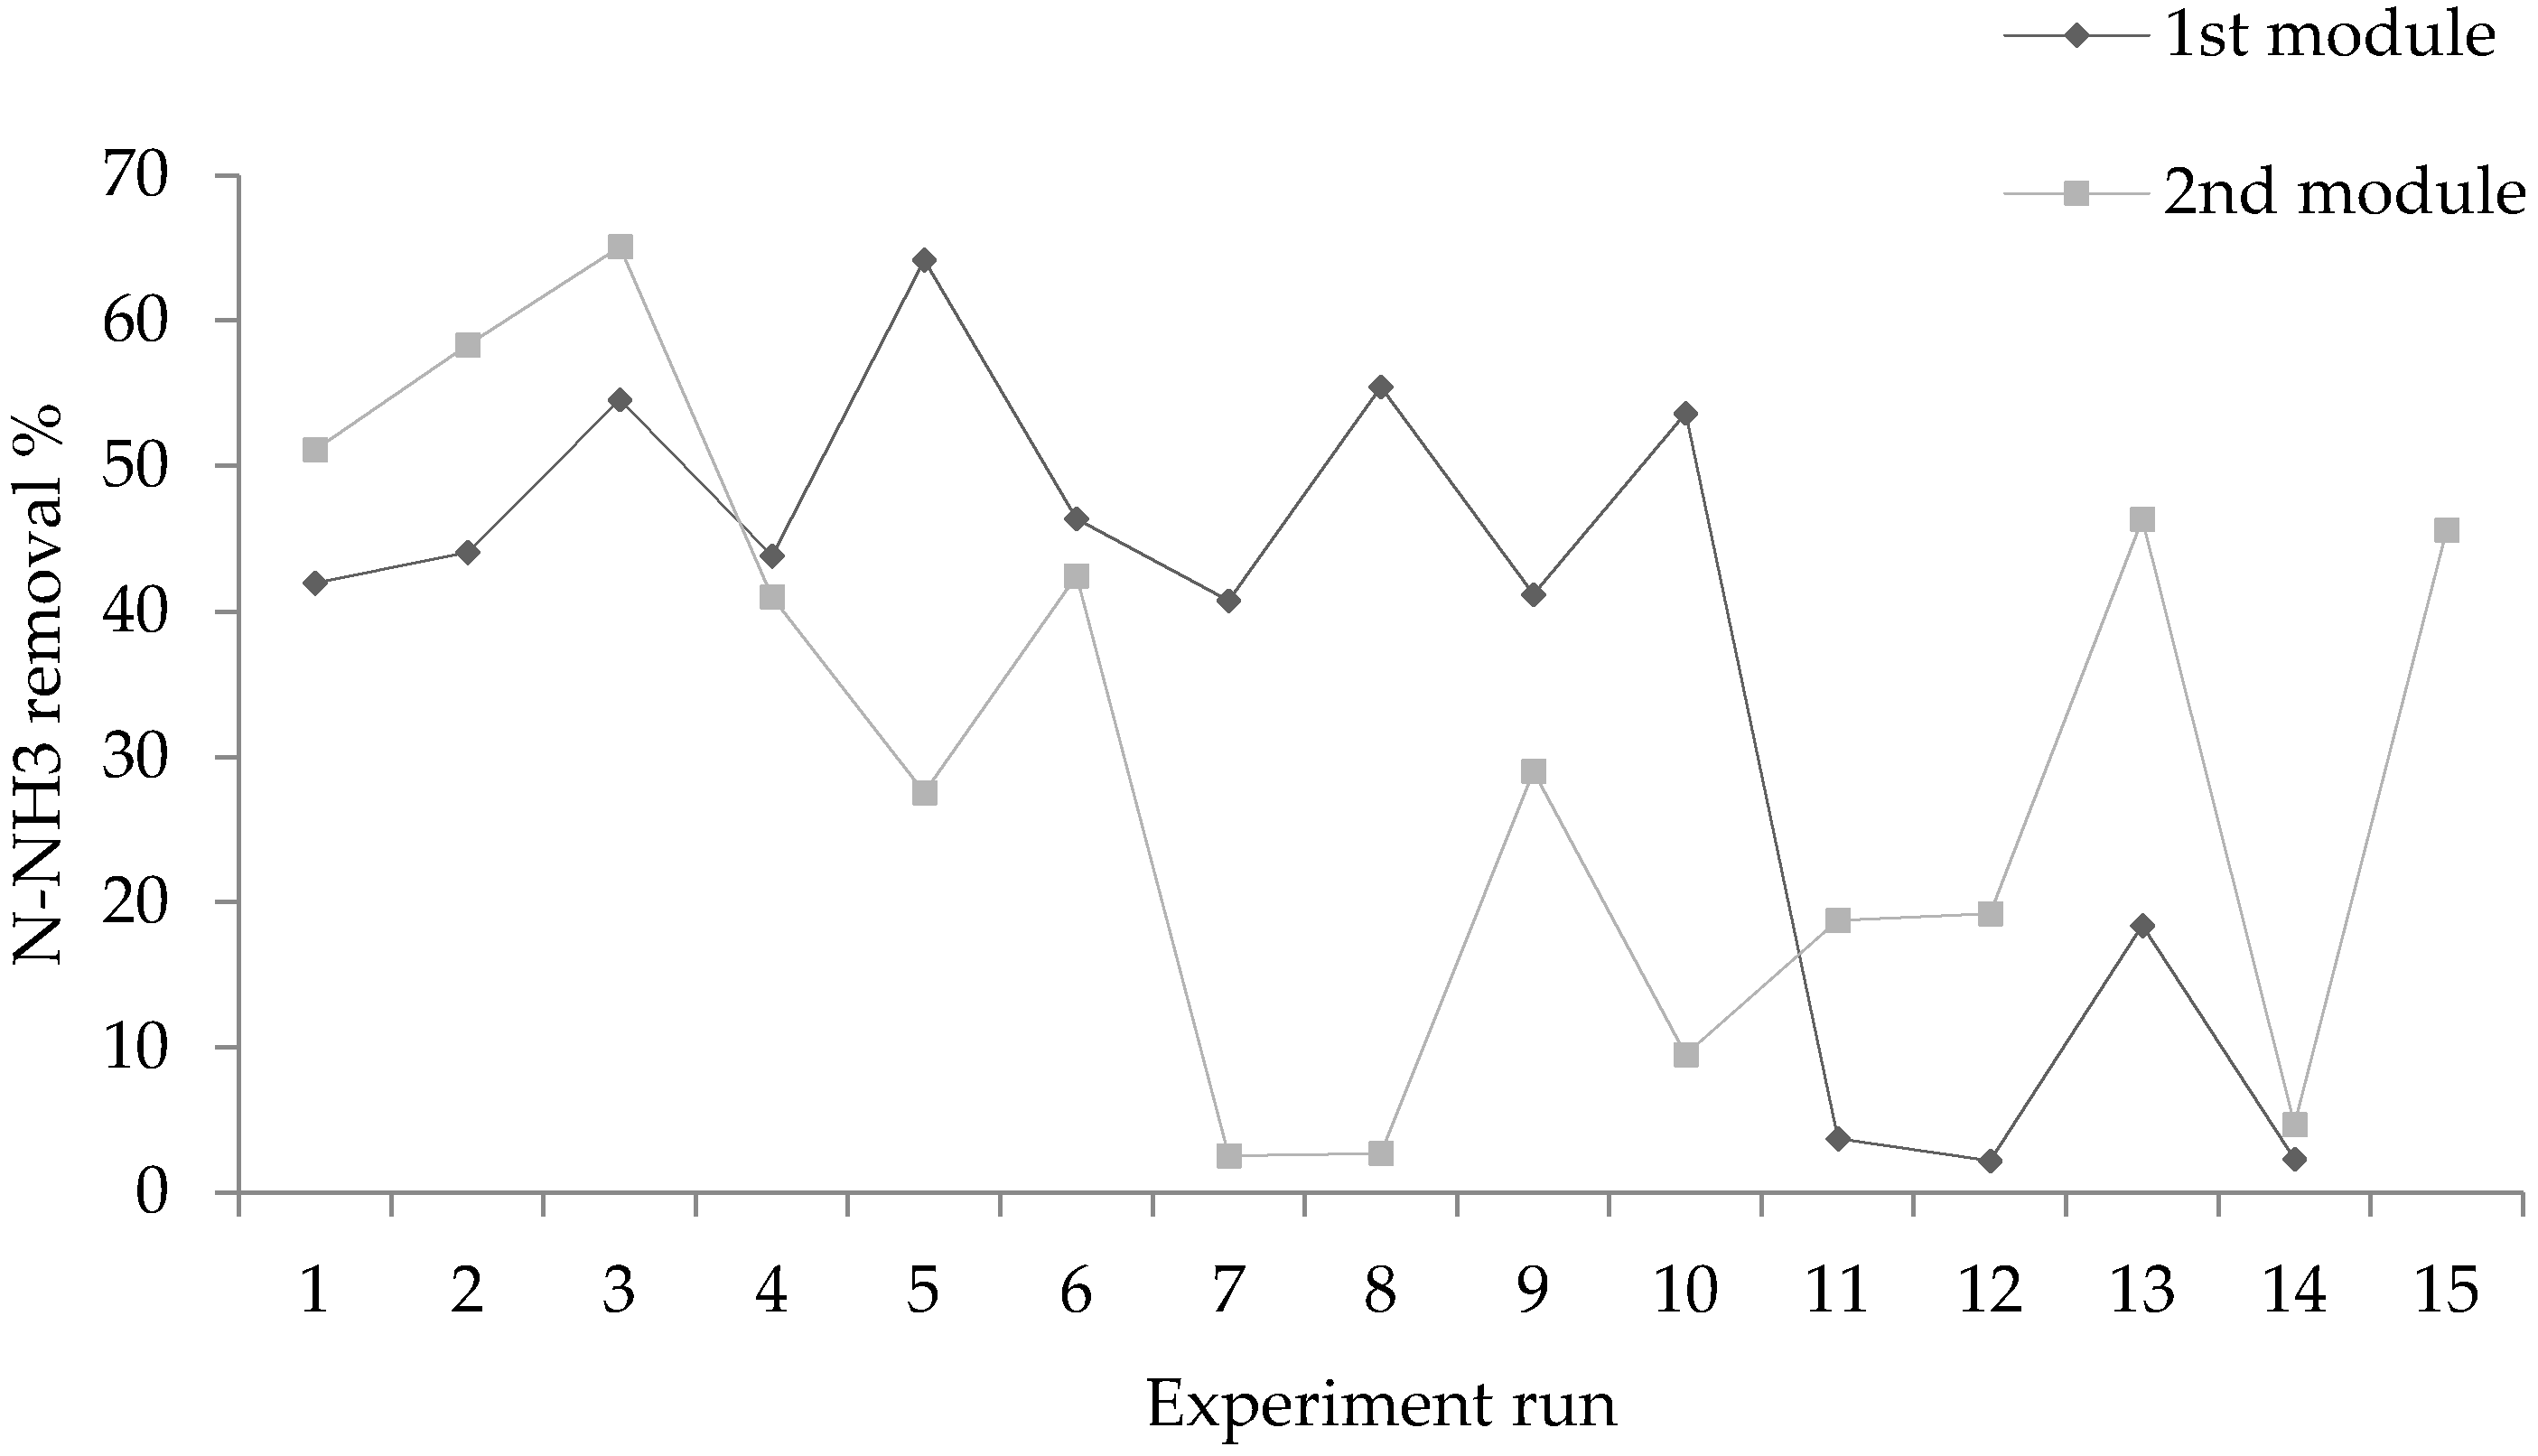
2.3.1. (NH3) Removal
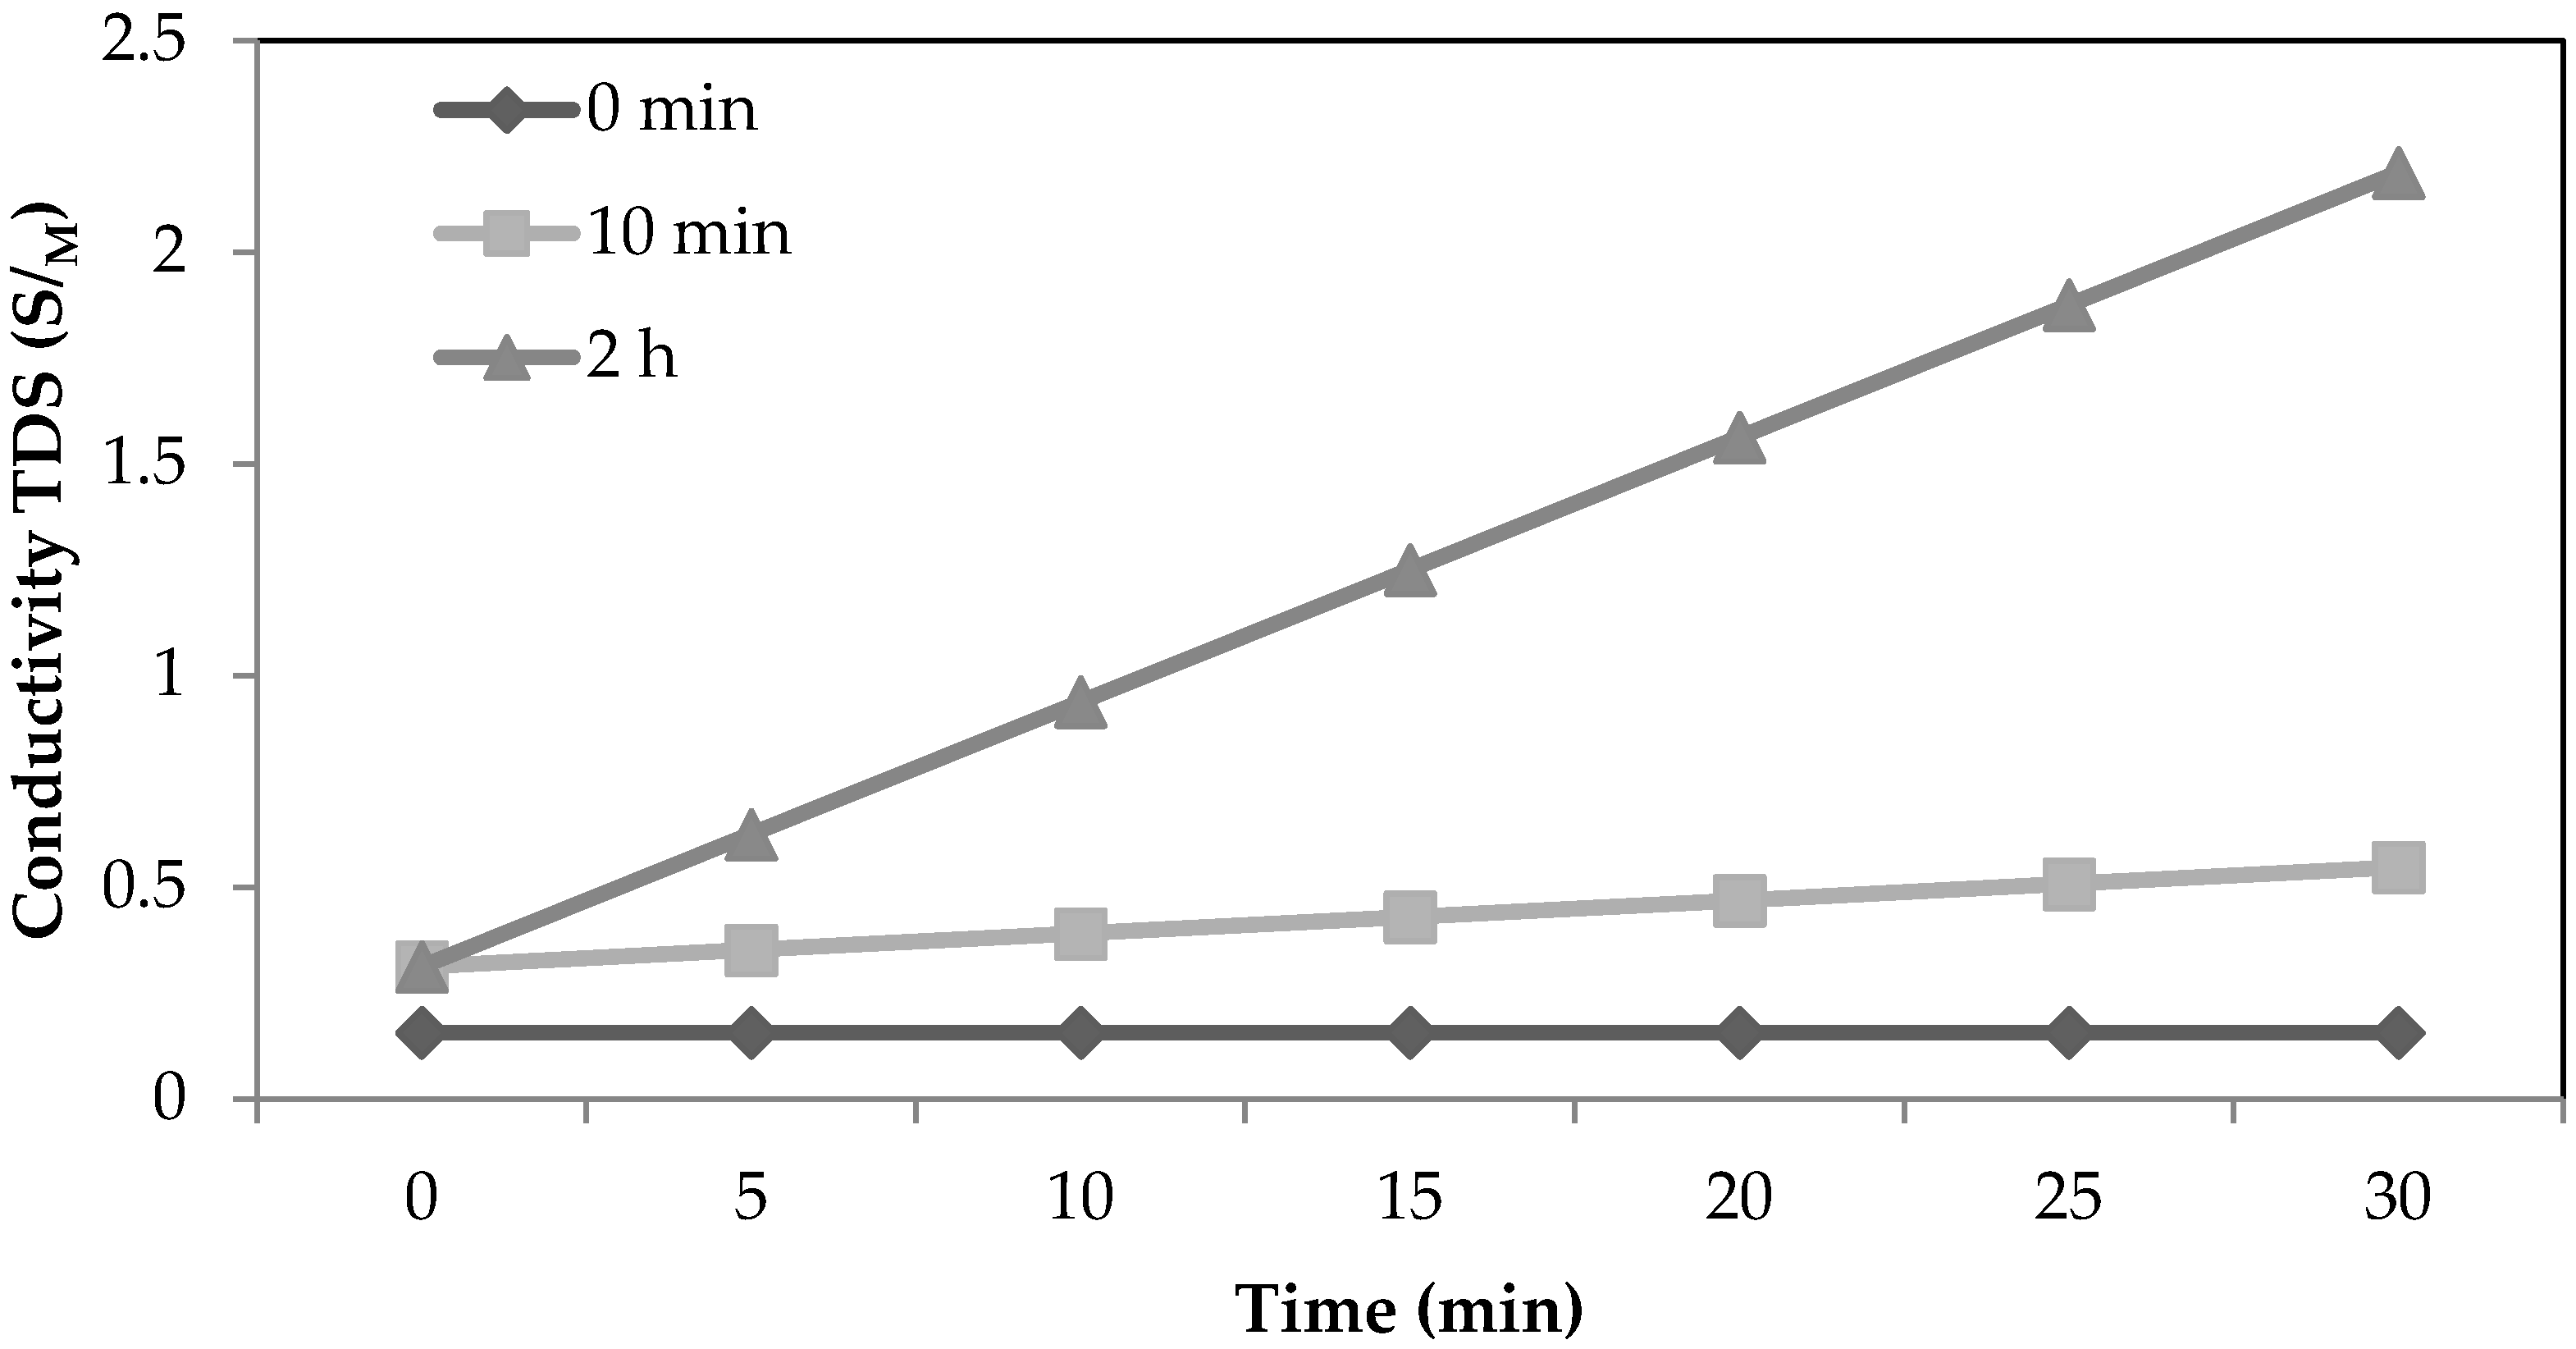
2.3.2. Membrane Leakage
2.4. Product Characterisation
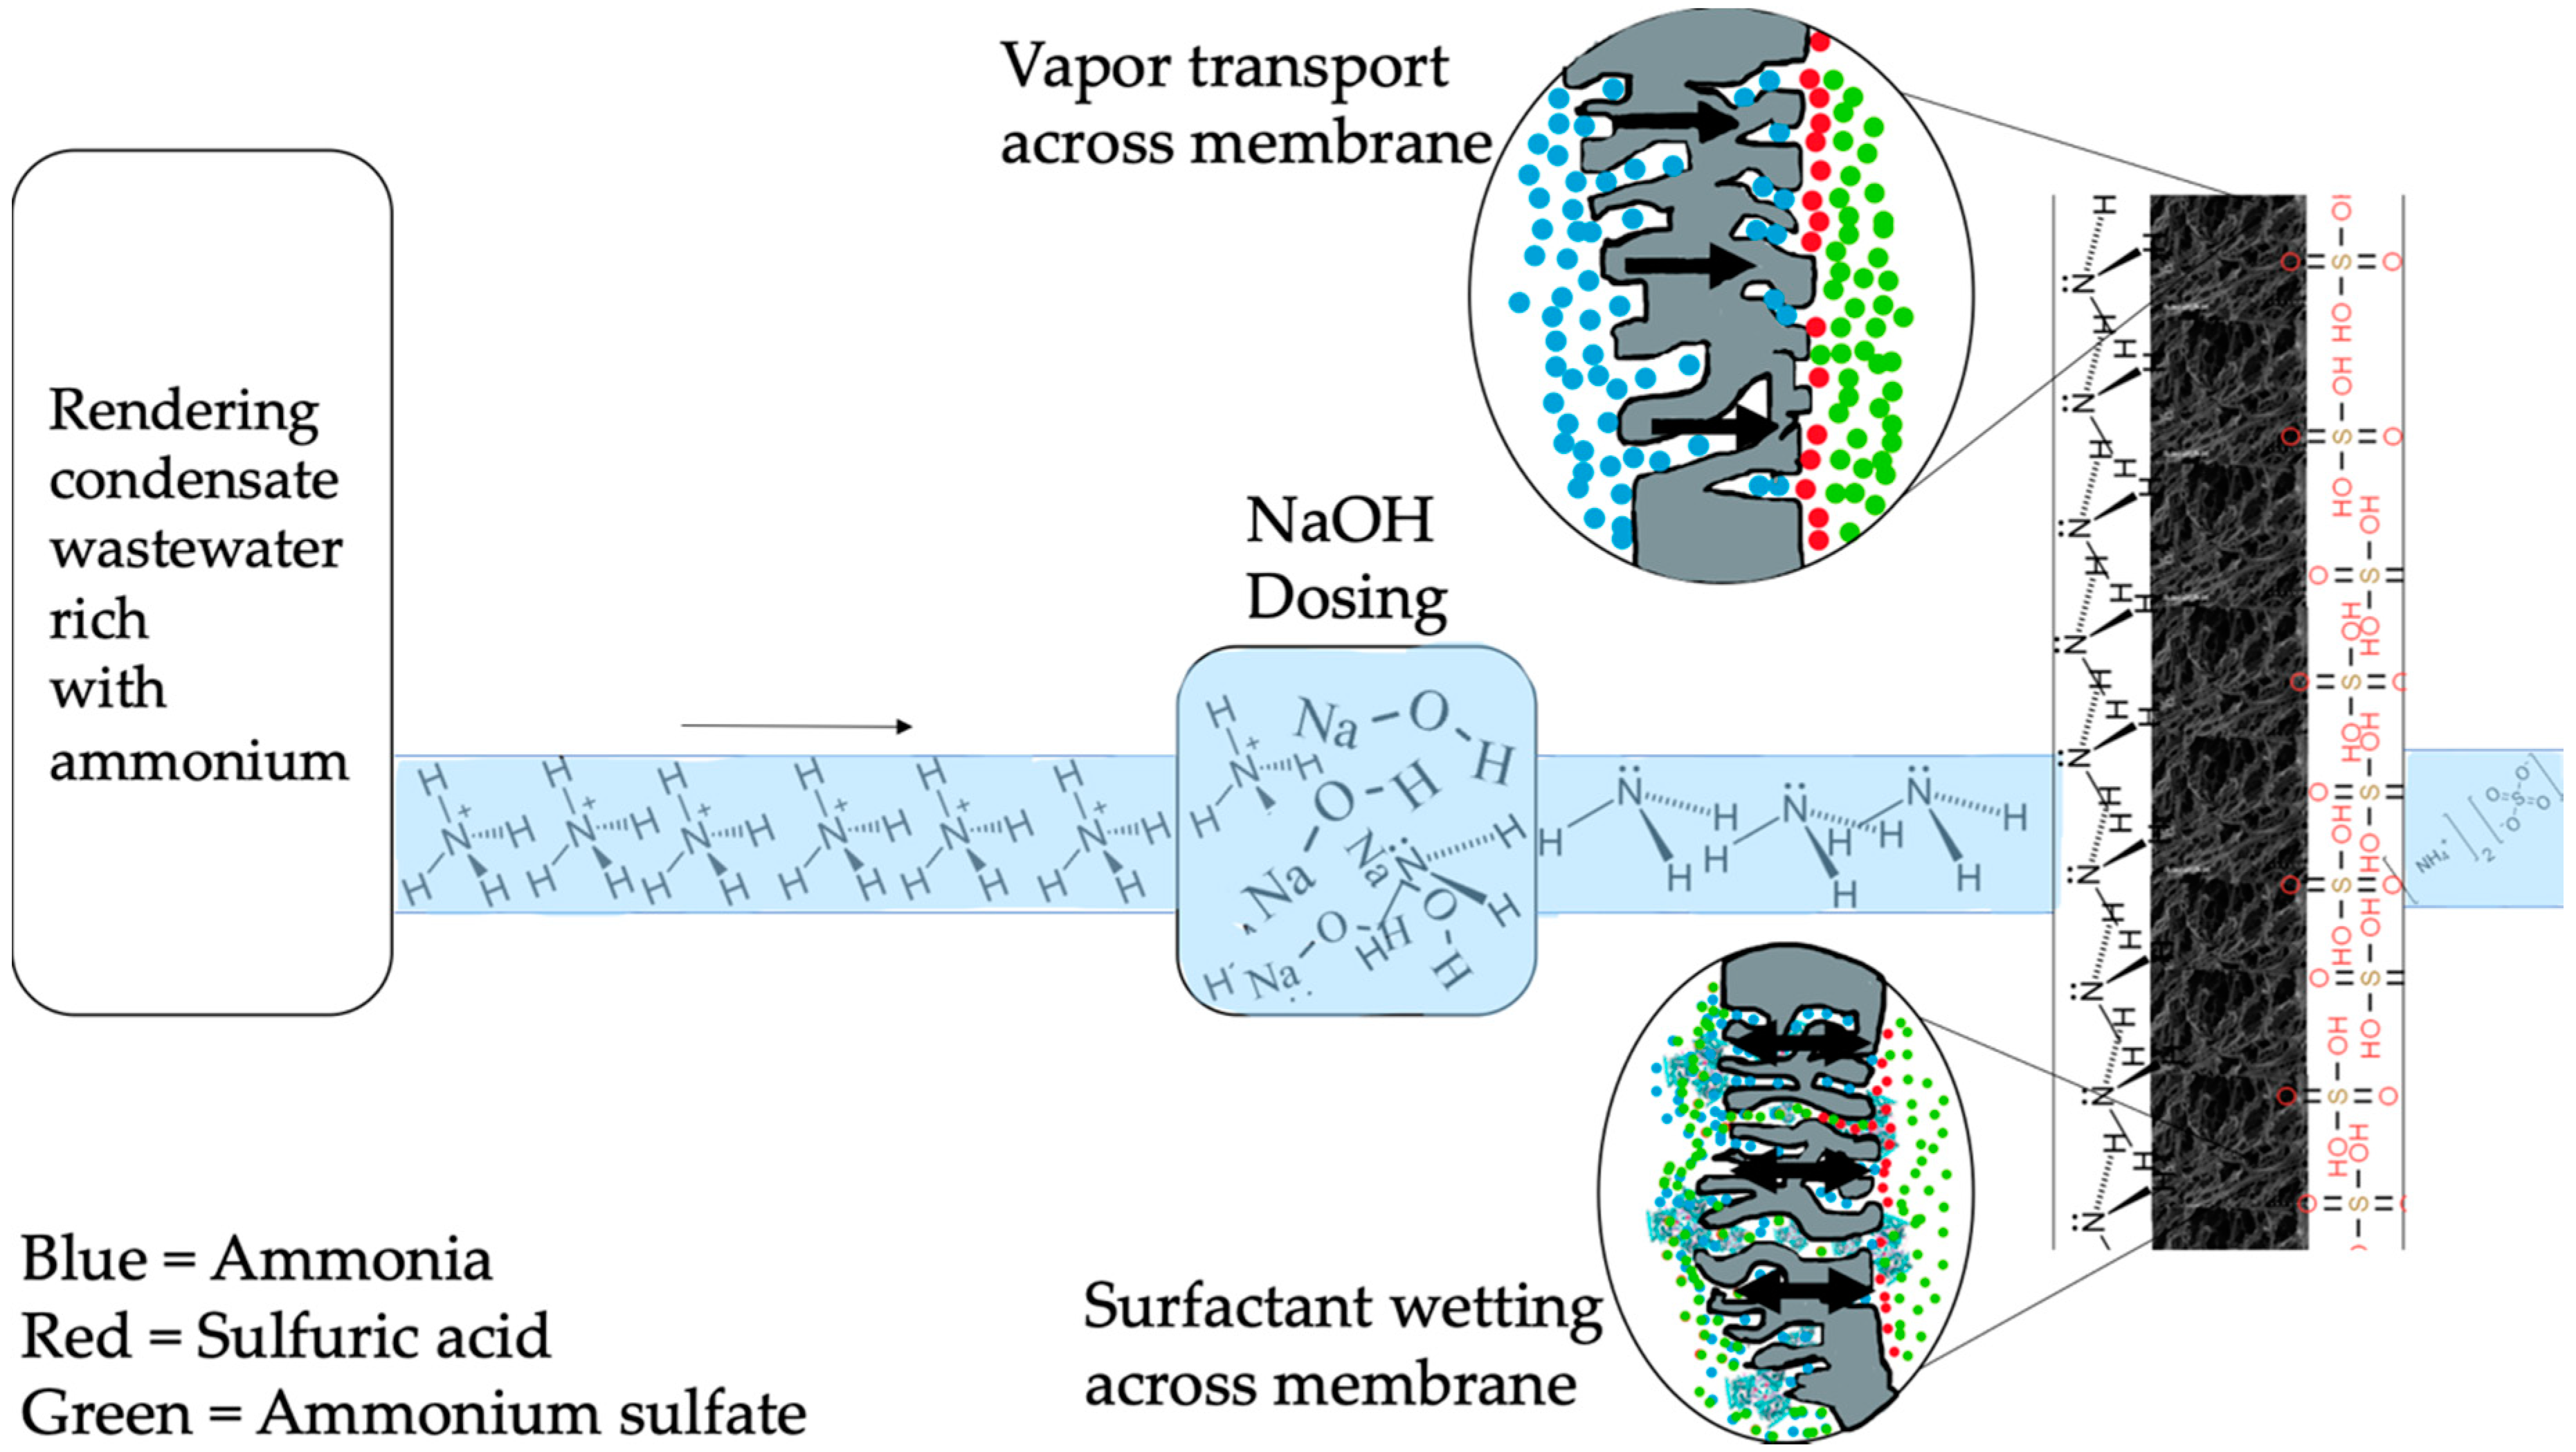
2.5. Molecule and Ion Movement through Membrane Material
2.6. Preliminary Life Cycle Assessment
3. Materials and Methods
3.1. Materials
3.2. Characterisation of Membranes
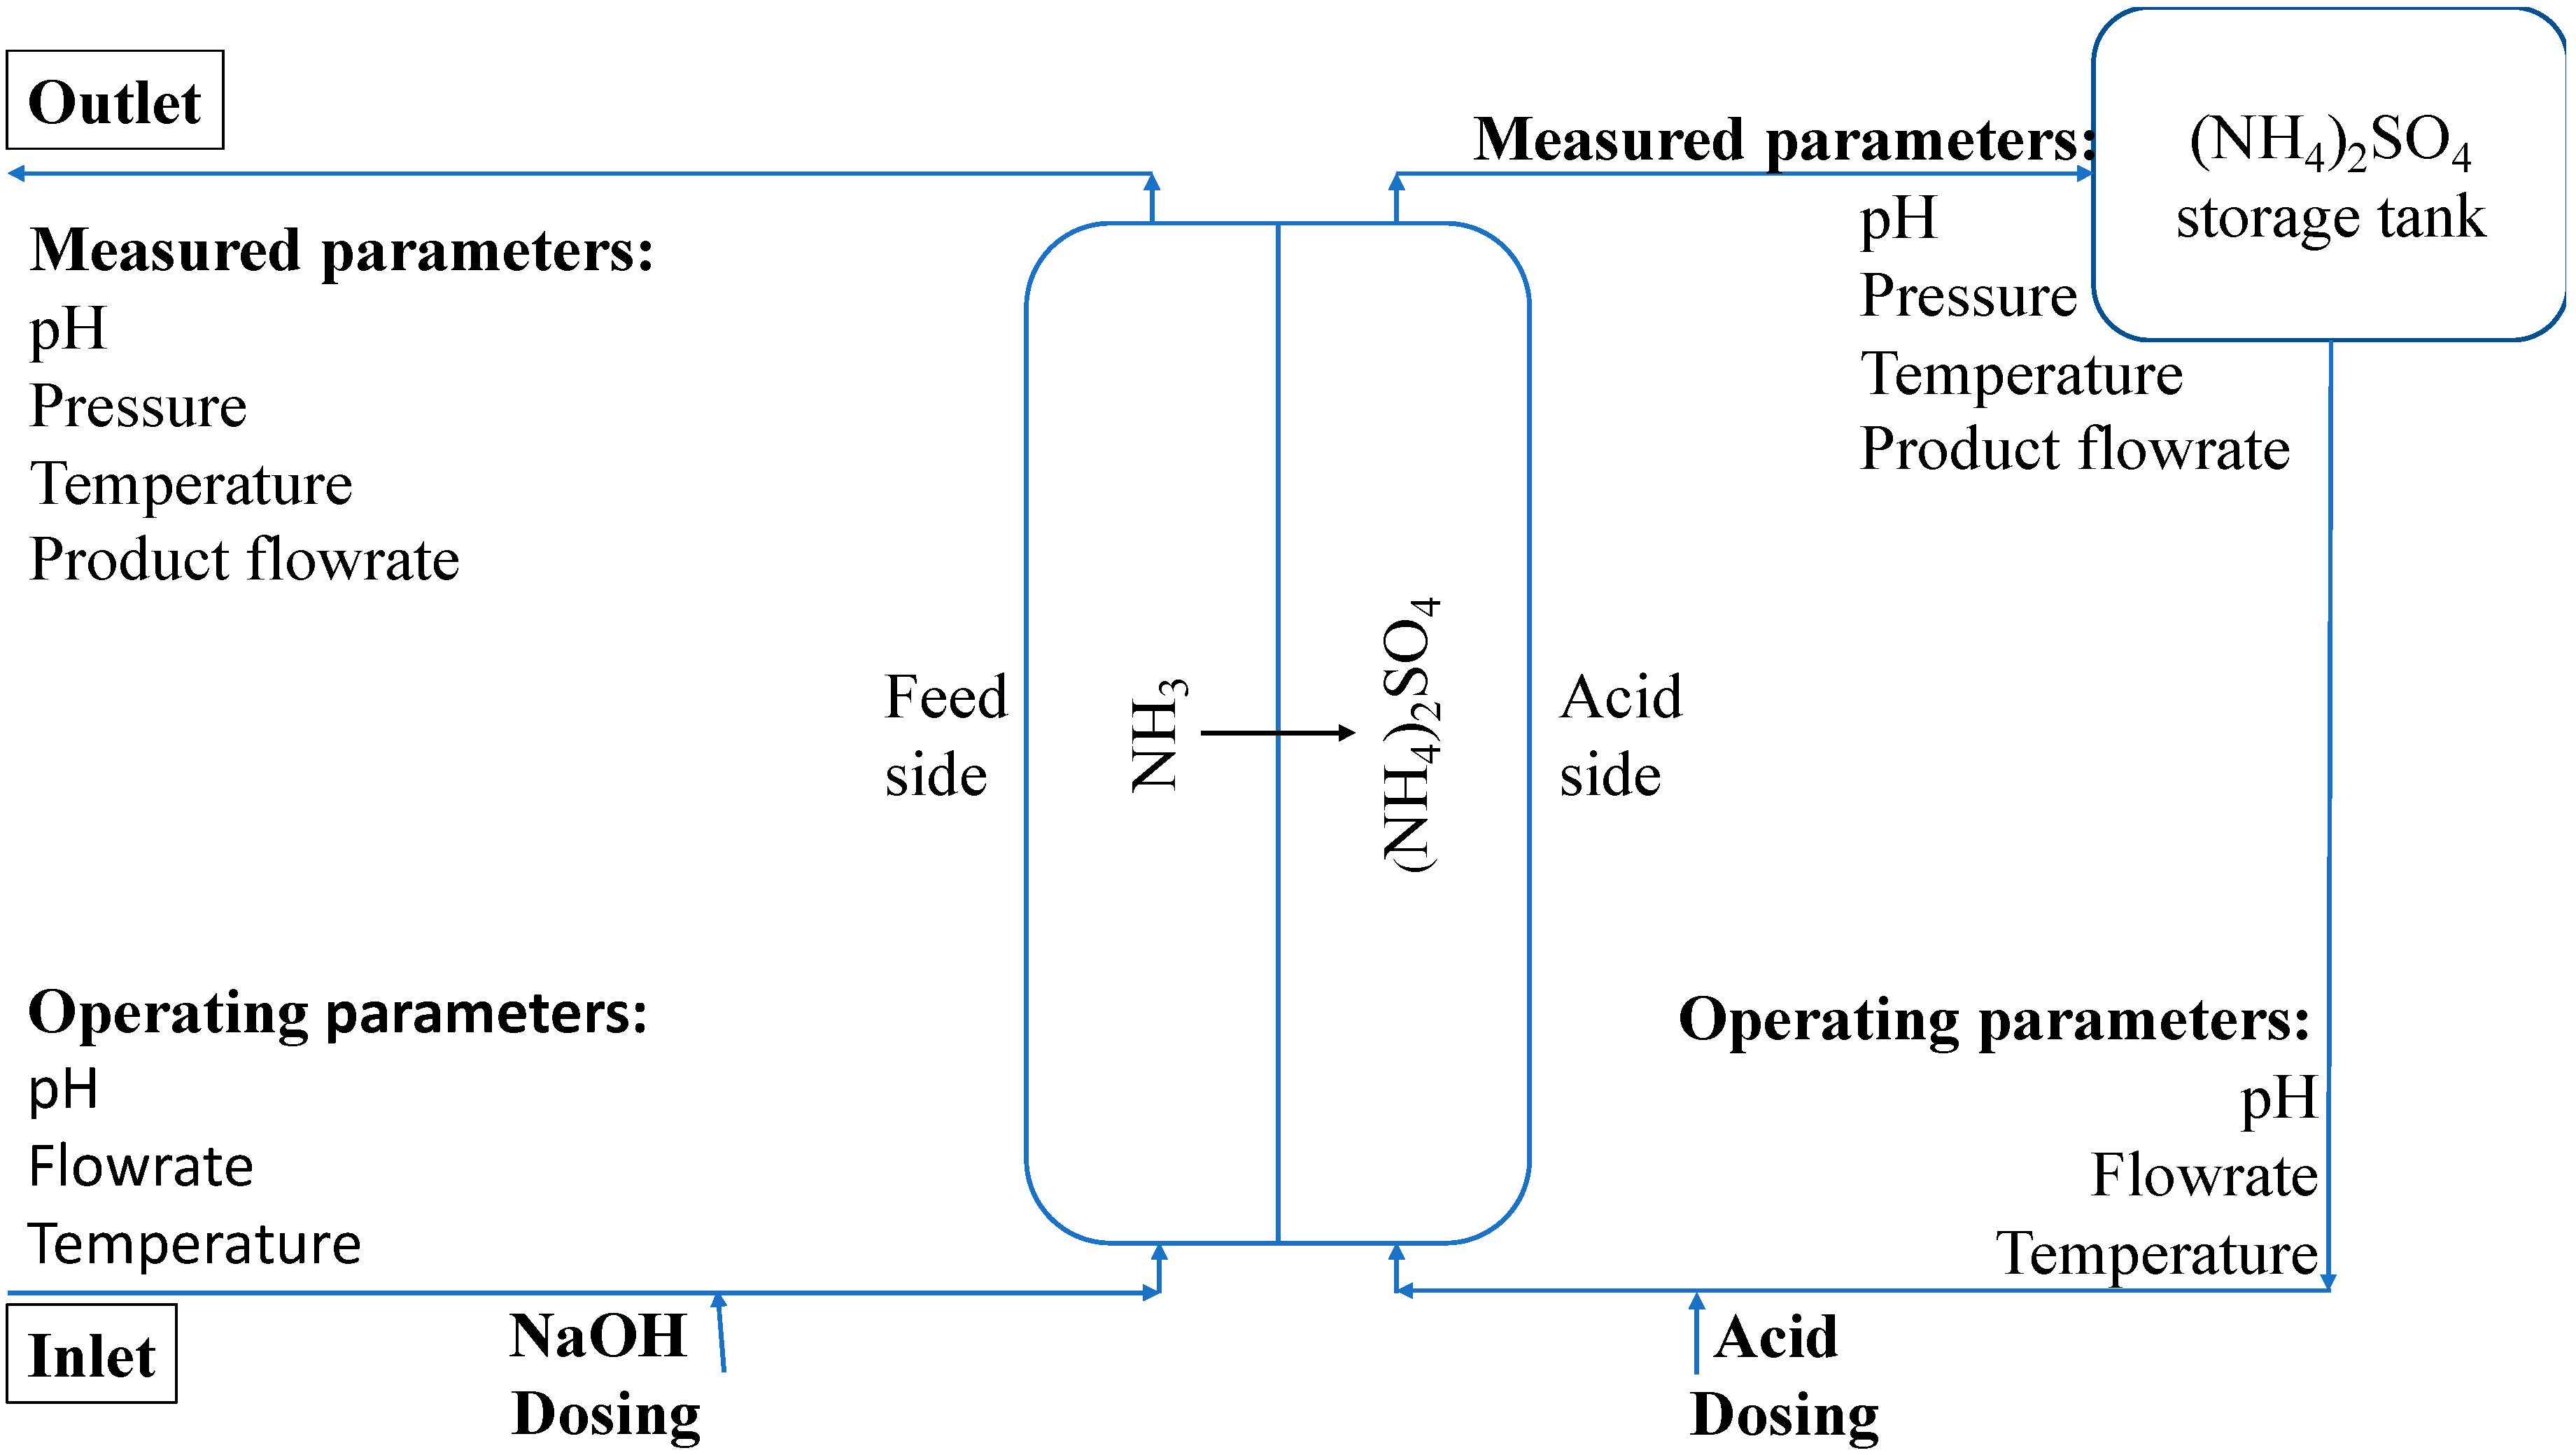
3.3. Pilot Operation
3.4. Physicochemical Characterisation of RCWW
4. Conclusions
Supplementary Materials
Author Contributions
Funding
Acknowledgments
Conflicts of Interest
Abbreviations
| NH3 | Ammonia |
| WW | Wastewater |
| RCWW | Rendering condensate wastewater |
| NH4 | Ammonium |
| PP | Polypropylene |
| PTFE | Polytetrafluorethylene |
| FOG | Fat, oil and grease |
| NaOH | Sodium hydroxide |
| ((NH4)2SO4) | Ammonium sulphate |
| LEP | Liquid entry pressure |
| H2SO4 | Sulfuric acid |
| CA | Contact angle |
| DI water | Deionised water |
| NaHCO3 | Sodium bicarbonate |
| CaCO3 | Calcium carbonate |
| CAPEX | Capital expenditure |
| OPEX | Operational expenditure |
| PC | Product capitalization |
| SEM | Scanning electron microscopy |
| AFM | Atomic force microscopy |
References
- Norddahl, B.; Horn, V.G.G.; Larsson, M.; Du Preez, J.H.H.; Christensen, K. A membrane contactor for ammonia stripping, pilot scale experience and modeling. Desalination 2006, 199, 172–174. [Google Scholar] [CrossRef]
- Darestani, M.; Haigh, V.; Couperthwaite, S.J.; Millar, G.J.; Nghiem, L.D. Hollow fibre membrane contactors for ammonia recovery: Current status and future developments. J. Environ. Chem. Eng. 2017, 5, 1349–1359. [Google Scholar] [CrossRef] [Green Version]
- MITTAL, G.S. Treatment of wastewater from abattoirs before land application—A review. Bioresour. Technol. 2006, 97, 1119–1135. [Google Scholar] [CrossRef] [PubMed]
- Franke-Whittle, I.H.; Insam, H. Treatment alternatives of slaughterhouse wastes, and their effect on the inactivation of different pathogens: A review. Crit. Rev. Microbiol. 2013, 39, 139–151. [Google Scholar] [CrossRef] [Green Version]
- Bureau, D.P. All about the Animal by-Products Industry, Essential Rendering; National Renders Association: Alexandria, VA, USA, 2006; ISBN 0965466035. [Google Scholar]
- Kartohardjono, S.; Iwan Fermi, M.; Yuliusman, Y.; Elkardiana, K.; Putra Sangaji, A.; Maghfirwan Ramadhan, A. The Removal of Dissolved Ammonia from Wastewater through a Polypropylene Hollow Fiber Membrane Contactor. Int. J. Technol. 2015, 6, 1146. [Google Scholar] [CrossRef]
- Rezakazemi, M.; Shirazian, S.; Ashrafizadeh, S.N. Simulation of ammonia removal from industrial wastewater streams by means of a hollow-fiber membrane contactor. Desalination 2012, 285, 383–392. [Google Scholar] [CrossRef] [Green Version]
- Mandowara, A.; Bhattacharya, P.K. Simulation studies of ammonia removal from water in a membrane contactor under liquid–liquid extraction mode. J. Environ. Manag. 2011, 92, 121–130. [Google Scholar] [CrossRef] [PubMed]
- Parliament, E. Directive 2000/60/EC of the European Parliament and of the Council of 23 October 2000 establishing a framework for Community action in the field of water policy. Off. J. Eur. Union 2000, 7, 1–51. [Google Scholar]
- Luo, X.; Yan, Q.; Wang, C.; Luo, C.; Zhou, N.; Jian, C. Treatment of Ammonia Nitrogen Wastewater in Low Concentration by Two-Stage Ozonization. Int. J. Environ. Res. Public Health 2015, 12, 11975–11987. [Google Scholar] [CrossRef]
- Ashrafizadeh, S.N.; Khorasani, Z. Ammonia removal from aqueous solutions using hollow-fiber membrane contactors. Chem. Eng. J. 2010, 162, 242–249. [Google Scholar] [CrossRef]
- Tan, X.; Tan, S.P.; Teo, W.K.; Li, K. Polyvinylidene fluoride (PVDF) hollow fibre membranes for ammonia removal from water. J. Memb. Sci. 2006, 271, 59–68. [Google Scholar] [CrossRef]
- Ulbricht, M.; Schneider, J.; Stasiak, M.; Sengupta, A. Ammonia Recovery from Industrial Wastewater by TransMembraneChemiSorption. Chem. Ing. Tech. 2013, 85, 1259–1262. [Google Scholar] [CrossRef]
- Guillen-Burrieza, E.; Mavukkandy, M.O.; Bilad, M.R.; Arafat, H.A. Understanding wetting phenomena in membrane distillation and how operational parameters can affect it. J. Memb. Sci. 2016, 515, 163–174. [Google Scholar] [CrossRef]
- Xie, M.; Shon, H.K.; Gray, S.R.; Elimelech, M. Membrane-based processes for wastewater nutrient recovery: Technology, challenges, and future direction. Water Res. 2016, 89, 210–221. [Google Scholar] [CrossRef] [PubMed] [Green Version]
- Mosadegh-Sedghi, S.; Rodrigue, D.; Brisson, J.; Iliuta, M.C. Wetting Phenomenon in Membrane Contactors—Causes and Prevention; Elsevier: Amsterdam, The Netherlands, 2014; Volume 452, pp. 332–353. [Google Scholar]
- Gugliuzza, A. Membrane Wettability. In Encyclopedia of Membranes; Springer: Berlin/Heidelberg, Germany, 2015; pp. 1–4. [Google Scholar]
- Rezaei, M.; Warsinger, D.M.; Lienhard, J.H.; Duke, M.C.; Matsuura, T.; Samhaber, W.M. Wetting phenomena in membrane distillation: Mechanisms, reversal, and prevention. Water Res. 2018, 139, 329–352. [Google Scholar] [CrossRef] [PubMed]
- Dindore, V.Y.; Brilman, D.W.F.; Geuzebroek, F.H.; Versteeg, G.F. Membrane-solvent selection for CO2 removal using membrane gas-liquid contactors. Sep. Purif. Technol. 2004, 40, 133–145. [Google Scholar] [CrossRef] [Green Version]
- Bougie, F.; Iliuta, M.C. CO2 Absorption into Mixed Aqueous Solutions of 2-Amino-2-hydroxymethyl-1,3-propanediol and Piperazine. Ind. Eng. Chem. Res. 2010, 49, 1150–1159. [Google Scholar] [CrossRef]
- Shirazi, M.M.A.; Bastani, D.; Kargari, A.; Tabatabaei, M. Characterization of polymeric membranes for membrane distillation using atomic force microscopy. Desalin. Water Treat. 2013, 51, 6003–6008. [Google Scholar] [CrossRef]
- Eykens, L.; De Sitter, K.; Dotremont, C.; Pinoy, L.; Van der Bruggen, B. Characterization and performance evaluation of commercially available hydrophobic membranes for direct contact membrane distillation. Desalination 2016, 392, 63–73. [Google Scholar] [CrossRef]
- Moradihamedani, P.; Abdullah, A.H. Ammonia removal from aquaculture wastewater by high flux and high rejection polysulfone/cellulose acetate blend membrane. Polym. Bull. 2018, 76, 2481–2497. [Google Scholar] [CrossRef]
- Vrijenhoek, E.M.; Hong, S.; Elimelech, M. Influence of membrane surface properties on initial rate of colloidal fouling of reverse osmosis and nanofiltration membranes. J. Memb. Sci. 2001, 188, 115–128. [Google Scholar] [CrossRef]
- Vecino, X.; Reig, M.; Bhushan, B.; Gibert, O.; Valderrama, C.; Cortina, J.L. Liquid fertilizer production by ammonia recovery from treated ammonia-rich regenerated streams using liquid-liquid membrane contactors. Chem. Eng. J. 2019, 360, 890–899. [Google Scholar] [CrossRef]
- Zheng, R.; Chen, Y.; Wang, J.; Song, J.; Li, X.M.; He, T. Preparation of omniphobic PVDF membrane with hierarchical structure for treating saline oily wastewater using direct contact membrane distillation. J. Memb. Sci. 2018, 555, 197–205. [Google Scholar] [CrossRef]
- Liao, Y.; Wang, R.; Fane, A.G. Fabrication of Bioinspired Composite Nanofiber Membranes with Robust Superhydrophobicity for Direct Contact Membrane Distillation. Environ. Sci. Technol. 2014, 48, 6341. [Google Scholar] [CrossRef] [PubMed]
- Chen, Y.; Tian, M.; Li, X.; Wang, Y.; An, A.K.; Fang, J.; He, T. Anti-wetting behavior of negatively charged superhydrophobic PVDF membranes in direct contact membrane distillation of emulsified wastewaters. J. Memb. Sci. 2017, 535, 230–238. [Google Scholar] [CrossRef]
- Gasser, J.K.R. Some factors affecting losses of ammonia from urea and ammonium sulphate applied to soils. J. Soil Sci. 1964, 15, 258–272. [Google Scholar] [CrossRef]
- International Commission of Agricultural Engineering (CIGR); Harms, H.H.; Lang, T. Injection of Liquids into the Soil with a High-Pressure Jet; International Commission of Agricultural Engineering: Liège, Belgium, 1999; Volume 13. [Google Scholar]
- Deppe, M.; Well, R.; Kücke, M.; Fuß, R.; Giesemann, A.; Flessa, H. Impact of CULTAN fertilization with ammonium sulfate on field emissions of nitrous oxide. Agric. Ecosyst. Environ. 2016, 219, 138–151. [Google Scholar] [CrossRef]
- Smolders, K.; Franken, A.C.M. Terminology for Membrane Distillation. Desalination 1989, 72, 249–262. [Google Scholar] [CrossRef] [Green Version]


| Matrix | PP | PTFE |
|---|---|---|
| DI water | 115.7° ± 2.3° | 123.1° ± 2.4° |
| RCWW | 92.2° ± 3.4° | 99.4° ± 3.1° |
| RCWW with no FOG | 107.3° ± 1.3° | 111° ± 2.6° |
| Time (min) | 0 | 15 | 30 | 45 | 60 | 120 |
|---|---|---|---|---|---|---|
| PP (Bar) | > 2 | 0.57 ± 0.12 | - | - | - | - |
| PTFE (Bar) | > 2 | > 2 | 1.67 ± 0.06 | 1.07 ± 0.06 | 0.7 ± 0.1 | 0.07 ± 0.01 |
| Time (min) | PP RMS Roughness (nm) | PTFE RMS Roughness (nm) |
|---|---|---|
| 0 | 154.64 | 249.23 |
| 15 | 134.48 | 164.4 |
| 30 | 132.86 | - |
| 45 | 511.33 * | 131.61 |
| 60 | 118.92 | 120.42 |
| 120 | 962.2 * | 114.87 |
| 180 | 113.66 | 109.74 |
| 240 | 255.98 * | 94.98 |
| 300 | 109.49 | 556.12 * |
| 360 | 86.71 | 85.57 |
| Time (min) | PTFE | PP | ||||
|---|---|---|---|---|---|---|
| Porosity (%) | Pore Size (µm) | Fibre Diameter (µm) | Porosity (%) | Pore Size (µm) | Fibre Diameter (µm) | |
| 0 | 50 ± 1 | 0.39 ± 0.1 | 23.2 ± 2.9 | 86 ± 3 | 0.43 ± 0.1 | 12.1 ± 1.8 |
| 15 | - | - | - | - | 0.41 ± 0.17 | 9.1 ± 1.4 |
| 60 | 49 ± 1 | - | - | 83 ± 1 | - | - |
| 120 | - | 0.3 ± 0.07 | 17 ± 3.6 | - | - | - |
| Reagent | Run 1 (mL) | Run 2 (mL) | Run 3 (mL) | Average (mL) | St. Dev (mL) |
|---|---|---|---|---|---|
| 111 g/L NaOH | 280.00 | 220.00 | 200.00 | 233.33 | 41.63 |
| 15 g/L NaHCO3 | 3520.00 | 6300.00 | 4860.00 | 4893.33 | 1390.30 |
| 9.6 g/L CaCO3 | 690.00 | 865.00 | No change | 777.50 | 123.74 |
| RCWW | No change | No change | No change | - | - |
| Sludge | 540.00 | No change | No change | 540.00 | 0.00 |
| (NH3) Removal Using Membrane Technology (70% Efficiency) | Current Treatment | ||||
|---|---|---|---|---|---|
| CAPEX | €300,000 (full scale) + €36,000 (membranes) | €500,000 (Aeration tank + diffusers, blowers) | |||
| OPEX | (€/kg N) | (€/kg N) | |||
| NaOH | H2SO4 | Energy a | Energy | Bio- augmentation | |
| 1.54 | 0.71 | 0.26 | 1.065 | 0.645 | |
| Maintenance costs (pre-filters) | Maintenance cost | ||||
| 0.0012 | ND | ||||
| OPEX total | 2.48 | 1.71 | |||
| OPEX—PC | 0.94 | 1.71 | |||
| Product capitalization (PC) | (NH4)2SO4 (30%) (w/w) | NA | |||
| 1.54 | |||||
| Membrane 1 | Membrane 2 | |
|---|---|---|
| Membrane material | PTFE | PP |
| Configuration (type) | Spiral wound | Spiral wound |
| Surface area (m2) | 6.7 | 3.7 |
| Flow feed side (m3/h) | 0.05–0.7 | 0.05–1 |
| Flow acid side (m3/h) | 0.05–0.7 | 0.05–0.5 |
| Pressure max (bar) | 0.6 | 0.5 |
| Temperature max (°C) | 45 | 50 |
© 2020 by the authors. Licensee MDPI, Basel, Switzerland. This article is an open access article distributed under the terms and conditions of the Creative Commons Attribution (CC BY) license (http://creativecommons.org/licenses/by/4.0/).
Share and Cite
Brennan, B.; Briciu-Burghina, C.; Hickey, S.; Abadie, T.; al Ma Awali, S.M.; Delaure, Y.; Durkan, J.; Holland, L.; Quilty, B.; Tajparast, M.; et al. Pilot Scale Study: First Demonstration of Hydrophobic Membranes for the Removal of Ammonia Molecules from Rendering Condensate Wastewater. Int. J. Mol. Sci. 2020, 21, 3914. https://doi.org/10.3390/ijms21113914
Brennan B, Briciu-Burghina C, Hickey S, Abadie T, al Ma Awali SM, Delaure Y, Durkan J, Holland L, Quilty B, Tajparast M, et al. Pilot Scale Study: First Demonstration of Hydrophobic Membranes for the Removal of Ammonia Molecules from Rendering Condensate Wastewater. International Journal of Molecular Sciences. 2020; 21(11):3914. https://doi.org/10.3390/ijms21113914
Chicago/Turabian StyleBrennan, Brian, Ciprian Briciu-Burghina, Sean Hickey, Thomas Abadie, Sultan M. al Ma Awali, Yan Delaure, John Durkan, Linda Holland, Brid Quilty, Mohammad Tajparast, and et al. 2020. "Pilot Scale Study: First Demonstration of Hydrophobic Membranes for the Removal of Ammonia Molecules from Rendering Condensate Wastewater" International Journal of Molecular Sciences 21, no. 11: 3914. https://doi.org/10.3390/ijms21113914