


Ultrasound-Assisted Extraction of Paeonol from Moutan Cortex: Purification and Component Identification of Extract
 , ,
, ,
Abstract
: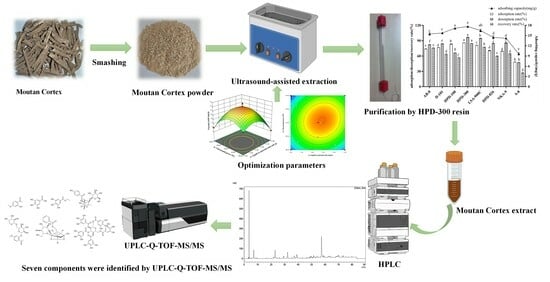
1. Introduction
2. Results and Discussion
2.1. Extraction of Paeonol from MC
2.1.1. Effects of the Various Factors on the Extraction Yield of the Paeonol
2.1.2. Response Model Establishment and the Variance Analysis
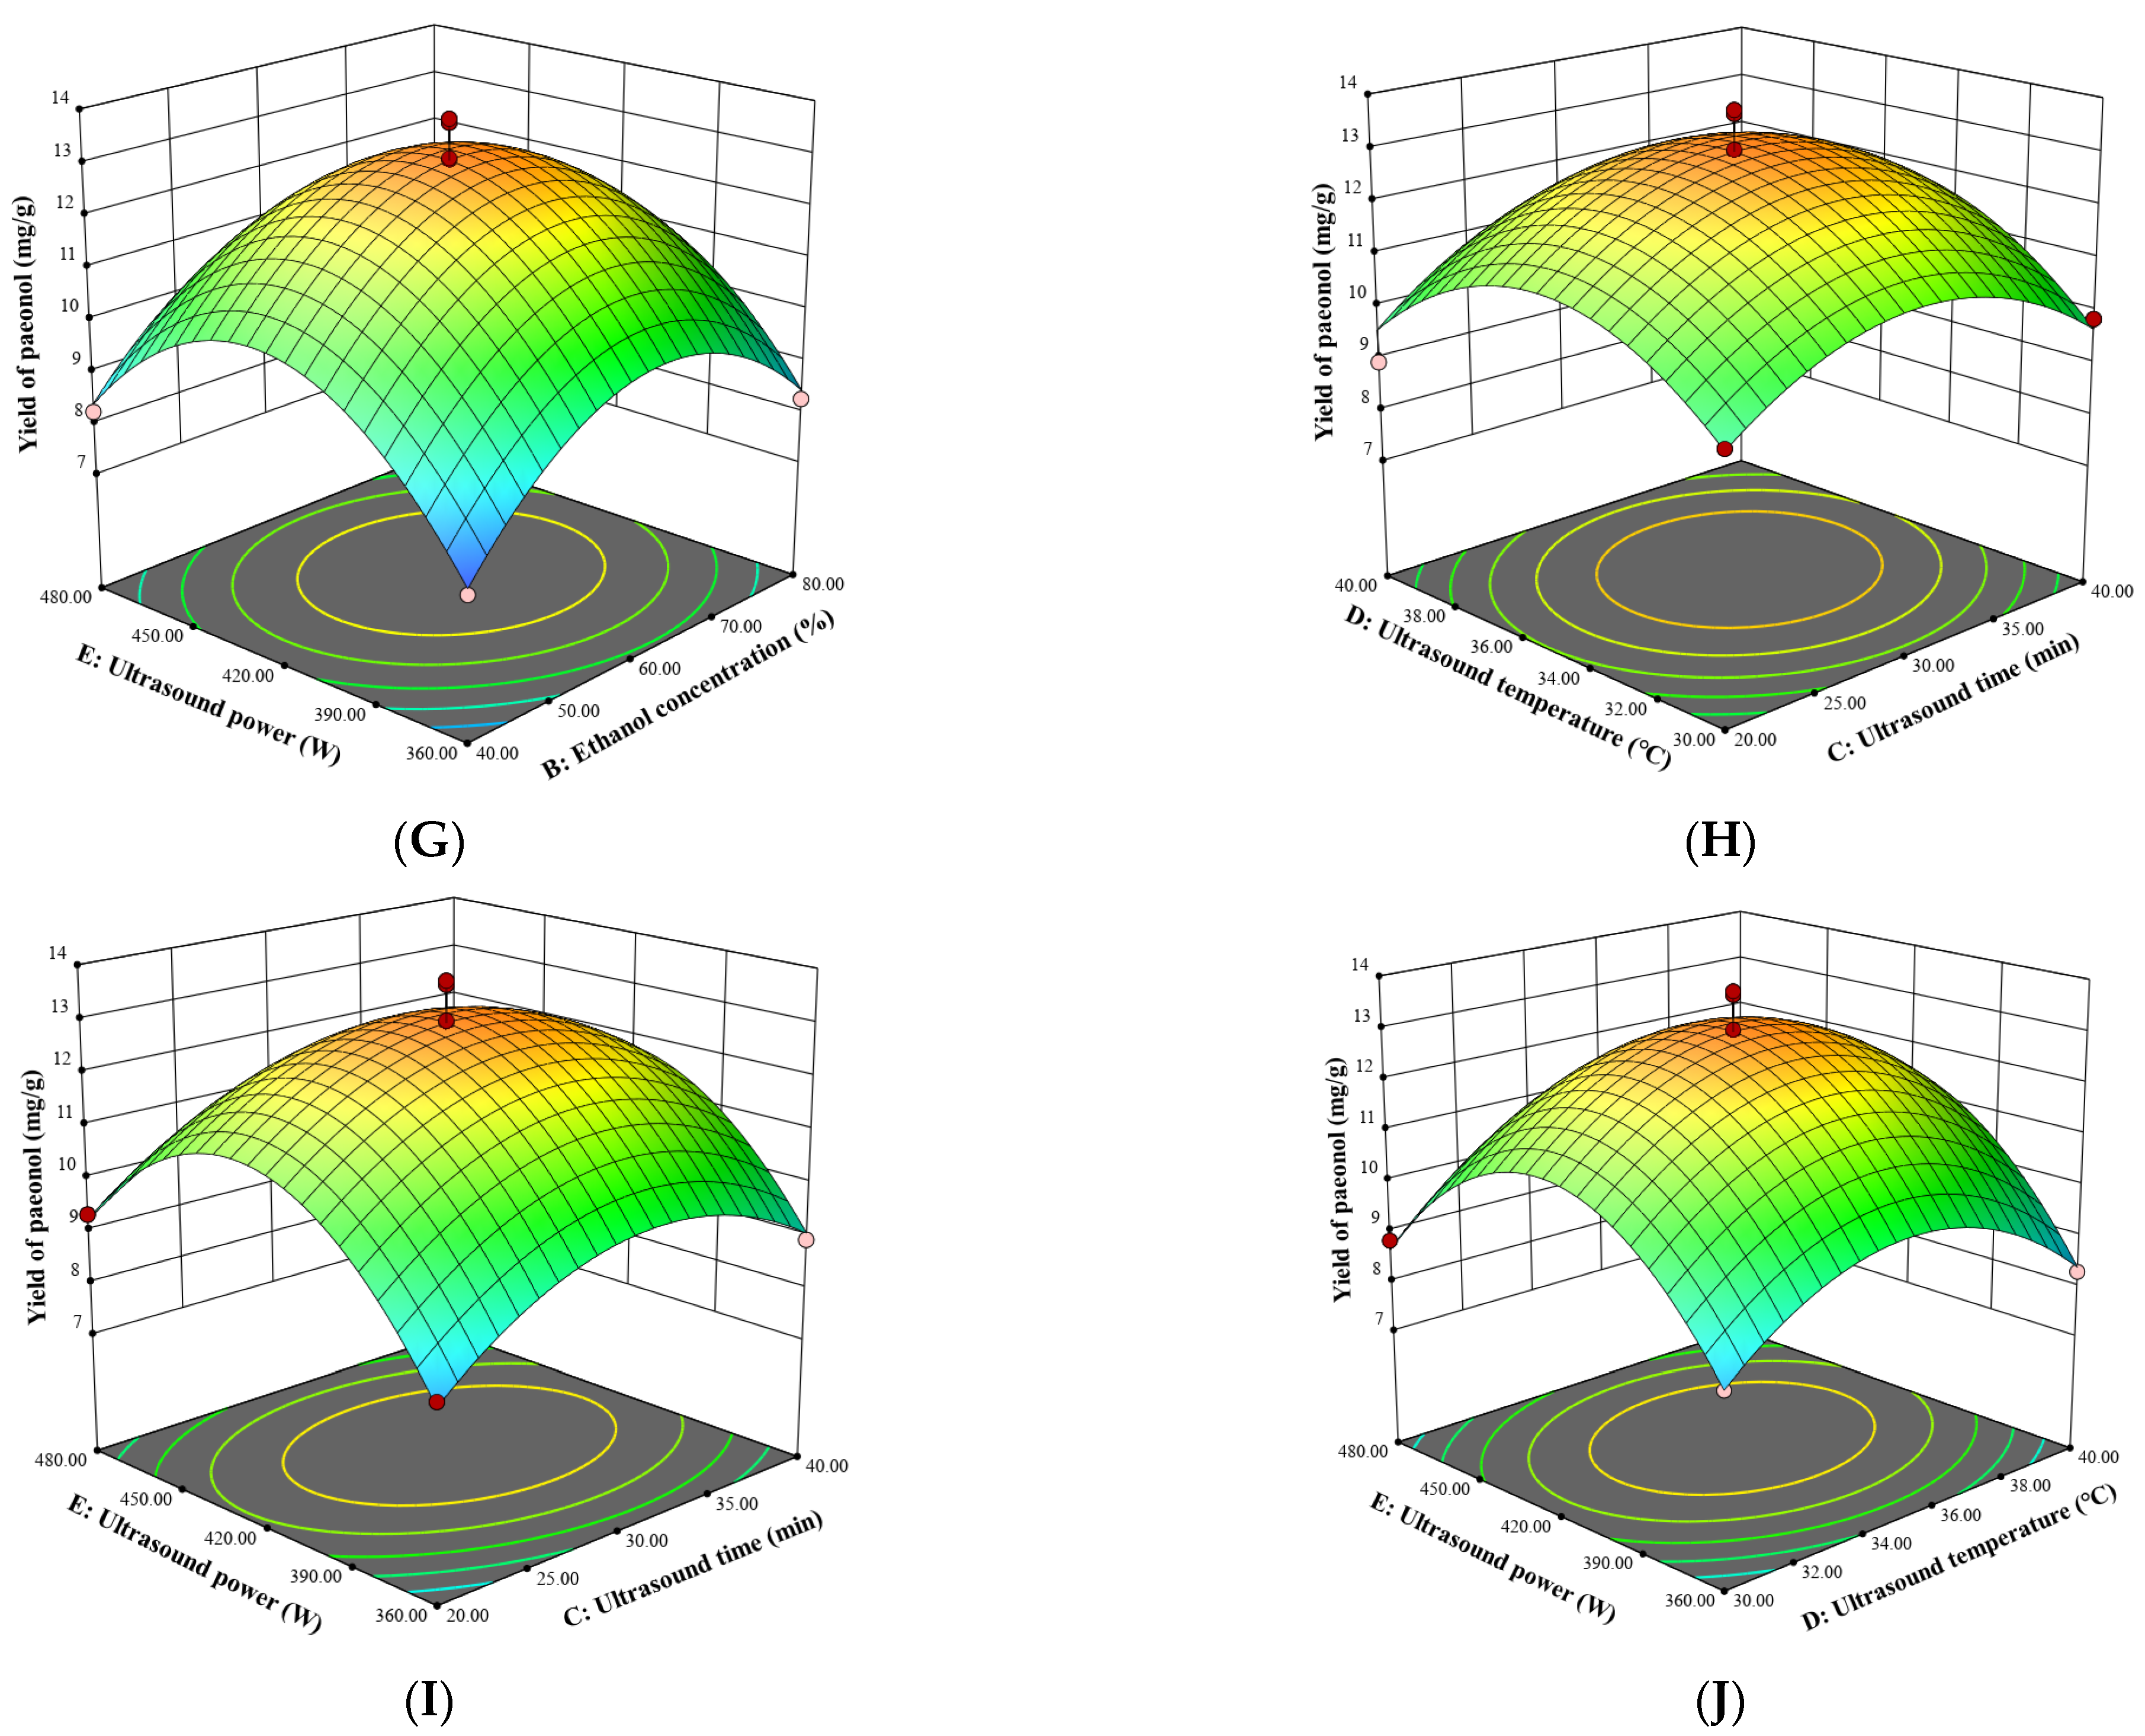
2.1.3. Response Surface Analysis
2.1.4. Optimal Conditions and Model Validation
2.2. Purification of Paeonol from MC by Macroporous Resin Adsorption
2.2.1. Screening of Macroporous Resins
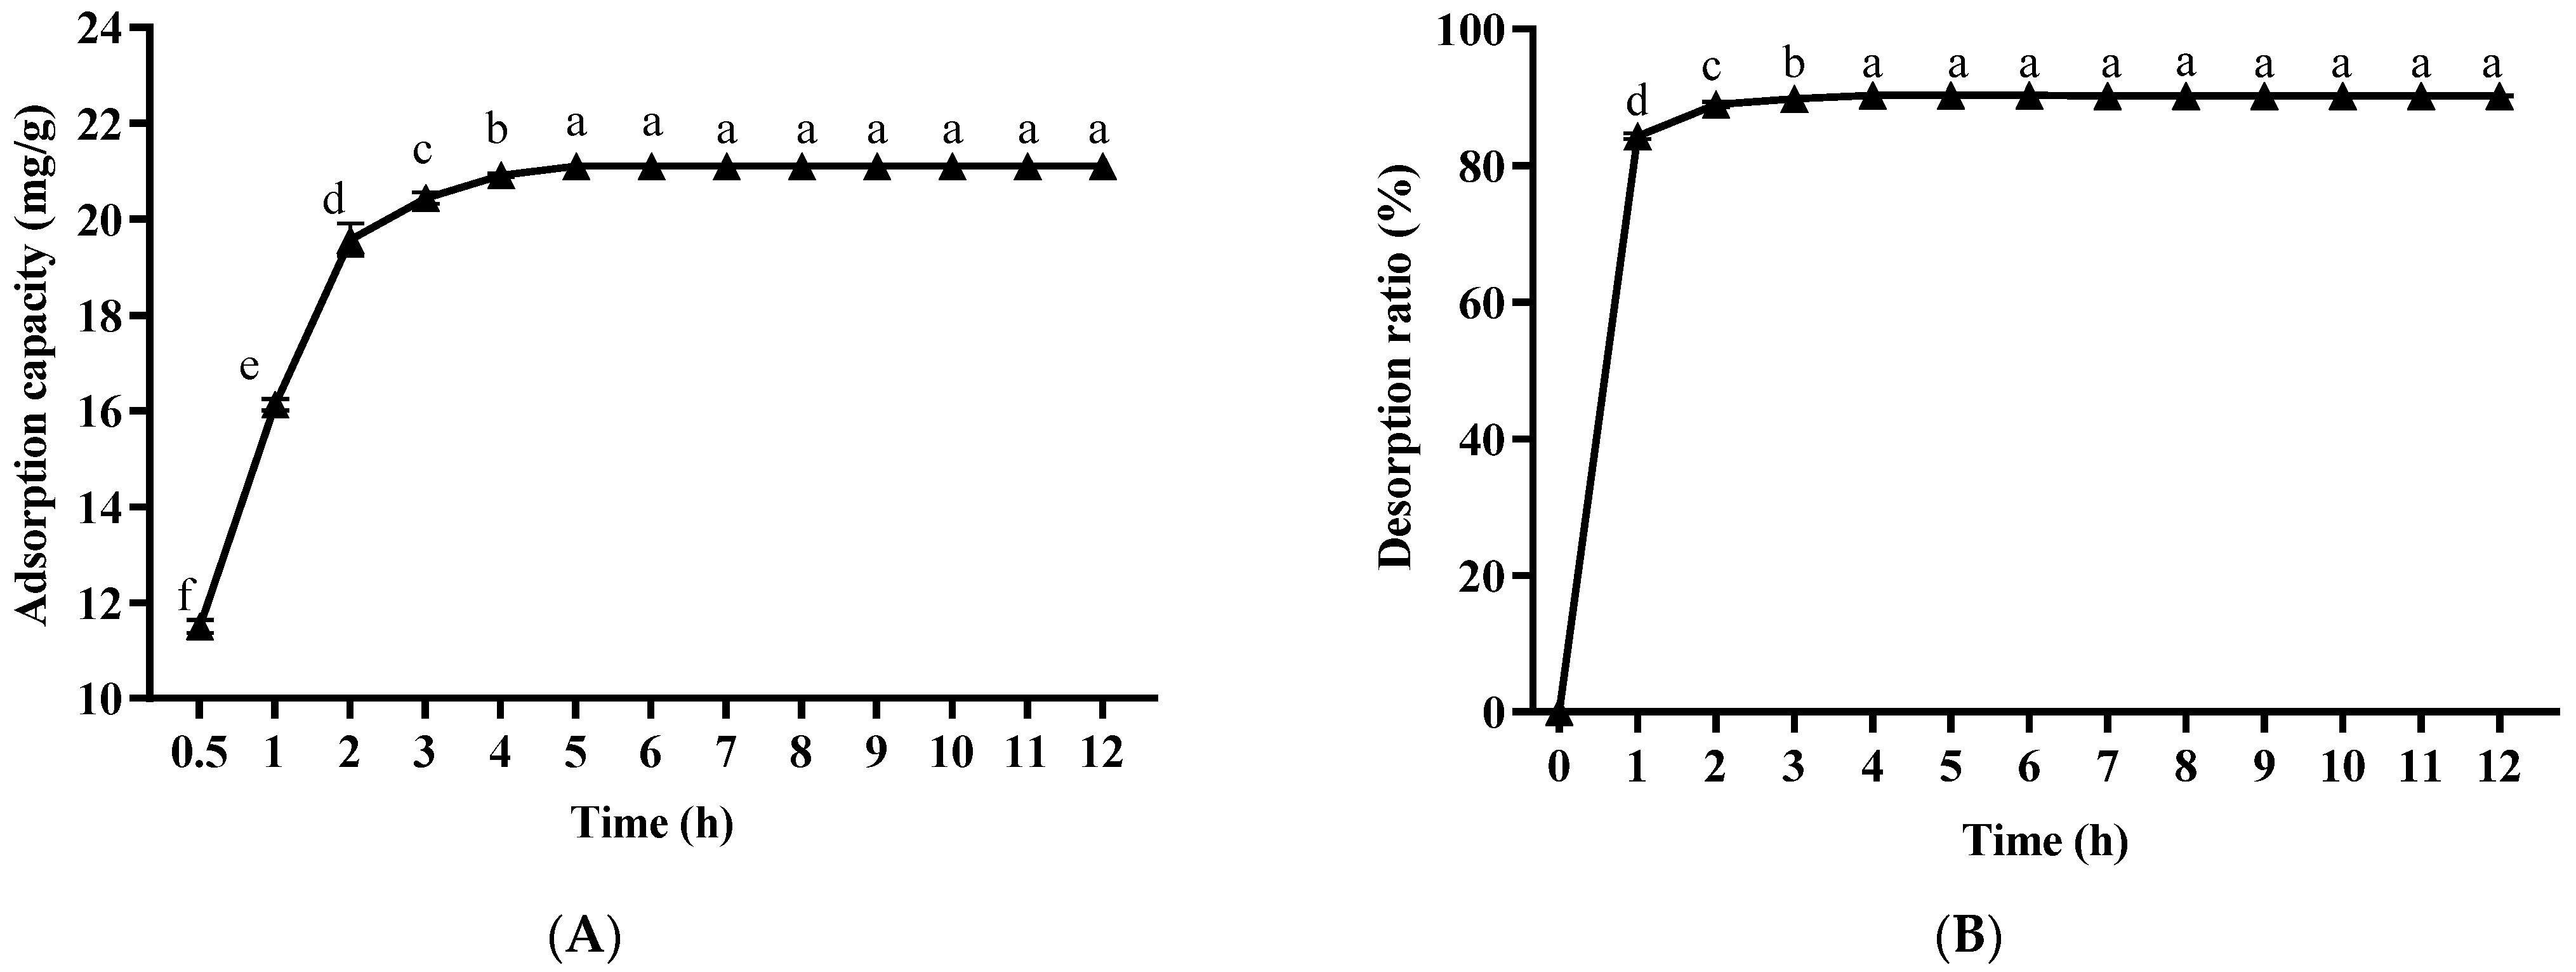
2.2.2. Static Adsorption and Desorption Tests
2.2.3. Dynamic Adsorption and Desorption Tests
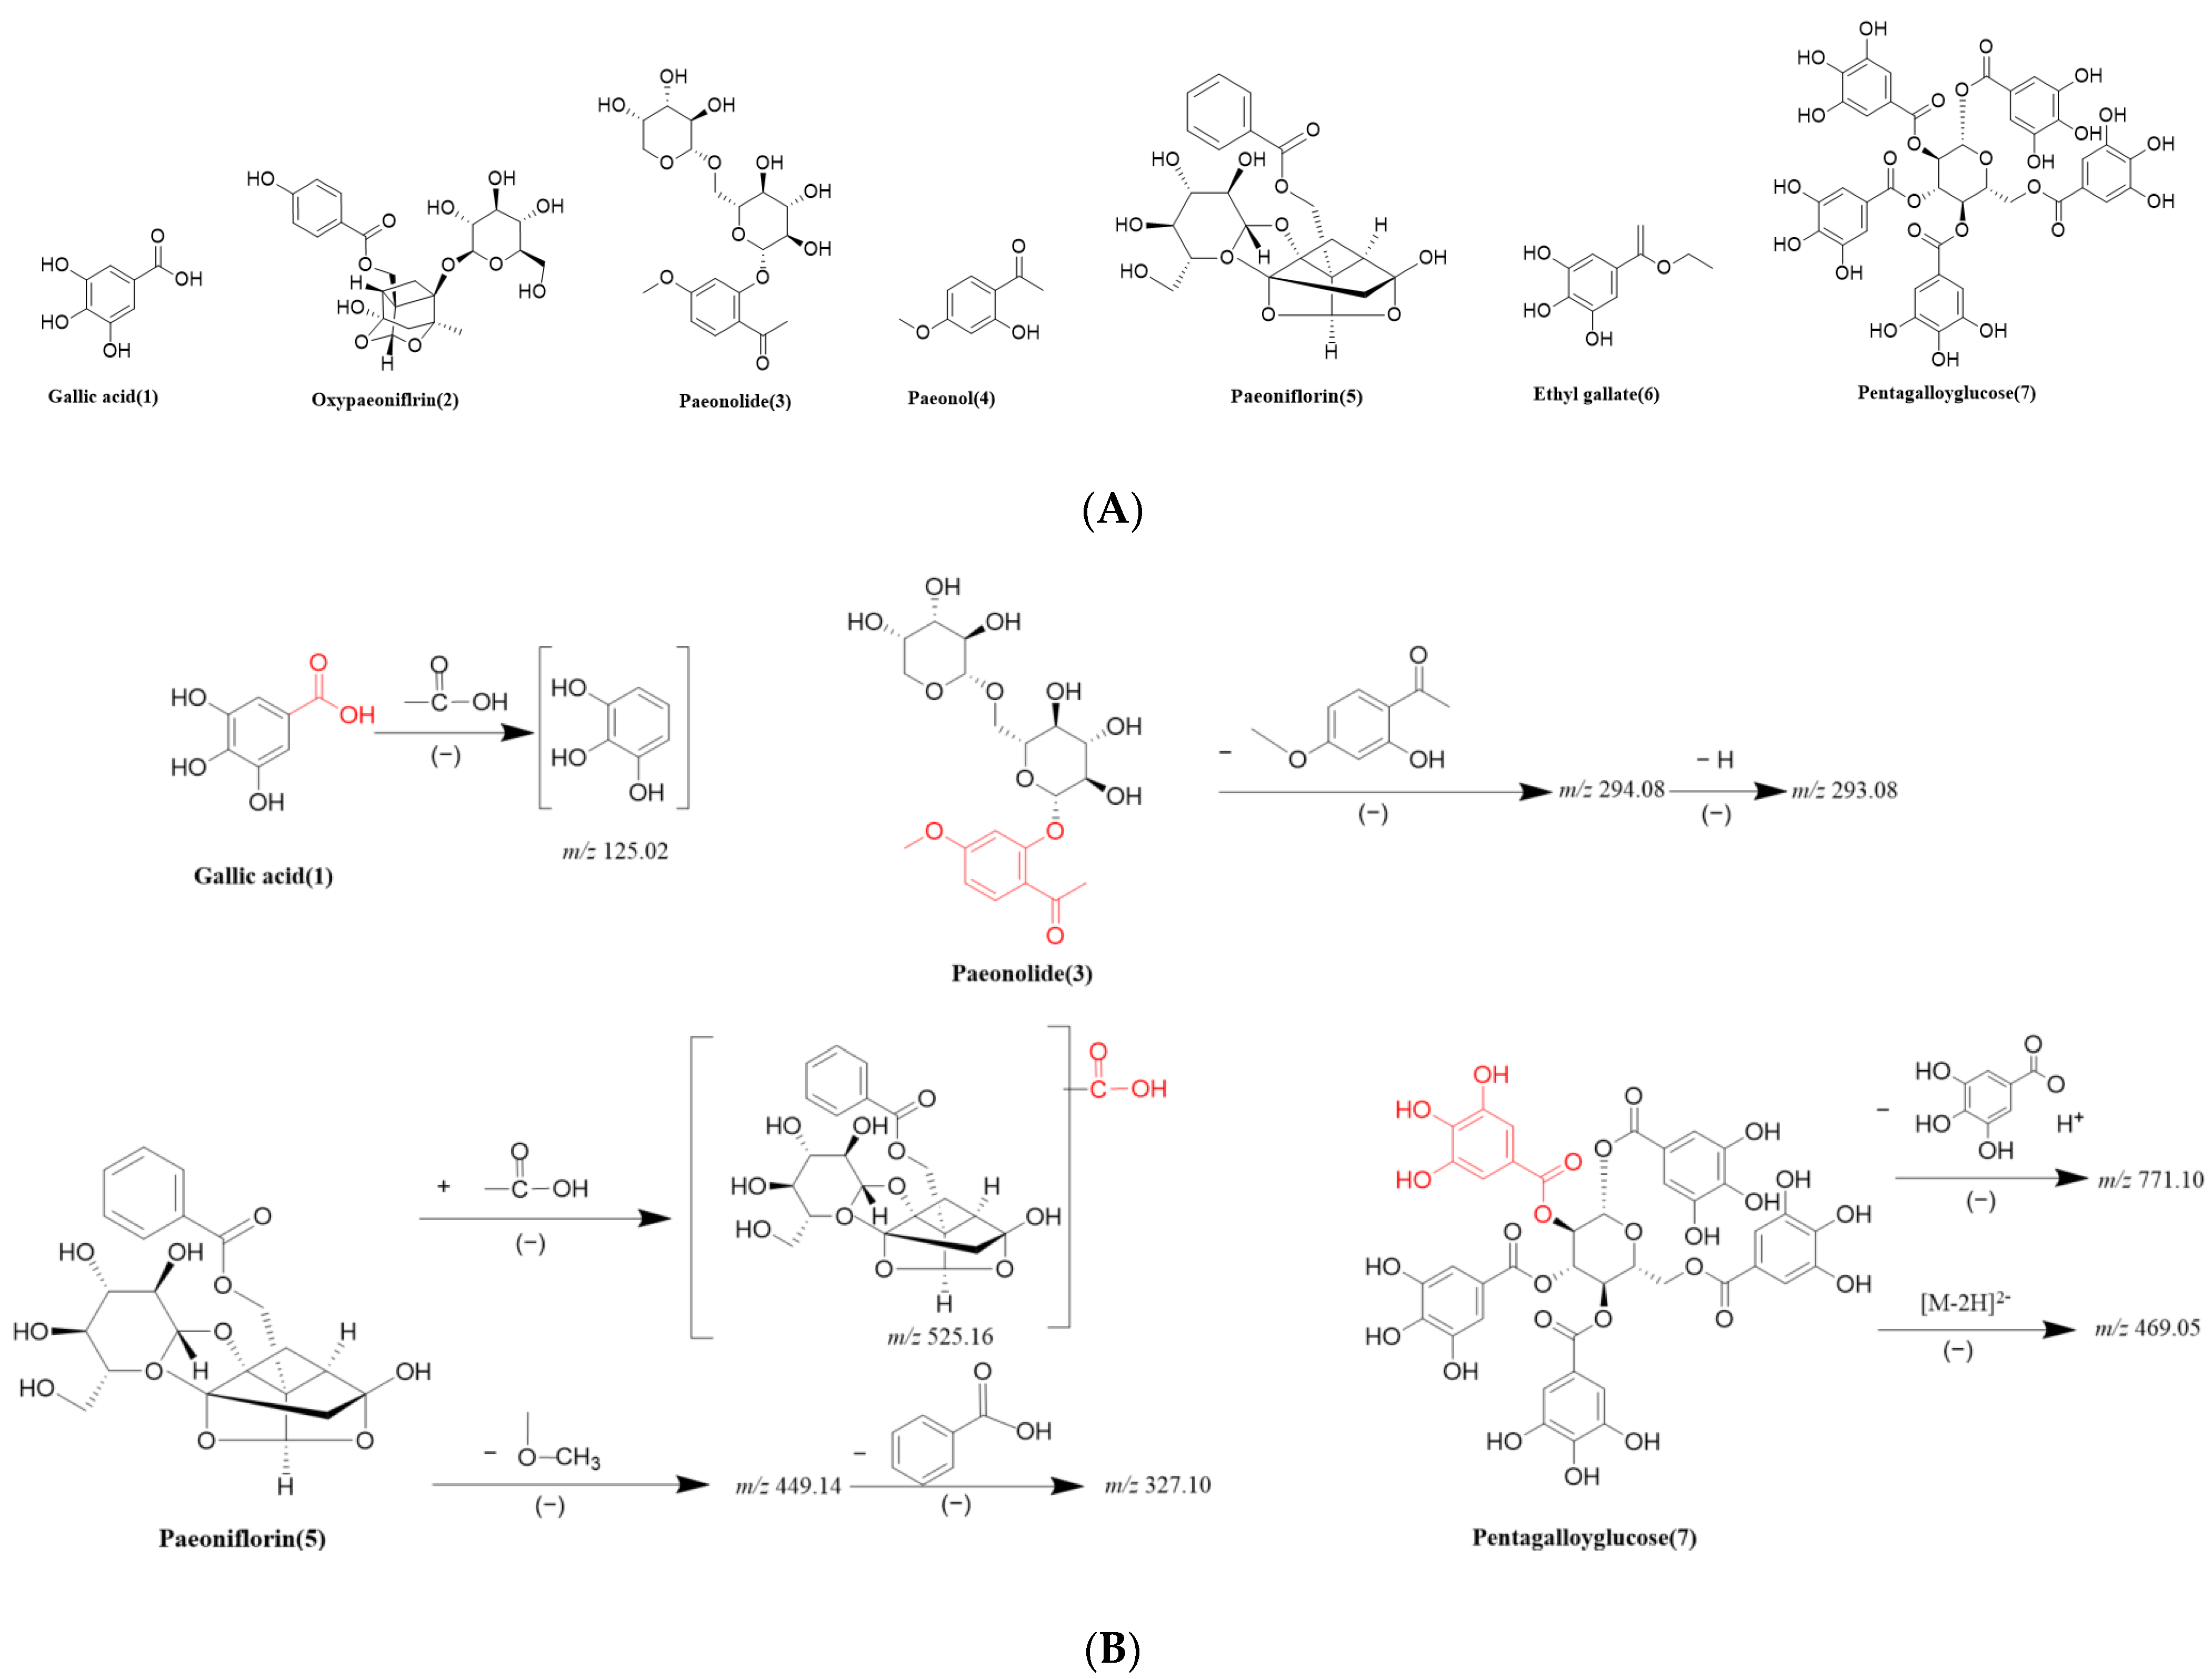
2.3. Compositional Analysis of MC Extract
3. Materials and Methods
3.1. Reagents and Materials
3.2. Determination of Paeonol from MC
3.2.1. Conditions of HPLC
3.2.2. Plotting of Standard Curves
3.3. Extraction Process of Paeonol from MC
3.3.1. Single-Factor Experiments
3.3.2. Box–Behnken Design
3.4. Purification Process of Paeonol from MC
3.4.1. Pretreatment of Macroporous Resin
3.4.2. Screening of Macroporous Resins
3.4.3. Static Adsorption and Desorption Tests
3.4.4. Dynamic Adsorption and Desorption Tests
3.5. Identification of MC Extract
3.5.1. Preparation of Sample Solution
3.5.2. Conditions of UPLC-Q-TOF-MS/MS
3.6. Statistical Analysis
4. Conclusions
Supplementary Materials
Author Contributions
Funding
Institutional Review Board Statement
Informed Consent Statement
Data Availability Statement
Conflicts of Interest
References
- Ekiert, H.; Klimek-Szczykutowicz, M.; Szopa, A. Paeonia × suffruticosa (Moutan Peony)—A Review of the Chemical Composition, Traditional and Professional Use in Medicine, Position in Cosmetics Industries, and Biotechnological Studies. Plants 2022, 11, 3379–3403. [Google Scholar] [CrossRef] [PubMed]
- Li, J.; Wang, Y.; Yang, H.; Yu, P.; Tang, Y. Five heavy metals accumulation and health risk in a traditional Chinese medicine Cortex Moutan collected from different sites in China. Hum. Ecol. Risk Assess. Int. J. 2018, 24, 2288–2298. [Google Scholar] [CrossRef]
- Sun, Z.; Du, J.; Hwang, E.; Yi, T.-H. Paeonol extracted from Paeonia suffruticosa Andr. ameliorated UVB-induced skin photoaging via DLD/Nrf2/ARE and MAPK/AP-1 pathway. Phytother. Res. 2018, 32, 1741–1749. [Google Scholar] [CrossRef] [PubMed]
- Chang-Kil, Y.; Ji-Hyun, H.; Kippeum, L.; Young-Jin, L.; Kui-Jin, K.; Boo-Yong, L. Anti-inflammatory Effects of Moutan Cortex Radicis Extract, Paeoniflorin and Oxypaeoniflorin through TLR Signaling Pathway in RAW264.7 Cells. J. Food Nutr. Res. 2018, 6, 26–31. [Google Scholar]
- Liu, J.; Li, X.; Bai, H.; Yang, X.; Mu, J.; Yan, R.; Wang, S. Traditional uses, phytochemistry, pharmacology, and pharmacokinetics of the root bark of Paeonia x suffruticosa andrews: A comprehensive review. J. Ethnopharmacol. 2023, 308, 116279–116328. [Google Scholar] [CrossRef] [PubMed]
- Jiao, J.; Sun, L.; Guo, Z.; Hou, S.; Holyst, R.; Lu, Y.; Feng, X. Antibacterial and anticancer PDMS surface for mammalian cell growth using the Chinese herb extract paeonol (4-methoxy-2-hydroxyacetophenone). Sci. Rep. 2016, 6, 38973–38983. [Google Scholar] [CrossRef] [PubMed]
- Lian, Y.; Zhu, M.; Chen, J.; Yang, B.; Lv, Q.; Wang, L.; Guo, S.; Tan, X.; Li, C.; Bu, W.; et al. Characterization of a novel polysaccharide from Moutan Cortex and its ameliorative effect on AGEs-induced diabetic nephropathy. Int. J. Biol. Macromol. 2021, 176, 589–600. [Google Scholar] [CrossRef]
- Wang, Z.; He, C.; Peng, Y.; Chen, F.; Xiao, P. Origins, Phytochemistry, Pharmacology, Analytical Methods and Safety of Cortex Moutan (Paeonia suffruticosa Andrew): A Systematic Review. Molecules 2017, 22, 946–972. [Google Scholar] [CrossRef]
- Tang, H.; Yang, D.; Zhu, L.; Shi, F.; Ye, G.; Guo, H.; Deng, H.; Zhao, L.; Xu, Z.; Li, Y. Paeonol interferes with quorum-sensing in pseudomonas aeruginosa and modulates inflammatory responses in vitro and in vivo. Front. Immunol. 2022, 13, 896874–896887. [Google Scholar] [CrossRef]
- Gu, Y.; Chen, K.; Xi, B.; Xie, J.; Bing, X. Protective effects of paeonol against lipopolysaccharide-induced liver oxidative stress and inflammation in gibel carp (Carassius auratus gibelio). Comp. Biochem. Physiol. Part C Toxicol. Pharmacol. 2022, 257, 109339–109347. [Google Scholar] [CrossRef]
- Chen, X.; Xu, Z.; Lu, M.; Ding, W.; Zhong, J.; Deng, S.; Li, S.; Miao, J.; Liu, X.; Wen, Q.; et al. Paeonol inhibits melanoma growth by targeting PD1 through upregulation of miR-139-5p. Biochem. Biophys. Res. Commun. 2023, 656, 86–96. [Google Scholar] [CrossRef] [PubMed]
- Zhang, L.; Li, D.C.; Liu, L.F. Paeonol: Pharmacological effects and mechanisms of action. Int. Immunopharmacol. 2019, 72, 413–421. [Google Scholar] [CrossRef]
- Ramazi, S.; Fahanik-Babaei, J.; Mohamadi-Zarch, S.-M.; Baluchnejadmojarad, T.; Roghani, M. Paeonol exerts neuroprotective and anticonvulsant effects in intrahippocampal kainate model of temporal lobe epilepsy. J. Chem. Neuroanat. 2022, 124, 102121–102127. [Google Scholar] [CrossRef] [PubMed]
- Zhang, L.; Chen, Z.; Gong, W.; Zou, Y.; Xu, F.; Chen, L.; Huang, H. Paeonol Ameliorates Diabetic Renal Fibrosis Through Promoting the Activation of the Nrf2/ARE Pathway via Up-Regulating Sirt1. Front. Pharmacol. 2018, 9, 512–526. [Google Scholar] [CrossRef] [PubMed]
- Wang, S.; Xie, L.; Yang, Q.; Geng, Y.; Kang, H.; Zhao, X. Extraction and purification of paeonol from Moutan Cortex by a combined method of steam distillation and antisolvent recrystallization to reduce energy consumption and carbon dioxide emissions. Can. J. Chem. Eng. 2022, 101, 3771–3785. [Google Scholar] [CrossRef]
- Song, W.; Cai, H.; Du, L.; Zhao, Q.; Chen, H.; Li, G.; Wang, H.; Xu, Y.; Ding, L.; Ren, N. Fast Determination of Paeonol from Cortex moutan by Microwave-Assisted Steam Extraction Followed by HPLC. Chromatographia 2012, 75, 747–753. [Google Scholar] [CrossRef]
- Ray, A.; Dubey, K.K.; Marathe, S.J.; Singhal, R. Supercritical fluid extraction of bioactives from fruit waste and its therapeutic potential. Food Biosci. 2023, 52, 102132–102418. [Google Scholar] [CrossRef]
- Fang, X.; Gu, S.; Jin, Z.; Hao, M.; Yin, Z.; Wang, J. Optimization of Ultrasonic-Assisted Simultaneous Extraction of Three Active Compounds from the Fruits of Forsythia suspensa and Comparison with Conventional Extraction Methods. Molecules 2018, 23, 2115–2132. [Google Scholar] [CrossRef]
- Hu, Y.; Yang, L.; Liang, Z.; Chen, J.; Zhao, M.; Tang, Q. Comparative analysis of flavonoids extracted from Dendrobium chrysotoxum flowers by supercritical fluid extraction and ultrasonic cold extraction. Sustain. Chem. Pharm. 2023, 36, 101267–101283. [Google Scholar] [CrossRef]
- Anaya-Esparza, L.M.; Ramos-Aguirre, D.; Zamora-Gasga, V.M.; Yahia, E.; Montalvo-González, E. Optimization of ultrasonic-assisted extraction of phenolic compounds from Justicia spicigera leaves. Food Sci. Biotechnol. 2018, 27, 1093–1102. [Google Scholar] [CrossRef]
- Cao, Y.; Song, Z.; Dong, C.; Ni, W.; Xin, K.; Yu, Q.; Han, L. Green ultrasound-assisted natural deep eutectic solvent extraction of phenolic compounds from waste broccoli leaves: Optimization, identification, biological activity, and structural characterization. LWT 2023, 190, 115407–115419. [Google Scholar] [CrossRef]
- Frohlich, P.C.; Santos, K.A.; Ascari, J.; Santos Refati, J.R.d.; Palú, F.; Cardozo-Filho, L.; da Silva, E.A. Antioxidant compounds and eugenol quantification of clove (Syzygium aromaticum) leaves extracts obtained by pressurized liquid extraction and supercritical fluid extraction. J. Supercrit. Fluids 2023, 196, 105865–105872. [Google Scholar] [CrossRef]
- Hou, M.; Lin, C.; Ma, Y.; Shi, J.; Liu, J.; Zhu, L.; Bian, Z. One-step enrichment of phenolics from Chaenomeles speciosa (Sweet) Nakai fruit using macroporous resin: Adsorption/desorption characteristics, process optimization and UPLC-QqQ-MS/MS-based quantification. Food Chem. 2023, 439, 138085–138107. [Google Scholar] [CrossRef] [PubMed]
- Gini, T.G.; Jeya Jothi, G. Column chromatography and HPLC analysis of phenolic compounds in the fractions of Salvinia molesta mitchell. Egypt. J. Basic Appl. Sci. 2019, 5, 197–203. [Google Scholar] [CrossRef]
- Sun, S.; Xin, X.; Zhu, L.; Chen, L.; Xu, Z.; Liu, Y. Preparative separation of five polyphenols from the fruits of Sorbus pohuashanensis Hedl. by high-speed counter-current chromatography. J. Chromatogr. B 2021, 1172, 122620–122628. [Google Scholar] [CrossRef] [PubMed]
- Li, H.; Hou, G.; Li, Y.; Zhao, F.; Cong, W.; Wang, C. Preparative separation of phloridzin from apple leaves using macroporous resins followed by preparative high-performance liquid chromatography. J. Sep. Sci. 2018, 41, 3918–3924. [Google Scholar] [CrossRef] [PubMed]
- Sun, Y.; Liu, Z.; Wang, J.; Tian, W.; Zhou, H.; Zhu, L.; Zhang, C. Supercritical fluid extraction of paeonol from Cynanchum paniculatum (Bge.) Kitag. and subsequent isolation by high-speed counter-current chromatography coupled with high-performance liquid chromatography-photodiode array detector. Sep. Purif. Technol. 2008, 64, 221–226. [Google Scholar] [CrossRef]
- Yang, Y.; Wang, Y.; Zeng, W.; Tian, J.; Zhao, X.; Han, J.; Huang, D.; Gu, D. A strategy based on liquid-liquid-refining extraction and high-speed counter-current chromatography for the bioassay-guided separation of active compound from Taraxacum mongolicum. J. Chromatogr. A 2020, 1614, 460727–460733. [Google Scholar] [CrossRef]
- Meng, J.; Li, Q.; Cao, Z.; Gu, D.; Wang, Y.; Zhang, Y.; Wang, Y.; Yang, Y.; He, F. Rapid screening and separation of active compounds against α-amylase from Toona sinensis by ligand fishing and high-speed counter-current chromatography. Int. J. Biol. Macromol. 2021, 174, 270–277. [Google Scholar] [CrossRef]
- Jiang, H.; Li, J.; Chen, L.; Wang, Z. Adsorption and desorption of chlorogenic acid by macroporous adsorbent resins during extraction of Eucommia ulmoides leaves. Ind. Crop. Prod. 2020, 149, 112336–112341. [Google Scholar] [CrossRef]
- Aalim, H.; Belwal, T.; Wang, Y.; Luo, Z.; Hu, J. Purification and identification of rice bran (Oryza sativa L.) phenolic compounds with in-vitro antioxidant and antidiabetic activity using macroporous resins. Int. J. Food Sci. Technol. 2018, 54, 715–722. [Google Scholar] [CrossRef]
- Shen, D.; Labreche, F.; Wu, C.; Fan, G.; Li, T.; Dou, J.; Zhu, J. Ultrasound-assisted adsorption/desorption of jujube peel flavonoids using macroporous resins. Food Chem. 2022, 368, 130800–130811. [Google Scholar] [CrossRef] [PubMed]
- Sun, L.; Guo, Y.; Fu, C.; Li, J.; Li, Z. Simultaneous separation and purification of total polyphenols, chlorogenic acid and phlorizin from thinned young apples. Food Chem. 2013, 136, 1022–1029. [Google Scholar] [CrossRef] [PubMed]
- Wang, Y.; Zhang, Y.; Cheng, J.; Zhao, J.; Shi, R.; He, L.; Li, Q.; Chen, Y. Efficient purification of flavonoids from bamboo shoot residues of Phyllostachys edulis by macroporous resin and their hypoglycemic activity. Food Chem. X 2022, 16, 100505–100514. [Google Scholar] [CrossRef] [PubMed]
- Xiong, Q.; Zhang, Q.; Zhang, D.; Shi, Y.; Jiang, C.; Shi, X. Preliminary separation and purification of resveratrol from extract of peanut (Arachis hypogaea) sprouts by macroporous adsorption resins. Food Chem. 2014, 145, 1–7. [Google Scholar] [CrossRef] [PubMed]
- Wang, C.; Shi, L.; Fan, L.; Ding, Y.; Zhao, S.; Liu, Y.; Ma, C. Optimization of extraction and enrichment of phenolics from pomegranate (Punica granatum L.) leaves. Ind. Crop. Prod. 2013, 42, 587–594. [Google Scholar] [CrossRef]
- Liu, L.; Luo, X.; Zou, M.; Zhang, L.; Yin, M.; Zhang, X. Macroporous Resin-Assisted Enrichment and Isolation of Antioxidant and Cytotoxic Phenolics from Penthorum chinense. Rev. Bras. De Farmacogn. 2021, 31, 854–858. [Google Scholar] [CrossRef]
- Yang, J.; Wu, L.; Wang, T.; Zhao, Y.; Zheng, X.; Liu, Y. An Integrated Extraction–Purification Process for Raspberry Leaf Polyphenols and Their In Vitro Activities. Molecules 2023, 28, 6321–6339. [Google Scholar] [CrossRef]
- Jiang, Z.; Shi, R.; Chen, H.; Wang, Y. Ultrasonic microwave-assisted extraction coupled with macroporous resin chromatography for the purification of antioxidant phenolics from waste jackfruit (Artocarpus heterophyllus Lam.) peels. J. Food Sci. Technol. 2019, 56, 3877–3886. [Google Scholar] [CrossRef]
- Kim, J.; Yoon, M.; Yang, H.; Jo, J.; Han, D.; Jeon, Y.J.; Cho, S. Enrichment and purification of marine polyphenol phlorotannins using macroporous adsorption resins. Food Chem. 2014, 162, 135–142. [Google Scholar] [CrossRef]
- Wu, Y.; Jiang, Y.; Zhang, L.; Zhou, J.; Yu, Y.; Zhang, S.; Zhou, Y. Green and efficient extraction of total glucosides from Paeonia lactiflora Pall. ‘Zhongjiang’ by subcritical water extraction combined with macroporous resin enrichment. Ind. Crop. Prod. 2019, 141, 111699–111708. [Google Scholar] [CrossRef]
- Wang, Y.-h.; Deng, R.-x.; Gao, J.-y.; Yi, J.-p.; Lu, Z.-y.; Feng, Y.-h.; Zhang, W.-h.; Guo, X.-h.; Liang, M.-y.; Liu, P. Large-scale extraction, enrichment and separation of paeoniflorin and albiflorin from the oil tree peony seed cake. Ind. Crop. Prod. 2022, 188, 115652–1156611. [Google Scholar] [CrossRef]
- Peng, L.; Ma, Z.; Chu, W.; Jiang, P.; Fu, Y.; Wang, P. Identification and hepatoprotective activity of total glycosides of paeony with high content of paeoniflorin extracted from Paeonia lactiflora Pall. Food Chem. Toxicol. 2023, 173, 113624–113634. [Google Scholar] [CrossRef] [PubMed]
- Yang, G. Chemical fingerprinting and quantitative analysis of cortex moutan from different tree peony cultivars using HPLC-ESI/MS. Nat. Prod. Commun. 2020, 15, 1934578X2097351. [Google Scholar] [CrossRef]
- Zhuang, H.; Ni, Y.; Kokot, S. Combining HPLC–DAD and ICP-MS data for improved analysis of complex samples: Classification of the root samples from Cortex moutan. Chemom. Intell. Lab. Syst. 2014, 135, 183–191. [Google Scholar] [CrossRef]
- Zhang, Y.; Cheng, Y.; Liu, Z.; Ding, L.; Qiu, T.; Chai, L.; Qiu, F.; Wang, Z.; Xiao, W.; Zhao, L.; et al. Systematic screening and characterization of multiple constituents in Guizhi Fuling capsule and metabolic profiling of bioactive components in rats using ultra-high-performance liquid chromatography/quadrupole-time-of-flight mass spectrometry. J. Chromatogr. B 2017, 1061–1062, 474–486. [Google Scholar] [CrossRef] [PubMed]
- Tong, N.N.; Zhou, X.Y.; Peng, L.P.; Liu, Z.A.; Shu, Q.Y. A comprehensive study of three species of Paeonia stem and leaf phytochemicals, and their antioxidant activities. J. Ethnopharmacol. 2021, 273, 1113985–1113994. [Google Scholar] [CrossRef] [PubMed]
- Wu, M.; Gu, Z. Screening of Bioactive Compounds from Moutan Cortex and Their Anti-Inflammatory Activities in Rat Synoviocytes. Evid.-Based Complement. Altern. Med. 2009, 6, 57–63. [Google Scholar] [CrossRef]
- Wang, Z.Q.; Shen, J.; Li, P.; Liu, S.S.; Yi, F.; Liu, H.B.; Wu, F.R.; He, C.N.; Chen, F.H.; Xiao, P.G. Research on Quality Markers of Moutan Cortex: Quality Evaluation and Quality Standards of Moutan Cortex. Chin. Herb. Med. 2017, 9, 307–320. [Google Scholar] [CrossRef]
- Li, X.Y.; Xu, J.D.; Zhou, S.S.; Kong, M.; Xu, Y.Y.; Zou, Y.T.; Tang, Y.; Zhou, L.; Xu, M.-Z.; Xu, J.; et al. Time segment scanning-based quasi-multiple reaction monitoring mode by ultra-performance liquid chromatography coupled with quadrupole/time-of-flight mass spectrometry for quantitative determination of herbal medicines: Moutan Cortex, a case study. J. Chromatogr. A 2018, 1581–1582, 33–42. [Google Scholar] [CrossRef]
- Jiang, C.; Li, X.; Jiao, Y.; Jiang, D.; Zhang, L.; Fan, B.; Zhang, Q. Optimization for ultrasound-assisted extraction of polysaccharides with antioxidant activity in vitro from the aerial root of Ficus microcarpa. Carbohydr. Polym. 2014, 110, 10–17. [Google Scholar] [CrossRef]
- Xiaoyong, W.; Yuan, T.; Yan, S.; Da, X.; Yan, W.; Qi, W.; Gang, Z. Extraction of flavonoids and kinetics of purification by macroporous resins from quinoa. J. Nanoparticle Res. 2020, 22, 447–451. [Google Scholar] [CrossRef]
- Sun, Y.; Lu, J.; Li, J.; Li, P.; Zhao, M.; Xia, G. Optimization of ultrasonic-assisted extraction of polyphenol from Areca nut (Areca catechu L.) seeds using response surface methodology and its effects on osteogenic activity. Ultrason. Sonochem. 2023, 98, 106511–106519. [Google Scholar] [CrossRef] [PubMed]
- Pérez Gutiérrez, R.M.; Martínez Jerónimo, F.F.; Contreras Soto, J.G.; Muñiz Ramírez, A.; Estrella Mendoza, M.F. Optimization of ultrasonic-assisted extraction of polyphenols from the polyherbal formulation of Cinnamomum verum, Origanum majorana, and Origanum vulgare and their anti-diabetic capacity in zebrafish (Danio rerio). Heliyon 2022, 8, e08682–e08690. [Google Scholar] [CrossRef] [PubMed]
- Tang, Z.; Lin, W.; Yang, J.; Feng, S.; Qin, Y.; Xiao, Y.; Chen, H.; Liu, Y.; Chen, H.; Bu, T.; et al. Ultrasound-assisted extraction of Cordyceps cicadae polyphenols: Optimization, LC-MS characterization, antioxidant and DNA damage protection activity evaluation. Arab. J. Chem. 2022, 15, 103953–103969. [Google Scholar] [CrossRef]
- Chen, Z.; Zhang, J.; Yang, F.; Mostafa, K. Deep Eutectic Solvents (DESs)-Ultrasonic-Assisted Extraction of Paeoniflorin and Paeonol from Moutan Cortex. J. Chem. 2022, 2022, 5904038. [Google Scholar] [CrossRef]
- Zhu, W.; Xue, X.; Zhang, Z. Ultrasonic-assisted extraction, structure and antitumor activity of polysaccharide from Polygonum multiflorum. Int. J. Biol. Macromol. 2016, 91, 132–142. [Google Scholar] [CrossRef] [PubMed]
- Chen, F.; Mo, K.; Zhang, Q.; Fei, S.; Zu, Y.; Yang, L. A novel approach for distillation of paeonol and simultaneous extraction of paeoniflorin by microwave irradiation using an ionic liquid solution as the reaction medium. Sep. Purif. Technol. 2017, 183, 73–82. [Google Scholar] [CrossRef]
- Xi, L.; Mu, T.; Sun, H. Preparative purification of polyphenols from sweet potato (Ipomoea batatas L.) leaves by AB-8 macroporous resins. Food Chem. 2015, 172, 166–174. [Google Scholar] [CrossRef] [PubMed]
- Hu, F.; Li, F.; Zheng, Z.; Sun-Waterhouse, D.; Wang, Z. Surfactant-Mediated Ultrasonic-Assisted Extraction and Purification of Antioxidants from Chaenomeles speciosa (Sweet) Nakai for Chemical- and Cell-Based Antioxidant Capacity Evaluation. Molecules 2022, 27, 7970–7989. [Google Scholar] [CrossRef]
- Liu, S.; Guo, S.; Hou, Y.; Zhang, S.; Bai, L.; Ho, C.; Yu, L.; Yao, L.; Zhao, B.; Bai, N. Chemical fingerprinting and multivariate analysis of Paeonia ostii leaves based on HPLC-DAD and UPLC-ESI-Q/TOF-MS/MS. Microchem. J. 2023, 184, 108169–108191. [Google Scholar] [CrossRef]
- Pan, Y.; Gao, Z.; Huang, X.Y.; Chen, J.J.; Geng, C.A. Chemical and biological comparison of different parts of Paeonia suffruticosa (Mudan) based on LCMS-IT-TOF and multi-evaluation in vitro. Ind. Crop. Prod. 2020, 144, 112028–112036. [Google Scholar] [CrossRef]


| Factors | Level | ||
|---|---|---|---|
| −1 | 0 | 1 | |
| Liquid-to-material ratio/mL/g | 15 | 20 | 25 |
| Ethanol concentration/% | 40 | 60 | 80 |
| Ultrasonic time/min | 20 | 30 | 40 |
| Ultrasonic temperature/°C | 30 | 35 | 40 |
| Ultrasonic power/W | 360 | 420 | 480 |
| Run | A | B | C | D | E | Extraction Yield (mg/g) |
|---|---|---|---|---|---|---|
| 1 | 15 | 40 | 30 | 35 | 420 | 7.43 ± 0.52 |
| 2 | 25 | 40 | 30 | 35 | 420 | 8.52 ± 0.44 |
| 3 | 15 | 80 | 30 | 35 | 420 | 8.27 ± 0.51 |
| 4 | 25 | 80 | 30 | 35 | 420 | 9.41 ± 0.14 |
| 5 | 20 | 60 | 20 | 30 | 420 | 9.63 ± 0.02 |
| 6 | 20 | 60 | 40 | 30 | 420 | 9.86 ± 0.08 |
| 7 | 20 | 60 | 20 | 40 | 420 | 8.93 ± 0.56 |
| 8 | 20 | 60 | 40 | 40 | 420 | 10.16 ± 0.41 |
| 9 | 20 | 60 | 30 | 35 | 360 | 7.39 ± 0.23 |
| 10 | 20 | 80 | 30 | 35 | 360 | 8.26 ± 0.44 |
| 11 | 20 | 40 | 30 | 35 | 480 | 8.23 ± 0.17 |
| 12 | 20 | 80 | 30 | 35 | 480 | 8.81 ± 0.21 |
| 13 | 15 | 60 | 20 | 35 | 420 | 8.43 ± 0.48 |
| 14 | 25 | 60 | 20 | 35 | 420 | 9.55 ± 0.19 |
| 15 | 15 | 60 | 40 | 35 | 420 | 8.84 ± 0.64 |
| 16 | 25 | 60 | 40 | 35 | 420 | 10.43 ± 0.71 |
| 17 | 20 | 60 | 30 | 30 | 360 | 8.36 ± 0.23 |
| 18 | 20 | 60 | 30 | 40 | 360 | 8.29 ± 0.12 |
| 19 | 20 | 60 | 30 | 30 | 480 | 8.82 ± 0.16 |
| 20 | 20 | 60 | 30 | 40 | 480 | 9.66 ± 0.05 |
| 21 | 20 | 40 | 20 | 35 | 420 | 8.32 ± 0.19 |
| 22 | 20 | 80 | 20 | 35 | 420 | 10.33 ± 0.22 |
| 23 | 20 | 40 | 40 | 35 | 420 | 9.84 ± 0.87 |
| 24 | 20 | 80 | 40 | 35 | 420 | 10.01 ± 0.45 |
| 25 | 15 | 60 | 30 | 30 | 420 | 7.98 ± 0.33 |
| 26 | 25 | 60 | 30 | 30 | 420 | 9.34 ± 0.06 |
| 27 | 15 | 60 | 30 | 40 | 420 | 8.54 ± 0.45 |
| 28 | 25 | 60 | 30 | 40 | 420 | 10.19 ± 0.10 |
| 29 | 20 | 60 | 20 | 35 | 360 | 8.27 ± 0.25 |
| 30 | 20 | 60 | 40 | 35 | 360 | 8.53 ± 0.33 |
| 31 | 20 | 60 | 20 | 35 | 480 | 9.32 ± 0.47 |
| 32 | 20 | 60 | 40 | 35 | 480 | 9.38 ± 0.11 |
| 33 | 15 | 60 | 20 | 35 | 360 | 7.87 ± 0.80 |
| 34 | 25 | 60 | 40 | 35 | 360 | 8.05 ± 0.44 |
| 35 | 15 | 60 | 30 | 35 | 480 | 7.22 ± 0.56 |
| 36 | 25 | 60 | 30 | 35 | 480 | 9.84 ± 0.14 |
| 37 | 20 | 40 | 30 | 30 | 420 | 9.23 ± 0.73 |
| 38 | 20 | 80 | 30 | 30 | 420 | 8.53 ± 0.40 |
| 39 | 20 | 40 | 30 | 40 | 420 | 9.09 ± 0.44 |
| 40 | 20 | 80 | 30 | 40 | 420 | 10.78 ± 0.02 |
| 41 | 20 | 60 | 30 | 35 | 420 | 13.67 ± 0.01 |
| 42 | 20 | 60 | 30 | 35 | 420 | 12.98 ± 0.09 |
| 43 | 20 | 60 | 30 | 35 | 420 | 12.18 ± 0.04 |
| 44 | 20 | 60 | 30 | 35 | 420 | 13.01 ± 0.11 |
| 45 | 20 | 60 | 30 | 35 | 420 | 13.74 ± 0.08 |
| 46 | 20 | 60 | 30 | 35 | 420 | 12.22 ± 0.16 |
| ANOVA Source | Sum of Squares | df | Mean Square | F-Value | p-Value |
|---|---|---|---|---|---|
| Model | 112.37 | 20 | 5.62 | 32.81 | <0.0001 *** |
| A | 7.09 | 1 | 7.09 | 41.40 | <0.0001 *** |
| B | 2.52 | 1 | 2.52 | 14.72 | 0.0008 *** |
| C | 1.36 | 1 | 1.36 | 7.96 | 0.0092 *** |
| D | 0.8978 | 1 | 0.8978 | 5.24 | 0.0307 * |
| E | 2.15 | 1 | 2.15 | 12.53 | 0.0016 ** |
| AB | 0.0006 | 1 | 0.0006 | 0.0037 | 0.9523 |
| AC | 0.0552 | 1 | 0.0552 | 0.3225 | 0.5752 |
| AD | 0.0090 | 1 | 0.0090 | 0.0527 | 0.8203 |
| AE | 1.49 | 1 | 1.49 | 8.69 | 0.0068 ** |
| BC | 0.8464 | 1 | 0.8464 | 4.94 | 0.0355 * |
| BD | 1.43 | 1 | 1.43 | 8.34 | 0.0079 ** |
| BE | 0.0210 | 1 | 0.0210 | 0.1228 | 0.7290 |
| CD | 0.2500 | 1 | 0.2500 | 1.46 | 0.2382 |
| CE | 0.0900 | 1 | 0.0900 | 0.5256 | 0.4752 |
| DE | 0.2070 | 1 | 0.2070 | 1.21 | 0.2820 |
| A2 | 46.00 | 1 | 46.00 | 268.66 | <0.0001 *** |
| B2 | 37.61 | 1 | 37.61 | 219.64 | <0.0001 *** |
| C2 | 17.78 | 1 | 17.78 | 103.87 | <0.0001 *** |
| D2 | 24.41 | 1 | 24.41 | 142.58 | <0.0001 *** |
| E2 | 56.97 | 1 | 56.97 | 332.74 | <0.0001 *** |
| Residual | 4.28 | 25 | 0.1712 | ||
| Lack of fit | 2.01 | 20 | 0.1005 | 0.2212 | 0.9936 |
| Pure error | 2.27 | 5 | 0.4542 | ||
| Cor total | 116.65 | 45 | |||
| R2 = 0.9633 R2Adj = 0.9339 C.V.% = 4.37 | |||||
| No. | Retention Time (min) | Compound | Formula | M.W. | Select Ions | Quasimol-Ecular Ion (m/z) | Fragment Ions (m/z) |
|---|---|---|---|---|---|---|---|
| 1 | 7.48 | Gallic acid | C7H6O5 | 170 | [M + H]+ | 171 | 127 |
| 7.43 | [M − H]− | 169 | 125 | ||||
| 2 | 22.80 | Oxypaeoniflorin | C23H28O12 | 496 | [M + Na]+, [M + K]+ | 519 | 332, 275, 189 |
| 23.48 | [M − H]− | 495 | 137 | ||||
| 3 | 29.46 | Paeonolide | C20H28O12 | 460 | [M + Na]+, [C9H10O3 + H]+ | 483 | 167 |
| 29.53 | [M − H]−, [M + HCOO]−, [M − C9H10O3 − H]− | 505 | 459, 293 | ||||
| 4 | 32.30 | Paeonol | C9H10O3 | 166 | [M + H]+ | 167 | 97 |
| 32.63 | 165, 125 | ||||||
| 5 | 37.45 | Paeoniflorin | C23H28O11 | 480 | [M + Na]+ | 503 | 179, 280 |
| 37.59 | [M + HCOO]− | 525 | 327, 177, 195 | ||||
| 6 | 39.44 | Ethyl gallate | C9H10O5 | 198 | [M + H]+ | 199 | 171, 109 |
| 39.34 | [M − H]−, [M − 2H]2− | 197 | 317, 169 | ||||
| 7 | 57.77 | Pentagalloylglucose | C41H32O26 | 940 | [M + Na]+, [M – C7H6O5]+ | 963 | 771, 171, 127 |
| 57.70 | [M – H]−, [M – 2H]2− | 939 | 469, 169, 125 |
Disclaimer/Publisher’s Note: The statements, opinions and data contained in all publications are solely those of the individual author(s) and contributor(s) and not of MDPI and/or the editor(s). MDPI and/or the editor(s) disclaim responsibility for any injury to people or property resulting from any ideas, methods, instructions or products referred to in the content. |
© 2024 by the authors. Licensee MDPI, Basel, Switzerland. This article is an open access article distributed under the terms and conditions of the Creative Commons Attribution (CC BY) license (https://creativecommons.org/licenses/by/4.0/).
Share and Cite
Meng, L.; Chen, Y.; Zheng, Z.; Wang, L.; Xu, Y.; Li, X.; Xiao, Z.; Tang, Z.; Wang, Z. Ultrasound-Assisted Extraction of Paeonol from Moutan Cortex: Purification and Component Identification of Extract. Molecules 2024, 29, 622. https://doi.org/10.3390/molecules29030622
Meng L, Chen Y, Zheng Z, Wang L, Xu Y, Li X, Xiao Z, Tang Z, Wang Z. Ultrasound-Assisted Extraction of Paeonol from Moutan Cortex: Purification and Component Identification of Extract. Molecules. 2024; 29(3):622. https://doi.org/10.3390/molecules29030622
Chicago/Turabian StyleMeng, Ling, Yan Chen, Zhenjia Zheng, Lei Wang, Yahui Xu, Xiujun Li, Zhijian Xiao, Zheng Tang, and Zhaosheng Wang. 2024. "Ultrasound-Assisted Extraction of Paeonol from Moutan Cortex: Purification and Component Identification of Extract" Molecules 29, no. 3: 622. https://doi.org/10.3390/molecules29030622