


Achieving Highly Efficient Photocatalytic Hydrogen Evolution through the Construction of g-C3N4@PdS@Pt Nanocomposites
 ,
,
Abstract
:
1. Introduction
2. Results and Discussion
3. Experimental
3.1. Materials
3.2. Synthesis of g-C3N4@PdS Nanocomposites
3.3. Characterization
3.4. Evaluation of Photocatalytic H2 Production Activity
4. Conclusions
Supplementary Materials
Author Contributions
Funding
Institutional Review Board Statement
Informed Consent Statement
Data Availability Statement
Conflicts of Interest
References
- Lubitz, W.; Tumas, W. Hydrogen: An overview. Chem. Rev. 2007, 107, 3900–3903. [Google Scholar] [CrossRef] [PubMed]
- Florin, N.H.; Harris, A.T. Hydrogen production from biomass coupled with carbon dioxide capture: The implications of thermodynamic equilibrium. Int. J. Hydrog. Energy 2007, 32, 4119–4134. [Google Scholar] [CrossRef]
- Acharya, R.; Parida, K. A review on TiO2/g-C3N4 visible-light-responsive photocatalysts for sustainable energy generation and environmental remediation. J. Environ. Chem. Eng. 2020, 8, 103896. [Google Scholar] [CrossRef]
- Rossmeisl, J.; Qu, Z.-W.; Zhu, H.; Kroes, G.-J.; Nørskov, J.K. Electrolysis of water on oxide surfaces. J. Electroanal. Chem. 2007, 607, 83–89. [Google Scholar] [CrossRef]
- Grochala, W.; Edwards, P.P. Thermal decomposition of the non-interstitial hydrides for the storage and production of hydrogen. Chem. Rev. 2004, 104, 1283–1316. [Google Scholar] [CrossRef] [PubMed]
- Chen, M.; Al-Subhi, K.; Al-Rajhi, A.; Al-Maktoumi, A.; Izady, A.; Al-Hinai, A. Numerical evaluation of hydrogen production by steam reforming of natural gas. Adv. Geo-Energy Res. 2023, 7, 141–151. [Google Scholar] [CrossRef]
- Hu, Y.H. A highly efficient photocatalyst-Hydrogenated black TiO2 for the photocatalytic splitting of water. Angew. Chem. Int. Ed. 2012, 51, 12410–12412. [Google Scholar] [CrossRef]
- Maeda, K. Photocatalytic water splitting using semiconductor particles: History and recent developments. J. Photochem. Photobiol. C Photochem. Rev. 2011, 12, 237–268. [Google Scholar] [CrossRef]
- Ismail, A.A.; Bahnemann, D.W. Photochemical splitting of water for hydrogen production by photocatalysis: A review. Sol. Energy Mater. Sol. Cells 2014, 128, 85–101. [Google Scholar] [CrossRef]
- Shi, Y.; Yang, A.-F.; Cao, C.-S.; Zhao, B. Applications of MOFs: Recent advances in photocatalytic hydrogen production from water. Coord. Chem. Rev. 2019, 390, 50–75. [Google Scholar] [CrossRef]
- Chen, X.; Shen, S.; Guo, L.; Mao, S.S. Semiconductor-based photocatalytic hydrogen generation. Chem. Rev. 2010, 110, 6503–6570. [Google Scholar] [CrossRef]
- Li, T.; Tsubaki, N.; Jin, Z. S-scheme heterojunction in photocatalytic hydrogen production. J. Mater. Sci. Technol. 2024, 169, 82–104. [Google Scholar] [CrossRef]
- Yang, Y.; Zhou, C.; Wang, W.; Xiong, W.; Zeng, G.; Huang, D.; Zhang, C.; Song, B.; Xue, W.; Li, X. Recent advances in application of transition metal phosphides for photocatalytic hydrogen production. Chem. Eng. J. 2021, 405, 126547. [Google Scholar] [CrossRef]
- Hu, N.; Cai, Y.; Li, L.; Wang, X.; Gao, J. Amino-functionalized titanium based metal-organic framework for photocatalytic hydrogen production. Molecules 2022, 27, 4241. [Google Scholar] [CrossRef] [PubMed]
- Kumaravel, V.; Mathew, S.; Bartlett, J.; Pillai, S.C. Photocatalytic hydrogen production using metal doped TiO2: A review of recent advances. Appl. Catal. B Environ. 2019, 244, 1021–1064. [Google Scholar] [CrossRef]
- Ramírez-Ortega, D.; Guerrero-Araque, D.; Acevedo-Peña, P.; Reguera, E.; Calderon, H.A.; Zanella, R. Enhancing the photocatalytic hydrogen production of the ZnO–TiO2 heterojunction by supporting nanoscale Au islands. Int. J. Hydrog. Energy 2021, 46, 34333–34343. [Google Scholar] [CrossRef]
- Mansingh, S.; Padhi, D.; Parida, K. Enhanced photocatalytic activity of nanostructured Fe doped CeO2 for hydrogen production under visible light irradiation. Int. J. Hydrogen Energy 2016, 41, 14133–14146. [Google Scholar] [CrossRef]
- Kum, J.M.; Yoo, S.H.; Ali, G.; Cho, S.O. Photocatalytic hydrogen production over CuO and TiO2 nanoparticles mixture. Int. J. Hydrogen Energy 2013, 38, 13541–13546. [Google Scholar] [CrossRef]
- Hernández-Majalca, B.; Meléndez-Zaragoza, M.; Salinas-Gutiérrez, J.; López-Ortiz, A.; Collins-Martínez, V. Visible-light photo-assisted synthesis of GO-TiO2 composites for the photocatalytic hydrogen production. Int. J. Hydrogen Energy 2019, 44, 12381–12389. [Google Scholar] [CrossRef]
- Ma, L.; Jiang, W.; Lin, C.; Xu, L.; Zhu, T.; Ai, X. CdS Deposited In Situ on g-C3N4 via a Modified Chemical Bath Deposition Method to Improve Photocatalytic Hydrogen Production. Molecules 2023, 28, 7846. [Google Scholar] [CrossRef]
- Cheng, L.; Xiang, Q.; Liao, Y.; Zhang, H. CdS-based photocatalysts. Energy Environ. Sci. 2018, 11, 1362–1391. [Google Scholar] [CrossRef]
- Zhang, Y.; Wang, X.; Ren, X.; Luo, S.; Huang, H.; Chen, R.; Shao, S.; Liu, D.; Gao, J.; Gui, J.; et al. Building rapid charge transfer channel via engineering Ni coordinated flexible polymer for efficient solar hydrogen evolution. Chem. Eng. J. 2023, 456, 141032. [Google Scholar] [CrossRef]
- Yang, R.; Mei, L.; Fan, Y.; Zhang, Q.; Zhu, R.; Amal, R.; Yin, Z.; Zeng, Z. ZnIn2S4-Based photocatalysts for energy and environmental applications. Small Methods 2021, 5, 2100887. [Google Scholar] [CrossRef]
- Zhang, J.; Yu, J.; Zhang, Y.; Li, Q.; Gong, J.R. Visible light photocatalytic H2-production activity of CuS/ZnS porous nanosheets based on photoinduced interfacial charge transfer. Nano Lett. 2011, 11, 4774–4779. [Google Scholar] [CrossRef] [PubMed]
- Fu, J.; Yu, J.; Jiang, C.; Cheng, B. g-C3N4-Based heterostructured photocatalysts. Adv. Energy Mater. 2018, 8, 1701503. [Google Scholar] [CrossRef]
- Gao, J.; Zhang, F.; Xue, H.; Zhang, L.; Peng, Y.; Li, X.; Gao, Y.; Li, N.; Lei, G. In-situ synthesis of novel ternary CdS/PdAg/g-C3N4 hybrid photocatalyst with significantly enhanced hydrogen production activity and catalytic mechanism exploration. Appl. Catal. B Environ. 2021, 281, 119509. [Google Scholar] [CrossRef]
- Yan, S.; Li, Z.; Zou, Z. Photodegradation performance of g-C3N4 fabricated by directly heating melamine. Langmuir 2009, 25, 10397–10401. [Google Scholar] [CrossRef] [PubMed]
- Wang, J.; Wang, S. A critical review on graphitic carbon nitride (g-C3N4)-based materials: Preparation, modification and environmental application. Coord. Chem. Rev. 2022, 453, 214338. [Google Scholar] [CrossRef]
- Li, Y.; Zhang, M.; Zhou, L.; Yang, S.; Wu, Z.; Ma, Y. Recent advances in surface-modified g-C3N4-based photocatalysts for H2 production and CO2 reduction. Acta Phys.-Chim. Sin. 2021, 37, 2009030. [Google Scholar]
- Patnaik, S.; Sahoo, D.P.; Parida, K. An overview on Ag modified g-C3N4 based nanostructured materials for energy and environmental applications. Renew. Sustain. Energy Rev. 2018, 82, 1297–1312. [Google Scholar] [CrossRef]
- Fang, S.; Xia, Y.; Lv, K.; Li, Q.; Sun, J.; Li, M. Effect of carbon-dots modification on the structure and photocatalytic activity of g-C3N4. Appl. Catal. B Environ. 2016, 185, 225–232. [Google Scholar] [CrossRef]
- Bai, X.; Wang, L.; Wang, Y.; Yao, W.; Zhu, Y. Enhanced oxidation ability of g-C3N4 photocatalyst via C60 modification. Appl. Catal. B Environ. 2014, 152, 262–270. [Google Scholar] [CrossRef]
- Li, Y.; Xia, Z.; Yang, Q.; Wang, L.; Xing, Y. Review on g-C3N4-based S-scheme heterojunction photocatalysts. J. Mater. Sci. Technol. 2022, 125, 128–144. [Google Scholar] [CrossRef]
- Dong, F.; Zhao, Z.; Xiong, T.; Ni, Z.; Zhang, W.; Sun, Y.; Ho, W.-K. In situ construction of g-C3N4/g-C3N4 metal-free heterojunction for enhanced visible-light photocatalysis. ACS Appl. Mater. Interfaces 2013, 5, 11392–11401. [Google Scholar] [CrossRef] [PubMed]
- Geng, Y.; Chen, D.; Li, N.; Xu, Q.; Li, H.; He, J.; Lu, J. Z-Scheme 2D/2D α-Fe2O3/g-C3N4 heterojunction for photocatalytic oxidation of nitric oxide. Appl. Catal. B Environ. 2021, 280, 119409. [Google Scholar] [CrossRef]
- Caux, M.; Fina, F.; Irvine, J.T.; Idriss, H.; Howe, R. Impact of the annealing temperature on Pt/g-C3N4 structure, activity and selectivity between photodegradation and water splitting. Catal. Today 2017, 287, 182–188. [Google Scholar] [CrossRef]
- Tong, T.; Zhu, B.; Jiang, C.; Cheng, B.; Yu, J. Mechanistic insight into the enhanced photocatalytic activity of single-atom Pt, Pd or Au-embedded g-C3N4. Appl. Surf. Sci. 2018, 433, 1175–1183. [Google Scholar] [CrossRef]
- Lu, R.; Hu, M.; Xu, C.; Wang, Y.; Zhang, Y.; Xu, B.; Gao, D.; Bi, J.; Fan, G. Hydrogen evolution from hydrolysis of ammonia borane catalyzed by Rh/g-C3N4 under mild conditions. Int. J. Hydrogen Energy 2018, 43, 7038–7045. [Google Scholar] [CrossRef]
- Liu, J.; Jia, Q.; Long, J.; Wang, X.; Gao, Z.; Gu, Q. Amorphous NiO as co-catalyst for enhanced visible-light-driven hydrogen generation over g-C3N4 photocatalyst. Appl. Catal. B Environ. 2018, 222, 35–43. [Google Scholar] [CrossRef]
- Zhang, Q.; Li, Y.; Zhong, J.; Li, J. Facile construction of CuO/g-C3N4 heterojunctions with promoted photocatalytic hydrogen generation behaviors. Fuel 2023, 353, 129224. [Google Scholar] [CrossRef]
- Li, Z.; Meng, X.; Zheng, Z. Rencent development on MoS2-based photocatalysis: A review. J. Photoch. Photobio. C. Photochem. Rev. 2018, 35, 39–55. [Google Scholar] [CrossRef]
- Khan, K.; Tao, X.; Shi, M.; Zeng, B.; Feng, Z.; Li, C.; Li, R. Visible-light-driven photocatalytic hydrogen production on Cd0.5Zn0.5S nanorods with an apparent quantum efficiency exceeding 80%. Adv. Funct. Mater. 2020, 30, 2003731. [Google Scholar] [CrossRef]
- Zhang, S.; Chen, Q.; Jing, D.; Wang, Y.; Guo, L. Visible photoactivity and antiphotocorrosion performance of PdS-CdS photocatalysts modified by polyaniline. Int. J. Hydrog. Energ. 2012, 37, 791–796. [Google Scholar] [CrossRef]
- Sun, Q.; Wang, N.; Yu, J.; Yu, J.C. A hollow porous CdS photocatalyst. Adv. Mater. 2018, 30, 1804368. [Google Scholar] [CrossRef] [PubMed]
- Li, X.-L.; Yang, G.-Q.; Li, S.-S.; Xiao, N.; Li, N.; Gao, Y.-Q.; Lv, D.; Ge, L. Novel dual co-catalysts decorated Au@HCS@PdS hybrids with spatially separated charge carriers and enhanced photocatalytic hydrogen evolution activity. Chem. Eng. J. 2020, 379, 122350. [Google Scholar] [CrossRef]
- Ge, L.; Zuo, F.; Liu, J.; Ma, Q.; Wang, C.; Sun, D.; Bartels, L.; Feng, P. Synthesis and efficient visible light photocatalytic hydrogen evolution of polymeric g-C3N4 coupled with CdS quantum dots. J. Phys. Chem. C 2012, 116, 13708–13714. [Google Scholar] [CrossRef]
- Reddy, B.M.; Reddy, E.P.; Srinivas, S. Dispersion and activity of molybdena-alumina catalysts prepared by impregnation and solid/solid wetting methods. J. Catal. 1992, 136, 50–58. [Google Scholar] [CrossRef]
- Meng, J.; Yu, Z.; Li, Y.; Li, Y. PdS-modified CdS/NiS composite as an efficient photocatalyst for H2 evolution in visible light. Catal. Today 2014, 225, 136–141. [Google Scholar] [CrossRef]
- Chen, Z.; Guo, F.; Sun, H.; Shi, Y.; Shi, W. Well-designed three-dimensional hierarchical hollow tubular g-C3N4/ZnIn2S4 nanosheets heterostructure for achieving efficient visible-light photocatalytic hydrogen evolution. J. Colloid Interface Sci. 2022, 607, 1391–1401. [Google Scholar] [CrossRef]
- Shi, W.; Wang, J.; Yang, S.; Lin, X.; Guo, F.; Shi, J. Fabrication of a ternary carbon dots/CoO/g-C3N4 nanocomposite photocatalyst with enhanced visible-light-driven photocatalytic hydrogen production. J. Chem. Technol. Biotechnol. 2020, 95, 2129–2138. [Google Scholar] [CrossRef]
- Wang, Y.; Zhang, X.; Liu, Y.; Zhao, Y.; Xie, C.; Song, Y.; Yang, P. Crystallinity and phase controlling of g-C3N4/CdS hetrostructures towards high efficient photocatalytic H2 generation. Int. J. Hydrog. Energy 2019, 44, 30151–30159. [Google Scholar] [CrossRef]
- Zheng, Y.; Lin, L.; Wang, B.; Wang, X. Graphitic carbon nitride polymers toward sustainable photoredox catalysis. Angew. Chem. Int. Ed. 2015, 54, 12868–12884. [Google Scholar] [CrossRef] [PubMed]
- Zhao, H.; Wang, S.; He, F.; Zhang, J.; Chen, L.; Dong, P.; Tai, Z.; Wang, Y.; Gao, H.; Zhao, C. Hydroxylated carbon nanotube/carbon nitride nanobelt composites with enhanced photooxidation and H2 evolution efficiency. Carbon 2019, 150, 340–348. [Google Scholar] [CrossRef]
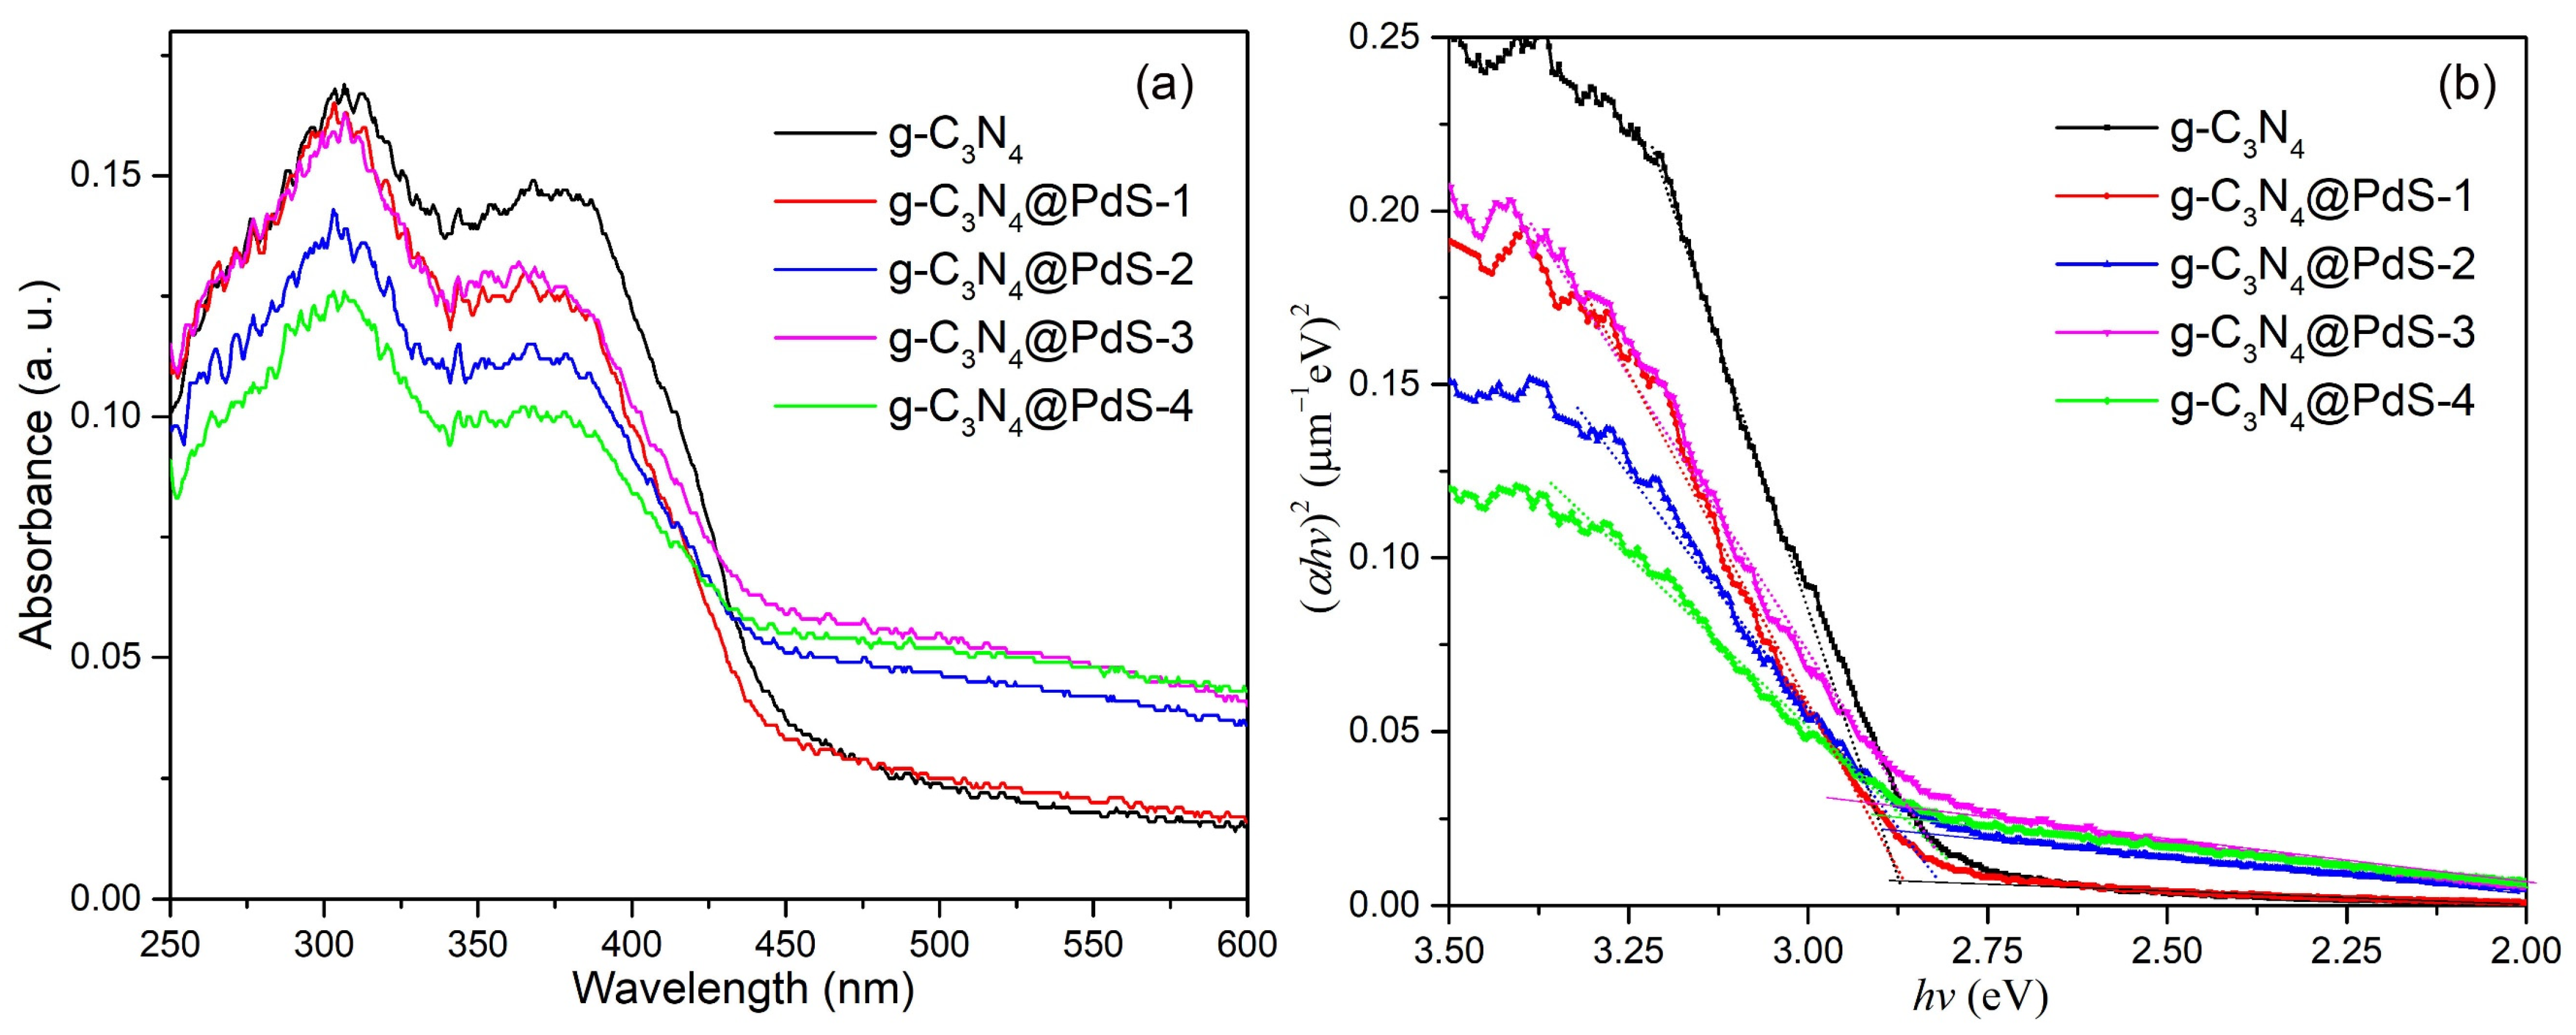
- Makuła, P.; Pacia, M.; Macyk, W. How To Correctly Determine the Band Gap Energy of Modified Semiconductor Photocatalysts Based on UV–Vis Spectra. J. Phys. Chem. Lett. 2018, 9, 6814–6817. [Google Scholar] [CrossRef]
- Wang, W.; Fang, J.; Huang, X. Different behaviors between interband and intraband transitions generated hot carriers on g-C3N4/Au for photocatalytic H2 production. Appl. Surf. Sci. 2020, 513, 145830. [Google Scholar] [CrossRef]
- Samanta, S.; Martha, S.; Parida, K. Facile synthesis of Au/g-C3N4 nanocomposites: An inorganic/organic hybrid plasmonic photocatalyst with wnhanced hydrogen gas evolution under visible-light irradiation. ChemCatChem 2014, 6, 1453–1462. [Google Scholar] [CrossRef]
- Liu, M.; Xia, P.; Zhang, L.; Cheng, B.; Yu, J. Enhanced photocatalytic H2-production activity of g-C3N4 nanosheets via optimal photodeposition of Pt as cocatalyst. ACS Sustain. Chem. Eng. 2018, 6, 10472–10480. [Google Scholar] [CrossRef]
- Yao, Y.; Ren, G.; Li, Z.; Bai, H.; Hu, X.; Meng, X. Nitrogen vacancy-induced deposition of Pd nanoparticles onto g-C3N4 with greatly improved photocatalytic activity in H2 evolution. Sol. RRL 2021, 5, 2100145. [Google Scholar] [CrossRef]
- Xu, Q.; Zhu, B.; Cheng, B.; Yu, J.; Zhou, M.; Ho, W. Photocatalytic H2 evolution on graphdiyne/g-C3N4 hybrid nanocomposites. Appl. Catal. B Environ. 2019, 255, 117770. [Google Scholar] [CrossRef]
- Yuan, Y.-J.; Shen, Z.; Wu, S.; Su, Y.; Pei, L.; Ji, Z.; Ding, M.; Bai, W.; Chen, Y.; Yu, Z.-T.; et al. Liquid exfoliation of g-C3N4 nanosheets to construct 2D-2D MoS2/g-C3N4 photocatalyst for enhanced photocatalytic H2 production activity. Appl. Catal. B Environ. 2019, 246, 120–128. [Google Scholar] [CrossRef]
- Das, D.; Shinde, S.L.; Nanda, K.K. Temperature-dependent photoluminescence of g-C3N4: Implication for temperature sensing. ACS Appl. Mater. Interfaces 2016, 8, 2181–2186. [Google Scholar] [CrossRef]
- Yan, H.; Yang, J.; Ma, G.; Wu, G.; Zong, X.; Lei, Z.; Shi, J.; Li, C. Visible-light-driven hydrogen production with extremely high quantum efficiency on Pt–PdS/CdS photocatalyst. J. Catal. 2009, 266, 165–168. [Google Scholar] [CrossRef]
- Ferrer, I.J.; Díaz-Chao, P.; Pascual, A.; Sánchez, C. An investigation on palladium sulphide (PdS) thin films as a photovoltaic material. Thin Solid Film. 2007, 515, 5783–5786. [Google Scholar] [CrossRef]


| Catalyst | Synthesis Method | Dosage (mg) | Type of Light Source | Sacrificial Reagent | H2 Evolution Rate (μmol·g−1·h−1) | Refs. |
|---|---|---|---|---|---|---|
| Au@g-C3N4 | Solution–precipitation method | 20 | 365 nm wavelength light excitation | 10% Triethanolamine | 530 | [55] |
| Au@g-C3N4 | Facile deposition–precipitation method | 20 | 125W medium pressure visible-light Hg Lamp | 10% Triethanolamine | 177.4 | [56] |
| Pt@g-C3N4 | Photodeposition of Pt | 8 | 300 W xenon Lamp | 8 mL of TEOA solution | 4210.8 | [57] |
| Pd-NVs-C3N4 | Photoreduction method | 100 | 300 W xenon Lamp | 20 vol% methanol | 287.9 | [58] |
| graphdiyne/g-C3N4 | Calcination method | 50 | 300 W xenon Lamp (λ > 420 nm) | 15% Triethanolamine | 39.6 | [59] |
| MoS2@g-C3N4 | Probe sonication-assisted liquid exfoliation method | 50 | 300 W xenon Lamp (λ > 420 nm) | 0.1M Triethanolamine | 1155 | [60] |
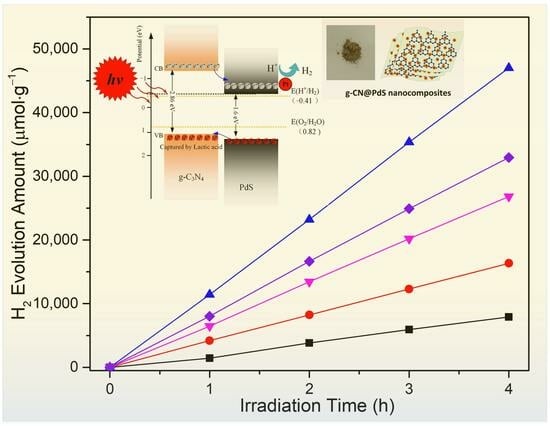
| g-C3N4@PdS@Pt-3 | Precipitation method | 30 | 300 W Xe arc Lamp (λ > 420 nm) | 20% lactic acid aqueous solution | 1289 | This work |
| 300 W Xe arc Lamp | 11,438 |
| Sample | τ1 (ns) | A1 (%) | τ2 (ns) | A2 (%) | τ (ns) |
|---|---|---|---|---|---|
| g-C3N4 | 2.1714 | 57.51 | 9.6023 | 42.49 | 7.8609 |
| g-C3N4@PdS-3 | 1.5004 | 52.84 | 6.8455 | 47.16 | 5.7917 |
Disclaimer/Publisher’s Note: The statements, opinions and data contained in all publications are solely those of the individual author(s) and contributor(s) and not of MDPI and/or the editor(s). MDPI and/or the editor(s) disclaim responsibility for any injury to people or property resulting from any ideas, methods, instructions or products referred to in the content. |
© 2024 by the authors. Licensee MDPI, Basel, Switzerland. This article is an open access article distributed under the terms and conditions of the Creative Commons Attribution (CC BY) license (https://creativecommons.org/licenses/by/4.0/).
Share and Cite
Ma, L.; Lin, C.; Jiang, W.; Yan, S.; Jiang, H.; Song, X.; Ai, X.; Cao, X.; Ding, Y. Achieving Highly Efficient Photocatalytic Hydrogen Evolution through the Construction of g-C3N4@PdS@Pt Nanocomposites. Molecules 2024, 29, 493. https://doi.org/10.3390/molecules29020493
Ma L, Lin C, Jiang W, Yan S, Jiang H, Song X, Ai X, Cao X, Ding Y. Achieving Highly Efficient Photocatalytic Hydrogen Evolution through the Construction of g-C3N4@PdS@Pt Nanocomposites. Molecules. 2024; 29(2):493. https://doi.org/10.3390/molecules29020493
Chicago/Turabian StyleMa, Ligang, Chao Lin, Wenjun Jiang, Shun Yan, Huilin Jiang, Xiang Song, Xiaoqian Ai, Xiaoxiao Cao, and Yihuan Ding. 2024. "Achieving Highly Efficient Photocatalytic Hydrogen Evolution through the Construction of g-C3N4@PdS@Pt Nanocomposites" Molecules 29, no. 2: 493. https://doi.org/10.3390/molecules29020493