

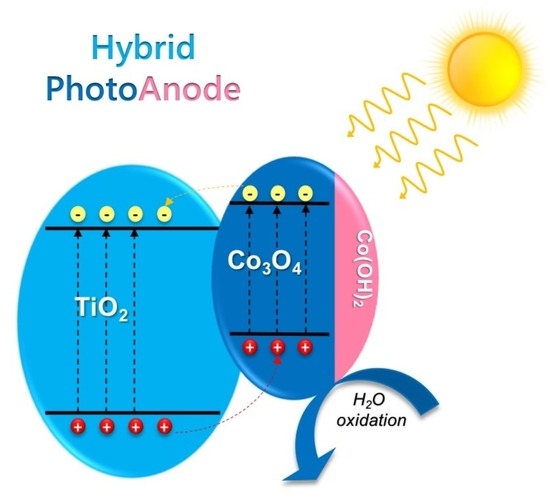
Hybrid Photoelectrocatalytic TiO2-Co3O4/Co(OH)2 Materials Prepared from Bio-Based Surfactants for Water Splitting
 , ,
, ,
Abstract
:
1. Introduction
2. Results and Discussion
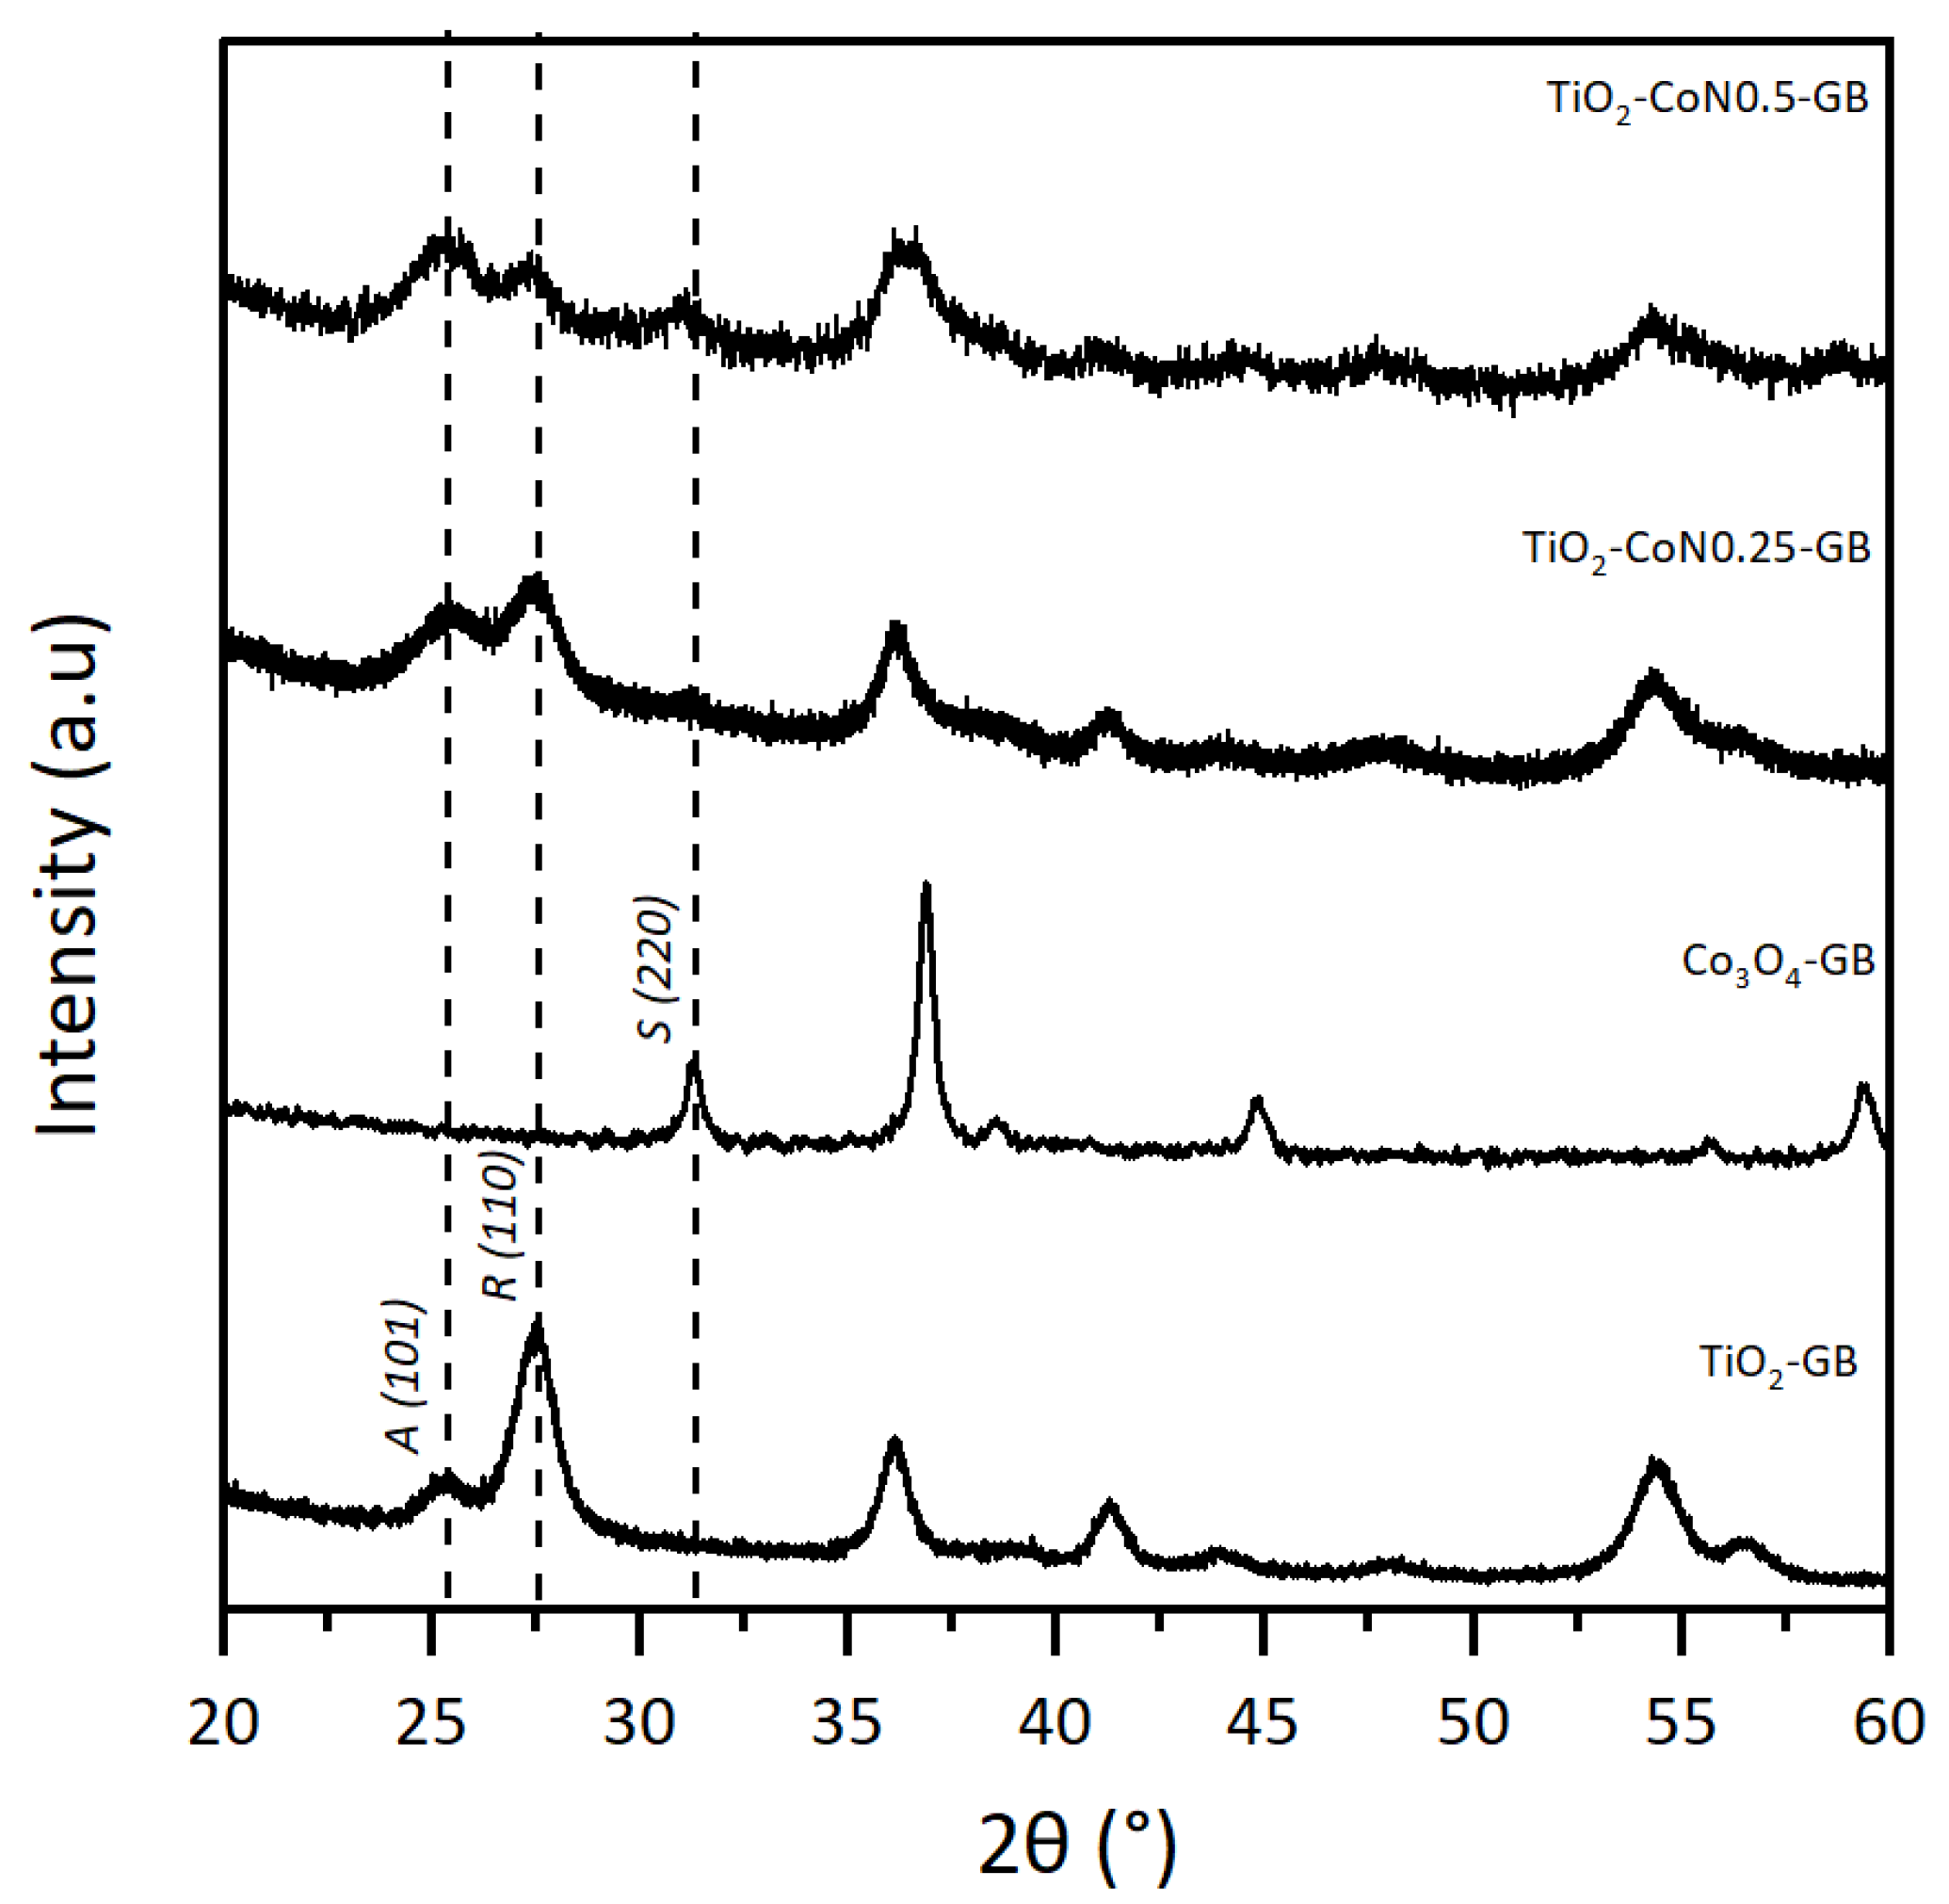
2.1. Structural and Textural Characterizations
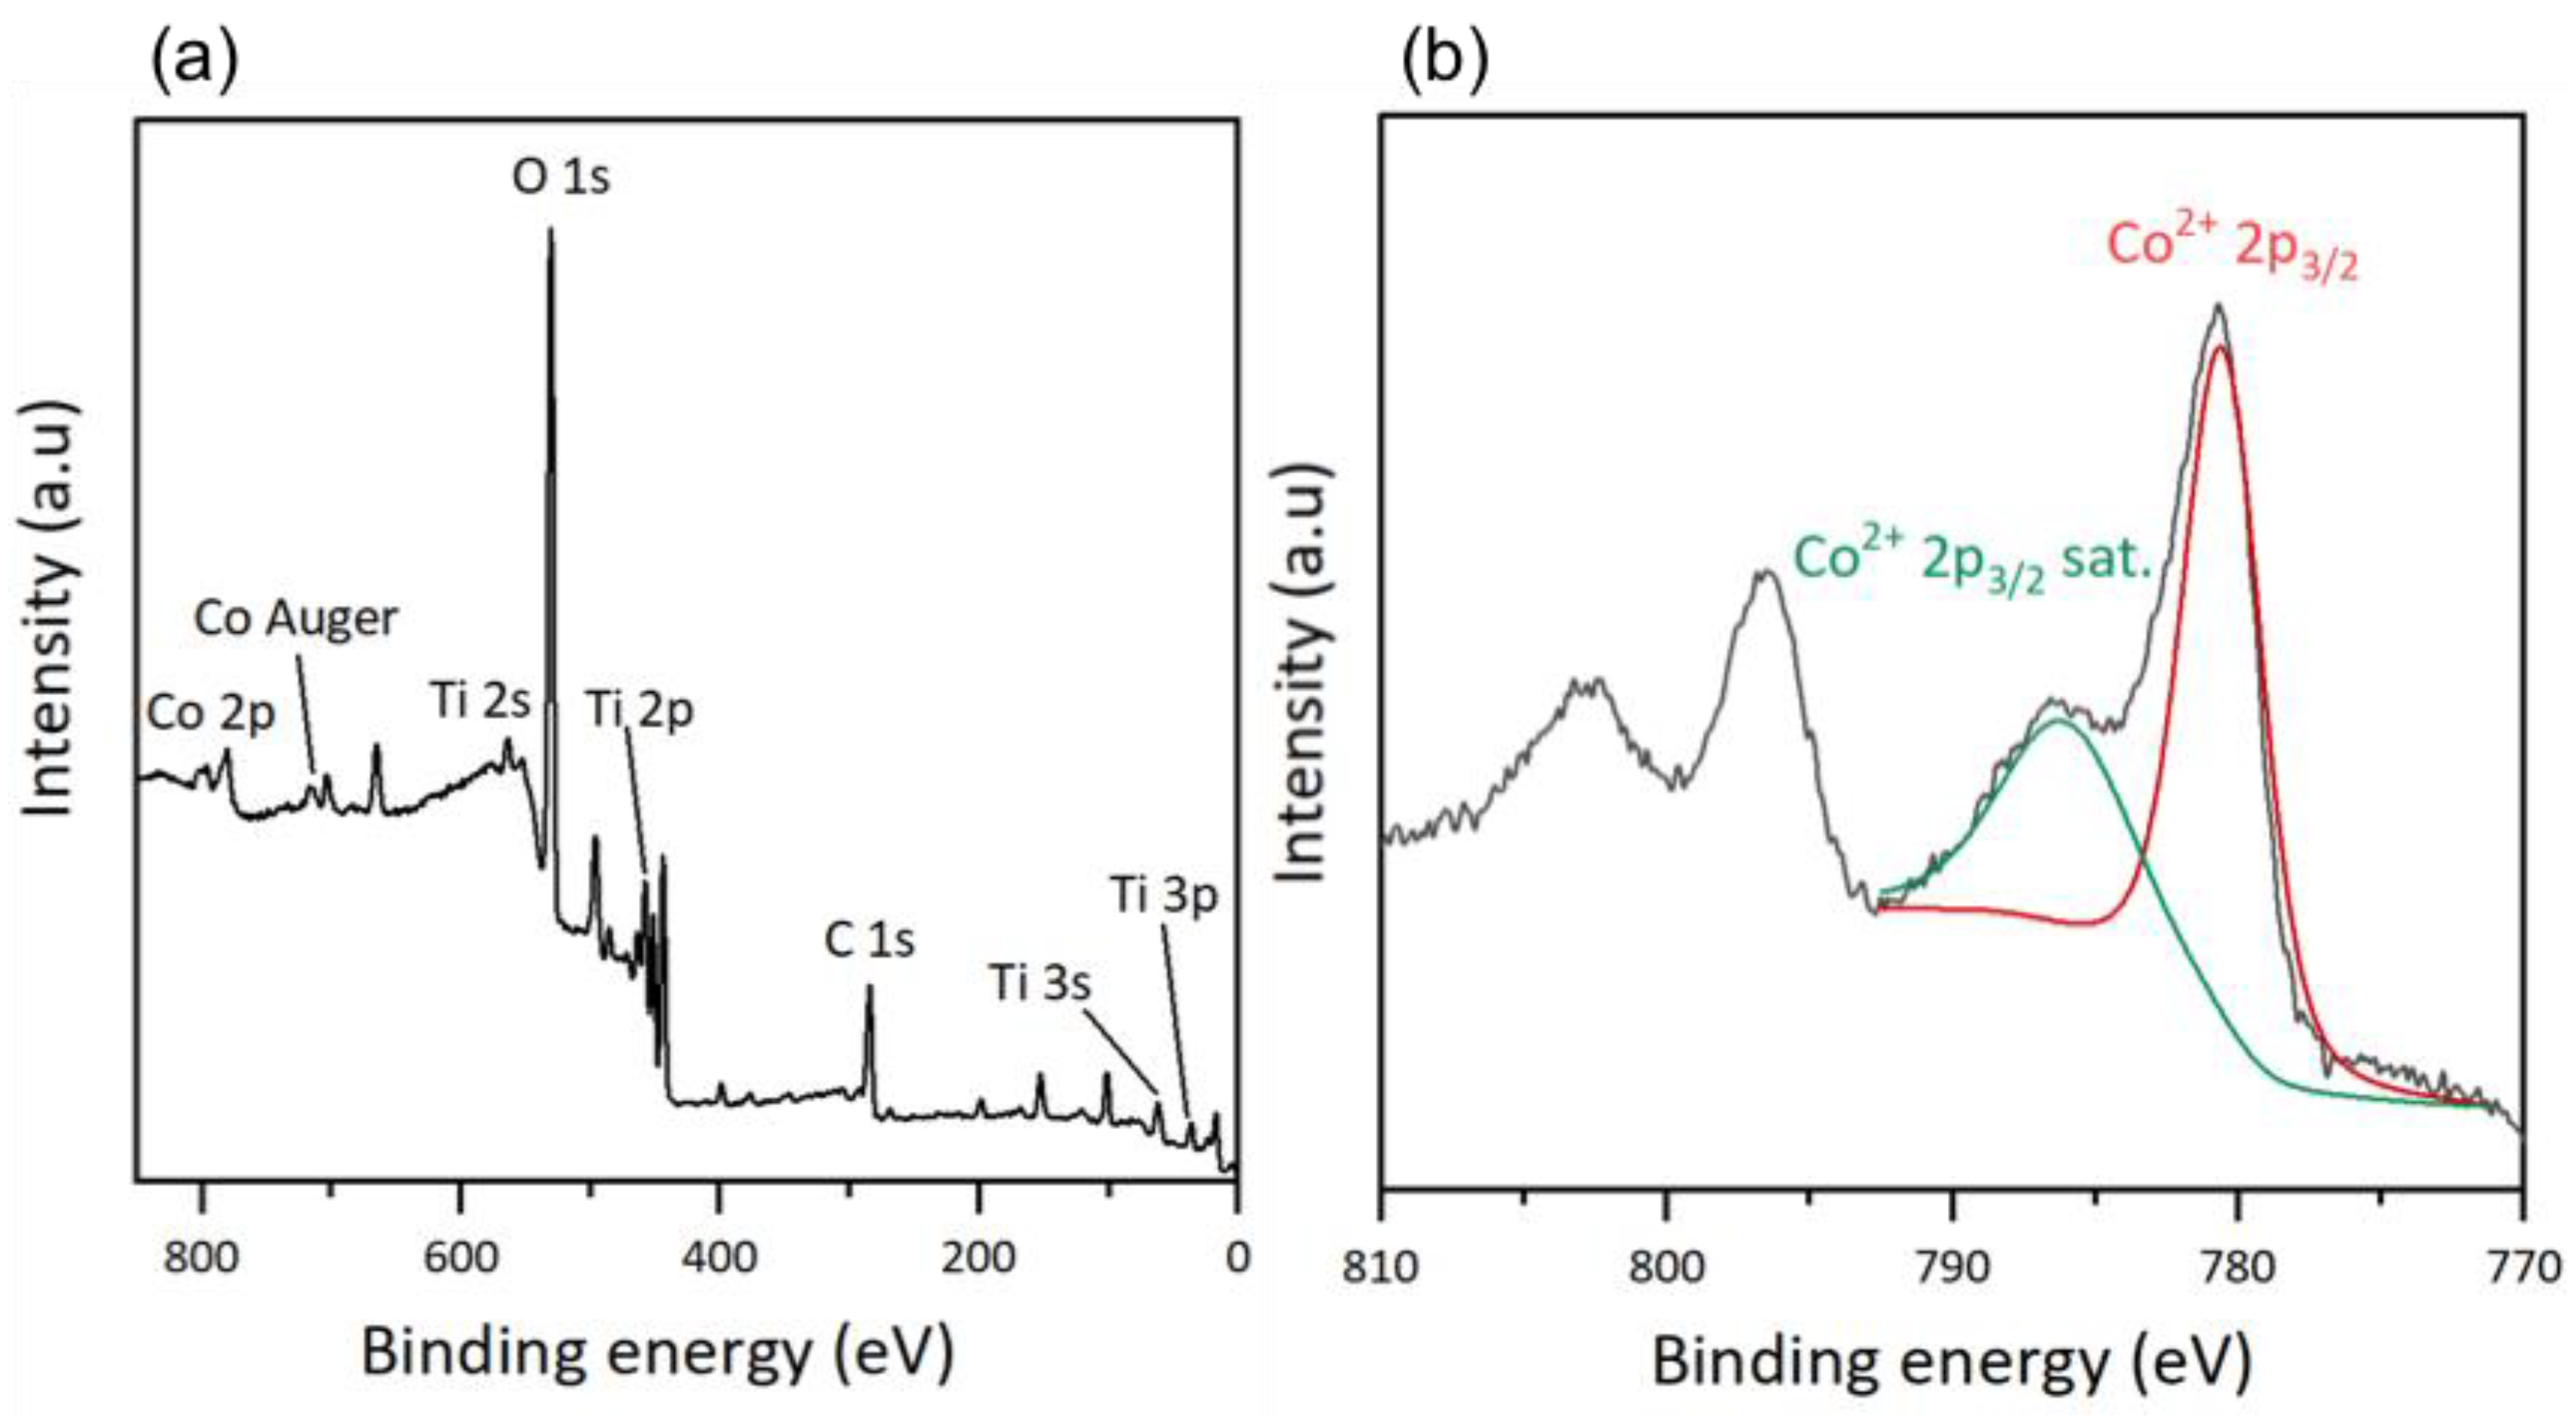
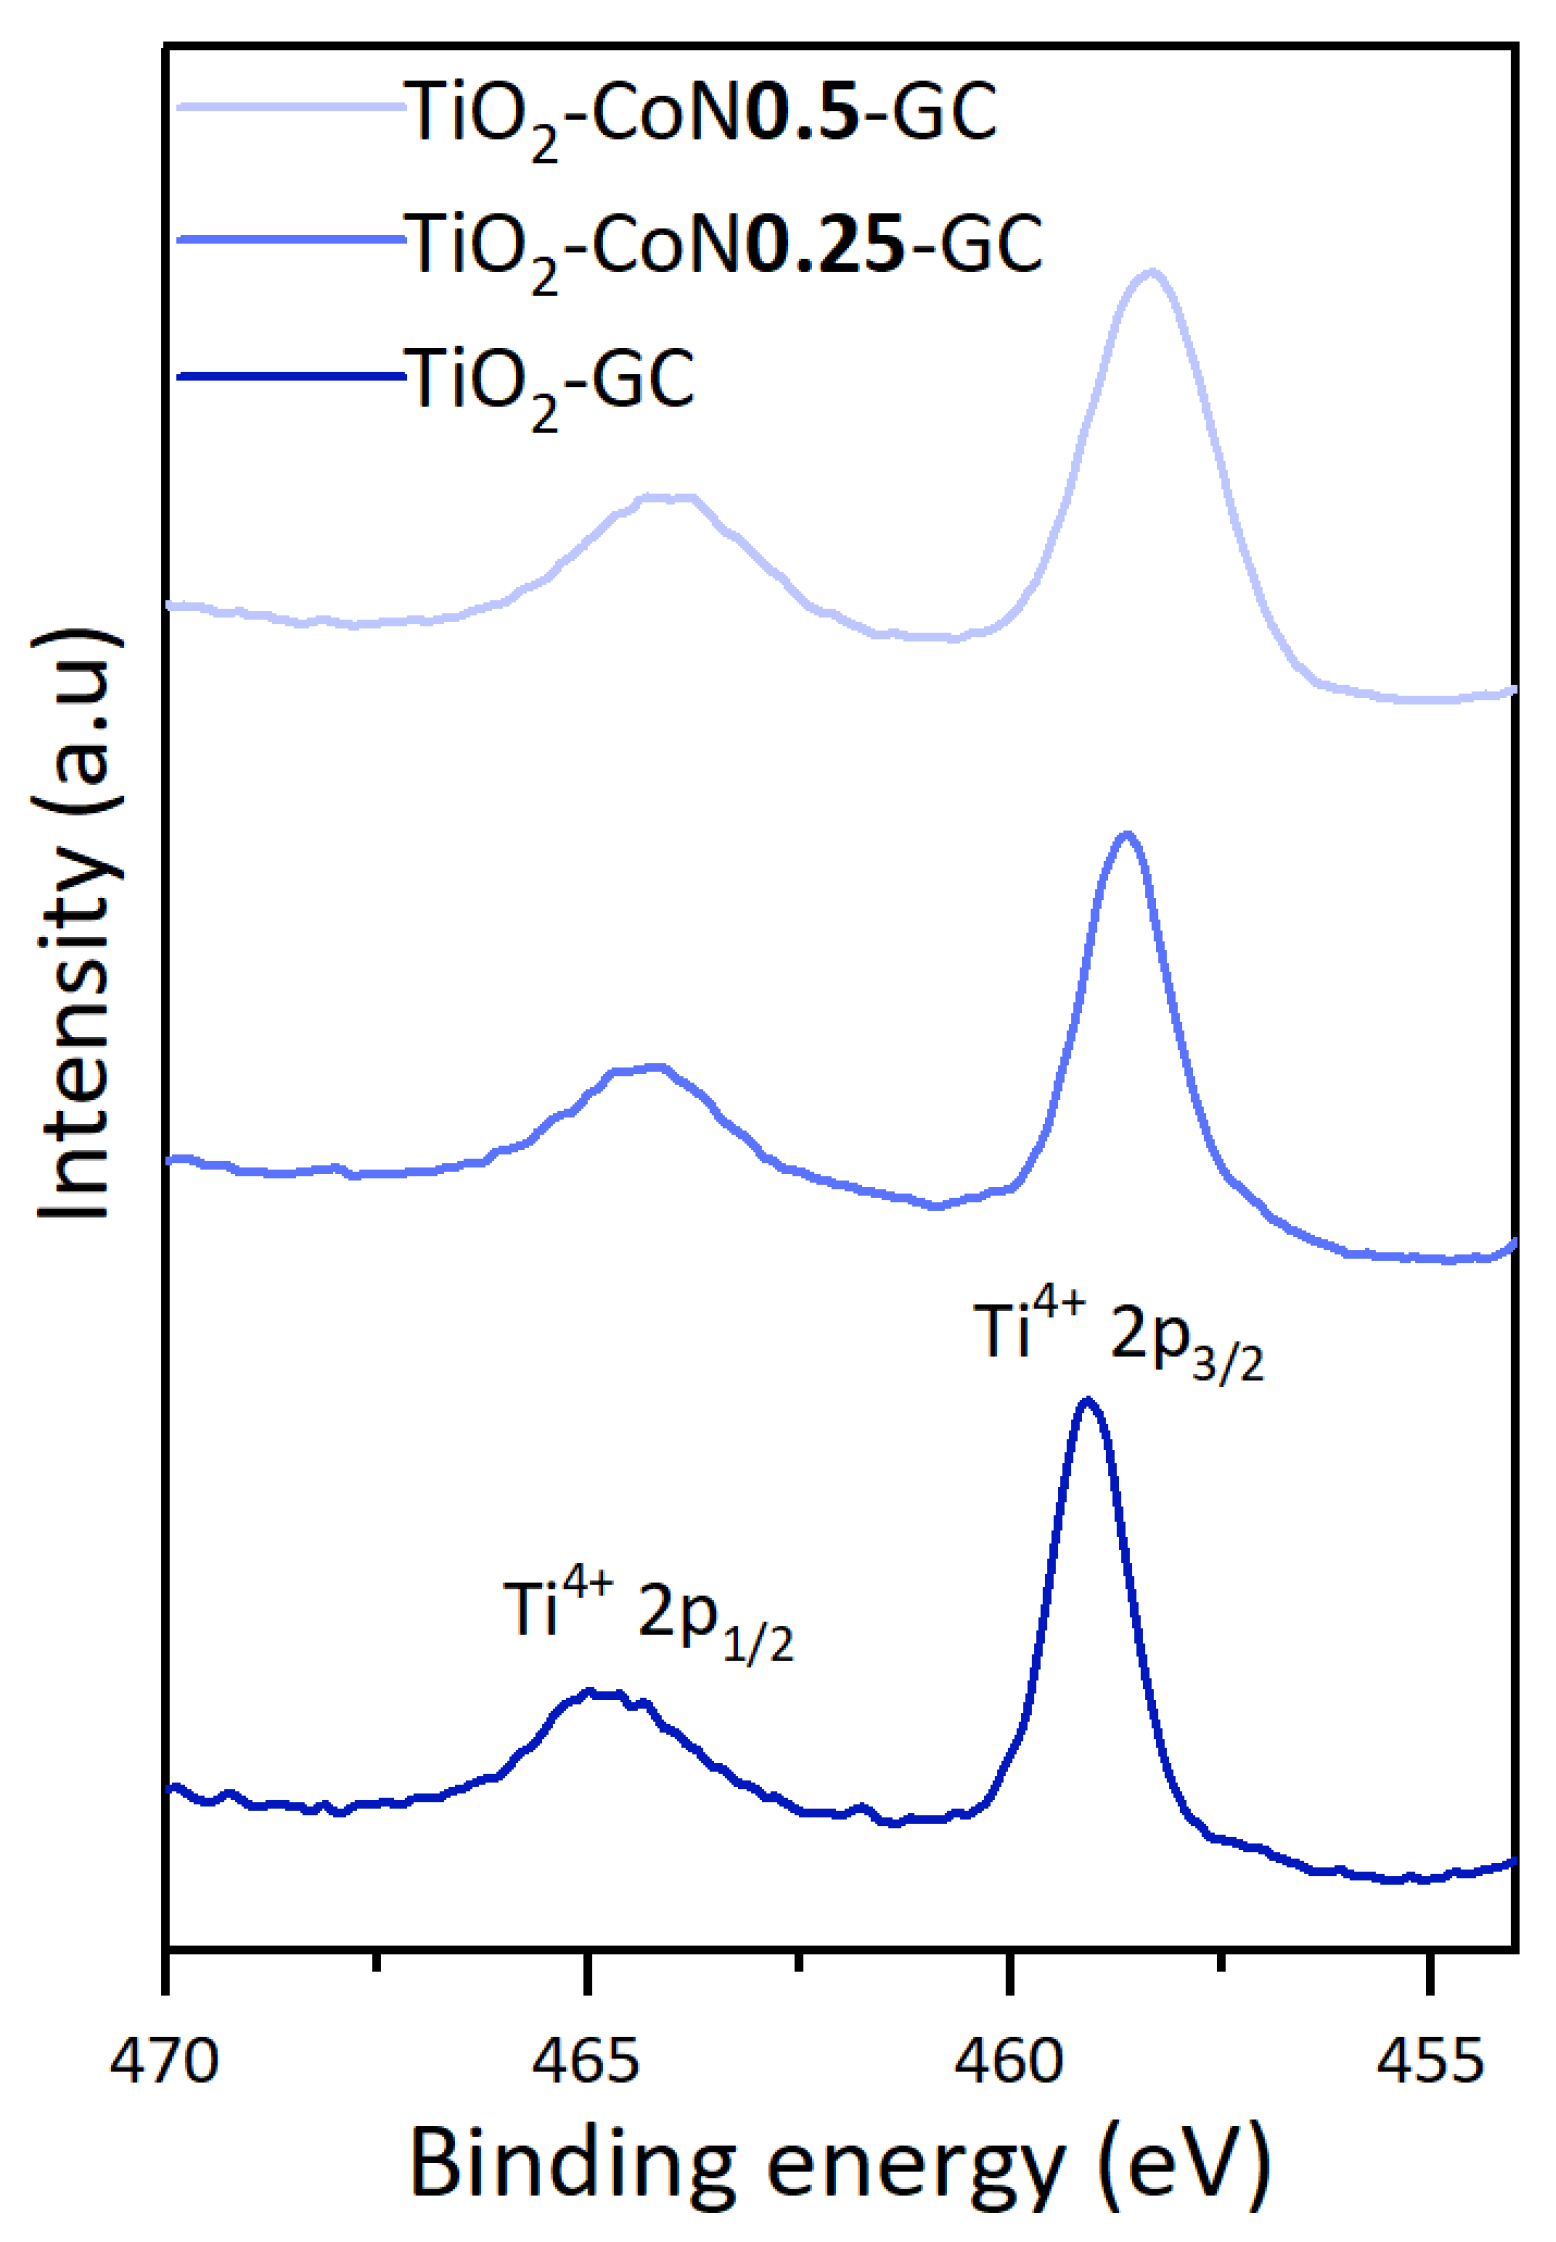
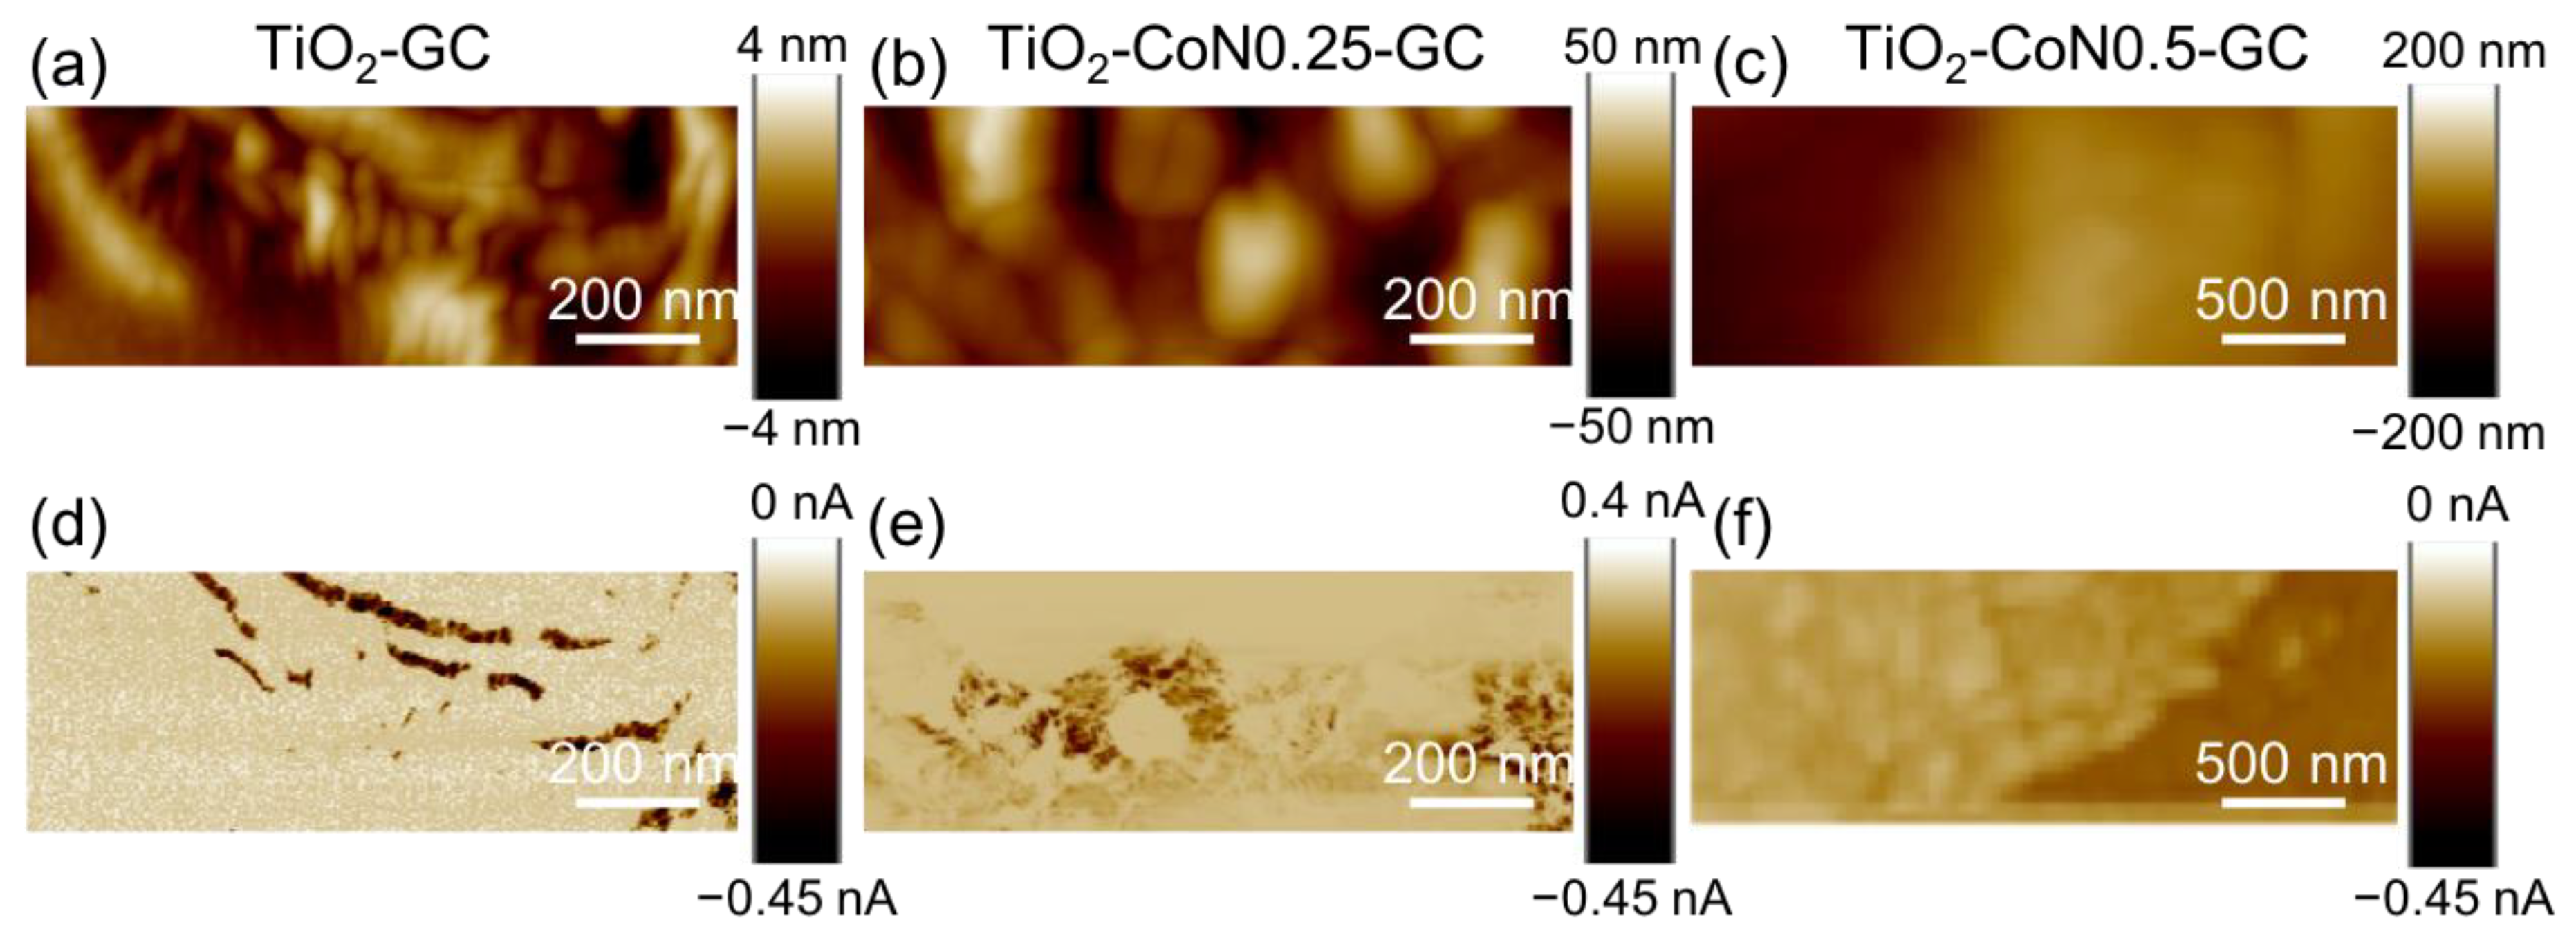
2.2. Morphological and Chemical Characterizations
2.3. Optical Properties
2.4. Electronic Properties
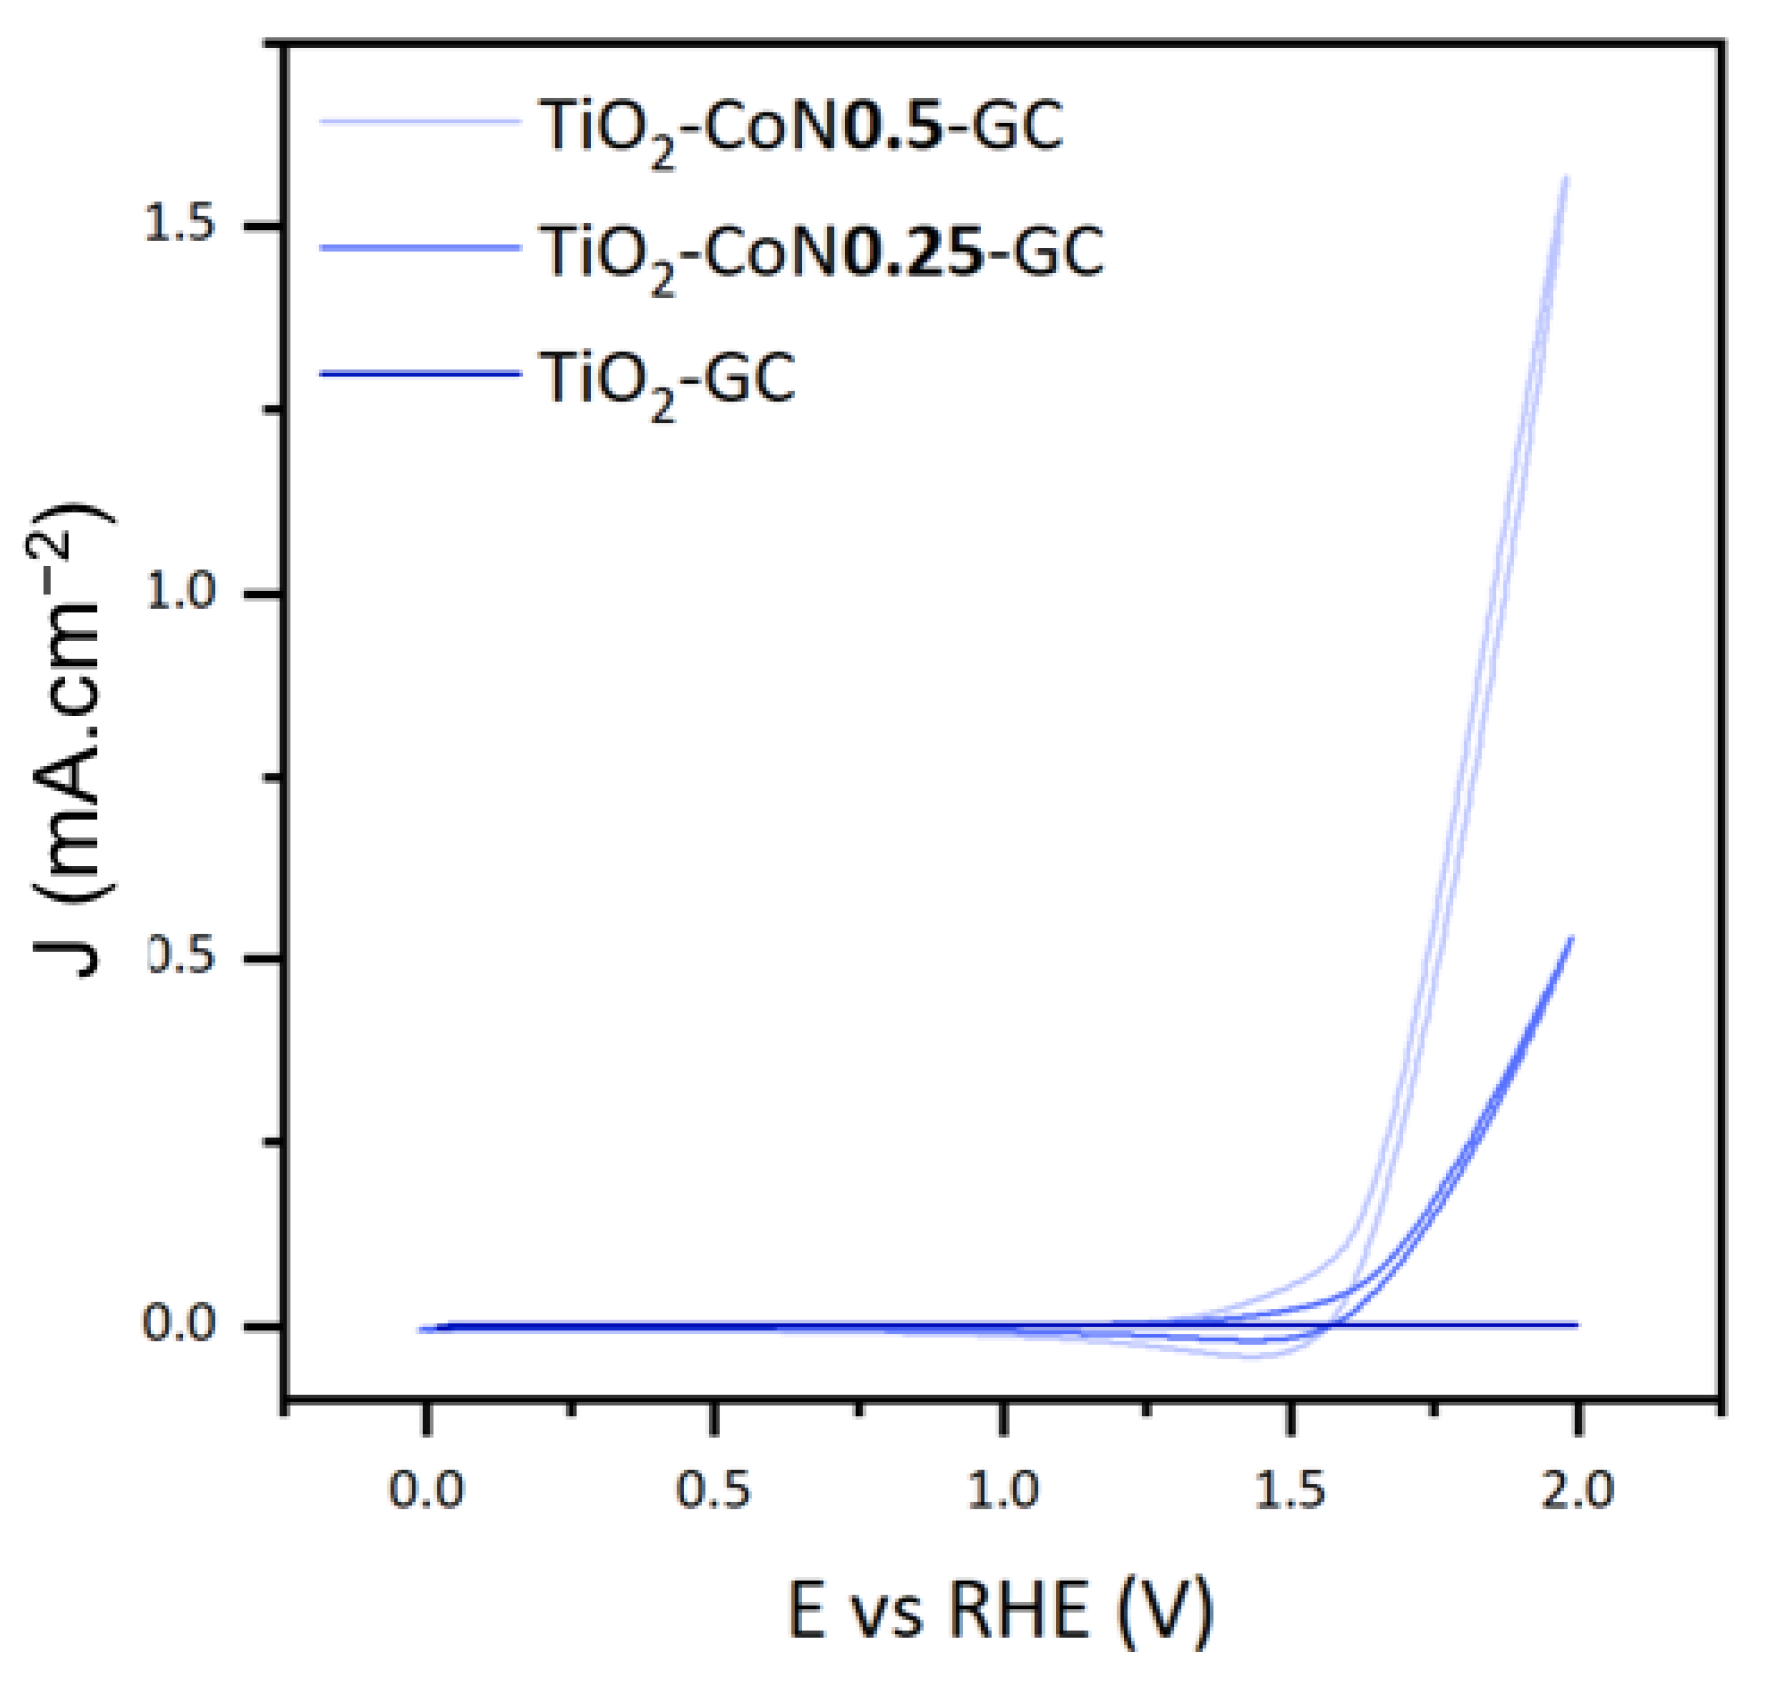
2.5. Photoelectrochemical Properties
3. Experimental Section
3.1. Synthesis Procedure
3.2. Materials Characterizations
3.2.1. Structural Characterization
3.2.2. Morphological and Chemical Characterizations
3.2.3. Optical and Electrical Characterizations
3.2.4. Photoelectrochemical Characterizations
4. Conclusions
Supplementary Materials
Author Contributions
Funding
Institutional Review Board Statement
Informed Consent Statement
Data Availability Statement
Acknowledgments
Conflicts of Interest
References
- van de Krol, R.; Grätzel, M. (Eds.) Photoelectrochemical Hydrogen Production; Electronic Materials: Science & Technology; Springer: Boston, MA, USA, 2012; Volume 102, ISBN 978-1-4614-1379-0. [Google Scholar]
- Ahmed, M.; Dincer, I. A Review on Photoelectrochemical Hydrogen Production Systems: Challenges and Future Directions. Int. J. Hydrogen Energy 2019, 44, 2474–2507. [Google Scholar] [CrossRef]
- Chiu, Y.-H.; Lai, T.-H.; Kuo, M.-Y.; Hsieh, P.-Y.; Hsu, Y.-J. Photoelectrochemical Cells for Solar Hydrogen Production: Challenges and Opportunities. APL Mater. 2019, 7, 080901. [Google Scholar] [CrossRef]
- Pop, L.-C.; Tantis, I.; Lianos, P. Photoelectrocatalytic Hydrogen Production Using Nitrogen Containing Water Soluble Wastes. Int. J. Hydrogen Energy 2015, 40, 8304–8310. [Google Scholar] [CrossRef]
- Wang, G.; Ling, Y.; Lu, X.; Wang, H.; Qian, F.; Tong, Y.; Li, Y. Solar Driven Hydrogen Releasing from Urea and Human Urine. Energy Environ. Sci. 2012, 5, 8215–8219. [Google Scholar] [CrossRef]
- Wang, G.; Ling, Y.; Lu, X.; Zhai, T.; Qian, F.; Tong, Y.; Li, Y. A Mechanistic Study into the Catalytic Effect of Ni(OH)2 on Hematite for Photoelectrochemical Water Oxidation. Nanoscale 2013, 5, 4129–4133. [Google Scholar] [CrossRef]
- Antoniadou, M.; Bouras, P.; Strataki, N.; Lianos, P. Hydrogen and Electricity Generation by Photoelectrochemical Decomposition of Ethanol over Nanocrystalline Titania. Int. J. Hydrogen Energy 2008, 33, 5045–5051. [Google Scholar] [CrossRef]
- Mohapatra, S.K.; Raja, K.S.; Mahajan, V.K.; Misra, M. Efficient Photoelectrolysis of Water Using TiO2 Nanotube Arrays by Minimizing Recombination Losses with Organic Additives. J. Phys. Chem. C 2008, 112, 11007–11012. [Google Scholar] [CrossRef]
- Nakata, K.; Fujishima, A. TiO2 Photocatalysis: Design and Applications. J. Photochem. Photobiol. C Photochem. Rev. 2012, 13, 169–189. [Google Scholar] [CrossRef]
- Fujishima, A.; Rao, T.N.; Tryk, D.A. Titanium Dioxide Photocatalysis. J. Photochem. Photobiol. C Photochem. Rev. 2000, 1, 1–21. [Google Scholar] [CrossRef]
- Fu, A.; HONDA, K. Electrochemical Photolysis of Water at a Semiconductor Electrode. Nature 1972, 238, 37–38. [Google Scholar] [CrossRef]
- Jiang, C.; Moniz, S.J.A.; Wang, A.; Zhang, T.; Tang, J. Photoelectrochemical Devices for Solar Water Splitting-Materials and Challenges. Chem. Soc. Rev. 2017, 46, 4645–4660. [Google Scholar] [CrossRef]
- Wei, X.; He, X.; Wu, P.; Gong, F.; Wang, D.; Wang, S.; Lu, S.; Zhang, J.; Xiang, S.; Kai, T.; et al. Recent Advances in the Design of Semiconductor Hollow Microspheres for Enhanced Photocatalyticv Water Splitting. Int. J. Hydrogen Energy 2021, 46, 27974–27996. [Google Scholar] [CrossRef]
- Wen, J.; Li, X.; Liu, W.; Fang, Y.; Xie, J.; Xu, Y. Photocatalysis Fundamentals and Surface Modification of TiO2 Nanomaterials. Cuihua Xuebao/Chin. J. Catal. 2015, 36, 2049–2070. [Google Scholar] [CrossRef]
- Zheng, L.; Teng, F.; Ye, X.; Zheng, H.; Fang, X. Photo/Electrochemical Applications of Metal Sulfide/TiO2 Heterostructures. Adv. Energy Mater. 2020, 10, 1902355. [Google Scholar] [CrossRef]
- Guaraldo, T.T.; Gonçales, V.R.; Silva, B.F.; de Torresi, S.I.C.; Zanoni, M.V.B. Hydrogen Production and Simultaneous Photoelectrocatalytic Pollutant Oxidation Using a TiO2/WO3 Nanostructured Photoanode under Visible Light Irradiation. J. Electroanal. Chem. 2016, 765, 188–196. [Google Scholar] [CrossRef]
- Guo, L.; Yang, Z.; Marcus, K.; Li, Z.; Luo, B.; Zhou, L.; Wang, X.; Du, Y.; Yang, Y. MoS2/TiO2 Heterostructures as Nonmetal Plasmonic Photocatalysts for Highly Efficient Hydrogen Evolution. Energy Environ. Sci. 2018, 11, 106–114. [Google Scholar] [CrossRef]
- Kumar, S.G.; Rao, K.S.R.K. Comparison of Modification Strategies towards Enhanced Charge Carrier Separation and Photocatalytic Degradation Activity of Metal Oxide Semiconductors (TiO2, WO3 and ZnO). Appl. Surf. Sci. 2017, 391, 124–148. [Google Scholar] [CrossRef]
- Mei, J.; Liao, T.; Ayoko, G.A.; Bell, J.; Sun, Z. Cobalt Oxide-Based Nanoarchitectures for Electrochemical Energy Applications. Prog. Mater. Sci. 2019, 103, 596–677. [Google Scholar] [CrossRef]
- Ma, J.; Wei, H.; Liu, Y.; Ren, X.; Li, Y.; Wang, F.; Han, X.; Xu, E.; Cao, X.; Wang, G.; et al. Application of Co3O4-Based Materials in Electrocatalytic Hydrogen Evolution Reaction: A Review. Int. J. Hydrogen Energy 2020, 45, 21205–21220. [Google Scholar] [CrossRef]
- Cheng, C.S.; Serizawa, M.; Sakata, H.; Hirayama, T. Electrical Conductivity of Co3O4 Films Prepared by Chemical Vapour Deposition. Mater. Chem. Phys. 1998, 53, 225–230. [Google Scholar] [CrossRef]
- Ebadi, M.; Mat-Teridi, M.A.; Sulaiman, M.Y.; Basirun, W.J.; Asim, N.; Ludin, N.A.; Ibrahim, M.A.; Sopian, K. Electrodeposited P-Type Co3O4 with High Photoelectrochemical Performance in Aqueous Medium. RSC Adv. 2015, 5, 36820–36827. [Google Scholar] [CrossRef]
- Thota, S.; Kumar, A.; Kumar, J. Optical, Electrical and Magnetic Properties of Co3O4 Nanocrystallites Obtained by Thermal Decomposition of Sol–Gel Derived Oxalates. Mater. Sci. Eng. B 2009, 164, 30–37. [Google Scholar] [CrossRef]
- Patel, M.; Kim, J. Thickness-Dependent Photoelectrochemical Properties of a Semitransparent Co3O4 Photocathode. Beilstein J. Nanotechnol. 2018, 9, 2432–2442. [Google Scholar] [CrossRef]
- Qiao, L.; Xiao, H.Y.; Meyer, H.M.; Sun, J.N.; Rouleau, C.M.; Puretzky, A.A.; Geohegan, D.B.; Ivanov, I.N.; Yoon, M.; Weber, W.J.; et al. Nature of the Band Gap and Origin of the Electro-/Photo-Activity of Co3O4. J. Mater. Chem. C Mater. 2013, 1, 4628. [Google Scholar] [CrossRef]
- Liu, J.; Ke, J.; Li, Y.; Liu, B.; Wang, L.; Xiao, H.; Wang, S. Co3O4 Quantum Dots/TiO2 Nanobelt Hybrids for Highly Efficient Photocatalytic Overall Water Splitting. Appl. Catal. B 2018, 236, 396–403. [Google Scholar] [CrossRef]
- Wang, Y.; Zhu, C.; Zuo, G.; Guo, Y.; Xiao, W.; Dai, Y.; Kong, J.; Xu, X.; Zhou, Y.; Xie, A.; et al. 0D/2D Co3O4/TiO2 Z-Scheme Heterojunction for Boosted Photocatalytic Degradation and Mechanism Investigation. Appl. Catal. B 2020, 278, 119298. [Google Scholar] [CrossRef]
- Dai, G.; Liu, S.; Liang, Y.; Luo, T. Synthesis and Enhanced Photoelectrocatalytic Activity of p–n Junction Co3O4/TiO2 Nanotube Arrays. Appl. Surf. Sci. 2013, 264, 157–161. [Google Scholar] [CrossRef]
- Zhao, X.-R.; Cao, Y.-Q.; Chen, J.; Zhu, L.; Qian, X.; Li, A.-D.; Wu, D. Photocatalytic Properties of Co3O4-Coated TiO2 Powders Prepared by Plasma-Enhanced Atomic Layer Deposition. Nanoscale Res. Lett. 2017, 12, 497. [Google Scholar] [CrossRef]
- Miquelot, A. Propriétés Structurales, Optiques et Électriques d’hétérojonctions Co3O4/TiO2 Déposées Par MOCVD Pour l’étude de La Production de H2 Par Dissociation Photocatalytique de l’eau; Université de Toulouse: Toulouse, France, 2019. [Google Scholar]
- Saeed, M.; Usman, M.; Ibrahim, M.; Haq, A.; Khan, I.; Ijaz, H.; Akram, F. Enhanced Photo Catalytic Degradation of Methyl Orange Using p–n Co3O4-TiO2 Hetero-Junction as Catalyst. Int. J. Chem. React. Eng. 2020, 18, 20200004. [Google Scholar] [CrossRef]
- Thamaphat, K.; Limsuwan, P.; Ngotawornchai, B. Phase Characterization of TiO2 Powder by XRD and TEM. Kasetsart J. Nat. Sci. 2008, 42, 357–361. [Google Scholar]
- Itteboina, R.; Sau, T.K. Sol-Gel Synthesis and Characterizations of Morphology-Controlled Co3O4 Particles. Mater. Today Proc. 2019, 9, 458–467. [Google Scholar] [CrossRef]
- Rietveld, H.M. A Profile Refinement Method for Nuclear and Magnetic Structures. J. Appl. Crystallogr. 1969, 2, 65–71. [Google Scholar] [CrossRef]
- Duquet, F.; Nada, A.A.; Rivallin, M.; Rouessac, F.; Villeneuve-Faure, C.; Roualdes, S. Influence of Bio-Based Surfactants on TiO2 Thin Films as Photoanodes for Electro-Photocatalysis. Catalysts 2021, 11, 1228. [Google Scholar] [CrossRef]
- Gotić, M.; Ivanda, M.; Sekulić, A.; Musić, S.; Popović, S.; Turković, A.; Furić, K. Microstructure of Nanosized TiO2 Obtained by Sol–Gel Synthesis. Mater. Lett. 1996, 28, 225–229. [Google Scholar] [CrossRef]
- Arconada, N.; Durán, A.; Suárez, S.; Portela, R.; Coronado, J.M.; Sánchez, B.; Castro, Y. Synthesis and Photocatalytic Properties of Dense and Porous TiO2-Anatase Thin Films Prepared by Sol–Gel. Appl. Catal. B 2009, 86, 1–7. [Google Scholar] [CrossRef]
- Šegota, S.; Ćurković, L.; Ljubas, D.; Svetličić, V.; Houra, I.F.; Tomašić, N. Synthesis, Characterization and Photocatalytic Properties of Sol–Gel TiO2 Films. Ceram. Int. 2011, 37, 1153–1160. [Google Scholar] [CrossRef]
- Brisk, M.A.; Baker, A.D. Shake-Up Satellites in X-ray Photoelectron Spectroscopy. J. Electron Spectrosc. Relat. Phenom. 1975, 7, 197–213. [Google Scholar] [CrossRef]
- Svensson, S.; Eriksson, B.; Mårtensson, N.; Wendin, G.; Gelius, U. Electron Shake-Up and Correlation Satellites and Continuum Shake-Off Distributions in X-ray Photoelectron Spectra of the Rare Gas Atoms. J. Electron Spectrosc. Relat. Phenom. 1988, 47, 327–384. [Google Scholar] [CrossRef]
- Biesinger, M.C.; Payne, B.P.; Grosvenor, A.P.; Lau, L.W.M.; Gerson, A.R.; Smart, R.S.C. Resolving Surface Chemical States in XPS Analysis of First Row Transition Metals, Oxides and Hydroxides: Cr, Mn, Fe, Co and Ni. Appl. Surf. Sci. 2011, 257, 2717–2730. [Google Scholar] [CrossRef]
- Xu, F.; Zhang, L.; Cheng, B.; Yu, J. Direct Z-Scheme TiO2/NiS Core–Shell Hybrid Nanofibers with Enhanced Photocatalytic H2-Production Activity. ACS Sustain. Chem. Eng. 2018, 6, 12291–12298. [Google Scholar] [CrossRef]
- Zhu, H.; Zhang, J.; Yanzhang, R.; Du, M.; Wang, Q.; Gao, G.; Wu, J.; Wu, G.; Zhang, M.; Liu, B.; et al. When Cubic Cobalt Sulfide Meets Layered Molybdenum Disulfide: A Core–Shell System Toward Synergetic Electrocatalytic Water Splitting. Adv. Mater. 2015, 27, 4752–4759. [Google Scholar] [CrossRef] [PubMed]
- Bredar, A.R.C.; Chown, A.L.; Burton, A.R.; Farnum, B.H. Electrochemical Impedance Spectroscopy of Metal Oxide Electrodes for Energy Applications. ACS Appl. Energy Mater. 2020, 3, 66–98. [Google Scholar] [CrossRef]


| Samples | BET Surface Area (m²/g) | Adsorption-Average Pore Width BET (nm) | Pore Size Distribution (nm) |
|---|---|---|---|
| TiO2-GC | 101 | 2.66 | Bimodal: 4 nm–11 nm |
| TiO₂-CoN0.25-GC | 112 | 4.85 | Bimodal: 3.5 nm–5 nm |
| TiO₂-CoN0.5-GC | 126 | 4.27 | Unimodal: 3.5 nm |
| TiO2-GB | 31 | 4.95 | Bimodal: 4 nm–60 nm |
| TiO₂-CoN0.25-GB | 91 | 4.56 | Bimodal: 3.5 nm–5 nm |
| TiO₂-CoN0.5-GB | 97 | 4.86 | Unimodal: 3.5 nm |
| TiO2-BIO | 16 | 8.77 | Bimodal: 3 nm–9 nm |
| TiO₂-CoN0.25-BIO | 88 | 5.82 | Bimodal: 3.5 nm–5 nm |
| TiO₂-CoN0.5-BIO | 126 | 4.07 | Unimodal: 3 nm |
Disclaimer/Publisher’s Note: The statements, opinions and data contained in all publications are solely those of the individual author(s) and contributor(s) and not of MDPI and/or the editor(s). MDPI and/or the editor(s) disclaim responsibility for any injury to people or property resulting from any ideas, methods, instructions or products referred to in the content. |
© 2023 by the authors. Licensee MDPI, Basel, Switzerland. This article is an open access article distributed under the terms and conditions of the Creative Commons Attribution (CC BY) license (https://creativecommons.org/licenses/by/4.0/).
Share and Cite
Duquet, F.; Flaud, V.; Villeneuve-Faure, C.; Rivallin, M.; Rouessac, F.; Roualdès, S. Hybrid Photoelectrocatalytic TiO2-Co3O4/Co(OH)2 Materials Prepared from Bio-Based Surfactants for Water Splitting. Molecules 2023, 28, 7599. https://doi.org/10.3390/molecules28227599
Duquet F, Flaud V, Villeneuve-Faure C, Rivallin M, Rouessac F, Roualdès S. Hybrid Photoelectrocatalytic TiO2-Co3O4/Co(OH)2 Materials Prepared from Bio-Based Surfactants for Water Splitting. Molecules. 2023; 28(22):7599. https://doi.org/10.3390/molecules28227599
Chicago/Turabian StyleDuquet, Fanny, Valérie Flaud, Christina Villeneuve-Faure, Matthieu Rivallin, Florence Rouessac, and Stéphanie Roualdès. 2023. "Hybrid Photoelectrocatalytic TiO2-Co3O4/Co(OH)2 Materials Prepared from Bio-Based Surfactants for Water Splitting" Molecules 28, no. 22: 7599. https://doi.org/10.3390/molecules28227599