Article

Elucidating the Role of Surface Ce4+ and Oxygen Vacancies of CeO2 in the Direct Synthesis of Dimethyl Carbonate from CO2 and Methanol

1
Department of Food Science and Engineering, Moutai Institute, Renhuai 564502, China
2
Experimental Training Teaching Center, Moutai Institute, Renhuai 564502, China
*
Authors to whom correspondence should be addressed.
Molecules 2023, 28(9), 3785; https://doi.org/10.3390/molecules28093785
Submission received: 8 March 2023 / Revised: 19 April 2023 / Accepted: 26 April 2023 / Published: 28 April 2023

Abstract

:
Cerium dioxide (CeO2) was pretreated with reduction and reoxidation under different conditions in order to elucidate the role of surface Ce4+ and oxygen vacancies in the catalytic activity for direct synthesis of dimethyl carbonate (DMC) from CO2 and methanol. The corresponding catalysts were comprehensively characterized using N2 physisorption, XRD, TEM, XPS, TPD, and CO2-FTIR. The results indicated that reduction treatment promotes the conversion of Ce4+ to Ce3+ and improves the concentration of surface oxygen vacancies, while reoxidation treatment facilitates the conversion of Ce3+ to Ce4+ and decreases the concentration of surface oxygen vacancies. The catalytic activity was linear with the number of moderate acidic/basic sites. The surface Ce4+ rather than oxygen vacancies, as Lewis acid sites, promoted the adsorption of CO2 and the formation of active bidentate carbonates. The number of moderate basic sites and the catalytic activity were positively correlated with the surface concentration of Ce4+ but negatively correlated with the surface concentration of oxygen vacancies. The surface Ce4+ and lattice oxygen were active Lewis acid and base sites respectively for CeO2 catalyst, while surface oxygen vacancy and lattice oxygen were active Lewis acid and base sites, respectively, for metal-doped CeO2 catalysts. This may result from the different natures of oxygen vacancies in CeO2 and metal-doped CeO2 catalysts.

Graphical Abstract

1. Introduction

The emission of CO2 into the earth’s atmosphere is continuously increasing with the growing burning of fossil fuels and industrial activities. For example, about 33,890.80 million tons of CO2 was emitted into the atmosphere in 2018. The global CO2 concentration in the atmosphere reached 407.65 ppm in September 2019, which is about 1.2 times as high as that of the past 40 years [1]. According to the earth’s CO2, the concentration of CO2 further increased to 416.47 ppm on 30 May 2020 [2]. The dramatically increased CO2 emission results in severe climate change, which brings about a series of issues in terms of ecology, economy, and the environment. Taking these facts into consideration, it is necessary to develop effective approaches to mitigate CO2 emission.
As an important part of carbon dioxide capture, utilization, and storage (CCUS), the chemical transformation of CO2 to fuels and value-added chemicals can not only alleviate CO2 emission but also reduce the dependence on fossil resources, which is of great significance for the sustainable development of energy, the environment, and the economy. Dimethyl carbonate (DMC), as one of the downstream products of methanol, is considered a green chemical, which has been widely applied as an intermediate for organic synthesis, an electrolyte for lithium-ion batteries, and a raw material for the synthesis of polycarbonate [3]. Among various synthesis approaches, the direct synthesis of DMC from CO2 and methanol is deemed a green route due to the beneficial environment impact and high atomic use [4].
Although this reaction suffers from low DMC yield due to the thermodynamic limit, a significant endeavor has been made to develop effective catalysts, such as supported catalysts, alkali carbonate catalysts, ionic liquid catalysts, heteropoly acid catalysts, and transition metal oxide catalysts [4,5]. Transition metal oxides, especially ZrO2 and CeO2, have attracted tremendous attention in recent years due to their promising catalytic activity. Fujimoto et al. [6] first reported that ZrO2 can catalyze CO2 and methanol to DMC, and the catalytic activity was closely related to the surface basic and acidic sites.
Bell et al. [7] further studied the reaction mechanism over ZrO2 using in situ infrared spectra. The results revealed that surface coordinately unsaturated Zr4+ cations, such as Lewis acid sites, promote the dissociation of methanol to methoxide (–OCH3) and a proton, which can react with the surface hydroxyl group to produce water. Next, bidentate carbonates were formed by the interaction of C and O atoms in CO2 with surface Lewis acid–base pairs (Zr4+–O2−), which were subsequently inserted into –OCH3 and formed monodentate methyl carbonate (MMC) intermediate species. Finally, the MMC species reacted with methyl (–CH3) from the dissociation of methanol on Lewis base sites (O2−) to produce DMC [7]. In this regard, the improvement of surface acidic and basic sites is beneficial for the catalytic activity. For example, Xiao et al. [8] found that the doping of Fe into ZrO2 can significantly improve the surface acidic and basic sites, and the catalytic activity was positively correlated with surface acidic and basic sites.
Compared with ZrO2, CeO2 shows much higher catalytic activity and thus receives much more attention. For example, Marin et al. [9] studied the kinetic and reaction mechanism over a CeO2 catalyst, and the results showed that the reaction follows the Langmuir–Hinshelwood mechanism, in which the adsorption of CO2 is considered the rate-determining step. Wang et al. [10] reported that the catalytic activity of CeO2 is closely related to the corresponding morphology, and CeO2 nanorods showed much higher catalytic activity than that of the cube and octahedron due to the exposure of more acidic and basic sites. A further study of the morphology effect was performed with in situ infrared spectra. The results indicated that the (110) facet of CeO2 nanorods promotes the formation of bidentate carbonates that can react with –OCH3 to form MMC. However, other carbonates, such as monodentate carbonates, bicarbonates, and bridged carbonates, cannot accomplish that process, and therefore, the bidentate carbonates were identified as active species in terms of CO2 adsorption [11]. In addition, doping the metal cation of Ca2+ [12], Zn2+ [13,14], Mn2+ [15], Ti4+ [16], Fe3+ [17], Co4+ [18], and Zr4+ [19,20] into the lattice of CeO2 promotes the formation of oxygen vacancies (OV) and is also proven to be an efficient strategy to improve catalytic activity. The results of in situ infrared spectra over the Zr–CeO2 catalyst demonstrated that OV promote the formation of bidentate carbonates via the interaction of C and O atoms in CO2 with surface Lewis acid–base pairs (OV–O2−), in which one of the O atoms in CO2 is inserted into OV [19]. Therefore, both the amount of adsorbed CO2 and the catalytic activity increase with the increasing concentration of OV [12,13,14,15,16,17,18,19,20].
It is obvious that two different Lewis acid–base pairs, Zr4+–O2− and OV–O2−, are considered active sites in ZrO2 and metal-doped CeO2 catalysts, respectively. However, of Ce4+ and OV, which one is catalytically active in CeO2 catalysts? Is the formation of OV in CeO2 catalysts beneficial to the catalytic activity as in metal-doped CeO2 catalysts? The answers to these two questions are of prominent significance to the design of an effective catalyst. Inspired by this, the surface concentrations of Ce4+ and OV were regulated via reduction and reoxidation of CeO2 under different conditions in this work. Combining XRD, TEM, XPS, CO2-TPD, NH3-TPD, and CO2-FTIR results, the role of surface Ce4+ and OV in the adsorption of CO2 and the catalytic activity for DMC synthesis from CO2 and methanol were deeply elucidated. The possible influence of two types of OV on the adsorption and activation of CO2 was also proposed.

2. Results

2.1. Textural Properties of Catalysts

The N2 adsorption–desorption isotherms of CeO2 treated under different conditions are shown in Figure 1. All the samples showed the type IV isotherm with a distinct hysteresis loop, indicating the presence of a mesopore.
The detailed texture parameters are listed in Table 1. As seen in Table 1, the specific surface area and pore volume of CeO2 gradually decreased with an increase in the reduction temperature; however, the pore size of CeO2 presented the opposite trend, which suggests that the mesopore originated from the piled pore. This phenomenon may arise from the aggregation of CeO2 particles induced by high temperature [21]. In contrast, as CeO2–H550 and CeO2–H750 were reoxidized under an air atmosphere at 350 °C, 450 °C, and 550 °C, the texture parameters did not change so much.

2.2. XRD Analysis of Catalysts

XRD characterization was performed to analyze the crystal structure of CeO2, and the results are presented in Figure 2. All the samples displayed the characteristic diffraction peaks of a cubic fluorite structure (JCPDS no. 65-5923), and the peaks at 28.5°, 33.0°, 47.5°, 56.5°, 59.4°, and 69.6° were ascribed to the (111), (200), (220), (311), (222), and (400) crystal facets of CeO2, respectively [19].
As seen in Figure 2A, the intensity and width of the characteristic diffraction peaks of CeO2 did not change obviously as the reduction temperature decreased below 550 °C, indicating the similar crystal size of CeO2, CeO2–H450, and CeO2–H550. However, as the reduction temperature increased beyond 550 °C, the peak intensity was gradually enhanced and the peak width gradually narrowed, indicating the gradually increasing crystal size. The crystal size of each catalyst is presented in Table 2, which was calculated using the Scherrer equation as follows: D = Kλ/[(βb)cosθ], where K is the Scherrer constant (0.89), λ is 0.15414 nm (the wavelength of Cu Kα radiation), β is the full width at half-maximum of the CeO2(111) diffraction peak, b is the corrected full width at half-maximum of the instrument, and θ is the diffraction angle [22].
As seen in Table 2, similar crystal sizes of about 7~8 nm were observed for CeO2, CeO2–H450, and CeO2–H550. However, the crystal sizes significantly increased from 7.4 to 46.6 nm with an increase in the reduction temperature from 550 °C to 800 °C, which resulted from the aggregation of CeO2 particles [21,23,24]. In addition, the crystal sizes of CeO2–H550 remained basically about 7~8 nm after reoxidation treatment, while those of CeO2–H750 remained basically about 30 nm after reoxidation treatment. These results revealed that reoxidation treatment does not obviously affect the crystal sizes of CeO2.

2.3. TEM of Catalysts

TEM was used to characterize the morphology of catalysts. As seen in Figure 3, the morphology of catalysts was irregular, including being polyhedron- and rodlike. The particle size of CeO2, CeO2–H450, CeO2–H550, CeO2–H550–O350, CeO2–H550–O450, and CeO2–H550–O550 seemed almost the same. The possible reason may be that the starting material of CeO2 was already calcinated at 550 °C for 5 h in a muffle furnace before reduction and reoxidation treatment. However, the particles significantly aggregated with increasing reduction temperature as the reduction temperature increased beyond 550 °C. In addition, reoxidation treatment did not obviously affect the particle sizes of the catalysts. This was consistent with the results of XRD.
HRTEM was used to further characterize the exposed facet of catalysts, as shown in Figure 4. The observed lattice fringes of about 0.31 and 0.27 nm corresponded to the (111) and (200) facets of CeO2. Obviously, the main exposed facet was (111), and the (200) facet only appeared in CeO2–H650 and CeO2–H750–O550, which was in line with our previous studies [15,19]. These results also indicated that the reduction temperature and reoxidation treatment do not apparently affect the exposed facet of catalysts.

2.4. Surface Composition Analysis of Catalysts

XPS characterization was performed to analyze the chemical state of the surface Ce and O of catalysts, as shown in Figure 5. After gaussian fitting, the Ce 3D spectra could be fitted into eight peaks: U‴(~916.3 eV), U″(~907.4 eV), U′(~903.3 eV), U(~900.6 eV), V‴(~898.0 eV), V″(~888.4 eV), V′(~884.9 eV), and V(~882.1 eV) [16].
In the O 1s spectra, the peaks at ~529.0 eV, ~530.5 eV, and ~531.5 eV were assigned to the surface lattice oxygen (OL), oxygen vacancies (OV), and chemisorbed oxygen species (OC), respectively [25,26]. The surface concentration of OV was calculated based on the peak area from gaussian fitting, and the results are listed in Table 3.
As seen in Table 3, the concentration of Ce3+ gradually increased from 13.5 to 17.7% as the reduction temperature increased to 800 °C, while that of Ce4+ gradually decreased from 86.5 to 82.3%. Moreover, the concentration of OV also increased with an increase in the reduction temperature. These results were consistent with the work reported by our group and Chen et al. that the percentage of Ce3+ is positively correlated with that of OV [16,19]. In addition, the concentrations of Ce3+ and OV decreased for CeO2–H550 and CeO2–H750 after reoxidation treatment.
The concentration of the surface OV of CeO2 is closely related to the calcination atmosphere, oxygen partial pressure, and calcination temperature [27]. The formation of OV is accomplished through the diffusion of lattice oxygen to the environment, where the content of oxygen is low. Under these circumstances, an oxygen vacancy is a kind of anionic defect. When CeO2 was exposed to the reductive H2 atmosphere, the lattice oxygen reacted with H2 and formed H2O and therefore promoted the formation of OV; moreover, the promoting effect gradually strengthened with increasing reduction temperature. It should be noted that two surplus electrons would be retained in the crystal structure of CeO2 accompanied with the formation of OV, and the two surplus electrons can bind with two adjacent Ce4+, resulting in the conversion of Ce4+ to Ce3+. Moreover, the two electrons were mobile that could migrate between two adjacent Ce ions. In other words, the two quasi-free mobile electrons were trapped around the anionic defect (OV), which could migrate between adjacent Ce ions and cause electron conduction. A material with this kind of defect is an N-type semiconductor [28]. The O atoms were reinserted back into OV and formed OL when CeO2–H550 and CeO2–H750 were reoxidized under an air atmosphere. In this process, the trapped electrons around OV were transferred to O atoms, and the conversion of Ce3+ to Ce4+ occurred simultaneously. Singhal et al. [29] also found that the conversion between OV and OL is reversible to some extent.
Furthermore, as shown in Figure S1, the color of CeO2 gradually changed from yellow to brown and finally to gray-black with the increase in the reduction temperature, and the color changed back to yellow to a certain degree when CeO2–H550 and CeO2–H750 were reoxidized under an air atmosphere. This is because the trapped electrons around OV can absorb light with a certain wavelength and the absorption capacity is gradually enhanced with the increasing number of electrons or OV [21,29]. This result also indicated that reduction treatment is favorable for the formation of OV, while reoxidation treatment plays the opposite role.

2.5. Surface Acidity and Basicity Analysis of Catalysts

The surface acidity and basicity of catalysts were characterized using NH3-TPD and CO2-TPD, as shown in Figure 6 and Figure 7, and the detailed results are listed in Table 4. The desorption peaks in the temperature region of 50~200, 200~400, and 400~600 °C in CO2-TPD and NH3TPD profiles were attributed to the weak acidic/basic, moderate acidic/basic, and strong acidic/basic sites, respectively [30]. Studies have reported that weak basic sites are mainly ascribed to surface –OH groups, which react with CO2 and form bicarbonates [31,32]. The moderate basic sites were derived from the Ce–OL or OV–OL ion pairs, which combined with CO2 and promoted the formation of bridged and bidentate carbonates [8,19,32], while the strong basic sites were mainly assigned to the low-coordination oxygen anions [8,31,32], which resulted in the formation of stable monodentate carbonates [33].
Overall, the surface acidic sites with different natures all decreased with an increase in the reduction temperature and increased with an increase in the reoxidation temperature (Figure 6 and Table 4). A similar trend was observed for the surface basic sites under various treatment conditions (Figure 7 and Table 4). A possible reason for the change in surface acidity and basicity is discussed in Section 3.2.

2.6. Measurement of Catalytic Activity

The DMC yields of CeO2 treated under different conditions are displayed in Figure 8. As seen in Figure 8A, the DMC yield of CeO2 gradually decreased from 9.02 to 1.75 mmol/g as the reduction temperature increased to 800 °C. However, as seen in Figure 8B,C, the DMC yield of CeO2–H550 and CeO2–H750 gradually increased from 6.94 and 2.85 to 7.98 and 4.21 mmol/g, respectively, as the reoxidation temperature increased to 550 °C. These results indicated that reduction treatment is detrimental to the improvement of catalytic activity but reoxidation treatment is beneficial.

3. Discussion

3.1. The Relationship between Catalytic Activity and Surface Acidity/Basicity

Surface basicity and acidity play a significant role in determining the catalytic activity of CeO2-based catalysts. Wang et al. [11] found that only bidentate carbonates can react with surface –OCH3 originating from the dissociation of methanol and form MMC, which is considered an active intermediate species for the formation of DMC, while monodentate carbonates, bicarbonates, and bridged carbonates cannot accomplish this process. Inumaru et al. [34] also found that the catalytic activity of ZrO2 nanocrystals is closely related to the surface bidentate carbonate species. As discussed in Section 2.4, bidentate carbonates were derived from the interaction of CO2 with moderate basic sites. In addition, surface acidic sites significantly affected the adsorption and activation of methanol. Studies have reported that methanol is adsorbed and dissociated on acid sites and forms –OCH3 groups, which participate in the formation of MMC [7,19,35]. Xiao et al. [8] revealed that catalytic activity is positively correlated with the moderate surface acidic/basic sites of Fe–Zr composite catalysts. Taking these findings into account, it is reasonable to build a relationship between catalytic activity and moderate surface acidic/basic sites. As shown in Figure 9A,B, catalytic activity was positively correlated with the number of moderate surface acid and basic sites (determined from NH3-TPD and CO2TPD profiles) of CeO2 catalysts.

3.2. Deep Insight into the Role of Ce4+ and OV

Marin et al. [9] reported that conversion of CO2 and methanol to DMC over a CeO2 catalyst follows a Langmuir–Hinshelwood mechanism, with the CO2 adsorption step being rate controlling. However, there are two different theories about the adsorption and activation of CO2 for CeO2-based catalysts. One is that surface coordination unsaturated Ce4+ ions and OL serve as Lewis acid–base pairs to promote the adsorption and activation of CO2 [7,36,37]. The other is that surface OV and OL serve as Lewis acid–base pairs to promote the adsorption and activation of CO2. Especially for metal-doped CeO2 catalysts, it was found that one of the O atoms of CO2 can be inserted into OV and thus promotes the adsorption and activation of CO2, and therefore, the adsorption of CO2 improves with an increase in surface OV [12,15,19]. Obviously, the focus was that of Ce4+ or OV, which Lewis acid sites determine the adsorption and activation of CO2 for CeO2 catalysts?
XPS results showed that reduction treatment results in a decrease in surface Ce4+ and an increase in OV. In contrast, reoxidation treatment resulted in a decrease in surface OV and an increase in Ce4+. Combining XPS and CO2-TPD results, it was apparent that the adsorption amount of CO2 and the concentration of Ce4+ showed a similar trend under various treatment conditions. Moreover, combining XPS and NH3TPD results, we found that the adsorption amount of NH3 and the concentration of Ce4+ shows a similar trend under various treatment conditions. These results indicated that surface Ce4+ serves as active Lewis acid sites to adsorb and activate CO2 and methanol molecules.
Nevertheless, it should be noted that the particle size of CeO2 can also affect the adsorption of CO2 and NH3. For example, as the reduction temperature increased beyond 550 °C, the aggregation of CeO2 particles occurred (Table 2 and Figure 3), which can also result in decreased adsorption of CO2 and NH3.
The profiles of the DMC yield for catalysts treated under different conditions with a change in the concentration of Ce4+ and OV are presented in Figure 10 and Figure 11, respectively.
It was obvious that the catalytic activity increased with the increasing concentration of Ce4+, while it decreased with the increasing concentration of OV. Nevertheless, as discussed before, treatment conditions greatly affected the particle size of CeO2, as presented in Table 2 and Figure 3. Generally, a particle with a smaller size is conducive to the exposure of more active sites and thus improves the adsorption of the reactant and catalytic activity [38]. To eliminate the particle size effect, CeO2, CeO2–H450, CeO2–H550, CeO2–H550–O350, CeO2–H550–O450, and CeO2–H550–O550 catalysts (with similar crystal size of about 7~8 nm and basically an unchanged particle size) were selected to correlate the number of moderate basic sites as well as catalytic activity with the concentration of Ce4+ and OV. As shown in Figure 12, the number of moderate basic sites as well as catalytic activity were positively correlated with the concentration of surface Ce4+ but negatively correlated with that of OV.
To further confirm the role of surface Ce4+ in the formation of active bidentate carbonates, FTIR spectra of CO2 adsorption for CeO2, CeO2–H550, and CeO2–H550–O550 were developed, and the results are displayed in Figure 13. The bands at 1215, 1393, and 1610 cm−1 were associated with bicarbonates, while the bands at 856, 1033, 1293, and 1581 cm−1 were ascribed to bidentate carbonates [11,19]. In addition, the small bands at 1242 and 1652 cm−1 were attributed to bridged carbonates, while the small bands at 1356 and 1466 cm−1 were assigned to monodentate carbonates [11,19]. Obviously, the peak intensity and area of bidentate carbonates decreased after reduction treatment and increased after reoxidation treatment. These results strongly supported the fact that the surface Ce4+ of CeO2 serves as active Lewis acid sites and promotes the adsorption of CO2 and the formation of bidentate carbonates and thus catalytic activity for the synthesis of DMC from CO2 and methanol.
Why OV played an opposite role in the adsorption of CO2 for pure CeO2 and metal-doped CeO2 catalytic systems is thought provoking. This may be because OV has a different nature in pure CeO2 and metal-doped CeO2 catalysts. As discussed in Section 2.3, the OV formed by H2 reduction are a kind of anionic defect, and a material with this kind of defect is an N-type semiconductor [28]. The possible reason is that the quasi-free mobile electrons around OV impede the adsorption and activation of CO2, and therefore, the catalytic activity decreases with an increase in OV. This was consistent with the results reported by Tan et al. that the catalytic activity of CeO2 prepared under different atmospheres follows the order CeO2–O2 > CeO2–Ar > CeO2–air > CeO2–H2; especially, the catalytic activity of CeO2–O2 was 2.5 times as high as that of CeO2–H2 [27]. However, for metal-doped CeO2 catalysts, the OV derived from the incorporation of metal ions (for example, Ca2+, Zn2+, Mn2+, Ti4+, and Zr4+) into the lattice of CeO2 is a kind of cationic defect, and a material with this kind of defect is a P-type semiconductor[39,40]. This kind of cationic defect (OV) is beneficial for the adsorption and activation of CO2, and thus, the catalytic activity increases with an increase in OV [12,13,15,16,19]. The possible influence of two types of OV on the adsorption and activation of CO2 is shown in Figure 14.
It is interesting that similar phenomena have also been observed during the conversion of syngas to light olefins over ZrCeZnOx catalysts [41,42]. It was found that the incorporation of Ce3+ into Zn–Zr oxide improves the percentage of OV and thus catalytic activity [42]; however, the catalytic activity of ZrCeZnOx decreased after reduction with H2, although the percentage of OV improved significantly [41]. This indicated that the types of OV remarkably affects the adsorption of CO and therefore catalytic activity.

4. Materials and Methods

4.1. Preparation of CeO2

First, 3.47 g of Ce(NO3)3·6H2O was dissolved in 30 mL of deionized water. Next, 100 mL of NaOH solution (2 mol/L) was added to the solution of Ce(NO3)3 with a constant-flux pump under stirring. After aging for 1 h at ambient temperatures, the slurry was filtered and washed with deionized water and ethanol several times until it became neutral. Finally, the products were dried for 12 h at 80 °C and then calcinated for 5 h at 550 °C in a muffle furnace. The resultant catalyst was labeled as CeO2 and used as a starting material for further treatment.

4.2. Reduction Treatment of CeO2

Typically, 0.25 g of CeO2 was placed in a tube furnace, and then, the temperature was increased to 450, 550, 600, 650, 700, 750, and 800 °C under 10a % H2–N2 atmosphere for 4 h at a heating rate of 5 °C/min. The obtained catalysts were named as CeO2–HT1, where T1 is the reduction temperature.

4.3. Reoxidation Treatment of CeO2–H550 and CeO2–H750

Typically, 0.2 g of CeO2–H550 or CeO2–H750 was placed in a muffle furnace, and then, the temperature was increased to 350, 450 and 550 °C under an air atmosphere for 4 h at a heating rate of 2 °C/min. The obtained catalysts were named as CeO2–H550–OT2 or CeO2–H750–OT2, where T2 is the reoxidation temperature.

4.4. Characterization of Supports and Catalysts

N2 physisorption was performed on a Beishide 3H-2000PS2 instrument at −196 °C using N2 as an adsorbate. The sample was outgassed at 250 °C for 4 h in vacuum to remove the physisorbed impurities before measurement. The specific surface area and pore volume were calculated using the BET and BIH methods, respectively.
XRD characterization was carried out on a Rigaku SmartLab SE diffractometer (40 kV, 40 mA) with a diffraction angle (2θ) from 10 to 80° and a scanning rate of 10°/min.
TEM images were taken with FEI Tecnai F30 at 200 kV. Before measurement, the sample was first dispersed in ethanol, then ultrasonicated for 30 min, and finally deposited on a carbon-coated copper film.
TPD characterization was performed on Micromeritics Autochem 2920. First, 100 mg of the sample was degassed for 30 min at 250 °C with N2 (30 mL/min) to remove the physisorbed impurities. After the temperature was cooled down to 50 °C, 15% NH3 in He (30 mL/min) or pure CO2 (30 mL/min) was introduced and maintained for 30 min to allow saturated adsorption of NH3 and CO2. Subsequently, the physisorbed substance was removed with He (30 mL/min) at 50 °C for 30 min. Thereafter, the temperature was gradually increased to 800 °C at a heating rate of 10 °C/min with He as a carrier gas (30 mL/min), and the desorbed NH3 and CO2 were detected with TCD.
XPS spectra were analyzed with an ESCALAB 250Xi (Thermo Scientific, Waltham, MA, USA) photoelectron spectrometer under AlKα radiation at 300 W. The binding energies were referred to the C1s line from adventitious carbon at 284.6 eV.
CO2-FTIR spectra were recorded using a Bruker Tensor II instrument equipped with an MCT detector by collecting 64 scans at a resolution of 4 cm−1. About 20 mg of the sample was loaded into the cell and then pretreated under He flow (30 mL/min) at 400 °C for 1 h to remove the physisorbed impurities. After the temperature dropped down to 140 °C (reaction temperature), pure CO2 (30 mL/min) was introduced and maintained for 30 min to allow saturated adsorption of CO2. Subsequently, the physisorbed substance was removed with He (30 mL/min) for 30 min, and then, FTIR spectra were recorded.

4.5. Catalytic Evaluation

The catalytic activity of catalysts for DMC synthesis from CO2 and methanol was investigated in a 250 mL high-pressure slurry-bed reactor equipped with a mechanical stirrer. Typically, 0.2 g of a catalyst and 30 mL of methanol were placed into the reactor, which was subsequently sealed. Next, the reactor was filled with CO2 several times to check the tightness and remove air. Thereafter, the reactor was pressurized with CO2 to 3 MPa at ambient temperatures, and then, the reaction temperature was increased to 140 °C and maintained for 4 h. After the reaction finished, the reactor was depressurized and cooled down to room temperature. The liquid product was analyzed with n-propanol as an internal standard substance using a gas chromatograph (FID-GC, O Hua 9160). It should be noted that no by-products were formed except DMC, and the yield of DMC was defined as follows:
Y DMC mmol / g = n DMC ( mmol ) / m catalyst ( g )

5. Conclusions

(1)
The concentrations of surface Ce4+ and oxygen vacancies of CeO2 were regulated with reduction and reoxidation treatments under different conditions. The reduction treatment promoted the conversion of Ce4+ to Ce3+ and improved the surface concentration of oxygen vacancies, while the reoxidation treatment favored the conversion of Ce3+ to Ce4+ and decreased the concentration of oxygen vacancies.
(2)
Catalytic activity was positively correlated with the number of moderate surface acidic/basic sites of catalysts. Moreover, the number of moderate basic sites and catalytic activity were positively correlated with the surface concentration of Ce4+ but negatively correlated with that of oxygen vacancies.
(3)
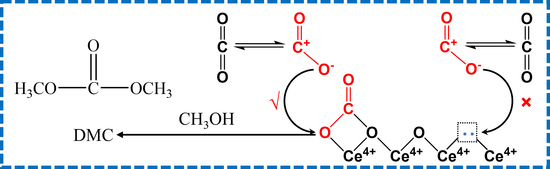
The surface Ce4+ rather than oxygen vacancies served as active Lewis acid sites, and lattice oxygen served as active Lewis base sites to adsorb and activate CO2, promoting the formation of active bidentate carbonates species and DMC.
(4)
The cationic oxygen vacancy was beneficial but the anionic oxygen vacancy was detrimental to the formation of active bidentate carbonates species and DMC, which sheds light upon the active sites for CeO2 and metal-doped CeO2 catalysts and provides evidence for the design of efficient catalysts.

Supplementary Materials

The following supporting information can be downloaded at https://www.mdpi.com/article/10.3390/molecules28093785/s1, Figure S1: Change in the color of catalysts.

Author Contributions

Conceptualization, H.Z. and G.Z.; methodology, Y.Z.; software, S.Z.; formal analysis, Y.S.; investigation, Y.Y. and T.K.; data curation, G.Z.; writing—review and editing, G.Z. and H.Z.; supervision, H.Z.; funding acquisition, H.Z. and G.Z. All authors have read and agreed to the published version of the manuscript.

Funding

This research was funded by the National Natural Science Foundation of China (22262020); the Guizhou Provincial Basic Research Program (Natural Science; ZK[2023]YB448 and ZK[2023]YB447); the Zunyi Technology and Big data Bureau, Moutai Institute Joint Science and Technology Research and Development Project ([2021]328); and the Research Foundation for Scientific Scholars of Moutai Institute (mygccrc [2022]080 and [2022]081).

Data Availability Statement

All the relevant data used in this study have been provided in the form of figures and tables in the published article, and all data provided in the manuscript are available to whom they may concern.

Acknowledgments

The authors are grateful to Zhong Li, Nilesh Narkhede, and Yuchen Sun for their kind academic discussion and language help.

Conflicts of Interest

The authors declare no conflict of interest.

References

  1. Jiang, X.; Nie, X.; Guo, X.; Song, C.; Chen, J.G. Recent Advances in Carbon Dioxide Hydrogenation to Methanol via Heterogeneous Catalysis. Chem. Rev. 2020, 120, 7984–8034. [Google Scholar] [CrossRef] [PubMed]
  2. Rogelj, J.; Huppmann, D.; Krey, V.; Riahi, K.; Clarke, L.; Gidden, M.; Nicholls, Z.; Meinshausen, M. A new scenario logic for the Paris Agreement long-term temperature goal. Nature 2019, 573, 357–363. [Google Scholar] [CrossRef] [PubMed]
  3. Huang, S.; Yan, B.; Wang, S.; Ma, X. Recent advances in dialkyl carbonates synthesis and applications. Chem. Soc. Rev. 2015, 44, 3079–3116. [Google Scholar] [CrossRef]
  4. Zhang, M.; Xu, Y.; Williams, B.L.; Xiao, M.; Wang, S.; Han, D.; Sun, L.; Meng, Y. Catalytic materials for direct synthesis of dimethyl carbonate (DMC) from CO2. J. Clean. Prod. 2021, 279, 123344. [Google Scholar] [CrossRef]
  5. Tamboli, A.H.; Chaugule, A.A.; Kim, H. Catalytic developments in the direct dimethyl carbonate synthesis from carbon dioxide and methanol. Chem. Eng. J. 2017, 323, 530–544. [Google Scholar] [CrossRef]
  6. Tomishige, K.; Sakaihori, T.; Ikeda, Y.; Fujimoto, K. A novel method of direct synthesis of dimethyl carbonate from methanol and carbon dioxide catalyzed by zirconia. Catal. Lett. 1999, 58, 225–229. [Google Scholar] [CrossRef]
  7. Jung, K.T.; Bell, A.T. An in Situ Infrared Study of Dimethyl Carbonate Synthesis from Carbon Dioxide and Methanol over Zirconia. J. Catal. 2001, 204, 339–347. [Google Scholar] [CrossRef]
  8. Li, A.; Pu, Y.; Li, F.; Luo, J.; Zhao, N.; Xiao, F. Synthesis of dimethyl carbonate from methanol and CO2 over Fe-Zr mixed oxides. J. CO2 Util. 2017, 19, 33–39. [Google Scholar] [CrossRef]
  9. Marin, C.M.; Li, L.; Bhalkikar, A.; Doyle, J.E.; Zeng, X.C.; Cheung, C.L. Kinetic and mechanistic investigations of the direct synthesis of dimethyl carbonate from carbon dioxide over ceria nanorod catalysts. J. Catal. 2016, 340, 295–301. [Google Scholar] [CrossRef]
  10. Wang, S.-P.; Zhou, J.-J.; Zhao, S.-Y.; Zhao, Y.-J.; Ma, X.-B. Enhancements of dimethyl carbonate synthesis from methanol and carbon dioxide: The in situ hydrolysis of 2-cyanopyridine and crystal face effect of ceria. Chin. Chem. Lett. 2015, 26, 1096–1100. [Google Scholar] [CrossRef]
  11. Zhao, S.-Y.; Wang, S.-P.; Zhao, Y.-J.; Ma, X.-B. An in situ infrared study of dimethyl carbonate synthesis from carbon dioxide and methanol over well-shaped CeO2. Chin. Chem. Lett. 2017, 28, 65–69. [Google Scholar] [CrossRef]
  12. Liu, B.; Li, C.M.; Zhang, G.Q.; Yan, L.F.; Li, Z. Direct synthesis of dimethyl carbonate from CO2 and methanol over CaO-CeO2 catalysts: The role of acid-base properties and surface oxygen vacancies. New J. Chem. 2017, 41, 12231–12240. [Google Scholar] [CrossRef]
  13. Chen, Y.; Tang, Q.; Ye, Z.; Li, Y.; Yang, Y.; Pu, H.; Li, G. Monolithic ZnxCe1-xO2 catalysts for catalytic synthesis of dimethyl carbonate from CO2 and methanol. New J. Chem. 2020, 44, 12522–12530. [Google Scholar] [CrossRef]
  14. Liu, N.; Xue, Y.; Yu, Z.R.; Li, Y.Y.; Xu, Y.; Xu, J.; Xue, B.; Luo, J.; Wang, F. Zn-Doped CeO2 Nanorods: A Highly Efficient Heterogeneous Catalyst for the Direct Synthesis of Dimethyl Carbonate from CO2 and Methanol. Chemistryselect 2023, 8, e202203472. [Google Scholar] [CrossRef]
  15. Zhang, G.; Sun, Y.; Shi, Y.; Zheng, H.; Li, Z.; Ju, S.; Liu, S.; Shi, P. Surface Properties of Ce1-xMnxO2 Catalyst on the Catalytic Activities for Direct Synthesis of DMC from CO2 and Methanol. Chem. J. Chin. Univ. 2020, 41, 2061–2069. [Google Scholar]
  16. Chen, Y.; Wang, H.; Qin, Z.; Tian, S.; Ye, Z.; Ye, L.; Abroshan, H.; Li, G. TixCe1-xO2 nanocomposites: A monolithic catalyst for the direct conversion of carbon dioxide and methanol to dimethyl carbonate. Green Chem. 2019, 21, 4642–4649. [Google Scholar] [CrossRef]
  17. Luo, M.S.; Qin, T.; Liu, Q.L.; Yang, Z.; Wang, F.L.; Li, H. Novel Fe-modified CeO2 Nanorod Catalyst for the Dimethyl Carbonate Formation from CO2 and Methanol. ChemCatChem 2022, 14, e202200253. [Google Scholar] [CrossRef]
  18. Kulal, N.; Bhat, S.S.; Hugar, V.; Mallannavar, C.N.; Lee, S.C.; Bhattacharjee, S.; Vetrivel, R.; Shanbhag, G.V. Integrated DFT and experimental study on Co3O4/CeO2 catalyst for direct synthesis of dimethyl carbonate from CO2. J. CO2 Util. 2023, 67, 102323. [Google Scholar] [CrossRef]
  19. Liu, B.; Li, C.M.; Zhang, G.Q.; Yao, X.S.; Chuang, S.S.C.; Li, Z. Oxygen Vacancy Promoting Dimethyl Carbonate Synthesis from CO2 and Methanol over Zr-Doped CeO2 Nanorods. ACS Catal. 2018, 8, 10446–10456. [Google Scholar] [CrossRef]
  20. Xu, S.Y.; Cao, Y.X.; Liu, Z.M. Dimethyl carbonate synthesis from CO2 and methanol over CeO2-ZrO2 catalyst. Catal. Commun. 2022, 162, 106397. [Google Scholar] [CrossRef]
  21. Giordano, F.; Trovarelli, A.; de Leitenburg, C.; Giona, M. A Model for the Temperature-Programmed Reduction of Low and High Surface Area Ceria. J. Catal. 2000, 193, 273–282. [Google Scholar] [CrossRef]
  22. Hezam, A.; Namratha, K.; Drmosh, Q.A.; Ponnamma, D.; Wang, J.W.; Prasad, S.; Ahamed, M.; Cheng, C.; Byrappa, K. CeO2 Nanostructures Enriched with Oxygen Vacancies for Photocatalytic CO2 Reduction. ACS Appl. Nano Mater. 2020, 3, 138–148. [Google Scholar] [CrossRef]
  23. Yoshida, Y.; Arai, Y.; Kado, S.; Kunimori, K.; Tomishige, K. Direct synthesis of organic carbonates from the reaction of CO2 with methanol and ethanol over CeO2 catalysts. Catal. Today 2006, 115, 95–101. [Google Scholar] [CrossRef]
  24. Aneggi, E.; Wiater, D.; de Leitenburg, C.; Llorca, J.; Trovarelli, A. Shape-Dependent Activity of Ceria in Soot Combustion. ACS Catal. 2014, 4, 172–181. [Google Scholar] [CrossRef]
  25. Wang, X.; Jiang, Z.Y.; Zheng, B.J.; Xie, Z.X.; Zheng, L.S. Synthesis and shape-dependent catalytic properties of CeO2 nanocubes and truncated octahedra. Crystengcomm 2012, 14, 7579–7582. [Google Scholar] [CrossRef]
  26. Swiatowska, J.; Lair, V.; Pereira-Nabais, C.; Cote, G.; Marcus, P.; Chagnes, A. XPS, XRD and SEM characterization of a thin ceria layer deposited onto graphite electrode for application in lithium-ion batteries. Appl. Surf. Sci. 2011, 257, 9110–9119. [Google Scholar] [CrossRef]
  27. Cui, Z.; Fan, J.; Duan, H.; Zhang, J.; Xue, Y.; Tan, Y. Effect of calcination atmospheres on the catalytic performance of nano-CeO2 in direct synthesis of DMC from methanol and CO2. Korean J. Chem. Eng. 2017, 34, 29–36. [Google Scholar] [CrossRef]
  28. Xing, Y.M.; Wu, Y.; Li, L.Y.; Shi, Q.; Shi, J.; Yun, S.N.; Akbar, M.; Wang, B.Y.; Kim, J.S.; Zhu, B. Proton Shuttles in CeO2/CeO2-delta Core-Shell Structure. ACS Energy Lett. 2019, 4, 2601–2607. [Google Scholar] [CrossRef]
  29. Singhal, R.K.; Kumar, S.; Samariya, A.; Dhawan, M.; Sharma, S.C.; Xing, Y.T. Investigating the mechanism of ferromagnetic exchange interaction in non-doped CeO2 with regard to defects and electronic structure. Mater. Chem. Phys. 2012, 132, 534–539. [Google Scholar] [CrossRef]
  30. Liu, H.; Zou, W.; Xu, X.; Zhang, X.; Yang, Y.; Yue, H.; Yu, Y.; Tian, G.; Feng, S. The proportion of Ce4+ in surface of CexZr1-xO2 catalysts: The key parameter for direct carboxylation of methanol to dimethyl carbonate. J. CO2 Util. 2017, 17, 43–49. [Google Scholar] [CrossRef]
  31. Kumar, P.; Srivastava, V.C.; Glaeser, R.; With, P.; Mishra, I.M. Active ceria-calcium oxide catalysts for dimethyl carbonate synthesis by conversion of CO2. Powder Technol. 2017, 309, 13–21. [Google Scholar] [CrossRef]
  32. Leino, E.; Kumar, N.; Mäki-Arvela, P.; Rautio, A.-R.; Dahl, J.; Roine, J.; Mikkola, J.-P. Synthesis and characterization of ceria-supported catalysts for carbon dioxide transformation to diethyl carbonate. Catal. Today 2018, 306, 128–137. [Google Scholar] [CrossRef]
  33. Kumar, P.; With, P.; Srivastava, V.C.; Shukla, K.; Glaser, R.; Mishra, I.M. Dimethyl carbonate synthesis from carbon dioxide using ceria-zirconia catalysts prepared using a templating method: Characterization, parametric optimization and chemical equilibrium modeling. RSC Adv. 2016, 6, 110235–110246. [Google Scholar] [CrossRef]
  34. Akune, T.; Morita, Y.; Shirakawa, S.; Katagiri, K.; Inumaru, K. ZrO2 Nanocrystals As Catalyst for Synthesis of Dimethylcarbonate from Methanol and Carbon Dioxide: Catalytic Activity and Elucidation of Active Sites. Langmuir 2018, 34, 23–29. [Google Scholar] [CrossRef]
  35. Tomishige, K.; Ikeda, Y.; Sakaihori, T.; Fujimoto, K. Catalytic properties and structure of zirconia catalysts for direct synthesis of dimethyl carbonate from methanol and carbon dioxide. J. Catal. 2000, 192, 355–362. [Google Scholar] [CrossRef]
  36. Fan, H.-X.; Feng, J.; Li, W.-Y.; Li, X.-H.; Wiltowski, T.; Ge, Q.-F. Role of CO2 in the oxy-dehydrogenation of ethylbenzene to styrene on the CeO2(111) surface. Appl. Surf. Sci. 2018, 427, 973–980. [Google Scholar] [CrossRef]
  37. Lu, X.Q.; Wang, W.L.; Wei, S.X.; Guo, C.; Shao, Y.; Zhang, M.M.; Deng, Z.G.; Zhu, H.Y.; Guo, W.Y. Initial reduction of CO2 on perfect and O-defective CeO2 (111) surfaces: Towards CO or COOH? RSC Adv. 2015, 5, 97528–97535. [Google Scholar] [CrossRef]
  38. Bell, A.T. The Impact of Nanoscience on Heterogeneous Catalysis. Science 2003, 299, 1688–1691. [Google Scholar] [CrossRef]
  39. Schmale, K.; Daniels, M.; Buchheit, A.; Grunebaum, M.; Haase, L.; Koops, S.; Wiemhofer, H.D. Influence of Zinc Oxide on the Conductivity of Ceria. J. Electrochem. Soc. 2013, 160, F1081–F1087. [Google Scholar] [CrossRef]
  40. Buchheit, A.; Tessmer, B.; Ran, K.; Mayer, J.; Wiemofer, H.D.; Neuhaus, K. The Impact of Fe Addition on the Electronic Conductivity of Gadolinium Doped Ceria. ECS J. Solid. State Sci. Technol. 2019, 8, P41–P50. [Google Scholar] [CrossRef]
  41. Meng, F.H.; Li, X.J.; Zhang, P.; Yang, L.L.; Liu, S.S.; Li, Z. A facile approach for fabricating highly active ZrCeZnOx in combination with SAPO-34 for the conversion of syngas into light olefins. Appl. Surf. Sci. 2021, 542, 148713. [Google Scholar] [CrossRef]
  42. Meng, F.H.; Li, X.J.; Zhang, P.; Yang, L.L.; Yang, G.N.; Ma, P.C.; Li, Z. Highly active ternary oxide ZrCeZnOx combined with SAPO-34 zeolite for direct conversion of syngas into light olefins. Catal. Today 2021, 368, 118–125. [Google Scholar] [CrossRef]
Figure 1. N2 adsorption–desorption isotherms of catalysts (A) CeO2 reduced at different temperatures, (B) CeO2–H550 reoxidized at different temperatures, and (C) CeO2–H750 reoxidized at different temperatures.
Molecules 28 03785 g001
Figure 2. XRD patterns of catalysts (A) CeO2 reduced at different temperatures, (B) CeO2–H550 reoxidized at different temperatures, and (C) CeO2–H750 reoxidized at different temperatures.
Molecules 28 03785 g002
Figure 3. Representative TEM images of catalysts.
Molecules 28 03785 g003
Figure 4. Representative HRTEM images of catalysts.
Molecules 28 03785 g004
Figure 5. Ce 3d (A) and O 1s (B) XPS spectra of CeO2 reduced at different temperatures, Ce 3d (C) and O 1s (D) XPS spectra of CeO2–H550 reoxidized at different temperatures, and Ce 3d (E) and O 1s (F) XPS spectra of CeO2–H750 reoxidized at different temperatures.
Molecules 28 03785 g005
Figure 6. NH3-TPD profiles of catalysts (A) CeO2 reduced at different temperatures, (B) CeO2–H550 reoxidized at different temperatures, and (C) CeO2–H750 reoxidized at different temperatures.
Molecules 28 03785 g006
Figure 7. CO2TPD profiles of catalysts (A) CeO2 reduced at different temperatures, (B) CeO2–H550 reoxidized at different temperatures, and (C) CeO2–H750 reoxidized at different temperatures.
Molecules 28 03785 g007
Figure 8. DMC yield of catalysts (A) CeO2 reduced at different temperatures, (B) CeO2–H550 reoxidized at different temperatures, and (C) CeO2–H750 reoxidized at different temperatures.
Molecules 28 03785 g008
Figure 9. Relationships between catalytic activity and the number of moderate acidic (A) and basic (B) sites.
Molecules 28 03785 g009
Figure 10. Variation in DMC yield with the surface concentration of Ce4+: (A) CeO2 reduced at different temperatures, (B) CeO2–H550 reoxidized at different temperatures, and (C) CeO2–H750 reoxidized at different temperatures.
Molecules 28 03785 g010
Figure 11. Variation in DMC yield with the surface concentration of OV: (A) CeO2 reduced at different temperatures, (B) CeO2–H550 reoxidized at different temperatures, and (C) CeO2–H750 reoxidized at different temperatures.
Molecules 28 03785 g011
Figure 12. Correlations of the number of moderate basic sites and catalytic activity with the surface concentrations of Ce4+ (A,B) and OV (C,D).
Molecules 28 03785 g012
Figure 13. FTIR spectra of adsorbed CO2 on CeO2, CeO2–H550, and CeO2–H550–O550.
Molecules 28 03785 g013
Figure 14. Possible influence of two types of OV on the adsorption and activation of CO2.
Molecules 28 03785 g014
Table 1. Textural parameters of catalysts.
CatalystsSBET (m2·g−1)Vp (cm3/g)Pore Size (nm)
CeO2130.30.6513.8
CeO2–H450120.90.5914.6
CeO2–H550106.20.5714.6
CeO2–H65072.90.4716.9
CeO2–H75028.20.2723.1
CeO2–H80018.60.2430.7
CeO2–H550–O350107.30.5914.8
CeO2–H550–O450109.20.6414.9
CeO2–H550–O550107.80.5212.3
CeO2–H750–O35023.10.2325.1
CeO2–H750–O45026.20.2725.6
CeO2–H750–O55024.50.2423.9
Table 2. Crystal and particle size of catalysts.
CatalystsdCeO2 (nm) aCatalystsdCeO2 (nm) a
CeO27.1CeO2–H550–O3507.6
CeO2–H4507.4CeO2–H550–O4507.3
CeO2–H5507.4CeO2–H550–O5507.5
CeO2–H65012.9CeO2–H750–O35032.1
CeO2–H75025.5CeO2–H750–O45029.7
CeO2–H80046.6CeO2–H750–O55031.6
a Crystal size calculated from the XRD diffraction peaks of CeO2 (111) based on the Scherrer equation.
Table 3. Surface concentration of Ce cations and oxygen vacancies determined with XPS.
CatalystsCe Atom Ratio (%)O Atom Ratio (%)
Ce3+Ce4+OV
CeO213.586.55.3
CeO2–H45015.784.36.9
CeO2–H55016.283.87.6
CeO2–H65016.783.37.8
CeO2–H75016.883.28.1
CeO2–H80017.782.38.5
CeO2–H550–O35015.784.37.1
CeO2–H550–O45015.384.76.6
CeO2–H550–O55015.284.86.7
CeO2–H750–O35015.884.27.2
CeO2–H750–O45015.284.86.5
CeO2–H750–O55014.985.16.1
Table 4. Adsorption amount of CO2 and NH3 determined using TPD profiles.
CatalystsCO2 Adsorption (mmol/g)NH3 Adsorption (mmol/g)
Weak
(<200 °C)
Moderate
(200~400 °C)
Strong
(>400 °C)
Weak
(<200 °C)
Moderate
(200~400 °C)
Strong
(>400 °C)
CeO20.6070.2060.0390.5920.1580.040
CeO2–H4500.5330.1470.0250.4720.1240.046
CeO2–H5500.5250.1360.0200.5860.1340.043
CeO2–H6500.3610.0740.0150.3840.084-
CeO2–H7500.1420.0230.0020.1990.018-
CeO2–H8000.1130.0190.0060.1170.031-
CeO2–H550–O3500.5250.1300.0240.5860.1430.040
CeO2–H550–O4500.5380.1540.0280.4160.1430.037
CeO2–H550–O5500.5900.1560.0280.5980.1520.041
CeO2–H750–O3500.1830.0230.0040.2270.022-
CeO2–H750–O4500.1920.0240.0060.2320.023-
CeO2–H750–O5500.2050.0390.0070.2400.027-
Disclaimer/Publisher’s Note: The statements, opinions and data contained in all publications are solely those of the individual author(s) and contributor(s) and not of MDPI and/or the editor(s). MDPI and/or the editor(s) disclaim responsibility for any injury to people or property resulting from any ideas, methods, instructions or products referred to in the content.

