Article

Annotation and Identification of Phytochemicals from Eleusine indica Using High-Performance Liquid Chromatography Tandem Mass Spectrometry: Databases-Driven Approach

by
Nur Syahirah Mad Sukor
1,
Zikry Hamizan Md Zakri
2,
Nurulfazlina Edayah Rasol
1,3 and
Fatimah Salim
1,3,*
1
Faculty of Applied Sciences, Universiti Teknologi MARA (UiTM), Shah Alam 40450, Selangor, Malaysia
2
Institute for Tropical Biology and Conservation, Universiti Malaysia Sabah, Jalan UMS, Kota Kinabalu 88400, Sabah, Malaysia
3
Atta-Ur-Rahman Institute for Natural Product Discovery (AuRIns), Universiti Teknologi MARA Selangor Branch, Puncak Alam Campus, Puncak Alam 42300, Selangor, Malaysia
*
Author to whom correspondence should be addressed.
Molecules 2023, 28(7), 3111; https://doi.org/10.3390/molecules28073111
Submission received: 24 February 2023 / Revised: 24 March 2023 / Accepted: 27 March 2023 / Published: 30 March 2023

Abstract

:
Eleusine indica (L.) Gaertn is a perennial herb belonging to the Poaceae family. As the only species of Eleusine found abundantly in Malaysia, it is locally known as “rumput sambau” and has been traditionally used to treat various ailments including pain relief from vaginal bleeding, hastening the placenta delivery after childbirth, asthma, hemorrhoids, urinary infection, fever, and as a tonic for flu-related symptoms. A diverse array of biological activities have been reported for the plant, such as antimicrobial, cytotoxic, anticonvulsant, anti-inflammatory, analgesic, antipyretic, and hepatoprotective action. Despite many reports on its traditional uses and biological activities, limited chemical databases are available for the plant. Thus, the aims of this study were to annotate and identify the phytochemical constituents in the methanolic extract of E. indica through tandem LCMS-based analysis techniques using MZmine, GNPS, Compound Discoverer, and SIRIUS platforms. This technique managed to identify a total of 65 phytochemicals in the extract, comprising primary and secondary metabolites, and was verified by the isolation of one of the identified phytochemicals. The structural elucidation mainly using 1D and 2D NMR as well as comparison with values in the literature confirms the isolated phytochemical to be a 3-OH anomer of loliolide, a benzofuran-type of compound, which consequently increases the level of confidence in the applied technique. The research describes a useful method for the fast and simultaneous identification of phytochemicals in E. indica, contributing to the study of the chemical properties of the genus and family.

1. Introduction

Identification of phytochemicals is crucial in the investigation of plant samples. In the past two decades, new technologies and methods for structural identification have come forth, which promote the speed and accuracy of phytochemical analysis [1]. The liquid chromatography coupled to mass spectrometry (LCMS) approach in structural identification has gained popularity due to its high throughput, soft ionization, and good coverage of phytochemicals [2]. LCMS is the best approach in plant chemicals analysis due to its versatility, sensitivity, and ability to separate and detect highly diverse semi-polar compounds, including key secondary metabolite groups. Tandem MS analysis is important to acquire both precursor and fragment ion information which can be used to annotate, identify, and dereplicate phytochemicals by providing a wealth of precise structural information [3]. LCMS-based phytochemical analysis can be classified into two types, namely, untargeted and targeted approaches. The former refers to a comprehensive analysis of all the measurable chemicals including the unknowns, while the latter focuses on the measurement of defined groups of chemicals [4]. The analysis can be facilitated with metabolite annotation tools such as MZmine, Global Natural Social Molecular Networking (GNPS), Compound Discoverer, and SIRIUS 4.0 [5]. This approach leads to the structural characterization of phytochemical mixtures, especially through identifying biomarkers and minor components which consequently facilitate and accelerate the discovery of novel active compounds [6].
Eleusine indica (L.) Gaertn is a perennial herb belonging to the Poaceae family that has been utilized widely for its medicinal values. The plant is widely spread in tropical regions and most of the Pacific Islands [7]. In Malaysia, E. indica is locally known as “rumput sambau” and it is the only species of Eleusine that can be easily found; it grows abundantly as a weed along roads and pavements [8]. E. indica has been used as traditional medicine around the world to treat various ailments including symptoms related to microbial infection, sprained muscle, coughing blood, and centipede or scorpion poisoning [9]. In Peninsular Malaysia, the plant’s leaves are pounded to extract the juice, which is used to hasten the delivery of placenta for women after childbirth and to relieve pain during vaginal bleeding. The root decoction is used in treating asthma, while the decoction of the whole plant is used to treat urinary infections [10,11]. In East Malaysia, Kadazandusun people used an infusion of the plant’s aerial part with rice to treat symptoms related to flu viral infection, and the decoction of roots mixed with Capsicum sp. (Solanacae) to treat piles [9,12]. This plant has a diverse array of biological activities including antioxidant, antibacterial, cytotoxic, anticonvulsant, anti-inflammatory, antidiabetic, antiplasmodial, hepatoprotective, analgesic, antipyretic, and others [7,13,14]. Hitherto, only a few phytochemicals have been isolated from the plant; they include schaftoside, vitexin, and isovitexin, β-sitosterol, stigmasterol, 3-O-β-D-glucopyranosyl-β-sitosterol and its 6′-O-palmitoyl derivatives, 1-[[[(2-aminoethoxy) hydroxyphosphinyl]oxy]methyl]-1,2-ethanediyl ester, and hexadecanoic acid [15,16,17,18,19]. An LCMS metabolite profiling and fingerprinting on the plant extract has identified p-coumaric acid and isoschaftoside along with a series of primary metabolites and amino acids [20].
Despite many reports on the traditional uses and biological activities of E. indica, not many phytochemicals have been isolated, thus limiting the plant’s available chemical databases. Therefore, the present study was undertaken to explore the chemistry of E. indica through tandem LCMS-based analysis. This paper discusses the analysis process for the characterization and identification of phytochemicals in the methanolic extract of the plant employing annotation platforms of MZmine, GNPS, Compound Discoverer 3.0 and SIRIUS; the platforms were integrated with several available spectral and compound databases as well as a custom-built one based on the Poaceae family. In addition, the isolation and structural elucidation of an identified phytochemical are also reported here, to verify the reliability and to increase the level of confidence in the technique. This research describes a useful method for the fast and simultaneous characterization and identification of phytochemicals in E. indica, contributing to knowledge about its genus and family chemical properties.

2. Results and Discussion

Figure 1 shows an infographic summarizing the steps of the research: the methanolic extraction, tandem LCMS and data analyses; the use of MZmine, Compound Discoverer (CD), GNPS, and SIRIUS platforms for annotation and identification; the use of a Venn diagram to display the distribution of the annotated phytochemicals in each platform; and the verification of the technique through the isolation and structural elucidation of phytochemical 1. The detail for each step is explained in the subsection below.

2.1. Tandem LCMS Analysis for Phytochemicals Annotation and Identification

In this study, a comprehensive high-resolution MS in a data-dependent full-scan acquisition method was developed to separate and detect the phytochemicals in E. indica methanolic extract. The phytochemicals profile was composed of hundreds of features that are recognized by their measured mass-to-charge ratio (m/z), retention time (Rt), and relative abundance. The annotation of the phytochemicals was performed using a library of natural products that contains the previously reported phytochemicals from the plant family, Poaceae. The library was custom-built by plant names (with all synonyms) that were queried in the Dictionary of Natural Products (DNP) Ver. 26.2 (December 2017), and all resulting hits were used to build a library of natural products. All the detected phytochemicals were screened against the prepared library using MZmine 2.53, Compound Discoverer 3.0, GNPS, and SIRIUS platforms; this enabled comparison of the mass errors (ppm) and isotopic patterns of the phytochemicals in the library with the observed mass spectra and ranking of the probable identity of the phytochemicals based on match score. The combination of these annotation tools accelerates the process of identification of the phytochemicals. This approach has been shown to succeed in the identification of phytochemicals in a number of studies including fully clarifying the chemical constituents of a herbal medicine in China, the Pingxiao capsule (PXC) [21]. The processes for annotation and identification of the phytochemicals in E. indica methanolic extract through the mentioned platforms are discussed in detail below.

2.1.1. Data Processing, Enrichment and Phytochemicals Annotation by MZmine 2.53

The total ion chromatogram (TIC) of E. indica’s phytochemicals profile (Figure 2) acquired from the optimized 30-min gradient elution gave m/z features in a range of 166.0859–806.5875. Pre-processing of the positive ion mode raw data file using MZmine resulted in 426 m/z features. Annotation of these features was carried out based on accurate mass (MS1) information with the curated DNP and custom databases (as previously outlined). To characterize the phytochemicals, a specialized compound database was retrieved from the online DNP database. The biological source keyword, Poaceae (family) yielded 1106 compounds. To supplement this database, a custom library generated from the previously isolated compounds of E. indica was added [14,15,20]. Both databases were imported to MZmine and employed as the custom-built database for peak identification. Hits were manually cross-checked against the MS/MS spectral fragmentation data. In order to ensure that none of the peaks overlapped, a 3D chromatogram plot (front, left and right view) was generated for the profile. As there were many overlapping peaks at the same Rt, the highest m/z abundance that represented a specific Rt was selected.
As shown in Table 1, the above processing of the extract managed to annotate 12 phytochemicals based on the custom-built database (LR and DNP sourced). Three of the phytochemicals were detected at several different retention times, namely, loliolide (1, 1′), isoschaftoside (2, 2′), and adenosine (5, 5′); they were assigned the same acronym but with the addition of prime (‘) to the duplicate to ease confusion. This redundancy in detection is probably due to the stereoisomerism of the compounds, which may affect their polarity [22]. Notably, MS spectra typically cannot differentiate the stereoisomers, and additional experiments, including comparison with standards, are required to assign the absolute structure [23]. The annotated phytochemicals, loliolide (1, 1′), isoschaftoside (2, 2′), and vitexin (3) were hit with the custom database developed through the LR, and 4-ethoxy-6-methoxy-2-(8,11,14-pentadecatrienyl)-1,3-benzenediol,5-Ethoxy-3-(10,13,16-heptadecatrienyl)-1,2,4-benzenetriol (4), oryzamutaic acid E (7), 1-feruloyl-2-hydroxyputrescine (8) and 2-[2-(3-Methoxyphenyl) ethenyl]-4H-3,1-benzoxazin-4-one, 2-(3-methoxycinnamoyl)-4H-3,1-benzoxazin-4-one (9) were detected using the enriched database from DNP. Adenosine (5, 5′) was hit by both LR and DNP sourced. Of these annotated phytochemicals, only 2 and 3 have been previously reported as the constituents of E. indica [14,20,24]. Since the LR database was only focusing on secondary metabolites, it seems that the DNP database complemented it by annotating some common compounds and primary metabolites from the plant extract. All the phytochemicals annotated in MZmine were identified with confidence level 3 due to only MS1 data characterization [25,26]. To acquire a higher level of confidence, the structures must be further characterized with their MSn using GNPS, CD and SIRIUS platforms.

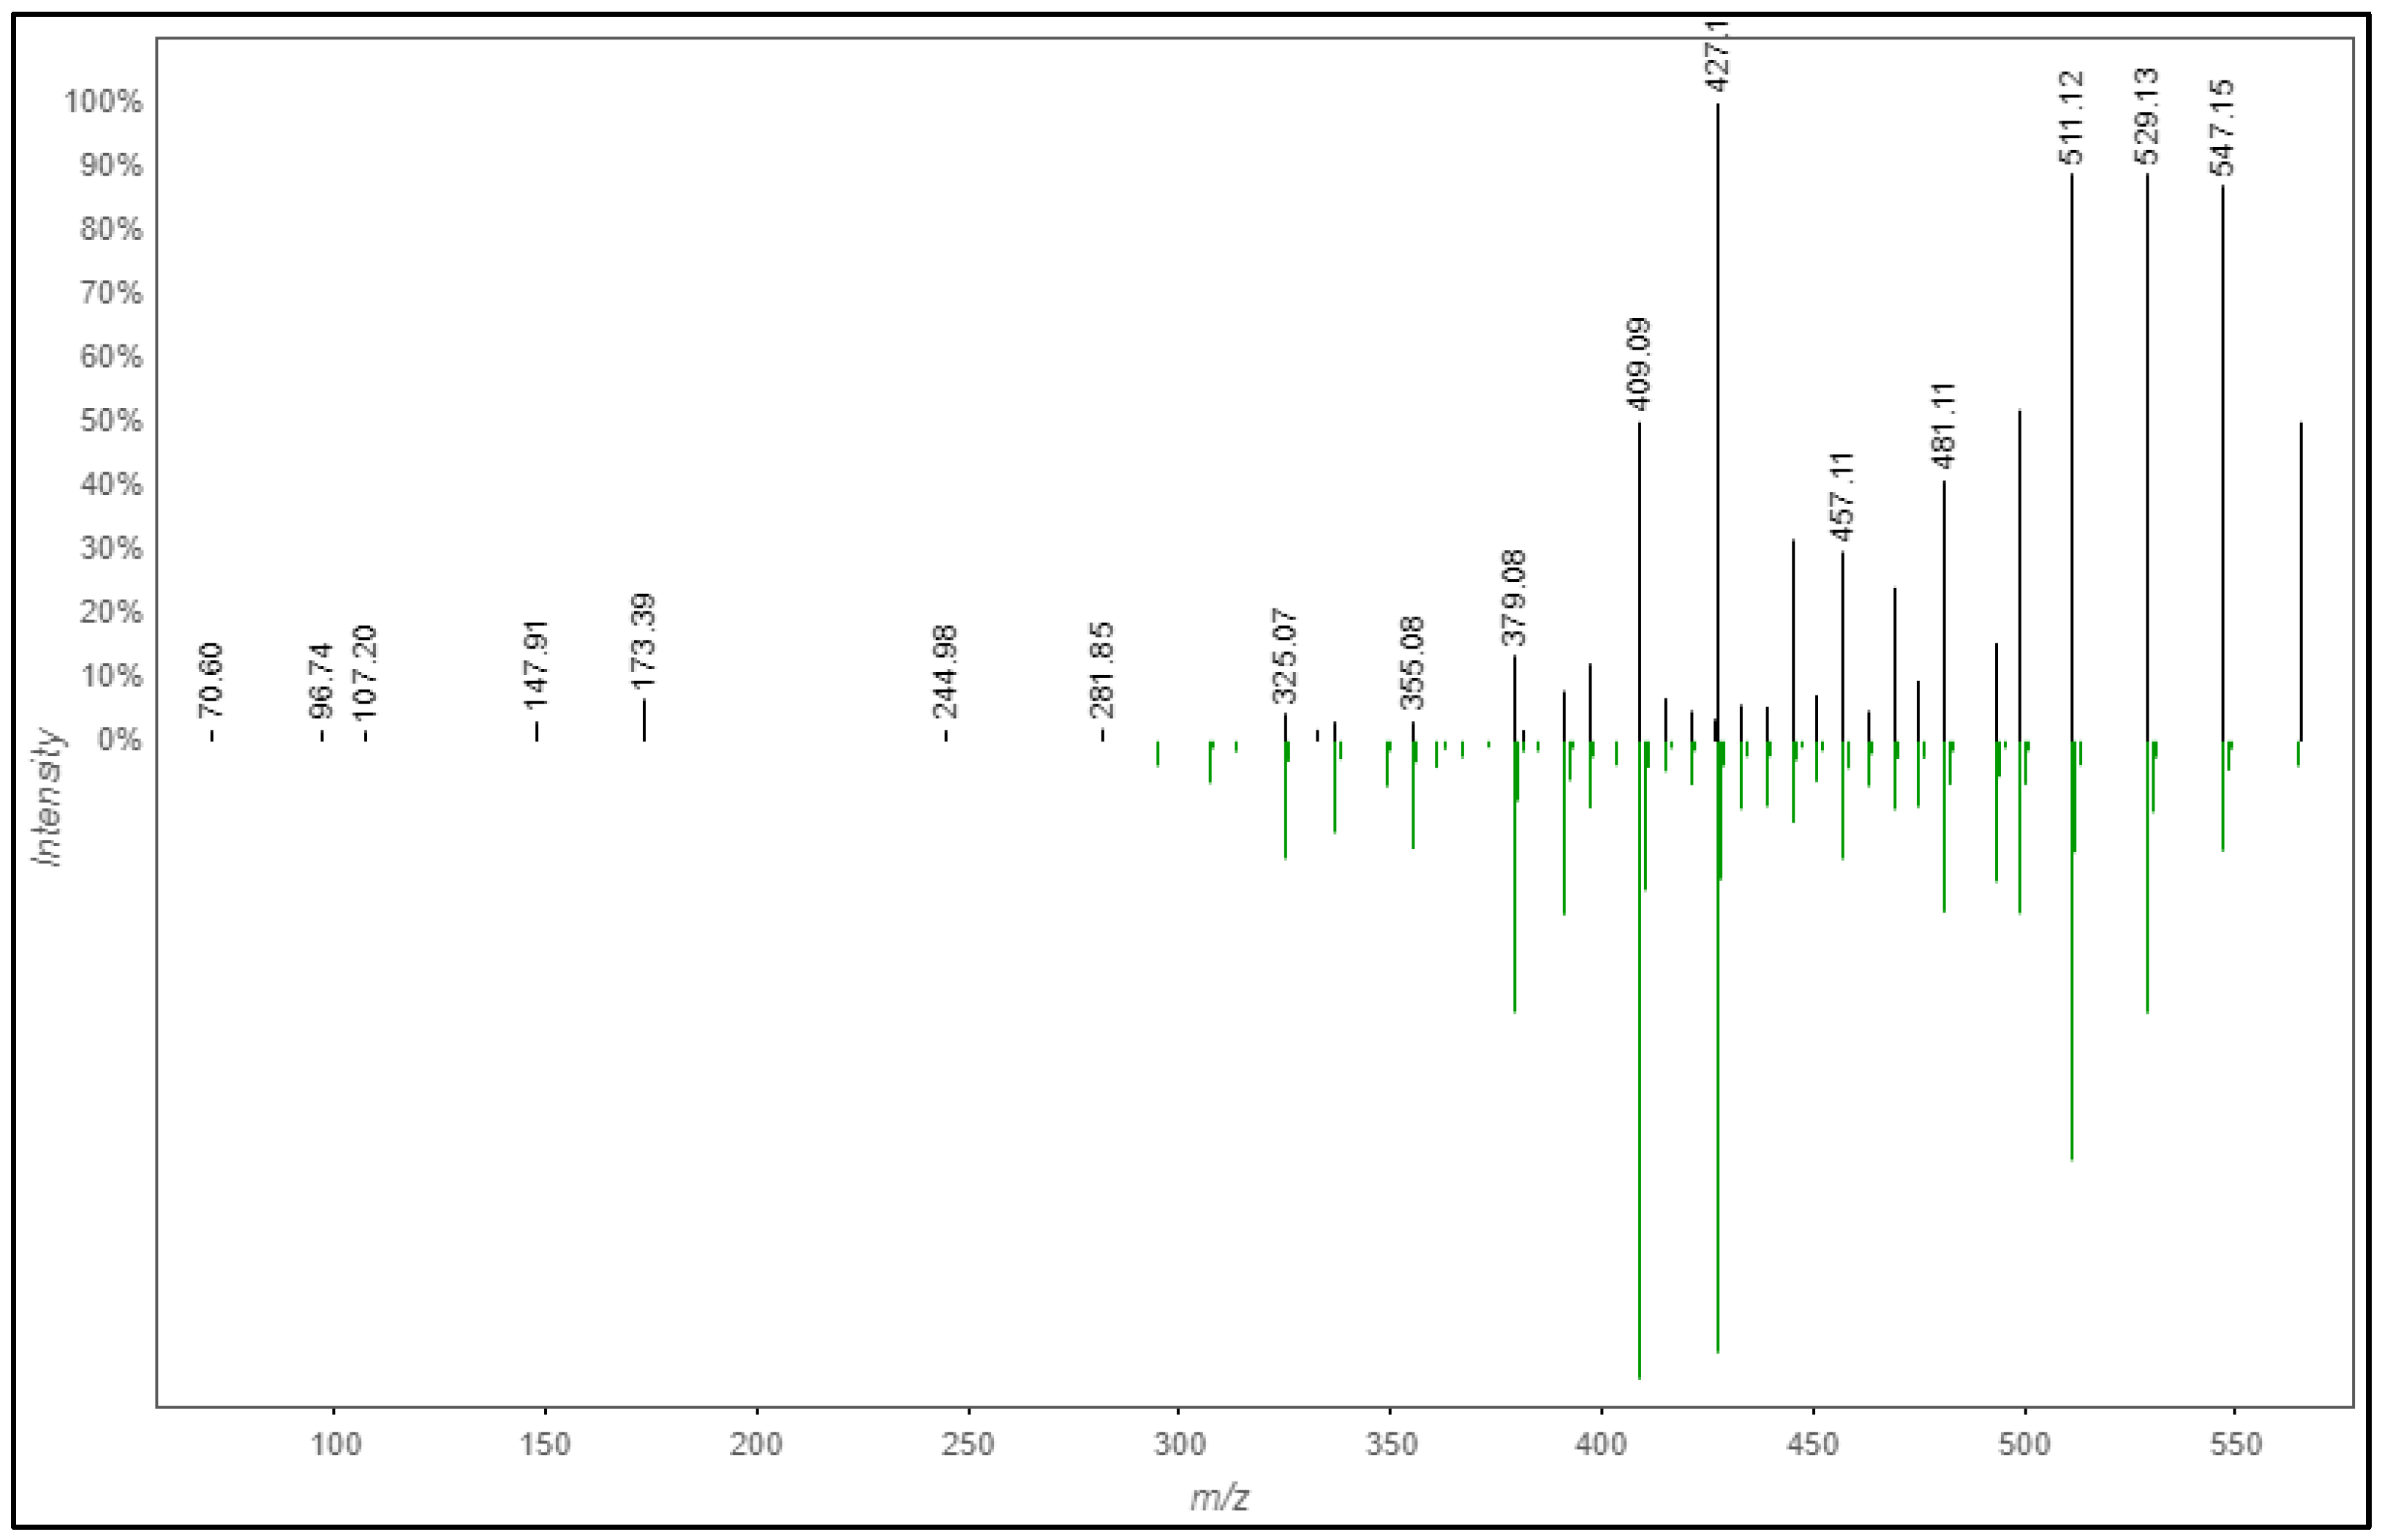
2.1.2. Phytochemicals Annotation by GNPS

The same LCMS pre-treated data by MZmine, MGF file and feature table were used and uploaded into the Feature-Based Molecular Networking (FBMN) workflow, in GNPS. FBMN is an advanced method for molecular networking that provides accurate ion abundance for statistical analysis and support for isomer resolution or ion mobility. It has been validated to be an effective strategy for the identification of natural compounds from different sources [27,28]. GNPS facilitated the phytochemicals annotation through the comparison of the spectra from experimental data with open-access reference spectral libraries [28]. In GNPS, the annotation is achieved through the cosine value which refers to a normalized dot-product, a mathematical measure of spectral similarity between two fragmentation spectra and their library class that determines the level awarded, whether gold, silver or bronze. A cosine score of 1 represents identical spectra while a cosine score of 0 denotes no similarity at all. The degree of confidence in the annotated phytochemicals is determined through the cosine value and library class index used globally for each cluster across all networking views [28].
As shown in Figure 3, analysis through the GNPS platform managed to annotate 14 phytochemicals, of which three (1, 2 and 3) were also hit in the MZmine platform. The detailed features of the 14 annotated phytochemicals are listed in Table 2, which includes their library class, cosine, spectral and library m/z, ionization used, instrumentation, and ion source. With all the library hits, the mirror match between the experimental and library mass spectra can be obtained. For example, the mirror spectral match for isoschaftoside (2) shows a very close similarity (gold level) to the experimental data (Figure 4), with a cosine value of 0.82. This confirms that the m/z 565.26 peak detected in the methanolic extract can be putatively annotated as isoschaftoside. An m/z peak at 433.11 with a cosine value of 0.96 was annotated as vitexin (3) similar to that annotated in MZmine platform. This match was also classified in the GNPS platform as a gold level due to the excellent quality of a match with the experimental spectrum considering the mass accuracy of the reference spectrum (resolution and calibration of the instrument), sample type, experimental setup, and associated sample information (metadata). It is worth mentioning that annotations 2 and 3 were matched with the Bioinformatics and Molecular Design Research Center Mass Spectral Library—Natural Products (BMDMS-NP), which contains high reliability references on experimental spectral data of metabolites. In fact, BMDMS-NP reports that the reference data for the two phytochemicals were obtained from the same instrument used in the present study (orbitrap), thus further illustrating the reliability of the result. Another phytochemical that shared high reliability in the annotation is loliolide (1) of cosine value 0.94 and bronze match classification. Isoschaftoside and vitexin have been reported previously as constituents of this plant [14,20].

2.1.3. Phytochemicals Annotation by Compound Discoverer (CD) 3.0

The pre-treated LCMS data was further analyzed through—CD platform for MS/MS fragmentation patterns from various spectra databases. Among the applied databases were mzCloud spectral library, mzVault, ChemSpider™, Human Metabolome Database (HMDB), Kyoto Encyclopaedia of Genes and Genomes (KEGG), Massbank, Biocyc, NIST and Drugbank as well as our own custom-built database from the Poaceae family. Here, exact mass and the chemical formula were calculated where several compounds with similar masses and formulas were selected as candidates. To ensure a better hit, entries with higher ppm errors (>10 ppm) were discarded from this analysis. However, in the present sample, it was observed that mass errors were below 2 ppm in most cases. The fragment ions in the MS/MS data were analyzed in silico; the results were generated by manually dissecting the molecules at various possible sites and comparing the theoretical fragments with those obtained from the data.
Table 3 shows the 38 phytochemicals along with their features (Rt, molecular formula, mzCloud similarity, FISh scoring and MS information) that could be annotated using CD software. FISh scoring provides fragment assignment based on mzCloud literature and in silico fragmentation rules (MS2 and MS3 data), and comparisons to the parent molecule for phytochemical assignment. The identification was either formal (when at least two physicochemical parameters, such as chromatographic retention time and MS/MS spectrum, matched those of our spectral library of reference compounds) or putative (based on information from mzCloud and the interpretation of MS and MS/MS spectra), corresponding to levels 1 and 2 from the metabolomics standard initiative [29,30]. In the present work, the molecular formula of the phytochemicals was mainly considered to be putative based on the predicted composition on the platform.
For consistency, here again, the phytochemical annotated as isoschaftoside (2) will be used to discuss the CD features. As shown in Table 3, compound 2 was annotated with good accuracy by exhibiting only 0.00113 Da (∆Mass) and 2 ppm (∆Mass) mass error; the mzCloud similarity match was 97.1% and the FISh score was 45.16; it was annotated as level 2 [31]. Figure 5 shows the presentation of how the in silico spectral fragmentation in the mzCloud library of 2 matches the m/z peak 565.26 detected in the plant extract. The number of (green) fragments ions indicate that majority of the signals in the spectrum is matched with the mzCloud library, consequently increasing the confidence in identification. This compound also matched with the custom database from Poaceae family and has been isolated, elucidated and characterized previously from E. indica [14,20].
Another annotated phytochemical in the extract that worth highlighting is adenosine (5). The in silico fragmentation from the FISh algorithm structurally explained more than 83.33% of the fragment ions for adenosine (Table 3). Adenosine is an organic compound that occurs widely in nature in various derivatives. It participates in improving the action of the plant on memory impairment and increased cyclic adenosine monophosphate (AMP). This compound was previously isolated and identified from Anredera cordifolia [32]. However, this is the first report on adenosine in E. indica. Figure 6 shows the TIC containing the structures of all the phytochemicals annotated by the CD platform with their respective Rt. Although the in silico fragmentation behavior in the CD platform provides an efficient characterization feature that will accelerate the annotation process of the phytochemicals, this data still needs to be confirmed with the MS/MS spectra. Thus, SIRIUS platform was further applied in the analysis to confirm the phytochemicals’ fragmentation pattern.

2.1.4. Phytochemicals Annotation by SIRIUS 4.0

SIRIUS is a software dedicated to the annotation of ions from fragmentation spectra. This software complements the other platforms described above, particularly the CD platform. First, SIRIUS computes the candidate molecular formula (MF) by (1) matching the MS1 experimental spectra against the predicted isotopic pattern and (2) establishing how much the fragmentation spectra can be explained by the candidate MFs using fragmentation trees. SIRIUS integrates other algorithms or models such as: ZODIAC for improved MF prediction; CSI: FingerID for putative annotation of structure and COSMIC for establishing confidence in the match; or CANOPUS for putative chemical class annotation. SIRIUS has an advanced graphical user interface, and the tools can be run in command line mode. This work presents the COSMIC (Confidence of Small Molecule IdentifiCations) workflow that combines the selection or generation of a structure database, searching in the structure database with CSI: FingerID and a confidence score to differentiate between correct and incorrect annotations. Candidate structures and database-independent fingerprint vectors were obtained by loading the above-mentioned MGF files into the SIRIUS and CSI-FingerID pipeline. Data were acquired in a positive mode due to the higher sensitivity and the higher quality of fingerprint predictions of SIRIUS + CSI-FingerID compared to the negative mode. After computing the processed data (MS2) into this platform, the results of each feature are displayed through the Rt, m/z and COSMIC value data.
A fragmentation tree annotates peaks in the fragmentation spectrum with molecular formulas and identities of likely losses between the fragments, similar to “fragmentation diagrams” created by experts. For each fragmentation spectrum, COSMIC considers only the structure candidate that is top ranked by CSI: FingerID as an annotation; COSMIC neither changes annotations (re-ranks structure candidates) nor discards any annotations. COSMIC’s confidence score combines E-value estimation and a linear support vector machine (SVM) with enforced directionality. The calculated tree must not be understood as ground truth but can be used to derive information about the measured phytochemical. The fragmentation tree is computed from the fragmentation spectrum given the (candidate) molecular formula of the precursor ion. Initially, a fragmentation graph is constructed in the following way. For every fragment peak, all possible molecular formula explanations are computed. These explanations must be subbing formulas of the precursor molecular formula fragment that only loses atoms, and never gains new atoms. Every such molecular formula is a node in the graph. Nodes are connected by an edge if one node is a subformula of another representing a potential loss. Using combinatorial optimization, the best scoring fragmentation tree is computed which explains every peak at most once. Unexplained peaks are considered noise. Figure 7 shows the example of a fragmentation tree for candidate 2 which is annotated as isoschaftoside. As shown from the fragmentation tree, the m/z 565.1557 C28H28014 loses H2O (18 Da) and then produces a molecular ion 547.1456 C28H28013. From the molecular ion 547.1456, it can be observed that the structure could be fragmented into two molecular ions: [M + H-H2O] with molecular formula C28H24012 at m/z 529.1347 and [M + H-CH4O2] with molecular formula C25H22O11 at m/z 499.1245. This can guide the understanding on how the fragmentation pathway occurred during the analysis.
Candidate structures for the phytochemicals of E. indica fed and non-fed pitchers were obtained by searching the top hit of CSI-FingerID in all databases and manually curating the results; for all the other analyses, fingerprint vectors of the top 10 candidates of all predicted formulas were exported. Annotation candidates were sorted by their score and the similarity between the predicted fingerprint and the fingerprint of each candidate. The higher the percentage, the higher the similarity. Candidates can be filtered by database, SMARTS string and XlogP value. In the SIRIUS platform, the practical databases used for annotation of phytochemicals would be Natural Products, COCONUT, and CHEBI, which are databases for natural products. It is worth mentioning that the unique feature of the SIRIUS platform is the CANOPUS which can predict the classification (i.e., functional group) of the phytochemicals. This would help to narrow down the search for the correct phytochemical annotation. Notably, COSMIC complements compound class annotation tools such as CANOPUS. COSMIC targets molecular structure annotations but annotates only a fraction of the compounds in a sample; in contrast, CANOPUS annotates practically all compounds in a sample for which fragmentation spectra have been measured but is restricted to annotating compound classes. Hence, both methods provide viable information. Which method is better suited depends on the underlying and focus of the research [33]. For example, COSMIC classified a phytochemical with an Rt of 5.00 min, and m/z peak of 565.16 to be from a kingdom of organic compounds, superclass of phenylpropanoids, class of flavonoids and subclass of flavonoid glycosides. The structure was further narrowed into a flavonoid C-glycosides compound type and flavonoid 8-C-glycosides. From this information and the literature values, the phytochemical that possibly satisfies these features is isoschaftoside (2). In fact, the MZmine, CD and GNPS platforms also support this annotation. This is evidence that COSMIC features can accelerate the selection of the candidates to be annotated. In addition, the level of confidence is evaluated through the metabolite identification confidence (MIC) level which is ranked 1–5 for putative metabolite annotation. Table 4 displays 20 phytochemicals that managed to be identified through the SIRIUS platform along with their MIC values. Table 5 lists 42 phytochemicals that could be characterized by their respective classes of compounds.

2.2. Verification of the Identified Phytochemicals

The platforms used in the present work each have their own strengths in the phytochemical annotation and identification process. The Venn diagram in Figure 8 below shows the performance of each platform in annotating the phytochemicals of E. indica. It can be clearly seen that only three phytochemicals, namely, loliolide (1), isoschaftoside (2), and vitexin (3), could be consistently identified through the four platforms. The CD platform gave the highest number of annotated phytochemicals (40) which is probably due to the large databases integrated into the platform, as mentioned earlier. As expected, the MZmine platform gave the lowest number of annotated phytochemicals (7) since it only integrates with a custom database built based on the phytochemicals previously reported from the Poaceae family. Since each platform gave a diversity of phytochemicals, it is suggested to use all of the platforms on a complementary basis, to annotate and identify different phytochemicals.
Even though the present work has managed to annotate and identify 65 phytochemicals from the methanolic extract of E. indica, some of the previously isolated constituents were not detected in the extract. These annotated and identified phytochemicals will remain tentative if no reference standard was used or the method is not verified. Thus, in an attempt to assure the reliability of the LCMS analysis in annotating phytochemicals in E. indica methanolic extract, one of the consistently identified phytochemicals on all the platforms, loliolide (1), has been subjected to a further isolation and purification process. From the total ion chromatogram of LCMS, compound 1 was predicted to elute at minute 6.78 (Table 1, Table 3 and Table 4). In order to isolate and purify 1, the extract was subjected to chromatographic monitoring techniques including semi-prep HPLC, and recycling HPLC yielded 10 mg of 1. The structure of phytochemical 1 was elucidated through various spectroscopic techniques and comparisons with the literature values. The physical and spectroscopic characterization of phytochemical 1 was as follows.
Phytochemical 1 was isolated as a colourless crystal possessing a melting point of 167 °C. Its MS spectrum showed a molecular ion peak at m/z 197 consistent with the molecular formula of C16H11O3. The UV spectrum acquired in MeOH displayed absorptions at λmax 208, 265 and 349 nm. The IR spectrum showed absorption bands characteristic for a benzofuran type of compound at 3433 cm−1 for a hydroxy group, while strong stretches at 1731 and 1024 cm−1 indicated the presence of a conjugated cyclic ester carbonyl group (C=O), and an ether group (C-O), respectively [34].
The 1H NMR spectrum of 1 displayed a singlet at δH 5.69 which corresponds to H-7 due to the presence of one double bond. The resonances in the medium region at δH 4.33 (m, 1H) indicated the neighboring hydrogen at H-3. Two pairs of methylene can be observed at δH 2.01 (dt, J = 14.4, 3.1 Hz, 1H) and 1.55 (dd, J = 14.4, 3.7 Hz, 1H) and 2.46 (dt, J = 13.6, 2.4 Hz, 1H) and 1.78 (d, J = 4.0 Hz, 1H). The splitting pattern of these resonances is ascribable due to the presence of cyclic methylene. Two methyl resonances were observed close to each other at δ 1.27(s, 3H) and 1.47 (s, 3H) which indicated the presence of geminal dimethyl while another methyl was deshielded at δ1.78 (s, 3H) because of the presence of neighboring oxygen atom. The stereochemistry of C-3 and C-5 was determined based on the NOESY experiment and chemical correlation method. The NOESY correlation of δH 4.33 (H-3) with δH 1.78 (H3-11), 1.55 (H-2β), and δH 2.44 (H-4β) indicated that they are on the same phase, subsequently established H-3 to be β-oriented. This consequently assigned the 3-OH group to be α-positioned. The assignment is further confirmed by a comparison of the chemical shifts observed for the H-3β and H-3α protons in the H-3 anomer of loliolide [35]. The H-3α proton appeared at a slightly lower field at δH 4.84 as it was spatially away from the H-11 methyl electron cloud.
A total of 11 carbon resonances were demonstrated from the 13C-APT NMR spectrum, of which one conjugated ketone carbonyl resonance was observed at δc 181.5. Other than that, quaternary carbon resonances were observed including a deshielded trisubstituted methine carbon at δc 170.1 which belongs to C-6, while C-5 shifted downfield due to neighboring oxygen. Moreover, comparative analyses of the 13C-APT and 1H NMR spectrum showed the resonances of three methyl groups at δc 25.2, 26.5 and 29.7, a trisubstituted olefinic bond that appeared at δc 112.2 and 170.1, and a secondary hydroxy group at δc 66.1 ppm. The 1H and 13C-APT NMR data suggested that 1 is a bicyclic molecule, which led to the benzofuran type of compound. Comparison with literature data [35,36] confirmed that 1 is a benzofuran type of compound known to be loliolide, a 3-OH β-oriented structure. However, based on the deviation in the chemical shift of protons and carbons at positions 2, 3 and 4 from the reported data (Table 6), the stereochemistry at position C-3 is believed to be different. Based on the NOE correlations discussed earlier, the assignment of 3-OH was established to be α-oriented, consequently elucidating compound 1 as the C-3 anomer of loliolide (Figure 9). Loliolide was previously reported as a constituent of other plants including L. salicaria, H. angiospermum, A. lappa, S. oleraceus, P. campanulatus (Cav.), P. indicus, M. alba, and M. whitei [37]. The isolation and structural elucidation of 1 as loliolide verified that structural annotation using tandem LCMS analysis is reliable. However, the elucidation also supports the limitation of MS spectra in differentiating stereoisomers.

3. Materials and Methods

3.1. Materials and Reagents

3.1.1. Plant Materials and Extraction

E. indica was collected in Tanjung Karang, Malaysia. The plant specimen was identified by a certified botanist, En. Ahmad Zainudin Ibrahim, and a voucher specimen with the code DBKL177 was deposited at the Herbarium Taman Botani Perdana Kuala Lumpur. The aerial and leaf parts of the plant (10 kg) were cut into small pieces and dried in an oven at 40 °C. The dried sample was weighed and ground before being extracted using methanol at room temperature for 72 h. The extract was filtered, and the solvent was evaporated under reduced pressure, resulting in 41.62 g of methanol extract. The extract was stored at 4 °C before analysis.

3.1.2. Chemicals and Solvents

All AR (analytical reagent) grade chemicals used in this study were purchased from reputed manufacturers. Methanol (MeOH), and acetone (Ace) were of analytical grade. MeOH and acetonitrile (MeCN) HPLC grade were purchased from RCI Labscan (Bangkok, Thailand) and ultra-pure water (UPW) was from Sartorius.

3.2. LCMS/MS Condition

3.2.1. Sample Preparation

Solid phase extraction (SPE) using Strata® C18E (55 µm, 70 A), Phenomenex cartridges (500 mg, 6 mL) was employed for sample clean-up and pre-concentration. To activate the cartridges, 6 mL UPW was used, followed by 6 mL methanol. Before loading a 2 mL crude extract, the cartridge was equilibrated with 6 mL of 95% MeOH at a constant flow rate. Elution was performed with 5 mL of 95% MeOH. The extract was dried using a vacuum concentrator [38]. Then, 2 mg of the extract was dissolved in MeOH and filtered through 0.22 μm syringe filters into a vial, capped, and submitted for LCMS analysis.

3.2.2. LCMS Optimization

LCMS analysis was performed using a Phenomenex reversed-phase Kinetex XB-C18 column (100 × 2.1 mm, 100 Å, 1.7 μm particle size). Mobile phase A was UPW and mobile phase B was LCMS grade MeCN. A constant flow rate of 0.8 mL/min was used, and the mobile phase gradient was: 0 min; 10% B, 20 min; 100% B, 30 min; 100% B. The column was equilibrated with 90% mobile phase A for 15 min before the next injection. The column oven was set at 35 °C, and the full loop injection volume was set at 5 µL [39]. The LCMS instrument used was a Thermo Scientific Orbitrap Elite with electrospray ionization (ESI) in positive mode. The resolving power for accurate mass measurement during the LCMS run was 120 K defined at m/z 400. The instrument was externally calibrated with Thermo Pierce calibration solution before LCMS runs. Full scan mode was used to record all the masses in the range of 100–600 m/z. In addition to the full scan, data-dependent MS/MS fragmentation was recorded for the 5 tallest peaks on each spectral scan with various collision energies. The spectrum data obtained from the LCMS analysis were processed using several available platforms such as MZmine, GNPS, Compound Discoverer, and SIRIUS.

3.3. LCMS Data Analysis

3.3.1. MZmine 2.53 Data Pre-Treatment and Processing

The raw data were converted into mzML files using ProteoWizard function msconvert and were then processed using MZmine software version 2.53 [40] with the following steps: peak detection, chromatograph builder, chromatogram deconvolution, deisotoping, peak alignment, duplicate peak filtering, peak list row filtering, and gap-filling. The parameters for these steps were adjusted based on the centroid mass detector, noise level, minimum group size of scans, minimum group intensity threshold, m/z tolerance, S/N estimator and ratio, minimum feature height, coefficient area threshold, peak duration ranges, Rt wavelet range, isotopes peaks grouper, adduct search, complex search, m/z tolerance for peak alignment, absolute Rt tolerance, weight for m/z, weight for Rt, and peak-list rows filter. The online DNP database was used to create the custom compound database [41]. The resulting MS1 feature data were exported to excel (.csv) and the MS2 feature data were exported to SIRIUS and GNPS as an MGF file.

3.3.2. Global Natural Social Molecular Networking (GNPS)

After processing the LCMS/MS data with MZmine software, the data were exported in two formats (TXT or CSV): a table containing the intensities of LCMS ion features, and an MS/MS spectral summary file in MGF format that contained a list of MS/MS spectra associated with the LCMS ion features. These files were then used as input for the SuperQuick FBMN tool, which was accessed using GNPS credentials and email. The “Feature Generation tool” was selected, and the feature quantification table and MS/MS spectral file were uploaded to the tool. After clicking on “Analyze Uploaded Files with GNPS Molecular Networking”, the FBMN job was completed, and the results were inspected on GNPS. Once the job was finished, an email notification with a link to the results page was sent, which could take any time from 10 to 10 h depending on the number of samples and the instrument used [28].

3.3.3. Compound Discoverer™ 3.0

Data processing was carried out through Natural Product Unknown ID with Online and Local Database Searches method. This method involves several steps to detect and identify unknown phytochemicals, including Rt alignment, unknown phytochemical detection, and phytochemical grouping across all samples without statistics. In addition, elemental compositions were predicted for all phytochemicals, and the chemical background was hidden using blank samples. The phytochemicals were then identified using various tools, including mzCloud [data dependent MS2 (ddMS2) and/or data-independent acquisition (DIA)], ChemSpider (exact mass or formula), and local database searches against Mass Lists (exact mass with or without Rt) and mzVault spectral libraries. A spectral similarity search was performed against mzCloud for compounds with ddMS2, and mzLogic was applied to rank order structure candidates from ChemSpider and mass list matches. Finally, spectral distance scoring was applied to ChemSpider and mass list matches [42].

3.3.4. SIRIUS 4.0

The MGF file from MZmine was imported to the SIRIUS software where CSI-FingerID pipeline was applied to further annotate the phytochemicals in the plant. The data extraction (MS/MS) was carried out using an in-house built code that searched for fragmentation events triggered in a window of 0.5 min within the feature Rt. To avoid misidentification of closely eluting isobaric phytochemicals, the maximum intensity in the MS1 extracted ion chromatogram (XIC) of the feature m/z (with 5 ppm error) that was closest to the feature Rt was searched. After determining the Rt window for a selected feature, all fragmentation events (MS/MS data) whose parent ions matched the feature m/z ratio within a 5 ppm error were stored within the new Rt window. CSI-FingerID was used to generate candidate structures for the phytochemicals of E. indica fed and non-fed pitchers. The top hit from this search was manually curated to ensure accuracy. For all other analyses, fingerprint vectors of the top 10 candidates of all predicted formulas were exported. When multiple adducts were present in a feature, only the formulas that matched the adducts’ formulas were retained. Then, only fingerprints that explained over three peaks and over a third of the intensity were retained. The final selection of fingerprint vectors was determined by collapsing all adducts per feature and retaining only those fingerprint vectors corresponding to the candidate with the highest score and those with a percentage of less than 30%. If the candidates had a greater COSMIC value and CSI: FingerID matching percentage, their fingerprints were retained. The following SIRIUS molecular formula calculation parameters were created to proceed with the analysis of the benchmarking dataset: potential ionisation, [M + H]+; instrument, orbitrap; tolerance, 50 ppm; candidate molecular formulas, 3; filtered by formulas from biological databases. For the CSI: FingerID process, the following parameters were used: potential adducts, [M + H]+; filter, compounds present in the biological database; maximum number of returned candidates, infinite [43,44].

3.4. Isolation and Purification of Compound 1

3.4.1. General Chromatographic Procedure

The semi-preparative HPLC analysis was carried out using a DIONEX Ultimate 3000 HPLC system from ThermoFisher, Waltham, MA, USA. The system included a photodiode array detector (PDA), an auto-sampler injector, a fraction collector, and a 10 mL sample loop. The separation was performed on a Hypersil GOLD C18 column from Thermo Scientific with a pore size of 175 Å and dimensions of 250 mm × 10 mm (5 μm particle size). The instrument was controlled by software Chromeleon version 7.2 provided by the supplier, and data analysis was also conducted using this software. Recycling HPLC was performed on a JAI model LC-9103 from Japan Analytical Industry Co., Ltd. (Mizuho, Tokyo, Japan) equipped with a reciprocating double plunger pump type P-9140B and a UV detector with a wavelength set to 210 nm. The separation was carried out on preparative columns JAIGEL-ODS-AP, SP-120-15 and GL Sciences- Inertsustain Column C18, both with dimensions of 20 mm × 250 mm (10 µm particle size).

3.4.2. Semi-Preparative and Recycling HPLC

The extract was weighed precisely at a concentration of 8 mg/mL and dissolved in MeOH. The solution was filtered through a 0.45 μm PTFE filter into a screw cap vial prior to injection into the HPLC system. The mobile phase used for the HPLC analysis was a gradient elution program consisting of UPW (A) and MeCN (B). The gradient was as follows: 10–95% B over 0–18 min, 95% B from 18–24 min, and 95–10% B from 25–30 min. The absorbance of the eluent was monitored at 210 nm. A 3 mL sample was introduced into the system at 30 °C and a flow rate of 4.7 mL/min was used, resulting in the isolation of 36.5 mg of the component of interest. This component was dissolved in 10 mL MeCN and UPW (80:20) and 1 mL was injected into a recycling HPLC system. The separation was performed with an isocratic elution of MeCN and UPW (80:20). The flow rate of the system was set at 4 mL/min and the absorbance was set to 210 nm. Thirty minutes were allotted for the column to condition and for the baseline to stabilize. After four complete cycles, 10 mg of compound 1 was eluted at minute 242. Each cycle took 60 min, and the entire cycle took 254 min to complete [22].

3.4.3. Structural Elucidation

A microscope JM628 digital thermometer with an X-4 melting-point apparatus was used to determine the melting point. The 1H and 13C NMR spectra were acquired in deuterated methanol (MeOD) using a Bruker 600 Ultrashield NMR spectrometer at 600 and 150 MHz, respectively. UV and IR were measured using JASCO UV/Vis Spectrophotometer V-730 and Bruker FT-IR Spectrometer TENSOR II model, respectively.

4. Conclusions

The tandem LCMS-based phytochemicals analysis of the methanolic extract of E. indica through the integration of MZmine, GNPS, Compound Discoverer and SIRIUS platforms has managed to annotate and identify a total of 65 phytochemicals, comprising primary and secondary metabolites. It was found that all of these platforms complement each other by providing a wealth of information on the characterization, annotation, and identification of phytochemicals. The reliability of the technique was verified with the isolation of one of its consistently identified phytochemicals, 1, known as loliolide. The structural elucidation of 1 using 1D and 2D NMR as well as comparison with literature values confirm that the isolated phytochemical is an anomer of loliolide at the C-3 position. This has consequently increased the level of confidence in the technique applied. The present work describes a tandem LCMS-based data analysis as a useful method for a fast and simultaneous identification of phytochemicals in E. indica, contributing to the study of the chemical properties of the genus and family. However, the elucidation of 1 as the anomer of the annotated compound also supports the limitation of MS spectra in differentiating stereoisomers. For this, additional experiments, including comparison with standards, are required to assign the absolute structure.

Author Contributions

Conceptualization, N.S.M.S., N.E.R. and F.S.; methodology, N.S.M.S., N.E.R., Z.H.M.Z. and F.S.; software, N.S.M.S. and Z.H.M.Z.; validation, N.S.M.S.; formal analysis, N.S.M.S. and Z.H.M.Z.; investigation, N.S.M.S.; writing—original draft preparation, N.S.M.S.; writing—review and editing, F.S. and Z.H.M.Z.; funding acquisition, F.S. All authors have read and agreed to the published version of the manuscript.

Funding

This research was funded by Ministry of Higher Education, Malaysia, through Fundamental Research Grant Scheme of grant no. FRGS/1/2021/STG02/UITM/02/1. The APC was also paid from the same grant.

Institutional Review Board Statement

Not applicable.

Informed Consent Statement

Not applicable.

Data Availability Statement

The data presented in this study are available on request from corresponding author. The data are not publicly available due to being part of a research project.

Acknowledgments

The authors thank the Ministry of Higher Education, Malaysia through Fundamental Research Grant Scheme (FRGS) no. FRGS/1/2021/STG02/UITM/02/1 for funding the research project, and Atta-ur-Rahman Institute for Natural Products Discovery (AuRIns), UiTM Puncak Alam for providing the research facilities and work place throughout this study. Appreciation also goes to En. Ahmad Zainudin Ibrahim for providing the plant material.

Conflicts of Interest

The authors declare no conflict of interest.

Sample Availability

Any materials or samples presented in this study are available on request from corresponding author.

References

  1. Wolfender, J.L.; Rodriguez, S.; Hostettmann, K. Liquid chromatography coupled to mass spectrometry and nuclear magnetic resonance spectroscopy for the screening of plant constituents. J. Chromatogr. A 1998, 794, 299–316. [Google Scholar] [CrossRef]
  2. Zhou, B.; Xiao, J.F.; Tuli, L.; Ressom, H.W. LC-MS-based metabolomics. Mol. BioSyst. 2012, 8, 470–481. [Google Scholar] [CrossRef]
  3. Covington, B.C.; McLean, J.A.; Bachmann, B.O. Comparative mass spectrometry-based metabolomics strategies for the investigation of microbial secondary metabolites. Nat. Prod. Rep. 2017, 34, 6–24. [Google Scholar] [CrossRef]
  4. Roberts, L.D.; Souza, A.L.; Gerszten, R.E.; Clish, C.B. Targeted Metabolomics. Curr. Protoc. Mol. Biol. 2012, 98, 30.32.31–30.32.24. [Google Scholar] [CrossRef]
  5. Ramos, A.E.F.; Evanno, L.; Poupon, E.; Champy, P.; Beniddir, M.A. Natural products targeting strategies involving molecular networking: Different manners, one goal. Nat. Prod. Rep. 2019, 36, 960–980. [Google Scholar] [CrossRef]
  6. Alvarez-Rivera, G.; Ballesteros-Vivas, D.; Parada-Alfonso, F.; Ibañez, E.; Cifuentes, A. Recent applications of high resolution mass spectrometry for the characterization of plant natural products. TrAC Trends Anal. Chem. 2019, 112, 87–101. [Google Scholar] [CrossRef]
  7. Lim, T.K. Edible Medicinal and Non-Medicinal Plants; Springer: Cham, Switzerland, 2016; Volume 12. [Google Scholar]
  8. Ettebong, O.; Ubulom, P.M.E.; Obot, D.N. A Systematic review on Eleucine indica (L.) Gaertn.: From ethnomedicinal uses to pharmacological activities. J. Med. Plants Stud. 2020, 8, 262–274. [Google Scholar]
  9. Zakri, Z.H.M.; Suleiman, M.; Shean Yeaw, N.; Ngaini, Z.; Maili, S.; Salim, F. Eleusine Indica for Food and Medicine. J. Agrobiotechnol. 2021, 12, 68–87. [Google Scholar] [CrossRef]
  10. Burkill, I.H. A Dictionary of economic products of the Malay Peninsular. Minist. Agric. Co-Oper. Kuala Lumpur 1966, 137, 255. [Google Scholar]
  11. Hussain, A.G.; Noor, N.M.; Hussin, K. Nature’s Medicine: A Collection of Medicinal Plants from Malaysia’s Rainforest; Landskap Malaysia: Kuala Lumpur, Malaysia, 2015; Volume 1, Issue/No. a.; p. 374. [Google Scholar]
  12. Kulip, J.; Unchi, S.; Majawat, G. Research Contributions towards Optimization of Resources in Tropical Ecosystems. In Proceedings of the 4th Seminar on Tropical Ecosystem Research in Sabah, Sabah, 2000; Institute of Development Studies: Brighton, UK; Available online: https://books.google.co.th/books/about/4th_Seminar_on_Tropical_Ecosystem_Resear.html?id=sKwMAQAAMAAJ&redir_esc=y (accessed on 17 February 2023).
  13. Al-Zubairi, A.S.; Abdul, A.B.; Abdelwahab, S.I.; Peng, C.Y.; Mohan, S.; Elhassan, M.M. Eleucine indica Possesses Antioxidant, Antibacterial and Cytotoxic Properties. Evid. Based Complement. Altern. Med. 2011, 2011, 965370. [Google Scholar] [CrossRef]
  14. De Melo, G.O.; Muzitano, M.F.; Legora-Machado, A.; Almeida, T.A.; De Oliveira, D.B.; Kaiser, C.R.; Koatz, V.L.; Costa, S.S. C-glycosylflavones from the aerial parts of Eleusine indica inhibit LPS-induced mouse lung inflammation. Planta Med. 2005, 71, 362–363. [Google Scholar] [CrossRef] [PubMed]
  15. Sukor, S.; Zahari, Z.; Rahim, N.; Yusoff, J.; Salim, F. Chemical Constituents and Antiproliferative Activity of Eleusine indica. Sains Malays. 2022, 51, 873–882. [Google Scholar] [CrossRef]
  16. Desai, A.V. Phytochemical Investigation of Eleusine Indica for in-Vivo Diuretic and in-Vitro Anti-Urolithiatic Activity. World J. Pharm. Res. 2017, 6, 1292–1304. [Google Scholar] [CrossRef]
  17. Iberahim, R.; Yaacob, W.A.; Ibrahim, N. Phytochemistry, cytotoxicity and antiviral activity of Eleusine indica (sambau). In Proceedings of the 2015 UKM FST Postgraduate Colloquium, 1 September 2015; p. 030013. [Google Scholar]
  18. Iqbal, M.; Gnanaraj, C. Eleusine indica L. possesses antioxidant activity and precludes carbon tetrachloride (CCl₄)-mediated oxidative hepatic damage in rats. Environ. Health Prev. Med. 2012, 17, 307–315. [Google Scholar] [CrossRef]
  19. Phuong, N.M.; Sung, T.V.; Ripperger, H.; Adam, G. Sterol Glucosides from Eleucine indica. Planta Med. 1994, 60, 498. [Google Scholar] [CrossRef]
  20. Peñaloza, E.M.C.; Casanova, L.M.; Costa, S.S.; Leal, I.C.R.; Aguiar, P.F.d. Metabolite fingerprinting and profiling of the medicinal grass Eleusine indica based on HPLC-DAD, UPLC-DAD-MS/MS and NMR analyses. J. Braz. Chem. Soc. 2018, 29, 2522–2534. [Google Scholar] [CrossRef]
  21. Wang, D.; Fu, Z.; Xing, Y.; Tan, Y.; Han, L.; Yu, H.; Wang, T. Rapid identification of chemical composition and metabolites of Pingxiao Capsule in vivo using molecular networking and untargeted data-dependent tandem mass spectrometry. Biomed. Chromatogr. 2020, 34, e4882. [Google Scholar] [CrossRef]
  22. Sulaiman, N.A.S.; Yunus, Y.; Ahmad, R.; Salim, F. Diastereoseparation of C-7 Pentacyclic Oxindole Alkaloids and Their Vibrational Circular Dichroism Characteristics. Malays. J. Chem. 2021, 23, 34–41. [Google Scholar]
  23. Aron, A.T.; Gentry, E.C.; McPhail, K.L.; Nothias, L.F.; Nothias-Esposito, M.; Bouslimani, A.; Petras, D.; Gauglitz, J.M.; Sikora, N.; Vargas, F.; et al. Reproducible molecular networking of untargeted mass spectrometry data using GNPS. Nat. Protoc. 2020, 15, 1954–1991. [Google Scholar] [CrossRef]
  24. Hilu, K.W.; De Wet, J.M.J.; Seigler, D. Flavonoid patterns and systematics in Eleusine. Biochem. Syst. Ecol. 1978, 6, 247–249. [Google Scholar] [CrossRef]
  25. Schrimpe-Rutledge, A.C.; Codreanu, S.G.; Sherrod, S.D.; McLean, J.A. Untargeted Metabolomics Strategies-Challenges and Emerging Directions. J. Am. Soc. Mass Spectrom. 2016, 27, 1897–1905. [Google Scholar] [CrossRef]
  26. Schymanski, E.L.; Jeon, J.; Gulde, R.; Fenner, K.; Ruff, M.; Singer, H.P.; Hollender, J. Identifying small molecules via high resolution mass spectrometry: Communicating confidence. Environ. Sci. Technol. 2014, 48, 2097–2098. [Google Scholar] [CrossRef]
  27. Nothias, L.F.; Petras, D.; Schmid, R.; Dührkop, K.; Rainer, J.; Sarvepalli, A.; Protsyuk, I.; Ernst, M.; Tsugawa, H.; Fleischauer, M.; et al. Feature-based molecular networking in the GNPS analysis environment. Nat. Methods 2020, 17, 905–908. [Google Scholar] [CrossRef]
  28. Wang, M.; Carver, J.J.; Phelan, V.V.; Sanchez, L.M.; Garg, N.; Peng, Y.; Nguyen, D.D.; Watrous, J.; Kapono, C.A.; Luzzatto-Knaan, T.; et al. Sharing and community curation of mass spectrometry data with Global Natural Products Social Molecular Networking. Nat. Biotechnol. 2016, 34, 828–837. [Google Scholar] [CrossRef]
  29. Simonato, M.; Fochi, I.; Vedovelli, L.; Giambelluca, S.; Carollo, C.; Padalino, M.; Carnielli, V.P.; Cogo, P. Urinary metabolomics reveals kynurenine pathway perturbation in newborns with transposition of great arteries after surgical repair. Metabolomics 2019, 15, 145. [Google Scholar] [CrossRef]
  30. Sumner, L.W.; Amberg, A.; Barrett, D.; Beale, M.H.; Beger, R.; Daykin, C.A.; Fan, T.W.; Fiehn, O.; Goodacre, R.; Griffin, J.L.; et al. Proposed minimum reporting standards for chemical analysis Chemical Analysis Working Group (CAWG) Metabolomics Standards Initiative (MSI). Metabolomics 2007, 3, 211–221. [Google Scholar] [CrossRef]
  31. Miralles, P.; López, A.; Dualde, P.; Coscollà, C.; Yusà, V. Liquid chromatography-Orbitrap Tribrid high-resolution mass spectrometry using data dependent-tandem mass spectrometry with triple stage fragmentation as a screening tool to perform identification and risk assessment of unknown substances in food contact epoxy resin. J. Sep. Sci. 2021, 44, 3020–3030. [Google Scholar] [CrossRef]
  32. Ohizumi, Y.; Kawada, M.; Kamada, M.; Nakajima, A.; Kajima, K.; Uozumi, N.; Hara, Y.; Guo, Y.; Ishibashi, M. Isolation of Adenosine and Cordysinin B from Anredera cordifolia that Stimulates CRE-Mediated Transcription in PC12 Cells. Planta Med. Int. Open 2021, 8, e19–e24. [Google Scholar] [CrossRef]
  33. Hoffmann, M.A.; Nothias, L.F.; Ludwig, M.; Fleischauer, M.; Gentry, E.C.; Witting, M.; Dorrestein, P.C.; Dührkop, K.; Böcker, S. High-confidence structural annotation of metabolites absent from spectral libraries. Nat. Biotechnol. 2022, 40, 411–421. [Google Scholar] [CrossRef]
  34. Huang, F.Y.; Yu, Y.; Wu, X.J. Characterization and Properties of Cellulose Oleate. Adv. Mater. Res. 2011, 197–198, 1306–1309. [Google Scholar] [CrossRef]
  35. Yang, X.; Kang, M.-C.; Lee, K.-W.; Kang, S.-M.; Lee, W.-W.; Jeon, Y.-J. Antioxidant activity and cell protective effect of loliolide isolated from Sargassum ringgoldianum subsp. coreanum. Algae 2011, 26, 201–208. [Google Scholar] [CrossRef]
  36. Yuan, Z.; Zheng, X.; Zhao, Y.; Liu, Y.; Zhou, S.; Wei, C.; Hu, Y.; Shao, H. Phytotoxic Compounds Isolated from Leaves of the Invasive Weed Xanthium spinosum. Molecules 2018, 23, 2840. [Google Scholar] [CrossRef]
  37. Grabarczyk, M.; Wińska, K.; Mączka, W.; Potaniec, B.; Anioł, M. Loliolide—The most ubiquitous lactone. Acta Univ. Lodziensis. Folia Biol. Oecolog. 2015, 11, 1–8. [Google Scholar] [CrossRef]
  38. Kasim, N.; Afzan, A.; Mediani, A.; Low, K.H.; Ali, A.M.; Mat, N.; Wolfender, J.-L.; Ismail, N.H. Correlation of chemical profiles obtained from 1H-NMR and LC–MS metabolomics with α-glucosidase inhibition activity for varietal selections of Ficus deltoidea. Phytochem. Anal. 2022, 33, 1235–1245. [Google Scholar] [CrossRef]
  39. Shaharuddin, N.H.; Ahmad, R.; Salim, F. Isolation of pteropodic acid from Malaysian Uncaria lanosa VAR. ferrea by using liquid chromatography mass spectrometry dereplication approach. Malays. J. Chem. 2021, 25, 959–965. [Google Scholar]
  40. Pluskal, T.; Castillo, S.; Villar-Briones, A.; Oresic, M. MZmine 2: Modular framework for processing, visualizing, and analyzing mass spectrometry-based molecular profile data. BMC Bioinform. 2010, 11, 395. [Google Scholar] [CrossRef]
  41. Dictionary of Natural Products (DNP) Database, v26.2. 2017. Available online: https://dmnp.chemnetbase.com/ (accessed on 25 March 2023).
  42. Cerrato, A.; Cannazza, G.; Capriotti, A.L.; Citti, C.; La Barbera, G.; Laganà, A.; Montone, C.M.; Piovesana, S.; Cavaliere, C. A new software-assisted analytical workflow based on high-resolution mass spectrometry for the systematic study of phenolic compounds in complex matrices. Talanta 2020, 209, 120573. [Google Scholar] [CrossRef]
  43. Dührkop, K.; Fleischauer, M.; Ludwig, M.; Aksenov, A.A.; Melnik, A.V.; Meusel, M.; Dorrestein, P.C.; Rousu, J.; Böcker, S. SIRIUS 4: A rapid tool for turning tandem mass spectra into metabolite structure information. Nat. Methods 2019, 16, 299–302. [Google Scholar] [CrossRef]
  44. Rutz, A.; Dounoue-Kubo, M.; Ollivier, S.; Bisson, J.; Bagheri, M.; Saesong, T.; Ebrahimi, S.N.; Ingkaninan, K.; Wolfender, J.L.; Allard, P.M. Taxonomically Informed Scoring Enhances Confidence in Natural Products Annotation. Front. Plant Sci. 2019, 10, 1329. [Google Scholar] [CrossRef]
Figure 1. Infographic illustrating the annotation and identification process of phytochemicals from E. indica using high-performance liquid chromatography tandem mass spectrometry-based analysis.
Molecules 28 03111 g001
Figure 2. Identified phytochemicals from MZmine 2.53 based on TIC.
Molecules 28 03111 g002
Figure 3. Annotated metabolites from GNPS based on TIC.
Molecules 28 03111 g003
Figure 4. Mirror match of 2 with isoschaftoside with the reference spectra with gold library class and 0.82 cosine value.
Molecules 28 03111 g004
Figure 5. Mirror match of fragmentation of 2 with isoschaftoside by mzCloud spectral library.
Molecules 28 03111 g005
Figure 6. Annotated metabolites from CD based on TIC chromatogram. (a) retention time 0–6 min, (b) retention time 6–15 min, (c) retention time-13–22 min.
Molecules 28 03111 g006aMolecules 28 03111 g006b
Figure 7. The fragmentation tree of candidate 2 with 565.16 m/z annotated as isoschaftoside.
Molecules 28 03111 g007
Figure 8. Venn diagram of all metabolites identified from E. indica. 1, 1′, Loliolide; 2, 2′, Isoschaftoside; 3, vitexin; 4, 4-Ethoxy-6-methoxy-2-(8,11,14-pentadecatrienyl)-1,3-benzenediol; 5, 5′, Adenosine; 6, 5-Ethoxy-3-(10,13,16-heptadecatrienyl)-1,2,4-benzenetriol; 7, Oryzamutaic Acid E; 8, 1-Feruloyl-2-hydroxyputrescine; 9, 2-(3-Methoxycinnamoyl)-4H-3,1-benzoxazin-4-one; 10, L-phenylalanine; 11, Tris(2-butoxyethyl) phosphate; 12, Sulfamethazine; 13, Undecaethylene glycol; 14, 13-Keto-9Z,11E-octadecadienoic acid; 15, 15′, N-Fructosyl isoleucine; 16, 9-Oxo-10E,12Z-octadecadienoic acid; 17, N-(1-Deoxy-1-fructosyl) phenylalanine; 18, N-Lauroylsarcosine; 19, 9,10-epoxy-12Z-octadecenoic acid; 20, 6-Gingerol; 21, 13S-hydroxy-9Z,11E,15Z-octadecatrienoic acid; 22, 3,5-Di-tert-butyl-4-hydroxybenzaldehyde; 23, 5-Hydroxy-2-(4-hydroxy-3-methoxyphenyl)-6-methoxy; 24, 7-Aminooctadecanoic acid; 25, 9-Oxo-10E, 12E-octadecadienoic acid; 26, Alpha-linolenic acid; 27, Benazol-P; 28, Bis(4-ethylbenzylidene) sorbitol; 29, Bis(methylbenzylidene) sorbitol; 30, Citroflex A-4; 31, Hexaconazole; 32, Mugineic acid; 33, N-Lauryl sarcosine; 34, Tricin 5-o-β-D-glucoside; 35, 2,4,8,11-Dodecatetranoic acid; 36, Decaethylene glycol; 37, 3,6,9,12,15,18-Hexaoxaicosane-1,20-diol; 38, Octaethylene glycol; 39, Tris(2-butxyethyl) phosphate; 40, 3,6,9,12,15-Pentaoxapentacosan-1-ol; 41, 3,6,9,12,15-Tetraoxadocosan-1-ol; 42, 3-[Dodecyl(2-hydroxyethyl) amino]-1,2-propanediol; 43, 3′-Geranyl-3,4,2′,4′-tetrahydroxy-6′-methoxydihydrochalcone; 44, 6-(1,3-Benzodioxol-5-yl)-2-oxo-4-phenyl-1,2-dihydro-3-pyridinecarbonitrile; 45, Dibutyl phthalate; 46, Methyl 9,10-dihydroxystearate; 47, Methyl 9H-b-carboline-3-carboxylate; 48, Hexaethylene glycol; 49, N,N-Bis(2-hydroxyethyl)dodecanamide; 50, N-Lauryldiethanolamine; 51, Nonaethylene glycol; 52, Safingol; 53, 2,6-Bis[2-[2-(2-aminoethoxy) ethoxy] ethylamino] pyridine; 54, N-[6-[3,5-diamino-2-[3-amino-6-(aminomethyl)-4,5-dihydroxyoxan-2-yl] oxy-6-hydroxycyclohexyl] oxyhexyl]-4-oxopentanamide; 55, Istamycin C1; 56, Netilmicin; 57, N-{1-[(5-carbamimidamido-1-hydroxypentan-2-yl)-C-hydroxycarbonimidoyl]-2-methylpropyl}-2-[(1-hydroxyethylidene)amino]-4-methylpentanimidic acid; 58, Plakoridine A; 59, Schaftoside; 60, Broussonetine M1; 61, Fructose phenylalanine; 62, Justicidin B; 63, Isoleucinopine; 64, Watsonol B; 65, Embelin.
Molecules 28 03111 g008
Figure 9. Structure of loliolide C-3 anomer.
Molecules 28 03111 g009
Table 1. Phytochemicals hit from the Custom-Built Database imported to MZmine 2.53.
Compound Name[M + H]+ (m/z)Rt (min)Database Sourced
Loliolide (1)197.11746.78LR_positive.csv
Isoschaftoside (2)565.15535.00LR_positive.csv
Vitexin (3)433.11326.16LR_positive.csv
4-Ethoxy-6-methoxy-2-(8,11,14-pentadecatrienyl)-1,3-benzenediol (4)388.26033.63DNP_Poaceae.csv
Adenosine (5)268.10441.28LR_positive.csv
DNP_Poaceae.csv
Adenosine (5′)268.10441.05LR_positive.csv DNP_Poaceae.csv
5-Ethoxy-3-(10,13,16-heptadecatrienyl)-1,2,4-benzenetriol (6)402.27635.22DNP_Poaceae.csv
Loliolide (1′)197.11745.97LR_positive.csv
Oryzamutaic Acid E (7)335.183016.02DNP_Poaceae.csv
1-Feruloyl-2-hydroxyputrescine (8)280.14251.04DNP_Poaceae.csv
Isoschaftoside (2′)565.15525.38LR_positive.csv
2-(3-Methoxycinnamoyl)-4H-3,1-benzoxazin-4-one (9)279.090614.95DNP_Poaceae.csv
Table 2. Library hits from Feature-Based Molecular Networking in GNPS.
NoCompound NameCluster IndexLibrary ClassCosineMZ Error ppmSpectral m/z/
Library m/z
InstrumentIon
Mode
Data SourceIon Source
1L-phenylalanine
(10)
1Bronze1.000166.09/
166.09
OrbitrapPositiveTrent NorthenLC-ESI
2Vitexin
(3)
770Gold0.965433.11/
433.11
OrbitrapPositiveBMDMS-NPESI
3Tris(2-butoxyethyl) phosphate
(11)
660Bronze0.940399.25/
399.25
qTofPositiveNediljko BudisaESI
4Loliolide
(1)
25Bronze0.941197.12/
197.12
OrbitrapPositiveLihini AluwihareLC-ESI
5Sulfamethazine
(12)
222Bronze0.929279.09/
279.09
Hybrid FTPositiveMassbankESI
6Undecaethylene glycol
(13)
928Bronze0.922503.31/
503.31
QQQPositiveRob KnightESI
713-Keto-9Z,11E-octadecadienoic acid
(14)
206Bronze0.851277.22/
277.22
qTofPositiveWolfender/LitaudonESI
8N-Fructosyl isoleucine (15)279Bronze0.844294.15/
294.15
qTofPositiveMassbankESI
9Isoshaftoside
(2)
1053Gold0.820565.16/
565.16
OrbitrapPositiveBMDMS-NPESI
109-Oxo-10E,12Z-octadecadienoic acid
(16)
295Bronze0.822295.23/
295.23
IT-FT/ion trap with FTMSPositiveRob KnightESI
11N-(1-Deoxy-1-fructosyl) phenylalanine
(17)
448Bronze0.771328.14/
328.14
qTofPositiveClaudia MaierLC-ESI
12N-Lauroylsarcosine (18)175Bronze0.761272.22/
272.22
Hybrid FTPositiveMassbankESI
13N-Fructosyl isoleucine
(15′)
188Bronze0.722276.14/
276.14
qTofPositiveMassbankESI
149,10-epoxy-12Z-octadecenoic acid (19)313Bronze0.722297.24/ 297.24HCDPositiveRob KnightESI
Table 3. Phytochemicals hits from the Compound Discoverer platform.
NoCompound NameMolecular Formula[M + H]+Fragmentation Ions (MS/MS)Rt (min)∆Mass [Da]∆Mass [ppm]mzCloud SimilarityReferenceFISh ScoreMIC *
16-Gingerol (20)C17H26O4295.1905277.1803, 173.403316.0290.000120.4270.0ChemSpider85.32
2-13S-hydroxy-9Z,11E,15Z-octadecatrienoic acid (21)C18H30O3295.2270277.2160, 151.111313.2680.000190.6489.8DNP, ChemSpider89.712
33,5-Di-tert-butyl-4-hydroxybenzaldehyde (22)C15H22O2235.1692219.1388, 179.106819.9150.000070.3095.9DNP, Chemspider802
45-Hydroxy-2-(4-hydroxy-3-methoxyphenyl)-6-methoxy (23)C23H24O12493.1350331.08015, 313.76417.1320.000380.7799.3ChemSpider73.912
57-Aminooctadecanoic acid (24)C18H37NO3316.2849106.4888, 115.000020.0150.000511.60-DNP, ChemSpider100.002
69-Oxo-10E, 12E-octadecadienoic acid (25)C18H30O3295.2268277.1609, 151.111520.4890.000130.4690.6ChemSpider, DNP77.782
7Adenosine (5)C10H13N5O4268.1041136.0612, 112.74411.2860.000281.0499.3DNP
ChemSpider
83.332
8Alpha-linolenic acid (26)C18H30O2279.2319279.2311,
261.2196
20.8980.000080.2889.5CD Database74.662
9Benazol-P (27)C13H11N3O226.0975126.0975, 120.055020.7310.000030.1395.8CD Database 29.412
10Bis(4-ethylbenzylidene) sorbitol (28)C24H39O6415.2122135.0799, 119.085117.8670.001162.8099.8CD Database75.002
11Bis(methylbenzylidene) sorbitol (29)C22H26O6387.1802119.0491, 105.069216.2580.000561.4699.8CD Database44.442
12Citroflex A-4 (30)C20H34O8403.2331185.0806, 129.017521.2470.000461.4695.3CD Database54.552
13Isoschaftoside (2)C26H28O14565.1564427.1027, 409.09234.9960.001132.0097.1DNP45.162
14Hexaconazole (31)C14H17C12N3O314.0824184.9910, 158.975818.3550.000561.7898.1ChemSpider70.002
15L-phenylalanine (10)C9H11NO2166.0861120.0802, 103.05371.5570.00003−0.1799.9ChemSpider87.502
16Mugineic acid (32)C12H20N2O7305.1344227.1023, 191.08111.0230.000351.1490DNP71.432
17N-Lauryl sarcosine (33)C15H29NO3272.2946230.4062, 90.054318.6620.000180.6677.8ChemSpider82.352
18Tricin 5-o-β-D-glucoside (34)C23H24O12493.1350331.0818, 329.49118.1080.000380.7799.2ChemSpider66.672
19Vitexin (3)C21H20O10433.1136397.0921, 313.07086.1590.000511.1897.8ChemSpider22.582
202,4,8,11-Dodecatetranoic acid (35)C16H25NO248.2011117.0693, 105.069320.6840.000010.03-DNP71.433
21Decaethylene glycol (36)C20H42O11459.2809177.1119, 133.08554.8640.000711.5488ChemSpider85.712
223,6,9,12,15,18-Hexaoxaicosane-1,20-diol (37)C14H30O8327.2018173.4045, 146.74852.9490.000682.0992.2CD Database75.002
23Octaethylene glycol (38)C16H34O9371.2282329.1156, 133.0853,3.6340.000501.3497.2ChemSpider1002
24Tris(2-butxyethyl) phosphate (39)C18H39O7P399.2512299.1618, 199.072620.2400.000672.6898.0CD Database77.83
253,6,9,12,15-Pentaoxapentacosan-1-ol (40)C20H42O6379.3095173.3948, 89.095820.0210.000561.4884.6CD Database82.44
263,6,9,12,15-Tetraoxadocosan-1-ol (41)C18H38O5335.2802133.0855, 89.05924520.0530.000461.37-CD Database83.332
273-[Dodecyl(2-hydroxyethyl) amino]-1,2-propanediol (42)C17H37NO3304.2850256.2627, 122.080617.0060.000411.36-ChemSpider80.003
283′-Geranyl-3,4,2′,4′-tetrahydroxy-6′-methoxydihydrochalcone (43)C26H32O6441.2253173.4048, 159.625018.919−0.00185−4.21-Arita Lab 6549 Flavonoid S100.002
29Loliolide (1)C11H16O3197.1173179.1063, 133.10076.7810.000070.37-DNP46.153
306-(1,3-Benzodioxol-5-yl)-2-oxo-4-phenyl-1,2-dihydro-3-pyridinecarbonitrile (44)C19H12N2O3317.0925289.0975, 271.086917.5200.000491.55-ChemSpider44.833
31Dibutyl phthalate (45)C16H22O4279.1592233.0775, 149.022920.6940.000120.4586CD Database24.242
32Methyl 9,10-dihydroxystearate (46)C19H3804331.2845285.2999, 173.395419.2660.000401.2182CD Database100.003
33Methyl 9H-b-carboline-3-carboxylate (47)C13H10N2O2227.0814210.0726, 182.07863.826−0.00002−0.1073ChemSpider-3
34Hexaethylene glycol (48)C12H26O7283.1752270.8245, 173.3921 2.2770.000100.3480ChemSpider100.003
35N,N-Bis(2-hydroxyethyl)dodecanamide (49)C16H33NO3288.2534228.2041, 106.085617.9150.000311.0878CD Database50.002
36N-Lauryldiethanolamine (50)C16H35NO2274.2741106.0862, 88.075115.8730.000240.86-CD Database70.002
37Nonaethylene glycol (51)C18H38O10415.2544221.1385, 177.11664.2790.000641.5483ChemSpider100.002
38Safingol (52)C18H39NO2302.3055102.244518.0910.000090.3193ChemSpider66.672
* Metabolite Identification Confidence (MIC); Level 1: unambiguous identification by comparison of the retention time and MS/MS fragmentation with reference standards; Level 2: putative identification through MS/MS fragmentation libraries without the presence of standards; Level 3: tentative structure determination by matching MS1 information with the compound database; Level 4: matching with the molecular formula, isotope abundance distribution, adduct ion determination charge state, and ion determination; and Level 5: annotation through unique features such as mass measurement accuracy (±ppm).
Table 4. Identified phytochemicals from SIRIUS 4.0 Software.
NoAnnotation (CSI: FingerID)[M + H]+Fragment IonsRt (min)Molecular FormulaCOSMICClassificationSmilesLinksMIC *
12,6-Bis[2-[2-(2-aminoethoxy) ethoxy] ethylamino] pyridine (53)372.64327.2019, 133.08532.94C17H33N5O40.8221Aminopyrimidines and derivativesC1=CC(=NC(=C1)NCCOCCOCCN)NCCOCCOCCNPubChem:(86235228)2
2N-[6-[3,5-diamino-2-[3-amino-6-(aminomethyl)-4,5-dihydroxyoxan-2-yl] oxy-6-hydroxycyclohexyl] oxyhexyl]-4-oxopentanamide (54)520.33503.3067, 133.08515.39C23H45N5O80.722Dialkyl etherCC(=O)CCC(=O)NCCCCCCOC1C(C(CC(C1OC2C(C(C(C(O2)CN)O)O)N)N)N)OPubChem:(90164161)2
3Istamycin C1 (55)432.28415.2545, 133.08544.28C19H37N5O60.611alkanolamineCCNCC1CCC(C(O1)OC2C(CC(C(C2O)N(C)C(=O)CNC=O)OC)N)NCOCONUT, KEGG, Natural products, CHEBI, PubChem2
4Netilmicin (56)476.31459.2808, 133.08544.87C21H41N5O70.595Dialkyl etherCCNC1CC(C(C(C1OC2C(C(C(CO2)(C)O)NC)O)O)OC3C(CC=C(O3)CN)N)NKEGG, COCONUT, Natural2
5Adenosine (5)268.10136.06121.28C10H13N5O40.399Purine nucleosidesC1=NC(=C2C(=N1)N(C=N2)C3C(C(C(O3)CO)O)O)NHMDB, SuperNatural HSDB, MeSH, Plantcyc, PubMed, NORMAN, COCONUT, KNApSAcK, Natural Products, PubChem, CHEBI, KEGG2
6N-{1-[(5-carbamimidamido-1-hydroxypentan-2-yl)-C-hydroxycarbonimidoyl]-2-methylpropyl-}2-[(1-hydroxyethylidene) amino]-4-methylpentanimidic acid (57)415.30119.0851, 145.063720.87C19H38N6O40.371Dipeptides CC(C)CC(C(=O)NC(C(C)C)C(=O)NC(CCCN=C(N)N)CO)NC(=O)CCOCONUT:(CNP0335012)2
7Plakoridine A (58)572.44555.4106, 133.085119.85C35H57NO50.368Fatty amides CCCCCCCCCCCCCCCCC(=O)C=C1C(C(C(N1CCC2=CC=C(C=C2)O)CCC)C(=O)OC)ONatural product, COCONUT2
8Isoschaftoside (2)565.16547.1456, 427.10275.00C26H28O140.350Flavanoid 8-C- GlycosideC1C(C(C(C(O1)C2=C3C(=C(C(=C2O)C4C(C(C(C(O4)CO)O)O)O)O)C(=O)C=C(O3)C5=CC=C(C=C5)O)O)O)OCHEBI, COCONUT, HMDB, KNApSAcK, MeSH, Natural Products, Pubchem, PubMed, SuperNatural, ZINC bio2
9Schaftoside (59)565.17529.1347, 427.1027 5.36C26H28O140.350Flavanoid 8-C- GlycosideC1C(C(C(C(O1)C2=C(C(=C3C(=C2O)C(=O)C=C(O3)C4=CC=C(C=C4)O)C5C(C(C(C(O5)CO)O)O)O)O)O)O)OCHEBI, COCONUT, HMDB, KEGG, KNApSAcK, MeSH, Natural Products, Pubchem, PubMed, SuperNatural, ZINC bio 2
10Broussonetine M1(60)348.28173.1167, 155.106213.26C18H37NO50.295Long chain fatty acidC(CCCCC(CCCCO)O)CCCC1C(C(C(N1)CO)O)OCOCONUT, Natural Product, PubChem, PubMed, KNapSAck, Supernatural2
11Vitexin (3)433.11397.0921, 313.07086.11C21H20O100.283Phenolic glycosideC1=CC(=CC=C1C2=CC(=O)C3=C(O2)C(=C(C=C3O)O)C4C(C(C(C(O4)CO)O)O)O)OHMDB, SuperNatural, ZINC, MeSH, Plantcyc, PubMed, NORMAN, COCONUT, KNApSAcK, Natural Products, CHEBI, PubChem, KEGG, Biocyc2
12Fructose phenylalanine (61)328.14292.118, 264.12281.45C15H21NO70.219Hexoses C1=CC=C(C=C1)CC(C(=O)O)NCC(=O)C(C(C(CO)O)O)OMeSH, PubMed2
13Loliolide (1)197.12179.1063, 133.10076.78C11H16O30.171Dihydrofurans O=C1OC2(C(=C1)C(C)(C)CC(O)C2)CCHEBI, COCONUT, PubChem, PubMed, Natural Product, MeSH, KNapSAck, Supernatural2
14Justicidin B (62)365.11203.0527, 185.04191.00C21H16O60.158Phenolic GlycosideCOC1=CC2=CC3=C(C(=C2C=C1OC)C4=CC5=C(C=C4)OCO5)C(=O)OC3CHEBI, COCONUT, PubChem, PubMed, Natural Product, MeSH, KNapSAck, Supernatural2
15Isoleucinopine (63)262.13244.1180, 216.12301.05C11H19NO60.136Alpha Amino AcidO=C(O)CCC(NC(C(=O)O)C(C)CC)C(=O)OCOCONUT, Natural Product, Pubchem2
16Gingerol (20)295.19277.1803, 137.059216.03C17H26O40.093Carboxylic acids O=C(CCC1=CC=C(O)C(OC)=C1)CC(O)CCCCCCHEBI, COCONUT, PubChem, PubMed, Natural Product, MeSH, KNapSAck, Supernatural2
1711-Oxooctadeca-9,12-dienoic acid (25)295.23277.2160, 259.205413.26C18H30O30.071Lineolic acids and derivativesO=C(C=CCCCCC)C=CCCCCCCCC(=O)OCOCONUT, PubChem, Natural Product, KNapSAck, Supernatural2
18L-phenylalanine (10)166.09131.0486, 120.08021.55C9H11NO20.736Phenylalanine and derivativesO=C(O)C(N)CC=1C=CC=CC1CHEBI, COCONUT, PubChem, PubMed, Natural Product, MeSH, KNapSAck, Supernatural, NORMAN, HMDB, Plantcyc2
19Watsonol B (64)277.18231.1739, 137.059118.61C17H24O30.109Prenol lipidsO=C(OCC(=C)C1CCC(=C)C2CCC(=C)C2C1O)CCOCONUT, KNapSAcK, Natural Products, PubChem, SuperNatural2
20Embelin (65)295.19203.1792, 137.0592f18.61C17H26O40.239Prenol lipidsCCCCCCCCCCCC1=C(C(=O)C=C(C1=O)O)OCOCONUT, KNapSAcK, Natural Products, PubChem, SuperNatural, CHEBI, KEGG, MeSH, ZINC bio, NORMAN2
* Metabolite Identification Confidence (MIC); Level 1: unambiguous identification by comparison of the retention time and MS/MS fragmentation with reference standards; Level 2: putative identification through MS/MS fragmentation libraries without the presence of standards; Level 3: tentative structure determination by matching MS1 information with the compound database; Level 4: matching with the molecular formula, isotope abundance distribution, adduct ion determination charge state, and ion determination; and Level 5: annotation through unique features such as mass measurement accuracy (±ppm).
Table 5. List of characterized phytochemicals from SIRIUS software.
No[M + H]+RT (min)Molecular FormulaClass of CompoundCOSMIC
1498.4020.79C26H51N5O4Aminopyrimidines and derivatives0.730
2454.3820.82C24H47N5O3Azoles0.310
3542.4320.73C28H55N5O5Amino acids and derivatives0.378
4388.253.64C17H33N5O5Heteroaromatic Compounds0.607
5484.3819.95C25H49N5O4Aminopyrimidines and derivatives0.735
6528.4119.91C27H53N5O5Benzenoids 0.546
7274.2715.88C16H35NO21,2-aminoalcohols0.087
8440.3619.99C23H45N5O3Heteroaromatic Compounds0.652
9279.0914.95C12H11FN4O3Benzoyl derivatives0.314
10399.2520.23C18H39O7PTrialkyl phosphates 0.190
11490.326.33C28H43NO6Benzenoids0.293
12586.4520.69C30H59N5O6Peptides0.372
13572.2419.85C29H57N5O6N-Acyl amines0.370
14294.161.29C12H23NO7Alpha Amino Acids and derivatives0.111
15415.254.28C18H38O10Polyethylene glycols0.303
16454.3820.82C24H47N5O3Azoles0.310
17327.2218.63C18H30O5Fatty acid methyl esters0.063
18372.262.94C17H33N5O4Aminopyrimidines and derivatives0.855
19276.141.28C8H17N7O4Primary amines0.096
20371.233.64C16H34O9Polyethylene glycols0.329
21534.356.80C24H47N5O8Dialkyl ethers0.138
22484.3919.95C25H49N5O4Aminopyrimidines and derivatives0.735
23280.141.05C11H21NO7Alpha amino acids0.170
24520.335.39C23H45N5O8Dialkyl ethers0.632
25402.275.21C18H35N5O5Dialkyl ethers0.474
26459.284.87C20H42O11Polyethylene glycols0.298
27446.295.79C20H39N5O6Heteroaromatic Compounds0.102
28388.253.64C17H33N5O5Heteroaromatic Compounds0.606
29344.232.95C15H29N5O4Dialkyl ethers0.625
30564.345.85C25H49N5O9Carboxylic acid amides0.103
31387.1816.25C29H20Phenols 0.219
32630.4820.64C23H63N5O7Fatty amides 0.372
33410.3520.85C22H43N502Aminopyrimidines and derivatives0.193
34388.263.63C17H33N5O5Aryl thiothers0.605
35304.3019.27C21H37NPhenylmethylamines0.278
36440.3619.99C23H45N5O3Heteroaromatic compounds0.463
37268.101.05C15H13BO4Glycosyl compounds0.506
38328.232.29C15H29N5O3Aminopyrimidines and derivatives0.416
39277.1816.03C17H24O3Prenol lipids0.135
40371.233.64C16H34O9Polyethylene glycol0.329
41310.131.44C15H19NO6Phenylalanine and derivatives0.145
42372.262.94C17H33N5O4Aminopyrimidines and derivatives0.855
Table 6. 1H- (in CD3OD, 600 MHz) and 13C- APT NMR (in CD3OD, 150 MHz) data of compound 1 as loliolide and a comparison with literature data from Yuan et al., 2018 [36].
Loliolide
PositionδH (ppm)δC (ppm)δH (ppm) a
(CD3OD)
δC (ppm) a
(CD3OD)
HMBCHMQCCOSYNOESY
1-35.73-35.75----
2α: 2.01 (dt, J = 14.4, 3.1)
β: 1.55 (dd, J = 14.4, 3.7,)
49.53α: 1.50 (dt, J = 14.4, 3.1)
β: 1.98 (dd, J = 4.0, 16.0)
46.53C-1, C-4, C-3, C-8
C-1, C-10, C-11
C-2H2β, H3
H2α, H3
-
34.33 (m)66.14.1965.80C-1, C-5, C-11C-3H2α, H11H11, H2β, H9
4α: 1.78 (d, J = 4.0)
β: 2.44 (dt, J = 13.6, 2.4)
46.99α: 1.71 (d, J = 4.0)
β: 2.46 (dt, J = 4.0, 16.0)
44.99C-3, C-4, C-5, C-8, C-10
C-3, C-4, C-5, C-8, C-9
C-4H4β, H3
H2α, H3
-
5-87.8-87.52----
6-170.1-172.12----
75.69 (s)112.25.80111.88C-1, C-5, C-6, C-8, C-9C-7--
8-181.5-184.13----
91.4725.81.4525.52C-1, C-4, C-8, C-11C-9--
101.2726.31.2629.57C-1, C-3, C-4, C-5, C-7, C-8, C-9C-10--
111.7829.81.7425.99C-3, C-4, C-5, C-8, C-10C-11--
Disclaimer/Publisher’s Note: The statements, opinions and data contained in all publications are solely those of the individual author(s) and contributor(s) and not of MDPI and/or the editor(s). MDPI and/or the editor(s) disclaim responsibility for any injury to people or property resulting from any ideas, methods, instructions or products referred to in the content.

