
New Triterpenoids and Anti-Inflammatory Constituents from Glinus oppositifolius

 , and
, and
Abstract
:
1. Introduction
2. Materials and Methods
2.1. General
2.2. Chemicals
2.3. Plant Material
2.4. Extraction and Isolation
2.5. Cell Culture
2.6. MTT assay
2.7. Nitric Oxide Inhibitory Assay
2.8. Enzyme-Linked Immunosorbent Assay
2.9. Statistical Analysis
3. Results and Discussion
3.1. Isolation and Structural Elucidation
3.2. Structure Identification of Known Isolated Compounds
3.3. Biological Studies
4. Conclusions
Supplementary Materials
Author Contributions
Funding
Institutional Review Board Statement
Informed Consent Statement
Data Availability Statement
Conflicts of Interest
Sample Availability
References
- Lu, S.U.; Yang, Y.P. Molluginaceae in Flora of Taiwan, 2nd ed.; Editorial Committee of the Flora of Taiwan: Taipei, Taiwan, 1996; pp. 325–328. [Google Scholar]
- Sheu, S.Y.; Yao, C.H.; Lei, Y.C.; Kuo, T.F. Recent progress in Glinus oppositifolius research. Phytochem. Pharm. Biol. 2014, 52, 1079–1084. [Google Scholar] [CrossRef] [PubMed]
- Yang, C.S.; Huang, H.C.; Wang, S.Y.; Sung, P.J.; Huang, G.J.; Chen, J.J.; Kuo, Y.H. New diphenol and isocoumarins from the aerial part of Lawsonia inermis and their inhibitory activities against NO production. Molecules 2016, 21, 1299. [Google Scholar] [CrossRef] [PubMed] [Green Version]
- Ahmed, S.; Rahman, A.; Alam, A.; Saleem, M.; Athar, M.; Sultana, S. Evaluation of the efficacy of Lawsonia alba in the alleviation of carbon tetrachloride-induced oxidative stress. J. Ethnopharmacol. 2000, 69, 157–164. [Google Scholar] [CrossRef] [PubMed]
- Liou, J.R.; Mohamed, E.S.; Du, Y.C.; Tseng, C.N.; Hwang, T.L.; Chuang, Y.L.; Hsu, Y.M.; Hsieh, P.W.; Wu, C.C.; Chen, S.L.; et al. 1,5-Diphenylpent-3-en-1-ynes and methyl naphthalene carboxylates from Lawsonia inermis and their anti-inflammatory activity. Phytochemistry 2013, 88, 67–73. [Google Scholar] [CrossRef]
- Kitagwa, I.; Yamanaka, H.; Nakanishi, T.; Yosioka, I. Saponin and sapogenol. XXII. Structure of spergulatriol, a new bisnorhopane-type genuine sapogenol of isoanhydrospergulatriol, from the root of Mollugo spergula L. Chem. Pharm. Bull. 1977, 25, 2430–2436. [Google Scholar] [CrossRef] [Green Version]
- Karin, M.; Clevers, H. Reparative inflammation takes charge of tissue regeneration. Nature 2016, 529, 307–315. [Google Scholar] [CrossRef] [Green Version]
- Bradley, J.R. TNF-Mediated inflammatory disease. J. Pathol. 2008, 214, 149–160. [Google Scholar] [CrossRef]
- Chen, S.C.; Yang, C.S.; Chen, J.J. Main bioactive components and their biological activities from natural and processed rhizomes of Polygonum sibiricum. Antioxidants 2022, 11, 1383. [Google Scholar] [CrossRef]
- Hsu, J.H.; Yang, C.S.; Chen, J.J. Antioxidant, anti-α-glucosidase, antityrosinase, and anti-inflammatory activities of bioactive components from Morus alba. Antioxidants 2022, 11, 2222. [Google Scholar] [CrossRef]
- Zhang, D.; Fu, Y.; Yang, J.; Li, X.N.; San, M.M.; Oo, T.N.; Wang, Y.; Yang, X. Triterpenoids and their glycosides from Glinus oppositifolius with antifungal activities against Microsporum gypseum and Trichophyton rubrum. Molecules 2019, 24, 2206. [Google Scholar] [CrossRef] [Green Version]
- Lee, Y.J.; Wu, T.D. Total synthesis of kaempferol and methylated kampferol derivatives. J. Chin. Chem. Soc. 2001, 48, 201–206. [Google Scholar] [CrossRef]
- Youssef, T.A.; Ramadan, M.A.; Khalifa, A.A. Acetophenones, a chalcone, a chromone and flavonoids from Pancratium maritimum. Phytochemistry 1998, 8, 2579–2583. [Google Scholar] [CrossRef]
- Kuo, Y.H.; Chu, P.H. Studies on the constituents from the bark of Bauhinia purpurea. J. Chin. Chem. Soc. 2002, 49, 269–274. [Google Scholar] [CrossRef]
- Ralf, M. Flavonoids from Leptrospermum scoparium. Phytochemistry 1990, 29, 1340–1342. [Google Scholar]
- DellaGreca, M.; Monaco, p.; Pinto, G.; Pollio, A.; Previtera, L.; Temussi, F. Phytotoxicity of low-molecular-weight phenols from olive mill waters. Bull. Environ. Contam. Toxicol. 2001, 67, 352–359. [Google Scholar] [CrossRef]
- Yasuhara, A.; Kasano, A.; Sakamoto, T. An efficient method for the deallylation of allyl aryl ethers using electrochemically generated nickel. J. Org. Chem. 1999, 64, 4211–4213. [Google Scholar] [CrossRef]
- Huang, L.; Nardos, T.; Huang, X. A facile method for oxidation of primary alcohols to carboxylic acids and its application in glycosaminoglycan syntheses. Chem. Eur. J. 2006, 12, 5246–5252. [Google Scholar] [CrossRef] [Green Version]
- Sun, R.; Sacalis, J.N.; Chin, C.K.; Still, C.C. Bioactive aromatic compounds from leaves and stems of Vanilla fragrans. J. Agric. Food. Chem. 2001, 49, 5161–5164. [Google Scholar] [CrossRef]
- Syeda, F.A.; Habib-Ur, R.; Atta-Ur, R.M.; Iqbal, C. Phytochemical investigations on Iris germanica. Nat. Prod. Res. 2010, 24, 131–139. [Google Scholar]
- Song, Y.N.; Shibuya, M.; Ebizuka, Y.; Sankawa, U. Identification of plant factors inducing virulence gene expression in Agrobacterium tumefaciens. Chem. Pharm. Bull. 1991, 39, 2347–2350. [Google Scholar] [CrossRef] [Green Version]
- Lee, T.H.; Chiou, J.L.; Lee, C.K.; Kuo, Y.H. Separation and determination of chemical constituents in the root of Rhus javanica L. var. roxburghiana. J. Chin. Chem. Soc. 2005, 52, 833–841. [Google Scholar] [CrossRef]
- Choi, J.H.; Lee, D.U. A new citryl glycoside from Gastrodia elata and its inhibitory activity on GABA transaminase. Chem. Pharm. Bull. 2006, 54, 1720–1721. [Google Scholar] [CrossRef] [PubMed] [Green Version]
- Pier, G.B.; Barbara, C.; Romeo, R.; Giampiero, S.; Angela, M.; Ennio, O.; Katia, V.; Pier, A.B. 7-Substituted 5-amino-2-(2-furyl)pyrazolo [4,3-e]-1,2,4-triazolo [1,5-c]pyrimidines as A2a adenosine receptor antagonists: A study on the importance of modifications at the side chain on the activity and solubility. J. Med. Chem. 2002, 45, 115–126. [Google Scholar]
- Miyazawa, M.; Okuno, Y.; Nakamura, S.; Kameoka, H. Suppression of SOS inducing activity of chemical mutagens by cinnamic acid derivatives from Scrophulia nangpoensis in the Salmonella typhimurium TA1536/pSK-1002 umu test. J. Agric. Food Chem. 1998, 46, 904–910. [Google Scholar] [CrossRef]
- Supaluk, P.; Saowapa, S.; Apilak, W.; Ratana, L.; Somsak, R.; Virapong, P. Bioactive metabolites from Spilanthes acmella Murr. Molecules 2009, 14, 850–867. [Google Scholar]
- Geller, D.A.; Billiar, T.R. Molecular biology of nitric oxide synthases. Cancer Metastasis Rev. 1998, 17, 7–23. [Google Scholar] [CrossRef]
- Moncada, S.; Palmer, R.M.; Higgs, E.A. Nitric oxide: Physiology, pathophysiology, and pharmacology. Pharmcol. Rev. 1991, 43, 109–142. [Google Scholar]


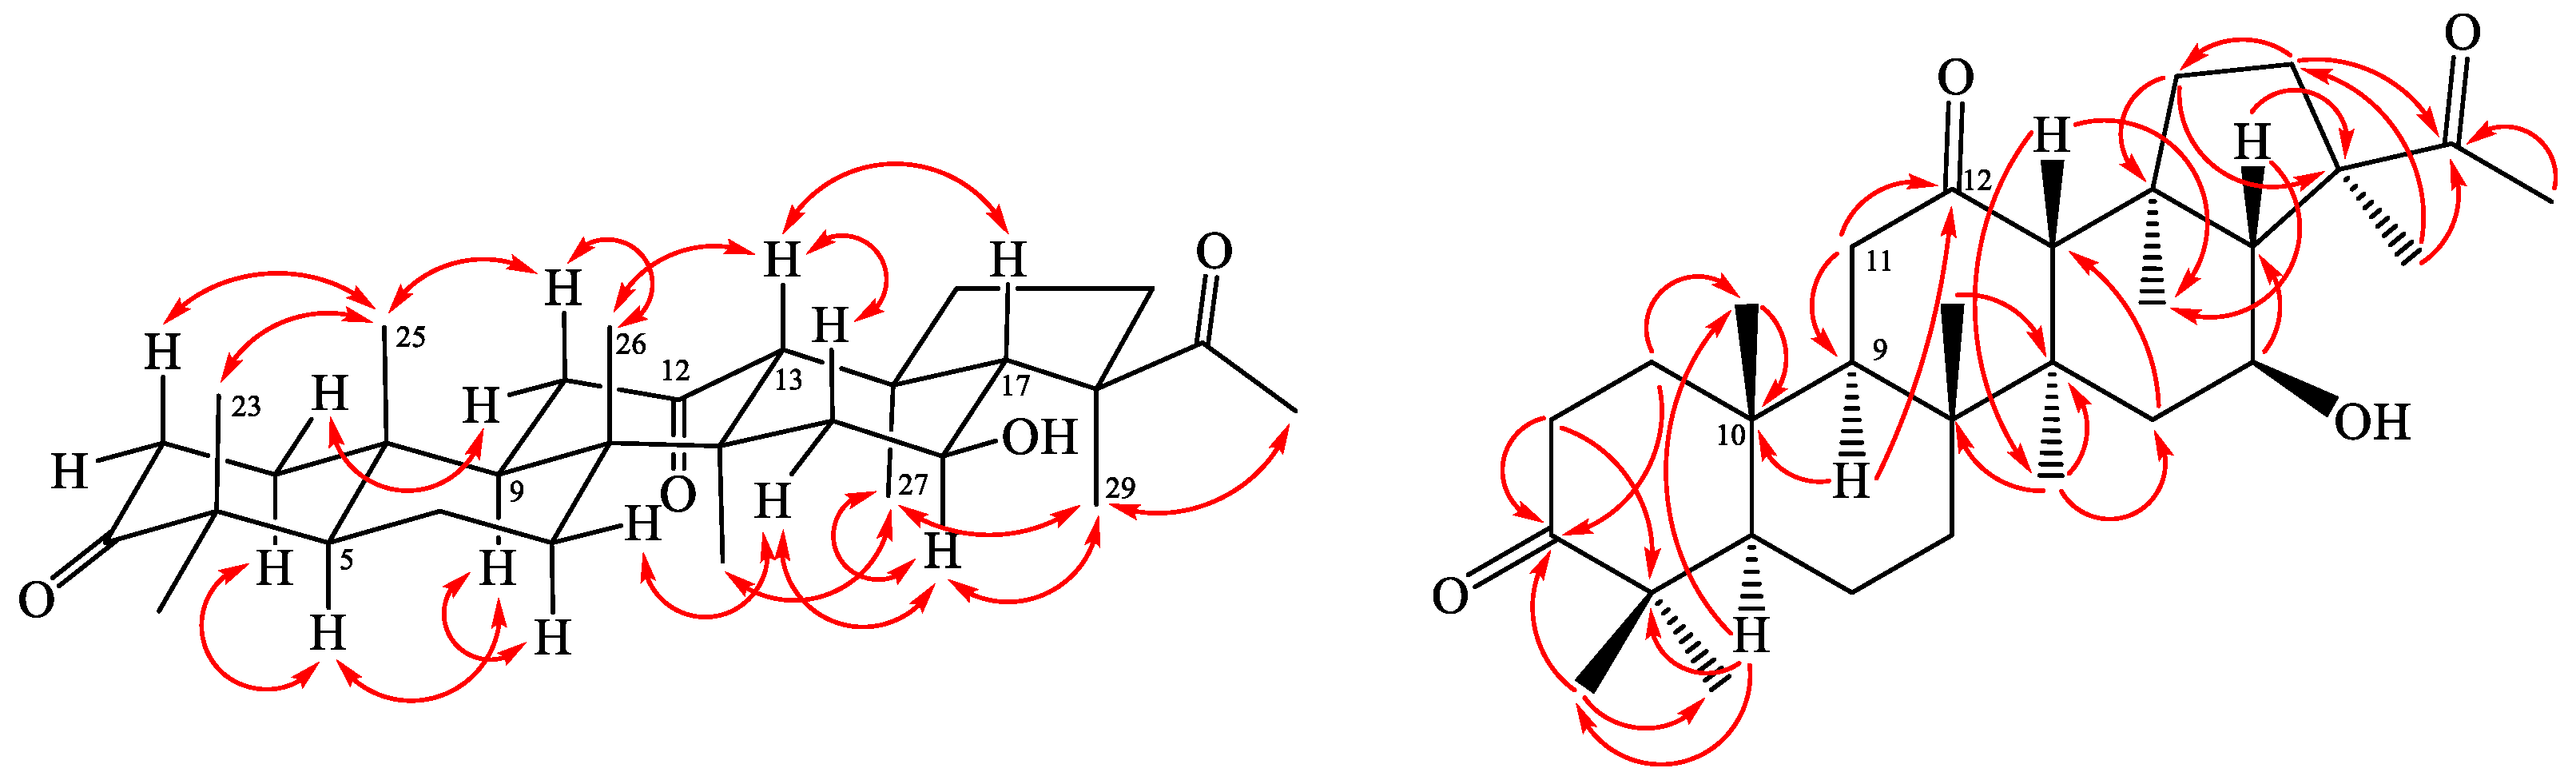
 ) and HMBC (
 ) correlations of 1.
 ) and HMBC () correlations of 1.
 ) and HMBC () correlations of 1.

| Position | 1 a | 2 a | 3 a |
|---|---|---|---|
| 1 | 1.94 (m). 1.41 (m) | 7.10 (d, J = 10.0 Hz) | 1.82 (m), 1.39 (m) |
| 2 | 2.48 (m), 2.42 (m) | 5.83 (d, J = 10.0 Hz) | 2.52 (m), 2.38 (ddd, J = 16.0, 5.6, 3.2 Hz) |
| 5 | 1.30 (m) | 1.54 (m) | 1.33 (m) |
| 6 | 1.51 (m), 1.37 (m) | 1.56 (m), 1.43 (m) | 1.60 (m), 1.35 (m) |
| 7 | 1.50 (m), 1.31 (m) | 1.50 (m), 1.44 (m) | 1.54 (m), 1.47 (m) |
| 9 | 1.69 (m) | 1.59 (m) | 1.70 (dd, J = 9.6, 4.4Hz) |
| 11 | 1.87 (m), 1.04 (m) | 1.57 (m), 1.46 (m) | 2.25 (m), 2.22 (m) |
| 12 | 3.96 | 3.99 (m) | |
| 13 | 1.38 (d, J = 4.0 Hz) | 1.43 (m) | 2.23 (m) |
| 15 | 1.72 (dd, J = 12.8, 4.0 Hz), 1.35 (m) | 1.72 (m), 1.32 (m) | 1.79 (m), 1.44 (m) |
| 16 | 3.70 (m) | 3.71 (m) | 3.76 (m) |
| 17 | 1.76 (d, J = 11.2 Hz) | 1.78 (m) | 1.64 (m) |
| 19 | 2.02 (m), 1.27 (m) | 2.04 (m), 1.28 (m) | 2.17 (m), 1.02 (m) |
| 20 | 2.05 (m), 1.84 (m) | 2.05 (m), 1.86 (m) | 2.10 (m), 1.93 (m) |
| 23 | 1.03 (s) | 1.09 (s) | 1.06 (s) |
| 24 | 1.08 (s) | 1.14 (s) | 1.10 (s) |
| 25 | 0.96 (s) | 1.08 (s) | 1.00 (s) |
| 26 | 1.07 (s) | 1.11 (s) | 1.21 (s) |
| 27 | 1.01 (s) | 1.01 (s) | 0.99 (s) |
| 28 | 1.04 (s) | 1.05 (s) | 1.14 (2) |
| 29 | 1.43 (s) | 1.45 (s) | 1.43 (s) |
| 30 | 2.23 (s) | 2.24 (s) | 2.24 (s) |
| Position | 1 a | 2 a | 3 a |
|---|---|---|---|
| 1 | 39.4 | 158.5 | 38.9 |
| 2 | 34.0 | 125.6 | 34.1 |
| 3 | 217.3 | 205.3 | 216.9 |
| 4 | 48.1 | 39.2 | 47.6 |
| 5 | 54.9 | 53.3 | 55.1 |
| 6 | 19.7 | 19.1 | 19.9 |
| 7 | 32.5 | 32.6 | 32.0 |
| 8 | 45.5 | 45.5 | 47.2 |
| 9 | 47.3 | 42.7 | 49.6 |
| 10 | 36.7 | 44.6 | 37.0 |
| 11 | 32.9 | 32.5 | 39.6 |
| 12 | 69.5 | 69.3 | 210.9 |
| 13 | 55.1 | 55.2 | 63.4 |
| 14 | 41.4 | 42.3 | 41.6 |
| 15 | 45.1 | 45.0 | 43.8 |
| 16 | 65.8 | 65.7 | 65.8 |
| 17 | 59.2 | 59.2 | 58.7 |
| 18 | 46.3 | 46.3 | 44.9 |
| 19 | 44.1 | 44.0 | 41.7 |
| 20 | 35.9 | 35.8 | 35.8 |
| 21 | 54.4 | 54.4 | 55.6 |
| 22 | 217.2 | 217.0 | 217.3 |
| 23 | 21.1 | 21.4 | 21.4 |
| 24 | 26.6 | 27.8 | 26.6 |
| 25 | 15.6 | 17.1 | 15.2 |
| 26 | 16.6 | 17.2 | 16.7 |
| 27 | 18.7 | 18.9 | 20.9 |
| 28 | 17.2 | 18.8 | 17.7 |
| 29 | 21.2 | 21.1 | 21.4 |
| 30 | 25.9 | 25.9 | 26.1 |
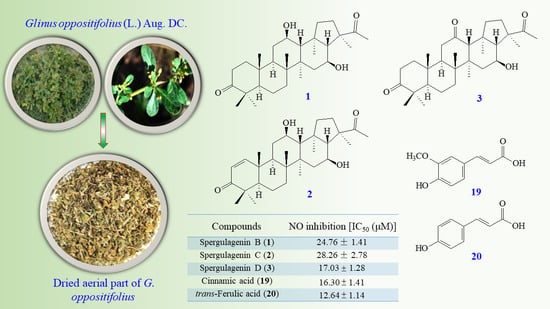
| Compounds | NO Inhibition IC50 (μM) a |
|---|---|
| Spergulagenin B (1) | 24.76 ± 1.41 *** |
| Spergulagenin C (2) | 28.26 ± 2.78 ** |
| Spergulagenin D (3) | 17.03 ± 1.28 |
| Kaempferol (4) | 38.87 ± 1.68 *** |
| 6,8-Dimethyl-5,7,4′-trihydroxyflavone (5) | 18.21 ± 1.15 |
| 5,7-Dihydroxy-6,8-dimethylflavone (6) | 43.61 ± 2.96 *** |
| 5,4′-Dihydroxy-7-methoxy-6,8-dimethylflavone (7) | 32.08 ± 2.75 ** |
| 4-Hydroxybenzoic acid (8) | 75.83 ± 6.63 ** |
| 4-Hydroxybenzaldehyde (9) | 88.20 ± 7.78 ** |
| 4-Hydroxyacetophenone (10) | 76.24 ± 6.55 ** |
| Methyl 4-Hydroxybenzoate (11) | 78.50 ± 8.00 ** |
| p-Anisic acid (12) | 115.58 ± 10.35 ** |
| Vanillin (13) | 94.95 ± 10.99 ** |
| 4-Hydroxy-3-methoxyacetophenone (14) | 111.29 ± 12.91 ** |
| Acetosyringone (15) | 75.43 ± 6.63 ** |
| 4-Hydroxy-3, 5-dimethoxybenzaldehyde (16) | 86.62 ± 7.74 ** |
| 4-Hydroxybenzyl alcohol (17) | 78.64 ± 7.23 ** |
| 2-(4-Hydroxyphenyl)ethanol (18) | 28.47 ± 1.94 *** |
| Cinnamic acid (19) | 16.30 ± 1.41 |
| trans-Ferulic acid (20) | 12.64 ± 1.14 ** |
| Quercetin b | 16.74 ± 1.26 |
| Compounds | TNF-α Inhibition IC50 (μM) a |
|---|---|
| Spergulagenin B (1) | 30.49 ± 2.20 ** |
| Spergulagenin C (2) | 31.36 ± 2.59 ** |
| Spergulagenin D (3) | 18.35 ± 1.34 ** |
| Kaempferol (4) | 35.71 ± 4.74 * |
| 6,8-Dimethyl-5,7,4′-trihydroxyflavone (5) | 17.56 ± 1.41 ** |
| 5,7-Dihydroxy-6,8-dimethylflavone (6) | 39.48 ± 3.06 ** |
| 5,4′-Dihydroxy-7-methoxy-6,8-dimethylflavone (7) | 34.17 ± 2.49 ** |
| 4-Hydroxybenzoic acid (8) | 80.02 ± 7.10 ** |
| 4-Hydroxybenzaldehyde (9) | 86.38 ± 6.28 *** |
| 4-Hydroxyacetophenone (10) | 79.03 ± 5.26 *** |
| Methyl 4-Hydroxybenzoate (11) | 82.33 ± 7.25 ** |
| p-Anisic acid (12) | 125.84 ± 11.47 ** |
| Vanillin (13) | 102.35 ± 9.36 ** |
| 4-Hydroxy-3-methoxyacetophenone (14) | 123.07 ± 11.37 ** |
| Acetosyringone (15) | 68.38 ± 5.48 ** |
| 4-Hydroxy-3, 5-dimethoxybenzaldehyde (16) | 77.39 ± 6.73 ** |
| 4-Hydroxybenzyl alcohol (17) | 69.38 ± 6.24 ** |
| 2-(4-Hydroxyphenyl)ethanol (18) | 26.44 ± 2.35 * |
| Cinnamic acid (19) | 22.00 ± 1.51 ** |
| trans-Ferulic acid (20) | 14.27 ± 1.29 ** |
| Quercetin b | 5.08 ± 0.23 |
Disclaimer/Publisher’s Note: The statements, opinions and data contained in all publications are solely those of the individual author(s) and contributor(s) and not of MDPI and/or the editor(s). MDPI and/or the editor(s) disclaim responsibility for any injury to people or property resulting from any ideas, methods, instructions or products referred to in the content. |
© 2023 by the authors. Licensee MDPI, Basel, Switzerland. This article is an open access article distributed under the terms and conditions of the Creative Commons Attribution (CC BY) license (https://creativecommons.org/licenses/by/4.0/).
Share and Cite
Chen, J.-J.; Yang, C.-S.; Chen, Y.-H.; Chao, C.-Y.; Chen, Y.-C.; Kuo, Y.-H. New Triterpenoids and Anti-Inflammatory Constituents from Glinus oppositifolius. Molecules 2023, 28, 2903. https://doi.org/10.3390/molecules28072903
Chen J-J, Yang C-S, Chen Y-H, Chao C-Y, Chen Y-C, Kuo Y-H. New Triterpenoids and Anti-Inflammatory Constituents from Glinus oppositifolius. Molecules. 2023; 28(7):2903. https://doi.org/10.3390/molecules28072903
Chicago/Turabian StyleChen, Jih-Jung, Chang-Syun Yang, Yu-Hui Chen, Che-Yi Chao, Yu-Chang Chen, and Yeuh-Hsiung Kuo. 2023. "New Triterpenoids and Anti-Inflammatory Constituents from Glinus oppositifolius" Molecules 28, no. 7: 2903. https://doi.org/10.3390/molecules28072903