
Monitoring the Release of Methylglyoxal (MGO) from Honey and Honey-Based Formulations

 ,
,  ,
,
Abstract
:1. Introduction
2. Results
3. Discussion
4. Materials and Methods
4.1. Samples
4.2. Chemicals and Reagents
4.3. In Vitro Release of MGO
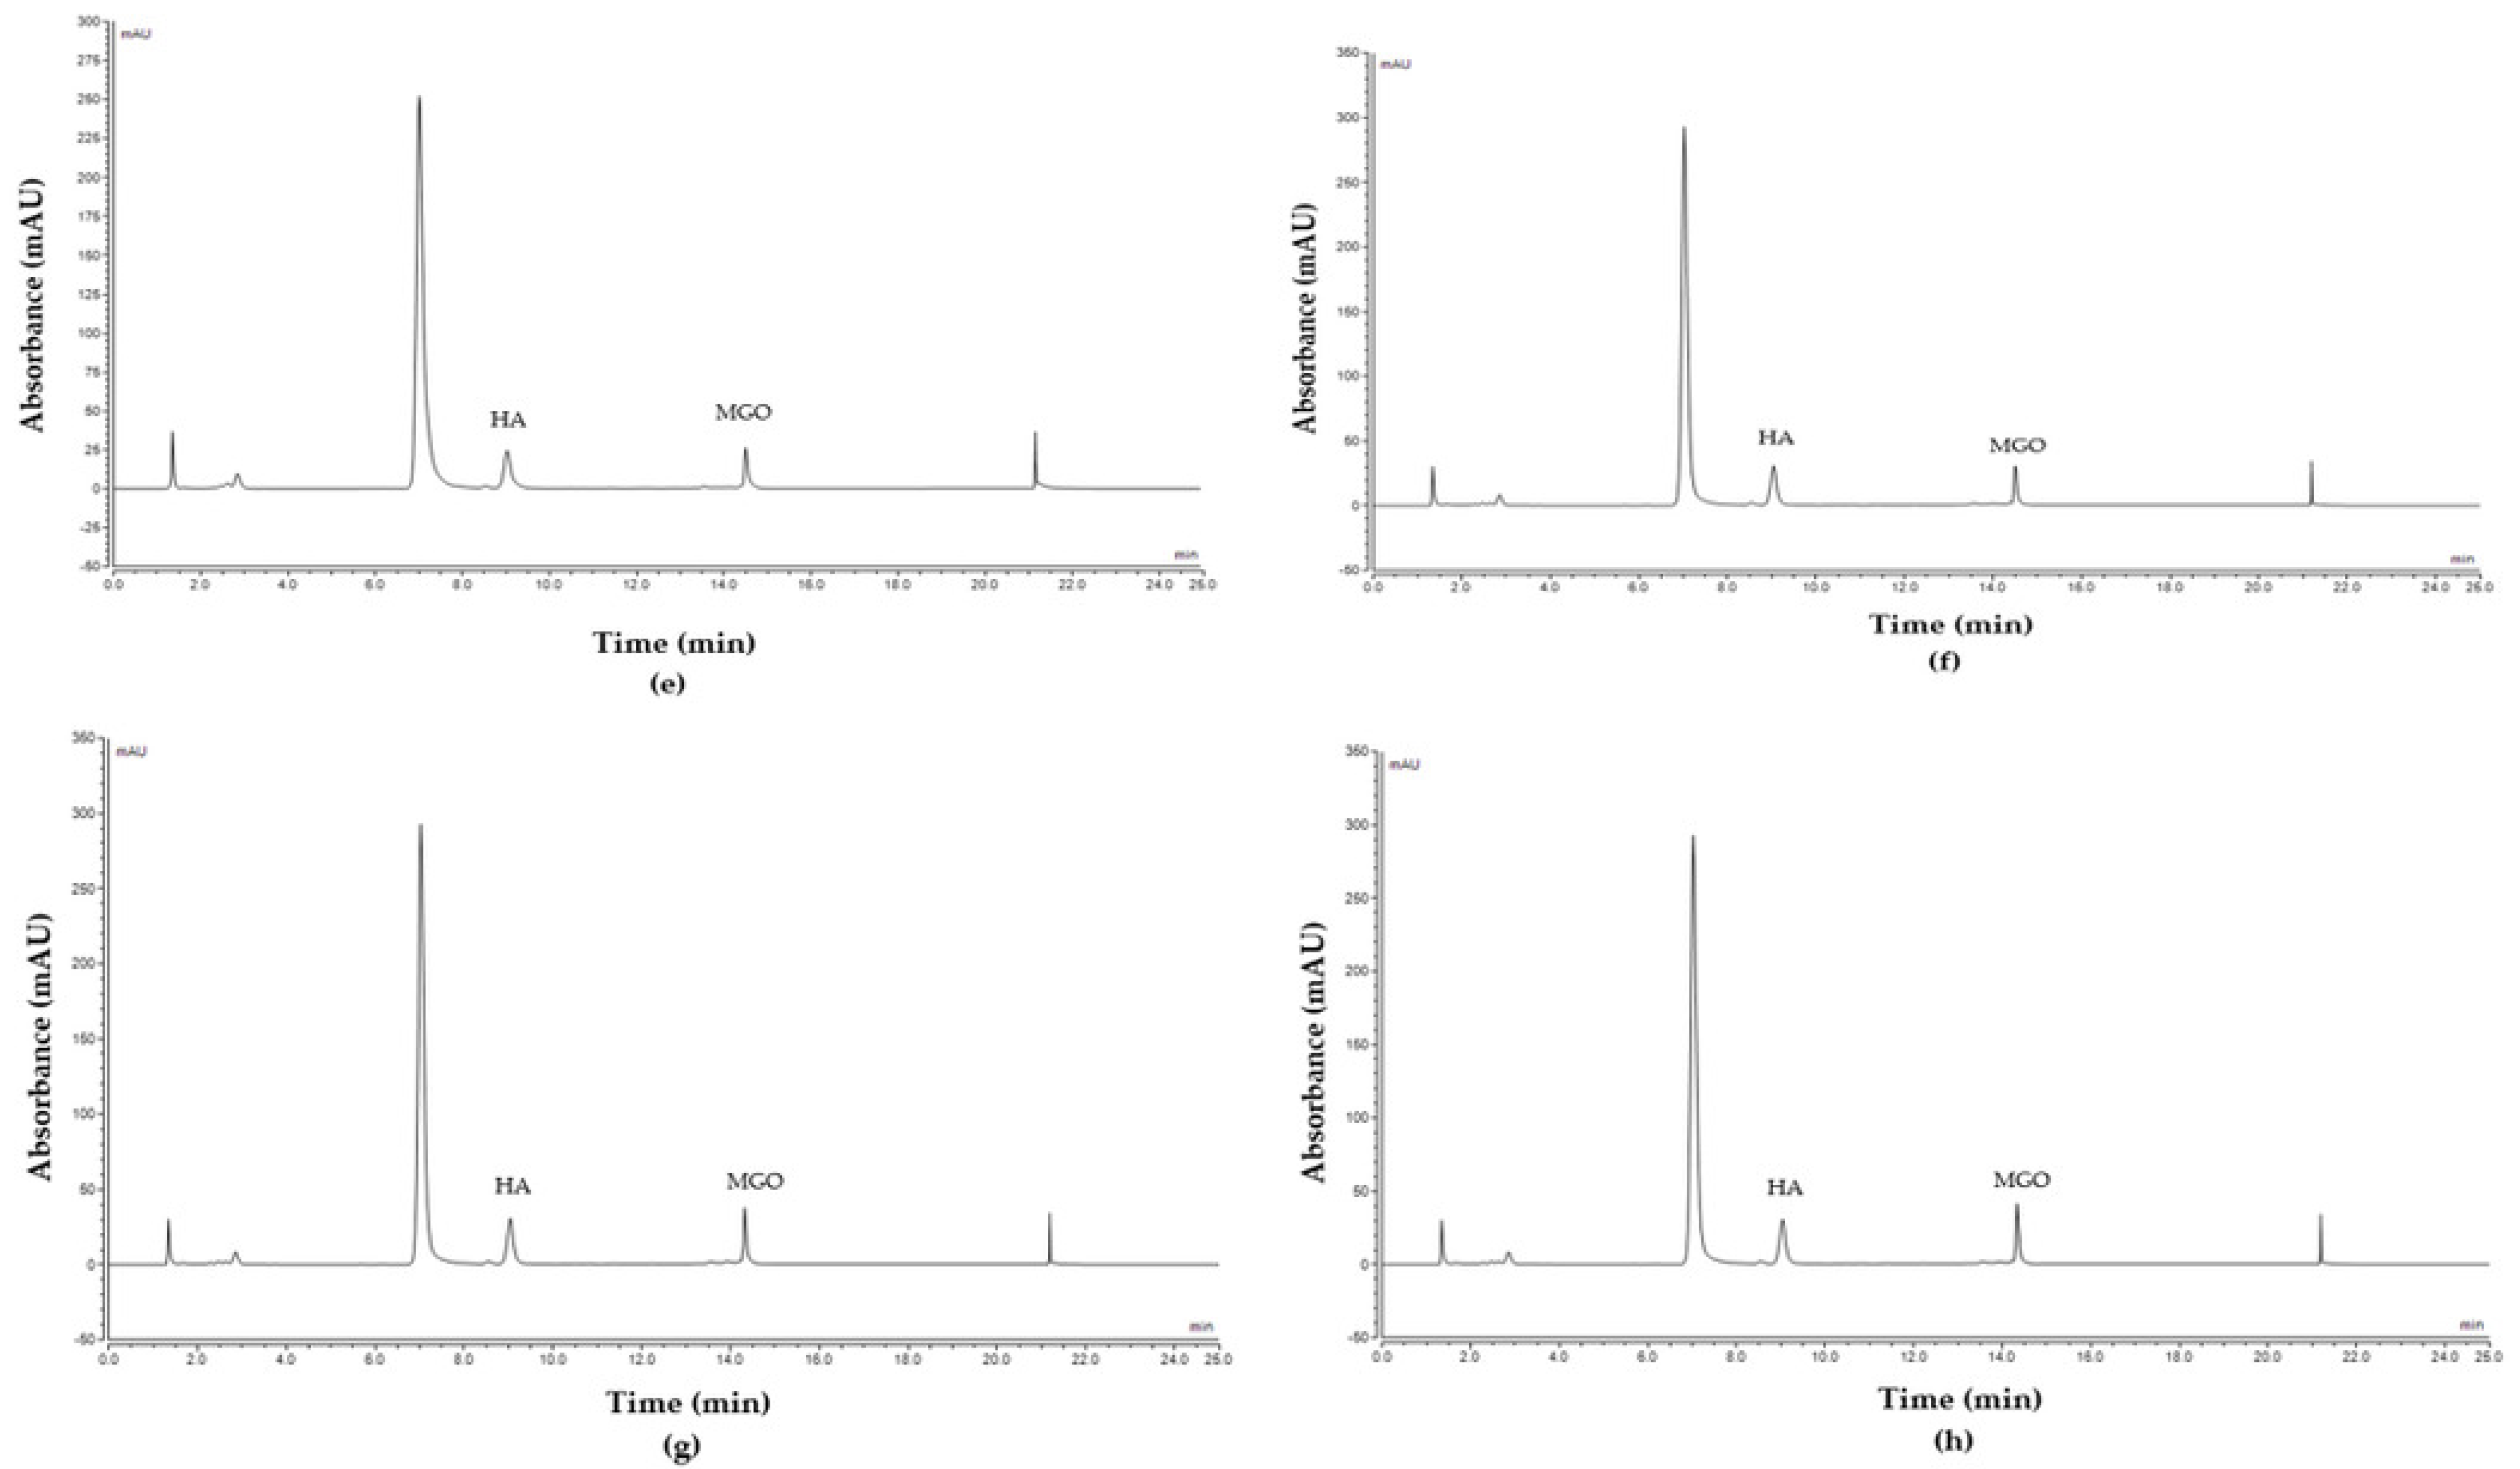
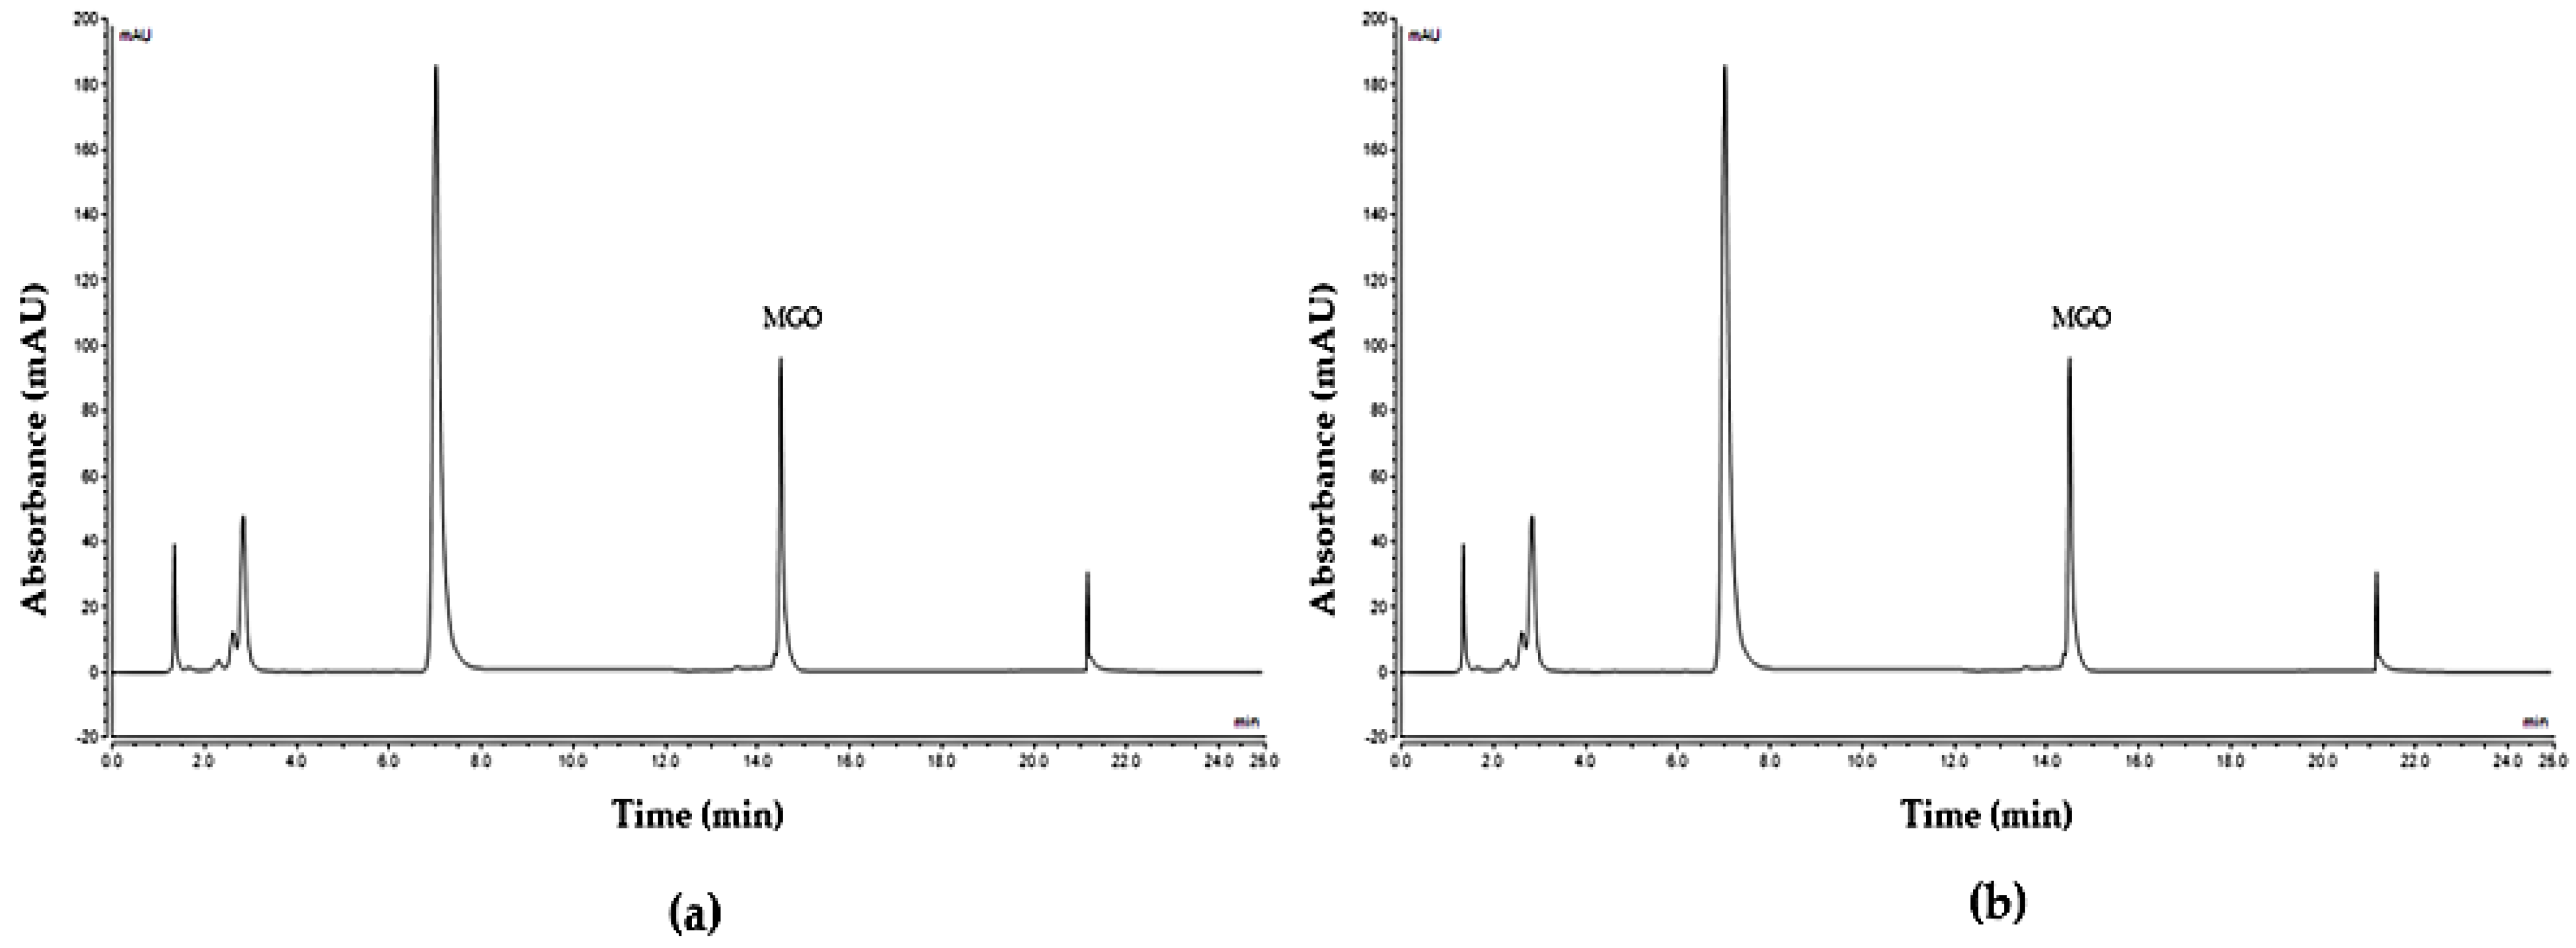
4.4. HPLC Analysis of Released MGO
4.4.1. HPLC Conditions
4.4.2. Preparation of PFBHA Derivatisation Solution
4.4.3. Preparation of HA Internal Standard Solution
4.4.4. Preparation of Artificial Honey with Known MGO Content
4.4.5. Preparation of Standards
4.4.6. Sample Preparation
4.5. Statistical Analysis
5. Conclusions
Supplementary Materials
Author Contributions
Funding
Institutional Review Board Statement
Informed Consent Statement
Data Availability Statement
Conflicts of Interest
References
- Irish, J.; Blair, S.; Carter, D.A. The antibacterial activity of honey derived from Australian flora. PLoS ONE 2011, 6, e18229. [Google Scholar] [CrossRef]
- Saranraj, P.; Sivasakthi, S.; Feliciano, G. Pharmacology of Honey: A Review. Biol. Res. 2016, 10, 271–289. [Google Scholar]
- Bang, L.M.; Buntting, C.; Molan, P. The effect of dilution on the rate of hydrogen peroxide production in honey and its implications for wound healing. J. Altern. Complement. Med. 2003, 9, 267–273. [Google Scholar] [CrossRef] [PubMed] [Green Version]
- Sultana, S.; Foster, K.; Lim, L.Y.; Hammer, K.; Locher, C. A Review of the Phytochemistry and Bioactivity of Clover Honeys (Trifolium spp.). Foods 2022, 11, 1901. [Google Scholar] [CrossRef] [PubMed]
- Cornara, L.; Biagi, M.; Xiao, J.; Burlando, B. Therapeutic Properties of Bioactive Compounds from Different Honeybee Products. Front. Pharm. 2017, 8, 412. [Google Scholar] [CrossRef] [PubMed] [Green Version]
- Saikaly, S.; Khachemoune, A. Honey and Wound Healing: An Update. Am. J. Clin. Dermatol. 2017, 18, 237–251. [Google Scholar] [CrossRef]
- Hossain, M.L.; Hammer, K.; Lim, L.Y.; Hettiarachchi, D.; Locher, C. Optimisation of an agar overlay assay for the assessment of the antimicrobial activity of topically applied semi-solid antiseptic products including honey-based formulations. J. Microbiol. Methods 2022, 202, 106596. [Google Scholar] [CrossRef]
- Hossain, M.L.; Lim, L.Y.; Hammer, K.; Hettiarachchi, D.; Locher, C. A Review of Commonly Used Methodologies for Assessing the Antibacterial Activity of Honey and Honey Products. Antibiotics 2022, 11, 975. [Google Scholar] [CrossRef]
- Oryan, A.; Alemzadeh, E.; Moshiri, A. Biological properties and therapeutic activities of honey in wound healing: A narrative review and meta-analysis. J. Tissue Viability 2016, 25, 98–118. [Google Scholar] [CrossRef] [PubMed]
- Tan, H.T.; Rahman, R.A.; Gan, S.H.; Halim, A.S.; Hassan, S.A.; Sulaiman, S.A.; Kirnpal-Kaur, B. The antibacterial properties of Malaysian tualang honey against wound and enteric microorganisms in comparison to manuka honey. BMC Complement. Altern. Med. 2009, 9, 34. [Google Scholar] [CrossRef] [PubMed] [Green Version]
- Mandal, M.D.; Mandal, S. Honey: Its medicinal property and antibacterial activity. Asian Pac. J. Trop. Biomed. 2011, 1, 154–160. [Google Scholar] [CrossRef] [PubMed] [Green Version]
- Adams, C.J.; Boult, C.H.; Deadman, B.J.; Farr, J.M.; Grainger, M.N.; Manley-Harris, M.; Snow, M.J. Isolation by HPLC and characterisation of the bioactive fraction of New Zealand manuka (Leptospermum scoparium) honey. Carbohydr. Res. 2007, 343, 651–659. [Google Scholar] [CrossRef] [PubMed]
- Atrott, J.; Henle, T. Methylglyoxal in Manuka Honey—Correlation with Antibacterial Properties. Czech J. Food Sci. 2009, 27, S163–S165. [Google Scholar] [CrossRef] [Green Version]
- Sancho, M.T.; Muniategui, S.; Huidobro, J.F.; Lozano, J.S. Aging of honey. J. Agric. Food Chem. 1992, 40, 134–138. [Google Scholar] [CrossRef]
- Hossain, M.L.; Lim, L.Y.; Hammer, K.; Hettiarachchi, D.; Locher, C. Honey-Based Medicinal Formulations: A Critical Review. Appl. Sci. 2021, 11, 5159. [Google Scholar] [CrossRef]
- Lee, D.S.; Sinno, S.; Khachemoune, A. Honey and Wound Healing. Am. J. Clin. Dermatol. 2011, 12, 181–190. [Google Scholar] [CrossRef] [PubMed]
- Minden-Birkenmaier, B.A.; Bowlin, G.L. Honey-Based Templates in Wound Healing and Tissue Engineering. Bioengineering 2018, 5, 46. [Google Scholar] [CrossRef] [Green Version]
- Brown, C.K.; Friedel, H.D.; Barker, A.R.; Buhse, L.F.; Keitel, S.; Cecil, T.L.; Kraemer, J.; Morris, J.M.; Reppas, C.; Stickelmeyer, M.P.; et al. FIP/AAPS joint workshop report: Dissolution/in vitro release testing of novel/special dosage forms. AAPS PharmSciTech 2011, 12, 782–794. [Google Scholar] [CrossRef] [PubMed] [Green Version]
- Khengar, R.H.; Jones, S.A.; Turner, R.B.; Forbes, B.; Brown, M.B. Nail swelling as a pre-formulation screen for the selection and optimisation of ungual penetration enhancers. Pharm. Res. 2007, 24, 2207–2212. [Google Scholar] [CrossRef] [Green Version]
- Simon, A.; Amaro, M.I.; Healy, A.M.; Cabral, L.M.; de Sousa, V.P. Comparative evaluation of rivastigmine permeation from a transdermal system in the Franz cell using synthetic membranes and pig ear skin with in vivo-in vitro correlation. Int. J. Pharm. 2016, 512, 234–241. [Google Scholar] [CrossRef]
- Kulkarni, K.N.; Datta-Gupta, A. Estimating Relative Permeability From Production Data: A Streamline Approach. SPE J. 2000, 5, 402–411. [Google Scholar] [CrossRef] [Green Version]
- Pappalardo, M.; Pappalardo, L.; Brooks, P. Rapid and Reliable HPLC Method for the Simultaneous Determination of Dihydroxyacetone, Methylglyoxal and 5-Hydroxymethylfurfural in Leptospermum Honeys. PLoS ONE 2016, 11, e0167006. [Google Scholar] [CrossRef] [PubMed]
- Abdel-Mottaleb, M.M.A.; Lamprecht, A. Standardized in vitro drug release test for colloidal drug carriers using modified USP dissolution apparatus I. Drug Dev. Ind. Pharm. 2011, 37, 178–184. [Google Scholar] [CrossRef] [PubMed]
- Cao, X.; Deng, W.W.; Fu, M.; Wang, L.; Tong, S.S.; Wei, Y.W.; Xu, Y.; Su, W.Y.; Xu, X.M.; Yu, J.N. In vitro release and in vitro-in vivo correlation for silybin meglumine incorporated into hollow-type mesoporous silica nanoparticles. Int. J. Nanomed. 2012, 7, 753–762. [Google Scholar]
- Molan, P.C. The evidence and the rationale for the use of honey as wound dressing. Wound Pract. Res. J. Aust. Wound Manag. Assoc. 2011, 19, 204–220. [Google Scholar]
- Cooper, R.A.; Molan, P.C.; Harding, K.G. The sensitivity to honey of Gram-positive cocci of clinical significance isolated from wounds. J. Appl. Microbiol. 2002, 93, 857–863. [Google Scholar] [CrossRef] [Green Version]
- Molan, P.C. Potential of honey in the treatment of wounds and burns. Am. J. Clin. Dermatol. 2001, 2, 13–19. [Google Scholar] [CrossRef]
- Chan, D.C.; Fong, D.H.; Leung, J.Y.; Patil, N.G.; Leung, G.K. Maggot debridement therapy in chronic wound care. Hong Kong Med. J. 2007, 13, 382–386. [Google Scholar] [PubMed]
- Fonder, M.A.; Lazarus, G.S.; Cowan, D.A.; Aronson-Cook, B.; Kohli, A.R.; Mamelak, A.J. Treating the chronic wound: A practical approach to the care of non-healing wounds and wound care dressings. J. Am. Acad. Dermatol. 2008, 58, 185–206. [Google Scholar] [CrossRef] [PubMed]


| Sample * | MGO at Baseline | % MGO of Baseline Released at Different Time Points (h) | ||||||
|---|---|---|---|---|---|---|---|---|
| 0.25 | 0.5 | 1 | 3 | 6 | 9 | 12 | ||
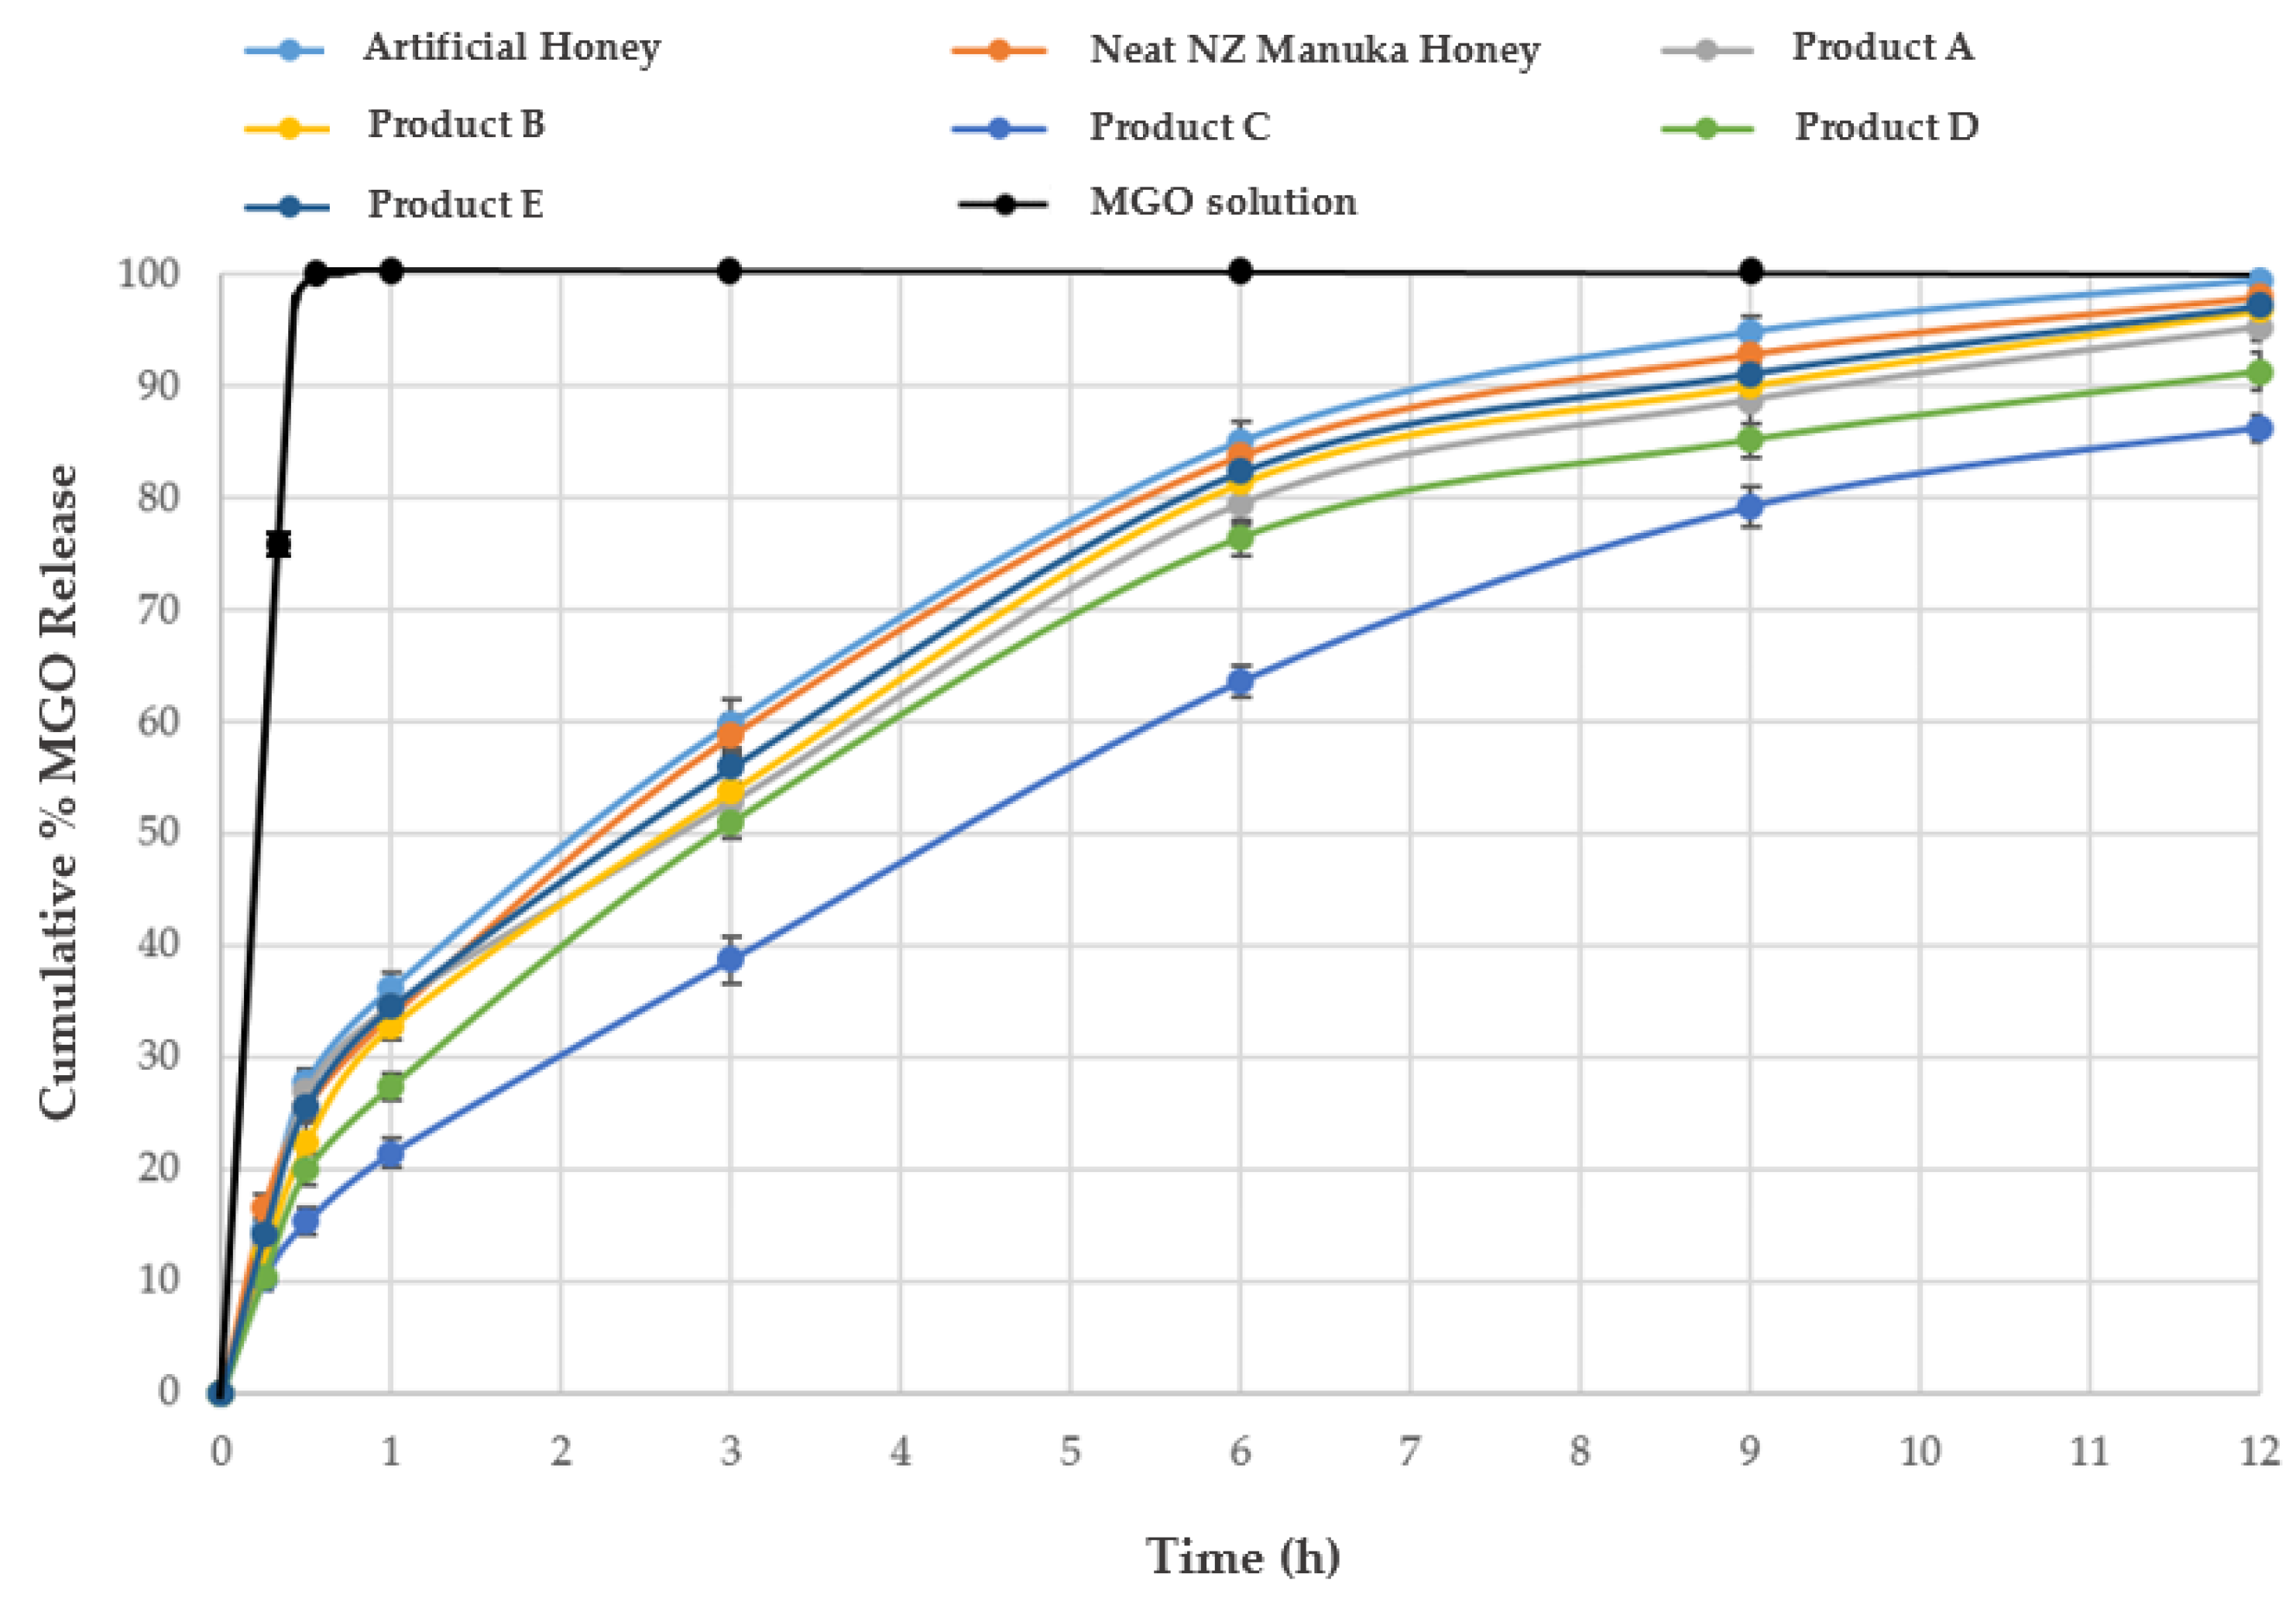
| MGO solution | 0.6 (mg/mL) | 75.01 ± 0.90 | 100.00 ± 0.0 | 100.00 ± 0.0 | 100.00 ± 0.0 | 100.00 ± 0.0 | 100.00 ± 0.0 | 100.00 ± 0.0 |
| Artificial Honey | 500.11 ± 1.55 (mg/kg) | 14.69 ± 0.94 | 27.81 ± 1.30 | 36.27 ± 1.40 | 59.89 ± 2.20 | 85.08 ± 1.80 | 94.81 ± 1.50 | 99.49 ± 1.90 |
| Pure NZ Manuka Honey | 348.53 ± 1.84 (mg/kg) | 16.60 ± 1.20 | 25.65 ± 0.98 | 33.87 ± 1.60 | 58.82 ± 1.90 | 83.88 ± 1.60 | 92.94 ± 1.40 | 98.05 ± 1.30 |
| Product A | 252.55 ± 1.84 (mg/kg) | 13.28 ± 0.95 | 26.95 ± 1.70 | 34.67 ± 1.40 | 52.81 ± 1.31 | 79.49 ± 1.91 | 88.74 ± 2.10 | 95.26 ± 1.20 |
| Product B | 779.42 ± 1.34 (mg/kg) | 12.33 ± 1.40 | 22.49 ± 1.80 | 32.87 ± 1.20 | 53.86 ± 1.50 | 81.41 ± 1.80 | 90.11 ± 1.90 | 96.85 ± 1.40 |
| Product C | 605.45 ± 1.54 (mg/kg) | 10.25 ± 1.10 | 15.37 ± 1.20 | 21.50 ± 1.30 | 38.80 ± 2.10 | 63.63 ± 1.40 | 79.24 ± 1.80 | 86.30 ± 1.20 |
| Product D | 700.14 ± 1.68 (mg/kg) | 10.45 ± 1.20 | 19.97 ± 1.40 | 27.53 ± 1.20 | 51.06 ± 1.50 | 76.54 ± 1.60 | 85.23 ± 1.50 | 91.34 ± 1.70 |
| Product E | 156.03 ± 1.75 (mg/kg) | 14.25 ± 1.30 | 25.72 ± 1.40 | 34.54 ± 1.60 | 55.95 ± 1.30 | 82.36 ± 1.10 | 91.13 ± 1.50 | 97.18 ± 1.40 |
| Sample | Time (h) Required to Release 25, 50 and 75% MGO | ||
|---|---|---|---|
| T25% | T50% | T75% | |
| MGO solution | 0.083 ± 1.10 | 0.17 ± 1.20 | 0.25 ± 1.10 |
| Artificial Honey | 0.44 ± 0.94 | 2.09 ± 1.3 | 4.63 ± 1.43 |
| Pure NZ Manuka Honey | 0.49 ± 1.21 | 2.24 ± 0.98 | 4.75 ± 1.62 |
| Product A | 0.45 ± 0.95 | 2.69 ± 1.72 | 5.38 ± 1.41 |
| Product B | 0.56 ± 1.42 | 2.61 ± 1.81 | 5.13 ± 1.22 |
| Product C | 1.63 ± 1.10 | 4.26 ± 1.23 | 8.0 ± 1.34 |
| Product D | 0.78 ± 1.20 | 2.88 ± 1.42 | 5.75 ± 1.21 |
| Product E | 0.48 ± 1.30 | 2.38 ± 1.41 | 5.0 ± 1.61 |
| Product Name * | Product Type | Manuka Honey (%) | Stated MGO Content (mg/kg) | Listed Excipients | Claimed Application |
|---|---|---|---|---|---|
| Product A | Gel | 80 | Not stated | Sweet almond oil (Prunus amygdalus) | Contact layer for wounds such as venous ulcers, pressure ulcers (I–IV), diabetic Ulcers, 1st and 2nd degree burns, surgical wounds, donor and recipient graft sites, sloughy, malodorous wounds, general First Aid |
| Product B | Gel | 99 | 800 | Allantoin, propylene glycol | Burns, acute and chronic wounds, venous and arterial leg ulcers, diabetic, lower limb/foot ulcers, pressure sores, minor infection of postoperative wounds |
| Product C | Gel | 80 | Not stated | Natural oils and waxes | Non-healing and chronic wounds, traumatic, acute and surgical wounds, malodorous and sloughy wounds, burns and as a general first aid |
| Product D | Gel | 80 | Not stated | Natural wax and oils | Diabetic foot ulcers, leg ulcers, pressure ulcers/ sores, 1st and 2nd degree partial thickness burns, donor sites, and traumatic and surgical wounds |
| Product E | Gel | 98 | Not stated | Glycerol, Gum (Acacia senegal) | Dry eye symptoms such as sore, irritated eyes and eyelids. Assist the surface health of the eye by creating a microenvironment that supports healing and prevents further damage |
Disclaimer/Publisher’s Note: The statements, opinions and data contained in all publications are solely those of the individual author(s) and contributor(s) and not of MDPI and/or the editor(s). MDPI and/or the editor(s) disclaim responsibility for any injury to people or property resulting from any ideas, methods, instructions or products referred to in the content. |
© 2023 by the authors. Licensee MDPI, Basel, Switzerland. This article is an open access article distributed under the terms and conditions of the Creative Commons Attribution (CC BY) license (https://creativecommons.org/licenses/by/4.0/).
Share and Cite
Hossain, M.L.; Lim, L.Y.; Hammer, K.; Hettiarachchi, D.; Locher, C. Monitoring the Release of Methylglyoxal (MGO) from Honey and Honey-Based Formulations. Molecules 2023, 28, 2858. https://doi.org/10.3390/molecules28062858
Hossain ML, Lim LY, Hammer K, Hettiarachchi D, Locher C. Monitoring the Release of Methylglyoxal (MGO) from Honey and Honey-Based Formulations. Molecules. 2023; 28(6):2858. https://doi.org/10.3390/molecules28062858
Chicago/Turabian StyleHossain, Md Lokman, Lee Yong Lim, Katherine Hammer, Dhanushka Hettiarachchi, and Cornelia Locher. 2023. "Monitoring the Release of Methylglyoxal (MGO) from Honey and Honey-Based Formulations" Molecules 28, no. 6: 2858. https://doi.org/10.3390/molecules28062858