
Comparative Analysis of the Quality in Ripe Fruits of Cuiguan Pear from Different Regions

Abstract
:1. Introduction
2. Results and Dissussion
2.1. Chemical and Physical Parameters in Cuiguan Pear
2.2. Mineral Element in Cuiguan Pear
2.3. HS-GC-IMS Topographic Plots of Cuiguan Pear
2.4. Fingerprint Analysis of Volatile Compounds in Cuiguan Pear
2.5. PCA Analysis
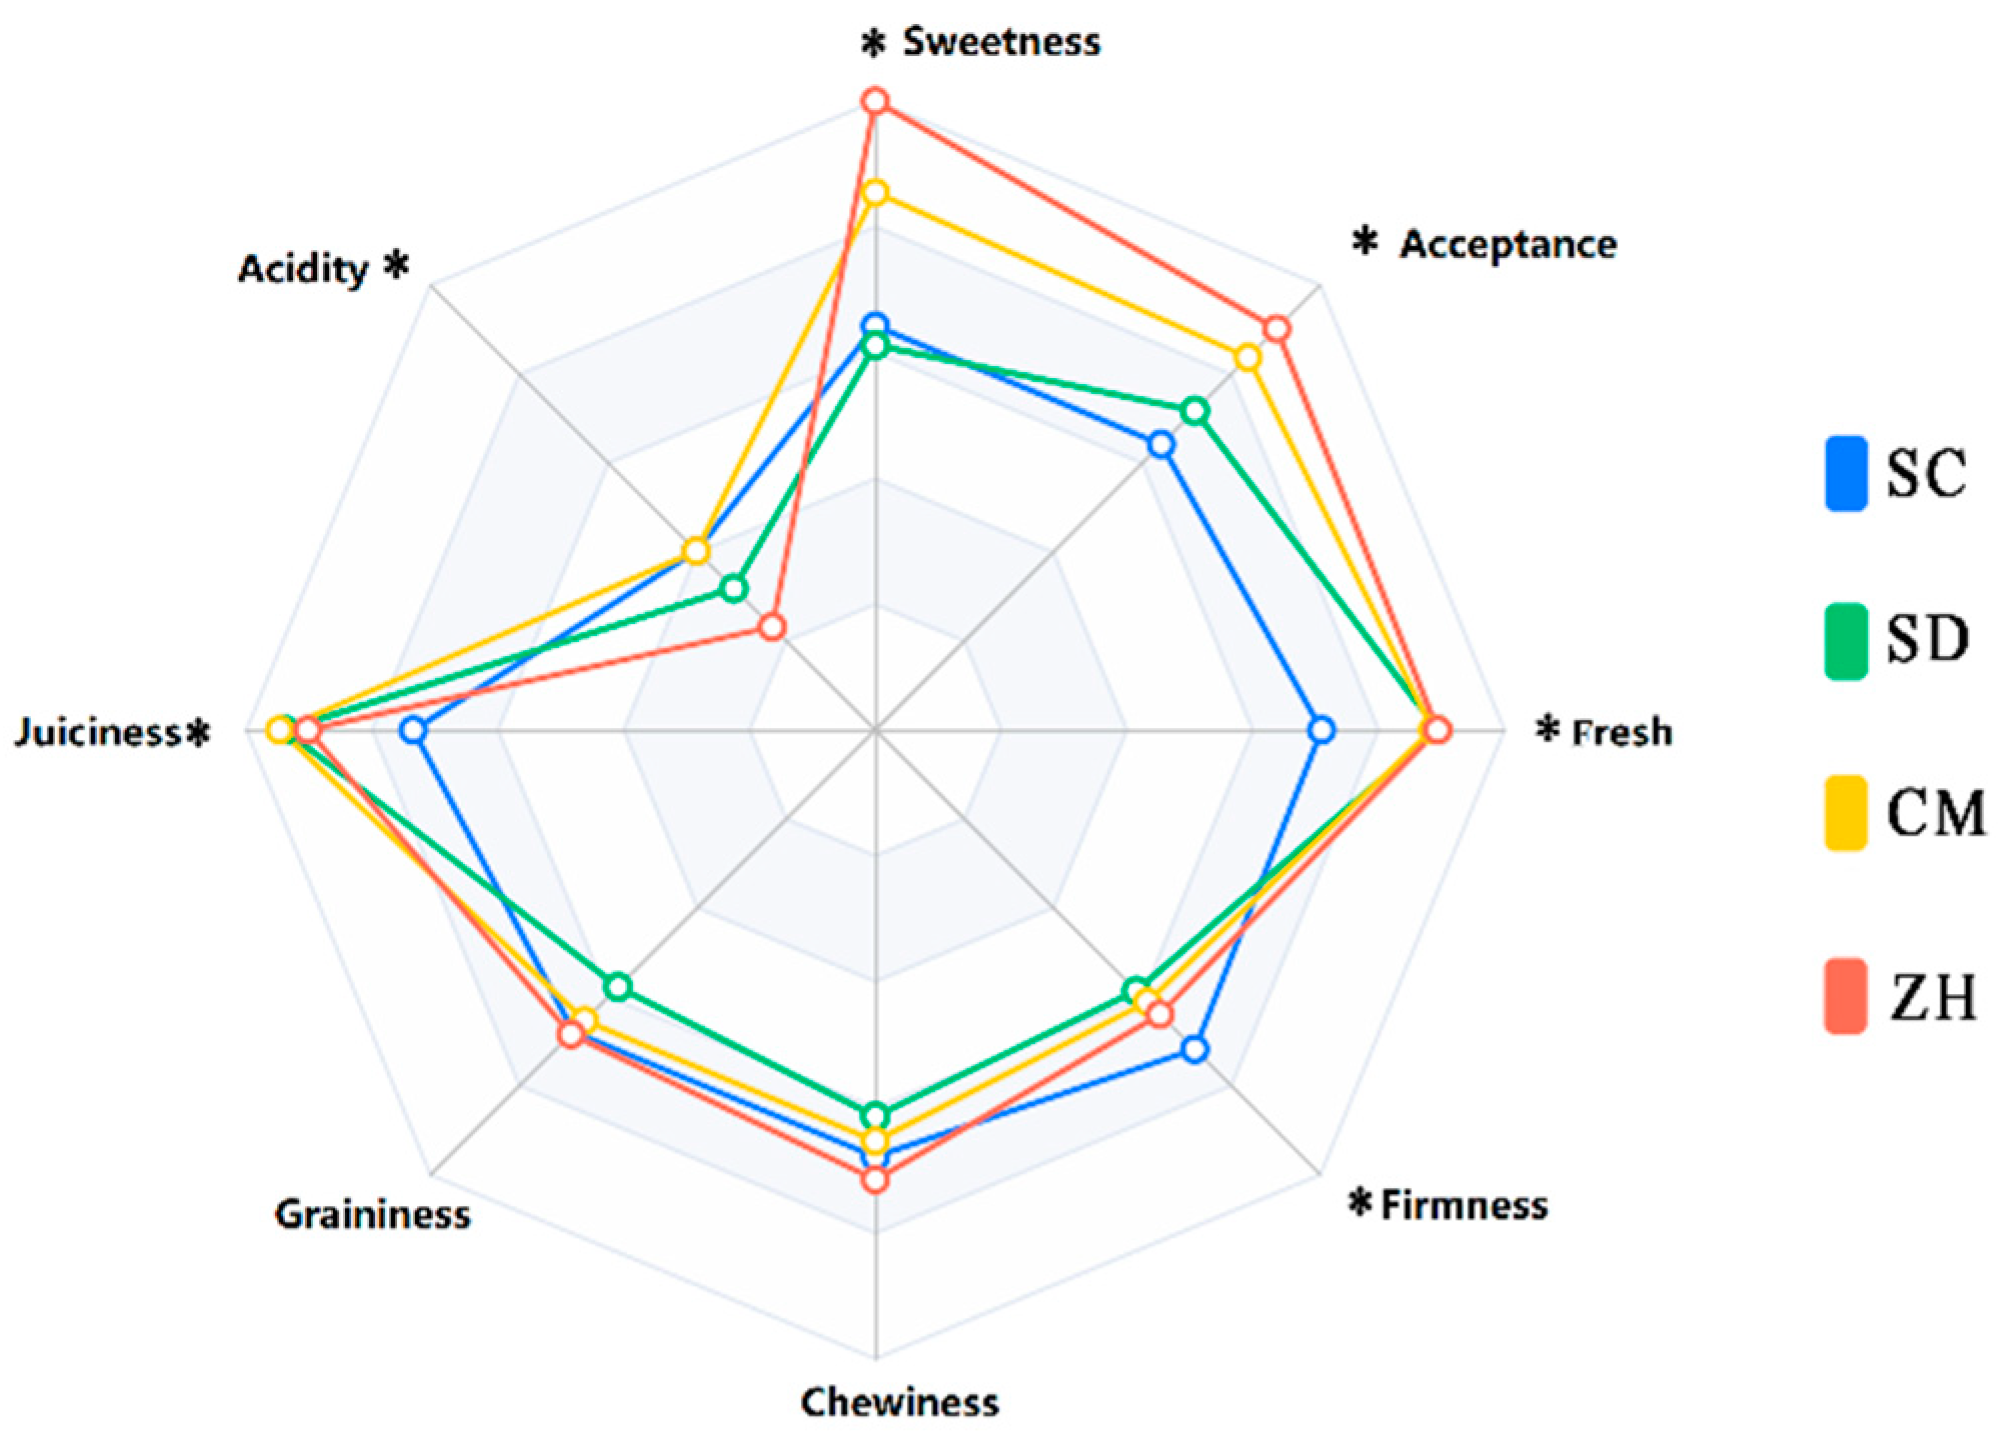
2.6. Sensory Evaluation for Cuiguan Pear
3. Materials and Methods
3.1. Plant Materials
3.2. Physical and Chemical Parameters
3.3. Volatile Organic Compounds Analysis
3.4. Sensory Analysis
3.5. Statistical Data Analyses
4. Conclusions
Author Contributions
Funding
Institutional Review Board Statement
Informed Consent Statement
Data Availability Statement
Conflicts of Interest
Sample Availability
References
- Wu, J.; Wang, Y.; Xu, J.; Korban, S.S.; Fei, Z.; Tao, S.; Ming, R.; Tai, S.; Khan, A.M.; Postman, J.D.; et al. Diversification and independent domestication of Asian and European pears. Genome Biol. 2018, 19, 77. [Google Scholar] [CrossRef] [PubMed]
- Hong, S.-Y.; Lansky, E.; Kang, S.-S.; Yang, M. A review of pears (Pyrus spp.), ancient functional food for modern times. BMC Complement. Med. Ther. 2021, 21, 219. [Google Scholar] [CrossRef] [PubMed]
- He, M.; Li, L.; Xu, Y.; Mu, J.; Xie, Z.; Gu, C.; Zhang, S. Identification of S-genotypes and a novel S-RNase in 84 native Chinese pear accessions. Hortic. Plant J. 2022, 8, 713–726. [Google Scholar] [CrossRef]
- Kan, C.; Gao, Y.; Wan, C.; Chen, M.; Zhao, X.; Liu, S.; Chen, J. Influence of different cold storage times on quality of “Cuiguan” pear fruits during shelf life. J. Food Process. Preserv. 2019, 43. [Google Scholar] [CrossRef]
- Chen, J.; Lü, J.; He, Z.; Zhang, F.; Zhang, S.; Zhang, H. Investigations into the production of volatile compounds in Korla fragrant pears (Pyrus sinkiangensis Yu). Food Chem. 2020, 302, 125337. [Google Scholar] [CrossRef] [PubMed]
- Mostafa, S.; Wang, Y.; Zeng, W.; Jin, B. Floral Scents and Fruit Aromas: Functions, Compositions, Biosynthesis, and Regulation. Front. Plant Sci. 2022, 13, 860157. [Google Scholar] [CrossRef]
- Chen, Y.; Yin, H.; Wu, X.; Shi, X.; Qi, K.; Zhang, S. Comparative analysis of the volatile organic compounds in mature fruits of 12 Occidental pear (Pyrus communis L.) cultivars. Sci. Hortic. 2018, 240, 239–248. [Google Scholar] [CrossRef]
- Cozzolino, R.; De Giulio, B.; Petriccione, M.; Martignetti, A.; Malorni, L.; Zampella, L.; Laurino, C.; Pellicano, M. Comparative analysis of volatile metabolites, quality and sensory attributes of Actinidia chinensis fruit. Food Chem. 2020, 316, 126340. [Google Scholar] [CrossRef]
- Hanif, M.; Xie, B.; Wei, S.; Li, J.; Gao, C.; Wang, R.; Ali, S.; Xiao, X.; Yu, J.; Al-Hashimi, A.; et al. Characterization of the volatile profile from six different varieties of Chinese chives by HS-SPME/GC–MS coupled with E. NOSE. J. King Saud Univ.—Sci. 2022, 34, 101971. [Google Scholar] [CrossRef]
- Song, J.; Chen, Q.; Bi, J.; Meng, X.; Wu, X.; Qiao, Y.; Lyu, Y. GC/MS coupled with MOS e-nose and flash GC e-nose for volatile characterization of Chinese jujubes as affected by different drying methods. Food Chem. 2020, 331, 127201. [Google Scholar] [CrossRef]
- Wang, S.; Chen, H.; Sun, B. Recent progress in food flavor analysis using gas chromatography–ion mobility spectrometry (GC–IMS). Food Chem. 2020, 315, 126158. [Google Scholar] [CrossRef] [PubMed]
- Shah, S.S.A.; Zeb, A.; Qureshi, W.S.; Arslan, M.; Malik, A.U.; Alasmary, W.; Alanazi, E. Towards fruit maturity estimation using NIR spectroscopy. Infrared Phys. Technol. 2020, 111, 103479. [Google Scholar] [CrossRef]
- McGuire, R.G. Reporting of Objective Color Measurements. Hortscience 1992, 27, 1254–1255. [Google Scholar] [CrossRef]
- Harker, F.; Marsh, K.; Young, H.; Murray, S.; Gunson, F.; Walker, S. Sensory interpretation of instrumental measurements 2: Sweet and acid taste of apple fruit. Postharvest Biol. Technol. 2002, 24, 241–250. [Google Scholar] [CrossRef]
- Mehinagic, E.; Royer, G.; Symoneaux, R.; Bertrand, D.; Jourjon, F. Prediction of the sensory quality of apples by physical measurements. Postharvest Biol. Technol. 2004, 34, 257–269. [Google Scholar] [CrossRef]
- Barrett, D.M.; Beaulieu, J.; Shewfelt, R. Color, Flavor, Texture, and Nutritional Quality of Fresh-Cut Fruits and Vegetables: Desirable Levels, Instrumental and Sensory Measurement, and the Effects of Processing. Crit. Rev. Food Sci. Nutr. 2010, 50, 369–389. [Google Scholar] [CrossRef]
- Lee, S.-H.; Cho, J.-Y.; Jeong, H.Y.; Jeong, D.E.; Kim, D.; Cho, S.-Y.; Kim, W.-S.; Moon, J.-H. Comparison of bioactive compound contents and in vitro and ex vivo antioxidative activities between peel and flesh of pear (Pyrus pyrifolia Nakai). Food Sci. Biotechnol. 2015, 24, 207–216. [Google Scholar] [CrossRef]
- Chen, J.; Wang, Z.; Wu, J.; Wang, Q.; Hu, X. Chemical compositional characterization of eight pear cultivars grown in China. Food Chem. 2007, 104, 268–275. [Google Scholar] [CrossRef]
- Viera, W.; Winefield, C. Genetic parameters for fruit mineral content in an interspecific pear (Pyrus spp.) population. N. Z. J. Crop Hortic. Sci. 2019, 47, 125–141. [Google Scholar] [CrossRef]
- Guo, S.; Zhao, X.; Ma, Y.; Wang, Y.; Wang, D. Fingerprints and changes analysis of volatile compounds in fresh-cut yam during yellowing process by using HS-GC-IMS. Food Chem. 2022, 369, 130939. [Google Scholar] [CrossRef]
- Wang, F.; Gao, Y.; Wang, H.; Xi, B.; He, X.; Yang, X.; Li, W. Analysis of volatile compounds and flavor fingerprint in Jingyuan lamb of different ages using gas chromatography–ion mobility spectrometry (GC–IMS). Meat Sci. 2021, 175, 108449. [Google Scholar] [CrossRef] [PubMed]
- Guo, J.; Yue, T.; Yuan, Y.; Sun, N.; Liu, P. Characterization of volatile and sensory profiles of apple juices to trace fruit origins and investigation of the relationship between the aroma properties and volatile constituents. LWT 2020, 124, 109203. [Google Scholar] [CrossRef]
- García-González, D.L.; Aparicio, R.; Ruiz, R.A. Volatile and Amino Acid Profiling of Dry Cured Hams from Different Swine Breeds and Processing Methods. Molecules 2013, 18, 3927–3947. [Google Scholar] [CrossRef] [PubMed]
- Echeverría, G.; Graell, J.; López, M.; Lara, I. Volatile production, quality and aroma-related enzyme activities during maturation of ‘Fuji’ apples. Postharvest Biol. Technol. 2004, 31, 217–227. [Google Scholar] [CrossRef]
- Torregrosa, L.; Echeverria, G.; Illa, J.; Torres, R.; Giné-Bordonaba, J. Spatial distribution of flavor components and antioxidants in the flesh of ‘Conference’ pears and its relationship with postharvest pathogens susceptibility. Postharvest Biol. Technol. 2020, 159, 111004. [Google Scholar] [CrossRef]
- Liu, P.; Zheng, P.; Feng, L.; Gong, Z.; Zheng, L.; Gao, S.; Wang, X.; Ye, F.; Huang, J.; Liu, Z. Dynamic changes in the aroma profile of Qingzhuan tea during its manufacture. Food Chem. 2021, 375, 131847. [Google Scholar] [CrossRef] [PubMed]
- Zhang, C.; Zhang, H.; Liu, M.; Zhao, X.; Luo, H. Effect of Breed on the Volatile Compound Precursors and Odor Profile Attributes of Lamb Meat. Foods 2020, 9, 1178. [Google Scholar] [CrossRef]
- Feng, T.; Sun, J.; Song, S.; Wang, H.; Yao, L.; Sun, M.; Wang, K.; Chen, D. Geographical differentiation of Molixiang table grapes grown in China based on volatile compounds analysis by HS-GC-IMS coupled with PCA and sensory evaluation of the grapes. Food Chem. X 2022, 15, 100423. [Google Scholar] [CrossRef]
- Pasquariello, M.S.; Rega, P.; Migliozzi, T.; Capuano, L.R.; Scortichini, M.; Petriccione, M. Effect of cold storage and shelf life on physiological and quality traits of early ripening pear cultivars. Sci. Hortic. 2013, 162, 341–350. [Google Scholar] [CrossRef]
- Taiti, C.; Marone, E.; Lanza, M.; Azzarello, E.; Masi, E.; Pandolfi, C.; Giordani, E.; Mancuso, S. Nashi or Williams pear fruits? Use of volatile organic compounds, physicochemical parameters, and sensory evaluation to understand the consumer’s preference. Eur. Food Res. Technol. 2017, 243, 1917–1931. [Google Scholar] [CrossRef]
- Karabagias, V.K.; Karabagias, I.K.; Gatzias, I.; Riganakos, K.A. Characterization of prickly pear juice by means of shelf life, sensory notes, physicochemical parameters and bio-functional properties. J. Food Sci. Technol. 2019, 56, 3646–3659. [Google Scholar] [CrossRef] [PubMed]
- Ramirez, J.L.; Du, X.; Wallace, R.W. Investigating sensory properties of seven watermelon varieties and factors impacting refreshing perception using quantitative descriptive analysis. Food Res. Int. 2020, 138, 109681. [Google Scholar] [CrossRef] [PubMed]


| Physicochemical | SC | SD | CM | ZH |
|---|---|---|---|---|
| Fruit shape | 0.92 ± 0.054 a | 0.92 ± 0.053 a | 0.94 ± 0.072 a | 0.97 ± 0.056 a |
| weight/g | 279.72 ± 29.02 b | 302.27 ± 35.72 ab | 306.17 ± 23.79 ab | 317.78 ± 18.74 a |
| Firmness/N | 16.69 ± 3.12 a | 12.12 ± 1.10 b | 13.65 ± 1.77 b | 16.20 ± 0.64 a |
| Lightness | 56.06 ± 2.97 b | 59.67 ± 1.98 a | 51.50 ± 3.47 d | 53.91 ± 1.50 c |
| Chroma | 30.96 ± 1.54 a | 29.45 ± 0.93 bc | 28.92 ± 1.70 c | 30.23 ± 0.82 ab |
| Hue angle | 115.50 ± 3.94 b | 121.56 ± 0.83 a | 116.58 ± 5.54 b | 120.29 ± 1.58 a |
| Vitamin C mg/100 g | 3.60 ± 0.16 c | 2.26 ± 0.16 d | 6.88 ± 0.23 a | 5.80 ± 0.60 b |
| TSS/°Brix | 13.18 ± 0.15 d | 13.78 ± 0.15 c | 16.08 ± 0.15 a | 14.66 ± 0.050 b |
| TA mg/g | 4.54 ± 0.077 c | 4.60 ± 0.063 c | 4.99 ± 0.22 b | 5.31 ± 0.083 a |
| TP mg/g | 2.83 ± 0.0069 a | 1.20 ± 0.022 c | 2.64 ± 0.0069 b | 2.63 ± 0.029 b |
| TFA mg/g | 0.92 ± 0.10 c | 0.62 ± 0.0058 d | 1.14 ± 0.015 b | 1.26 ± 0.10 a |
| Mineral Element | SC | SD | CM | ZH |
|---|---|---|---|---|
| K | 893.31 ± 32.21 c | 1238.73 ± 41.36 b | 1301.43 ± 13.85 b | 1886.73 ± 110.01 a |
| Mg | 65.71 ± 4.07 c | 92.08 ± 6.23 ab | 80.35 ± 0.074 b | 102.84 ± 6.08 a |
| Ca | 49.14 ± 1.73 a | 32.79 ± 0.44 c | 36.39 ± 1.01 b | 26.12 ± 0.013 d |
| Na | 1.97 ± 0.12 c | 1.71 ± 0.11 c | 3.79 ± 0.043 a | 3.34 ± 0.20 b |
| B | 1.96 ± 0.062 b | 1.45 ± 0.055 c | 2.54 ± 0.036 a | 2.60 ± 0.12 a |
| Fe | 1.11 ± 0.056 b | 1.19 ± 0.066 b | 0.87 ± 0.073 c | 1.52 ± 0.068 a |
| Mn | 0.452 ± 0.019 c | 0.635 ± 0.018 b | 1.019 ± 0.0087 a | 1.070 ± 0.058 a |
| Cu | 0.3782 ± 0.02974 b | 0.3947 ± 0.00299 b | 0.8463 ± 0.03826 a | 0.3605 ± 0.00055 b |
| Zn | 0.2972 ± 0.02233 d | 0.5431 ± 0.02165 c | 0.8194 ± 0.02577 b | 1.2009 ± 0.05714 a |
| Ti | 0.0852 ± 0.00324 a | 0.0708 ± 0.00529 b | 0.0643 ± 0.00507 b | 0.0616 ± 0.00623 b |
| Co | 0.0153 ± 0.00054 b | 0.0098 ± 0.00044 c | 0.0193 ± 0.00024 a | 0.0144 ± 0.00084 b |
| Ni | 0.0143 ± 0.00066 c | 0.0254 ± 0.00049 c | 0.0567 ± 0.00285 b | 0.1362 ± 0.10000 a |
| Mo | 0.0090 ± 0.00052 b | 0.0051 ± 0.00009 c | 0.0020 ± 0.00020 d | 0.0111 ± 0.00048 a |
| Cr | 0.0068 ± 0.00052 b | 0.0031 ± 0.00038 c | 0.0080 ± 0.00087 b | 0.0130 ± 0.00111 a |
| Sn | 0.0058 ± 0.00010 a | 0.0036 ± 0.00043 b | 0.0026 ± 0.00034 b | 0.0031 ± 0.00040 b |
| V | 0.0009 ± 0.00003 a | 0.0004 ± 0.00006 c | 0.0004 ± 0.00004 c | 0.0008 ± 0.00005 b |
| Se | 0.0001 ± 0.00002 c | 0.0005 ± 0.00000 a | 0.0002 ± 0.00001 c | 0.0004 ± 0.00004 b |
| NO. | Compounds | RI | RT/s | DT/ms | Peak Intensity | ||||
|---|---|---|---|---|---|---|---|---|---|
| SC | SD | CM | ZH | ||||||
| Esters | 1 | Ethyl octanoate | 1450.3 | 1141.106 | 1.49164 | 530.05 ± 67.21 | 209.87 ± 50.25 | 529.11 ± 93.17 | 841.57 ± 183.67 |
| 2 | Ethyl heptanoate | 1341.3 | 900.643 | 1.41748 | 885.91 ± 79.55 | 106.13 ± 8.41 | 636.28 ± 12.62 | 1696.07 ± 110.96 | |
| 3 | Trans-2-hexenyl acetate | 1344.4 | 906.76 | 1.86815 | 158.81 ± 39.08 | 290.83 ± 28.48 | 183.65 ± 33.03 | 228.06 ± 24.50 | |
| 4 | (E)-Ethyl-2-hexenoate-M | 1327.9 | 874.952 | 1.33037 | 993.49 ± 202.49 | 994.01 ± 30.7 | 1892.69 ± 127.96 | 520.94 ± 52.83 | |
| 5 | (E)-Ethyl-2-hexenoate-D | 1327.9 | 874.851 | 1.81774 | 229.64 ± 49.54 | 183.67 ± 14.97 | 592.97 ± 79.26 | 104.91 ± 15.87 | |
| 6 | Hexyl acetate-M | 1283.3 | 795.125 | 1.38766 | 12,848.97 ± 205.3 | 12,359.64 ± 39.65 | 12,162.45 ± 29.61 | 11,593.91 ± 98.63 | |
| 7 | Hexyl acetate-D | 1282.7 | 794.141 | 1.89942 | 29,366.12 ± 1646.5 | 25,164.38 ± 137.24 | 29,975.07 ± 277.23 | 24,337.57 ± 1186.5 | |
| 8 | Ethyl hexanoate-M | 1246 | 736.069 | 1.34099 | 10,080 ± 257.58 | 411.49 ± 76.35 | 9598.05 ± 9.21 | 9709.26 ± 58.46 | |
| 9 | Ethyl hexanoate-D | 1245.4 | 735.084 | 1.79773 | 15,187.34 ± 1295.06 | 286.79 ± 106.54 | 14,115.22 ± 446.82 | 18,241.16 ± 1156.04 | |
| 10 | Methyl hexanoate-M | 1197.1 | 665.126 | 1.28589 | 672.84 ± 9.29 | 187.57 ± 7.22 | 1126.9 ± 74.96 | 1473.09 ± 107.09 | |
| 11 | Methyl hexanoate-D | 1197.4 | 665.5 | 1.68002 | 215.33 ± 20.56 | 54.78 ± 7.14 | 348.18 ± 64.82 | 687.81 ± 116.74 | |
| 12 | Pentyl acetate-M | 1185.7 | 644.583 | 1.31327 | 934.5 ± 71.98 | 2140.78 ± 113.43 | 1975.34 ± 37.74 | 1411.42 ± 49.76 | |
| 13 | Pentyl acetate-D | 1185.7 | 644.583 | 1.76502 | 147.69 ± 14.78 | 931.53 ± 155.23 | 654.3 ± 15.39 | 421.77 ± 18.81 | |
| 14 | Ethyl crotonate-M | 1179.5 | 631.329 | 1.18702 | 2893.51 ± 75.62 | 287.23 ± 8.60 | 3390.91 ± 84.9 | 4262.17 ± 17.19 | |
| 15 | Ethyl crotonate-D | 1179.8 | 631.992 | 1.55512 | 1462.16 ± 45.11 | 114.85 ± 30.63 | 2432.14 ± 163.52 | 8292.16 ± 296.9 | |
| 16 | Ethyl pentanoate-M | 1150.3 | 573.013 | 1.27372 | 5775.85 ± 128.67 | 1672.96 ± 51.12 | 5607.58 ± 13.59 | 5846.96 ± 36.27 | |
| 17 | Ethyl pentanoate-D | 1150.6 | 573.676 | 1.68289 | 7233.27 ± 670.83 | 317.89 ± 53.46 | 7265.86 ± 86.56 | 13,328.21 ± 411.47 | |
| 18 | Isoamyl acetate-M | 1137.1 | 548.494 | 1.3011 | 2003.05 ± 34.58 | 1412.63 ± 130.10 | 2205.92 ± 46.55 | 1702.05 ± 72.54 | |
| 19 | Isoamyl acetate-D | 1137.5 | 549.157 | 1.74373 | 515.54 ± 14.5 | 226.24 ± 36.77 | 662.05 ± 47.53 | 413.86 ± 41.00 | |
| 20 | Butyl acetate-M | 1087.7 | 467.162 | 1.23797 | 3188.14 ± 51.35 | 4242.24 ± 15.16 | 2962.95 ± 35.86 | 2680.29 ± 16.65 | |
| 21 | Butyl acetate-D | 1088.1 | 467.602 | 1.61833 | 8129.94 ± 478.78 | 13,227.47 ± 337.77 | 5015.73 ± 90.78 | 6066.65 ± 214.5 | |
| 22 | Ethyl 3-methylbutanoate-M | 1067.4 | 439.87 | 1.25011 | 2533.08 ± 33.8 | 86.69 ± 4.53 | 2631.37 ± 21.66 | 2163.27 ± 45.09 | |
| 23 | Ethyl 3-methylbutanoate-D | 1067.1 | 439.43 | 1.6534 | 5045.97 ± 170.28 | 103.52 ± 21.38 | 9213.3 ± 105.43 | 11,189.66 ± 210.06 | |
| 24 | Ethyl butanoate-M | 1051.9 | 420.061 | 1.2056 | 2657.61 ± 26.81 | 367.92 ± 102.66 | 2358.66 ± 46.04 | 1658.96 ± 24.15 | |
| 25 | Ethyl butanoate-D | 1051.9 | 420.061 | 1.56303 | 22,033.53 ± 399.31 | 120.89 ± 48.72 | 22,866.79 ± 85.21 | 25,022.45 ± 119.15 | |
| 26 | Isobutyl acetate-M | 1027.7 | 391.009 | 1.22718 | 777.78 ± 13.57 | 691.76 ± 36.90 | 620.71 ± 2.17 | 444.61 ± 18.42 | |
| 27 | Isobutyl acetate-D | 1027.7 | 391.009 | 1.61024 | 311.8 ± 17.24 | 162.12 ± 16.47 | 188.59 ± 1.33 | 77.09 ± 5.19 | |
| 28 | Methyl 3-methylbutanoate-M | 1023.9 | 386.607 | 1.19481 | 367.8 ± 3.68 | 82.24 ± 0.27 | 892.71 ± 42.34 | 935.42 ± 27.83 | |
| 29 | Methyl 3-methylbutanoate-D | 1024.8 | 387.673 | 1.52871 | 124.73 ± 4.33 | 33.85 ± 5.63 | 500.3 ± 68.14 | 906.25 ± 89.67 | |
| 30 | Methyl butanoate-M | 1004.2 | 364.701 | 1.15204 | 1397.28 ± 30.04 | 98.31 ± 14.21 | 1360.65 ± 15.02 | 953.67 ± 20.93 | |
| 31 | Methyl butanoate-D | 1004.6 | 365.054 | 1.4365 | 3450.83 ± 361.74 | 38.43 ± 7.63 | 4987.69 ± 246.49 | 6220.27 ± 164.31 | |
| 32 | Propyl acetate-M | 992.9 | 353.408 | 1.16539 | 650.79 ± 14.89 | 501.4 ± 49.38 | 511.35 ± 30.03 | 614.42 ± 4.10 | |
| 33 | Propyl acetate-D | 992.9 | 353.408 | 1.47523 | 989.16 ± 26.16 | 221.56 ± 33.98 | 752.8 ± 88.51 | 2847.89 ± 84.56 | |
| 34 | Ethyl isobutyrate-M | 983.0 | 345.644 | 1.20145 | 1057.51 ± 31.99 | 110.27 ± 3.19 | 1225.46 ± 30.67 | 670.06 ± 11.49 | |
| 35 | Ethyl isobutyrate-D | 983.0 | 345.644 | 1.56204 | 2300.76 ± 70.06 | 52.08 ± 16.77 | 4306.63 ± 112.19 | 5189.3 ± 105.41 | |
| 36 | Ethyl propanoate | 971.5 | 336.821 | 1.44852 | 4449.82 ± 174.6 | 144.65 ± 11.12 | 5656.43 ± 91.58 | 7885.22 ± 35.17 | |
| 37 | Ethyl Acetate-M | 896.2 | 284.236 | 1.09862 | 2733.14 ± 53.91 | 2733.08 ± 10.1 | 2678.67 ± 33.58 | 1505.43 ± 47.87 | |
| 38 | Ethyl Acetate-D | 897.3 | 284.942 | 1.33366 | 18,153.65 ± 239.6 | 7412.66 ± 234.08 | 19,089.9 ± 503.3 | 28,008.74 ± 450.67 | |
| 39 | Methyl acetate | 848.5 | 255.297 | 1.19077 | 1437.36 ± 43.13 | 416.82 ± 20.05 | 2544.66 ± 207.13 | 5668.96 ± 252.90 | |
| 40 | Butyl propionate | 1155.7 | 583.347 | 1.71798 | 68.57 ± 12.91 | 146.23 ± 5.11 | 35.07 ± 2.26 | 82.96 ± 6.49 | |
| 41 | Heptyl acetate | 1382.9 | 985.719 | 1.46745 | 55.47 ± 18.76 | 202.81 ± 9.34 | 103.08 ± 31.14 | 71.55 ± 4.95 | |
| 42 | Butyl 2-methylbutanoate | 1239.6 | 726.243 | 1.3887 | 392.16 ± 27.79 | 716.7 ± 142.18 | 396.25 ± 21.5 | 440.67 ± 5.82 | |
| Alcohols | 43 | 1-Hexanol-M | 1369.2 | 956.83 | 1.33015 | 1225.45 ± 207.89 | 896.59 ± 46.8 | 1469.13 ± 27.85 | 1914.18 ± 153.08 |
| 44 | 1-Hexanol-D | 1369.2 | 956.919 | 1.64092 | 107.36 ± 40.99 | 84.6 ± 24.78 | 127.94 ± 20.49 | 149.8 ± 25.44 | |
| 45 | 3-Methyl-1-pentanol | 1353.0 | 923.887 | 1.33037 | 256.58 ± 12.57 | 59.39 ± 16.41 | 330.81 ± 15.42 | 1168.11 ± 41.8 | |
| 46 | 3-Methylbutanol | 1220.6 | 698.26 | 1.2433 | 109.92 ± 13.69 | 240.94 ± 13.9 | 151.95 ± 8.62 | 105.55 ± 1.78 | |
| 47 | 1-Butanol | 1160.2 | 592.231 | 1.18093 | 232.33 ± 13.13 | 791.62 ± 26.2 | 217.28 ± 1.3 | 235.48 ± 6.49 | |
| 48 | 2-Methyl-1-propanol | 1107.2 | 496.654 | 1.17188 | 485.92 ± 3.72 | 674.28 ± 21.46 | 606.16 ± 7.00 | 382.6 ± 8.9 | |
| 49 | Ethanol | 944.2 | 316.7 | 1.13067 | 16,200.12 ± 63.48 | 14,982.91 ± 225.95 | 15,946.15 ± 36.82 | 16,400.76 ± 84.63 | |
| 50 | 1-Propanol | 1053.1 | 421.521 | 1.11064 | 19.28 ± 6.71 | 479.78 ± 30.78 | 16.25 ± 4.72 | 18.91 ± 1.73 | |
| 51 | 1-Pentanol | 1270.1 | 773.604 | 1.25575 | 159.55 ± 20.58 | 57.26 ± 11.54 | 164.77 ± 16.77 | 503.61 ± 26.72 | |
| Aldehydes | 52 | Nonanal | 1402.2 | 1027.929 | 1.48413 | 223.63 ± 47.89 | 285.15 ± 30.25 | 314.21 ± 62.61 | 242.65 ± 9.76 |
| 53 | (E)-2-Heptenal | 1316.9 | 854.181 | 1.25931 | 541.59 ± 52.58 | 62.66 ± 18.71 | 746.49 ± 39.38 | 1264.08 ± 61.98 | |
| 54 | (E)-2-Hexenal | 1231.6 | 714.415 | 1.18429 | 516.44 ± 132.74 | 330.78 ± 8.36 | 563.42 ± 64.86 | 481.55 ± 39.67 | |
| 55 | Heptanal | 1200.0 | 669.138 | 1.33432 | 2635.14 ± 353.37 | 377.35 ± 46.41 | 1262.81 ± 59.65 | 1478.24 ± 218.15 | |
| 56 | (E)-2-Pentenal | 1125.2 | 527.288 | 1.12313 | 115 ± 16.88 | 45.51 ± 17.70 | 164.6 ± 23.82 | 411.36 ± 26.97 | |
| 57 | Hexanal-M | 1100.4 | 485.649 | 1.27034 | 1965.6 ± 218.09 | 620.77 ± 22.61 | 1510.94 ± 32.78 | 990.05 ± 56.57 | |
| 58 | Hexanal-D | 1100.4 | 485.649 | 1.56573 | 2251.42 ± 719.96 | 410.7 ± 37.30 | 1163.73 ± 74.16 | 1270.04 ± 125.48 | |
| 59 | Propanal | 819.4 | 239.062 | 1.0679 | 1125.01 ± 22.17 | 1399.97 ± 26.79 | 1272.33 ± 2.81 | 2222.32 ± 71.13 | |
| 60 | Citronellal | 1501.0 | 1273.853 | 1.34105 | 286.78 ± 79.92 | 202.4 ± 93.15 | 389.98 ± 51.55 | 477.62 ± 20.32 | |
| Ketones | 61 | 2-Heptanone | 1188.5 | 650.547 | 1.26307 | 888.51 ± 37.58 | 1364.16 ± 14.66 | 234.06 ± 13.38 | 303.47 ± 25.93 |
| 62 | 1-Penten-3-one | 1030.0 | 393.65 | 1.09365 | 290.96 ± 16.36 | 164.98 ± 3.11 | 242.63 ± 10.82 | 427.09 ± 18.2 | |
| 63 | Acetone | 837.3 | 248.944 | 1.11331 | 822.76 ± 85.5 | 902.13 ± 92.97 | 653.2 ± 7.51 | 916.91 ± 27.5 | |
| 64 | 3-Hydroxy-2-butanone | 1298.1 | 820.068 | 1.06583 | 205.78 ± 17.96 | 198.77 ± 12.32 | 261.04 ± 7.37 | 531.42 ± 46.03 | |
| 65 | 6-Methyl-5-hepten-2-one | 1345.9 | 909.795 | 1.18252 | 121.29 ± 15.45 | 107.26 ± 13.67 | 132.37 ± 13.55 | 257.2 ± 38.8 | |
| Thiophene | 66 | Thiophene | 1030.3 | 393.993 | 1.0452 | 1279.36 ± 78.31 | 1175.64 ± 64.91 | 1061.56 ± 27.86 | 1301.33 ± 28.93 |
| Terpenes | 67 | beta-Pinene | 1103.6 | 490.867 | 1.21641 | 211.47 ± 31.93 | 67.03 ± 1.00 | 318.06 ± 11.35 | 556.45 ± 22.74 |
| 68 | gamma-Terpinene | 1248.6 | 740.009 | 1.71635 | 1934.41 ± 73.68 | 74.16 ± 23.13 | 3222.67 ± 8.67 | 4346.54 ± 157.79 | |
| Sulfides | 69 | Dimethyl trisulfide | 1345.9 | 909.795 | 1.18252 | 180.25 ± 3.59 | 237.82 ± 35.15 | 163.47 ± 17.14 | 436.84 ± 28.80 |
Disclaimer/Publisher’s Note: The statements, opinions and data contained in all publications are solely those of the individual author(s) and contributor(s) and not of MDPI and/or the editor(s). MDPI and/or the editor(s) disclaim responsibility for any injury to people or property resulting from any ideas, methods, instructions or products referred to in the content. |
© 2023 by the authors. Licensee MDPI, Basel, Switzerland. This article is an open access article distributed under the terms and conditions of the Creative Commons Attribution (CC BY) license (https://creativecommons.org/licenses/by/4.0/).
Share and Cite
Zhang, M.; Bai, B.; Chen, L.; Liu, H.; Jin, Q.; Wang, L.; Feng, T. Comparative Analysis of the Quality in Ripe Fruits of Cuiguan Pear from Different Regions. Molecules 2023, 28, 1733. https://doi.org/10.3390/molecules28041733
Zhang M, Bai B, Chen L, Liu H, Jin Q, Wang L, Feng T. Comparative Analysis of the Quality in Ripe Fruits of Cuiguan Pear from Different Regions. Molecules. 2023; 28(4):1733. https://doi.org/10.3390/molecules28041733
Chicago/Turabian StyleZhang, Miaoqiang, Bing Bai, Lei Chen, Haiyan Liu, Qiqi Jin, Liang Wang, and Tao Feng. 2023. "Comparative Analysis of the Quality in Ripe Fruits of Cuiguan Pear from Different Regions" Molecules 28, no. 4: 1733. https://doi.org/10.3390/molecules28041733