


Molecular Understanding and Practical In Silico Catalyst Design in Computational Organocatalysis and Phase Transfer Catalysis—Challenges and Opportunities

Abstract
:1. Introduction
1.1. Overview
1.2. Content
2. Discussion
2.1. Choice of Methods
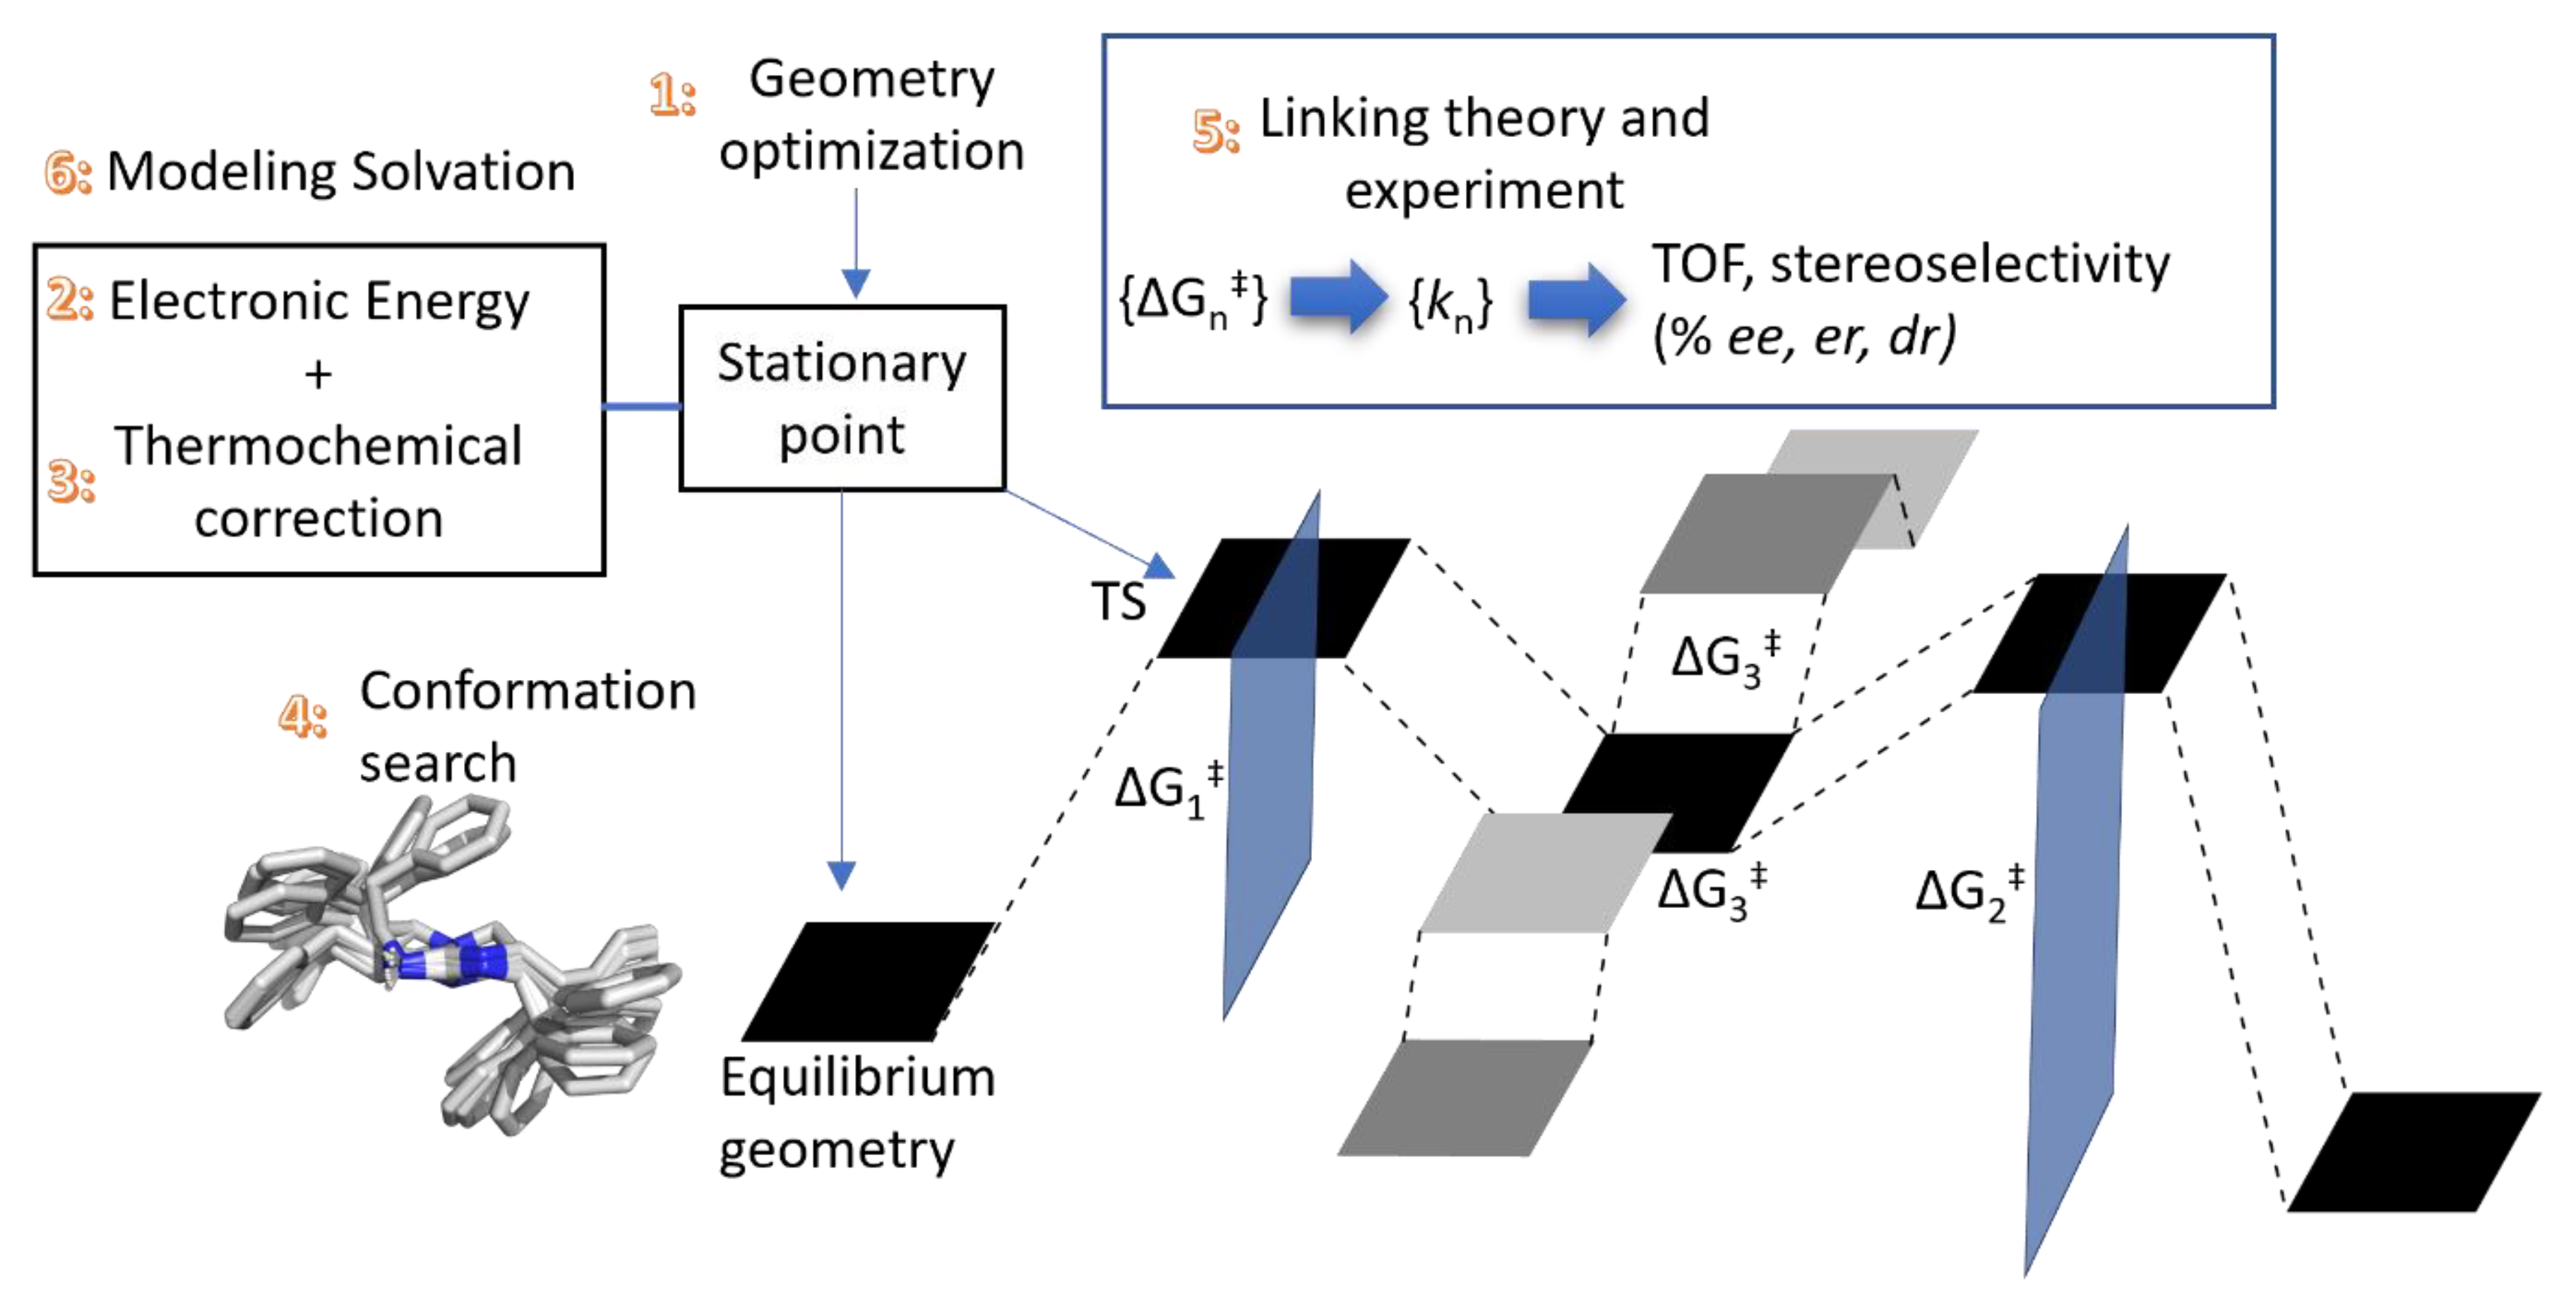
2.1.1. Geometry Optimization
2.1.2. Compound Method or “Double-Barreling”

| Rung on the Jacob Ladder | DFA | Correction (Recommended by the Ref) [a] | Barrier Heights | GMTKN55 | ||
|---|---|---|---|---|---|---|
| RMSD [b] | WTMAD-2 [c] | BH9 RMSD [d] (MAE [e]) | WTMAD-2 | |||
| 2: GGA/ NGA | B97 | D3(BJ) [46] | 8.32 | 13.15 | 11.27 | 8.55 [46] |
| D3(0) [50] | 8.65 | NA | NA | NA | ||
| revPBE | D3(BJ) [46] | 8.30 | 15.79 | 11.24 | 8.27 [46] | |
| D3(0) [50] | 8.26 | NA | NA | NA | ||
| BLYP | D3(0) [27,50] | 10.13 | NA | NA | NA | |
| D3(BJ) [46] | 9.91 | NA | 12.10 | 9.51 | ||
| 3: Meta-GGA/ NGA | SCAN | D3(BJ) [46] | 7.83 | 14.94 | NA | 7.86 [46] |
| r2SCAN | None | NA | NA | 7.90 | NA | |
| D3BJ | NA | NA | 9.25 | NA | ||
| 3c [42] | NA | NA | NA | 7.5 [42] | ||
| revTPSS | D3(BJ) [46] | NA | 15.78 | NA | 8.50 [46] | |
| M06L | D3(0) [46,50] | 6.84 | 7.56 | NA | 8.61 [46] | |
| B97M | V [48,50] | 4.35 | 7.53 | 6.70 (4.14) | 5.46 [48] | |
| 4: Hybrid GGA/Meta-GGA | ωB97M | V [48,50,54,55,56] | 1.68 | 3.40 [f] | (2.08) | 3.53 [48] |
| ωB97X | V [46,50,56] | 2.44 | 4.21 [f] | (3.20) | 3.98 [46] | |
| D3(0) [46,50] | 2.28 | 4.67 | NA | 4.61 [46] | ||
| M06-2X | None [56] | NA | NA | (2.27) | NA | |
| D3(0) [26,50] | 2.60 | 5.60 | NA | 4.94 [46] | ||
| B3LYP-D3 | D3(0) | 5.92 | NA | NA | NA | |
| D3BJ | NA | NA | 6.77 | 6.42 [46] | ||
| 5: Double-Hybrid | DSD-PBEP86 | D3(BJ) [46] | NA | 3.52 | 4.04 | 3.14 [46] |
| NL [48] | NA | 3.25 | NA | 2.84 [48] | ||
| revDSD-PBEP86 | D3(BJ) [26,55] | NA | NA | 2.96 | 2.42 [55] | |
| ωB97X-2 | D3(BJ) [48] | NA | 3.25 | NA | 2.97 [48] | |
| ωB97M(2) | None [55] | NA | NA | NA | 2.19 [55] | |
| DSD-BLYP | D3(BJ) [46] | NA | 3.04 | NA | 3.08 [46] | |
| NL [48] | NA | 2.86 | NA | 3.05 [48] | ||
| B2GPPLYP | D3(BJ) [46] | NA | 3.24 | NA | 3.26 [46] | |
2.2. Thermochemical Corrections
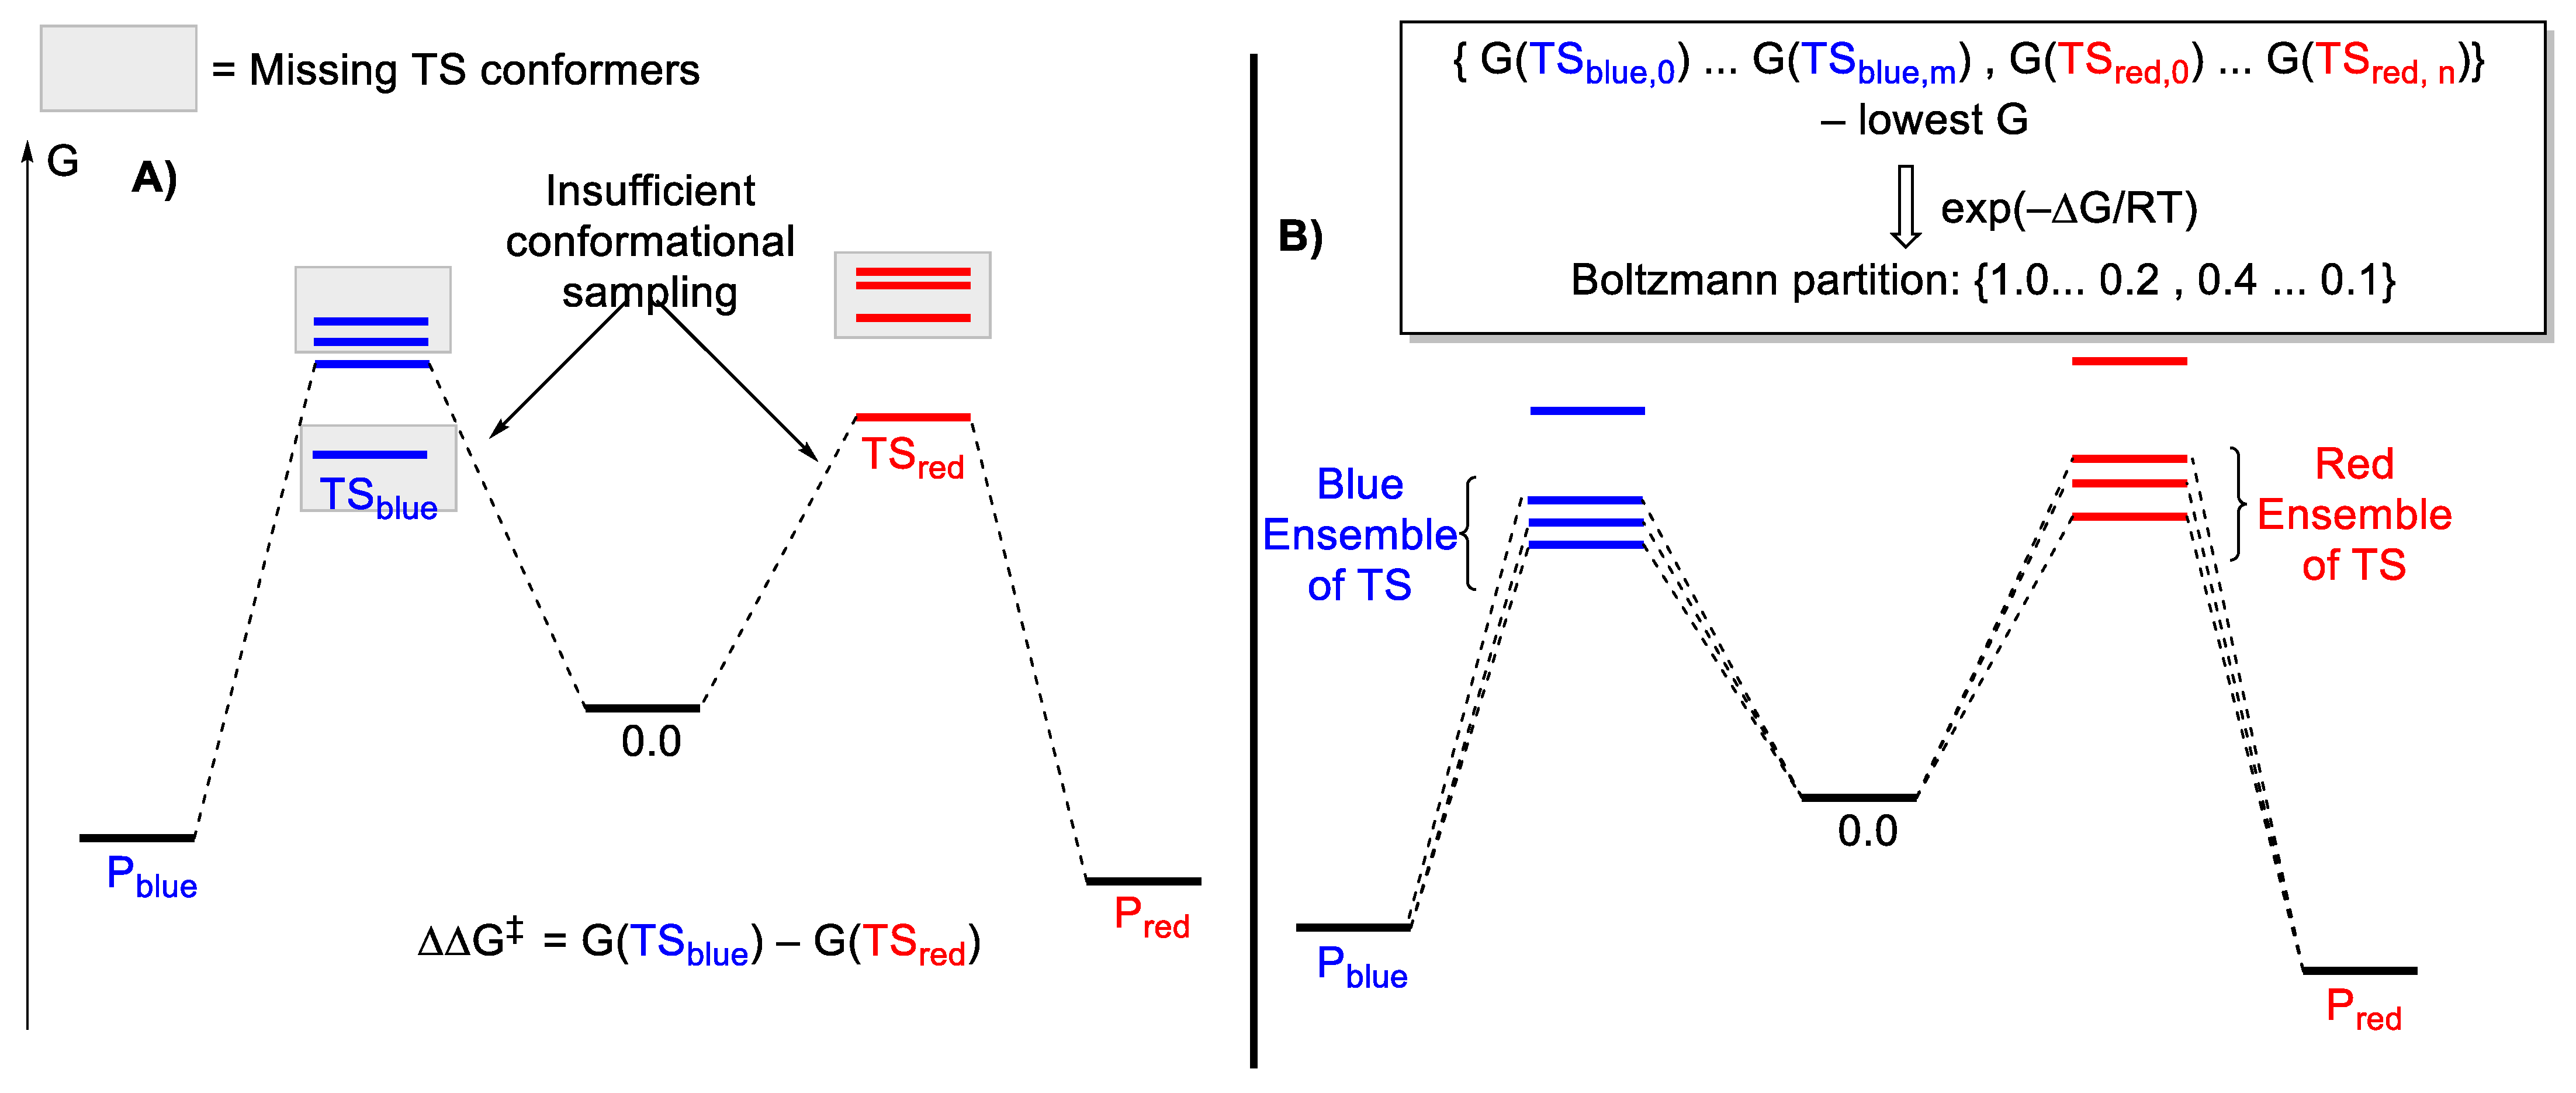
2.3. Conformational Sampling
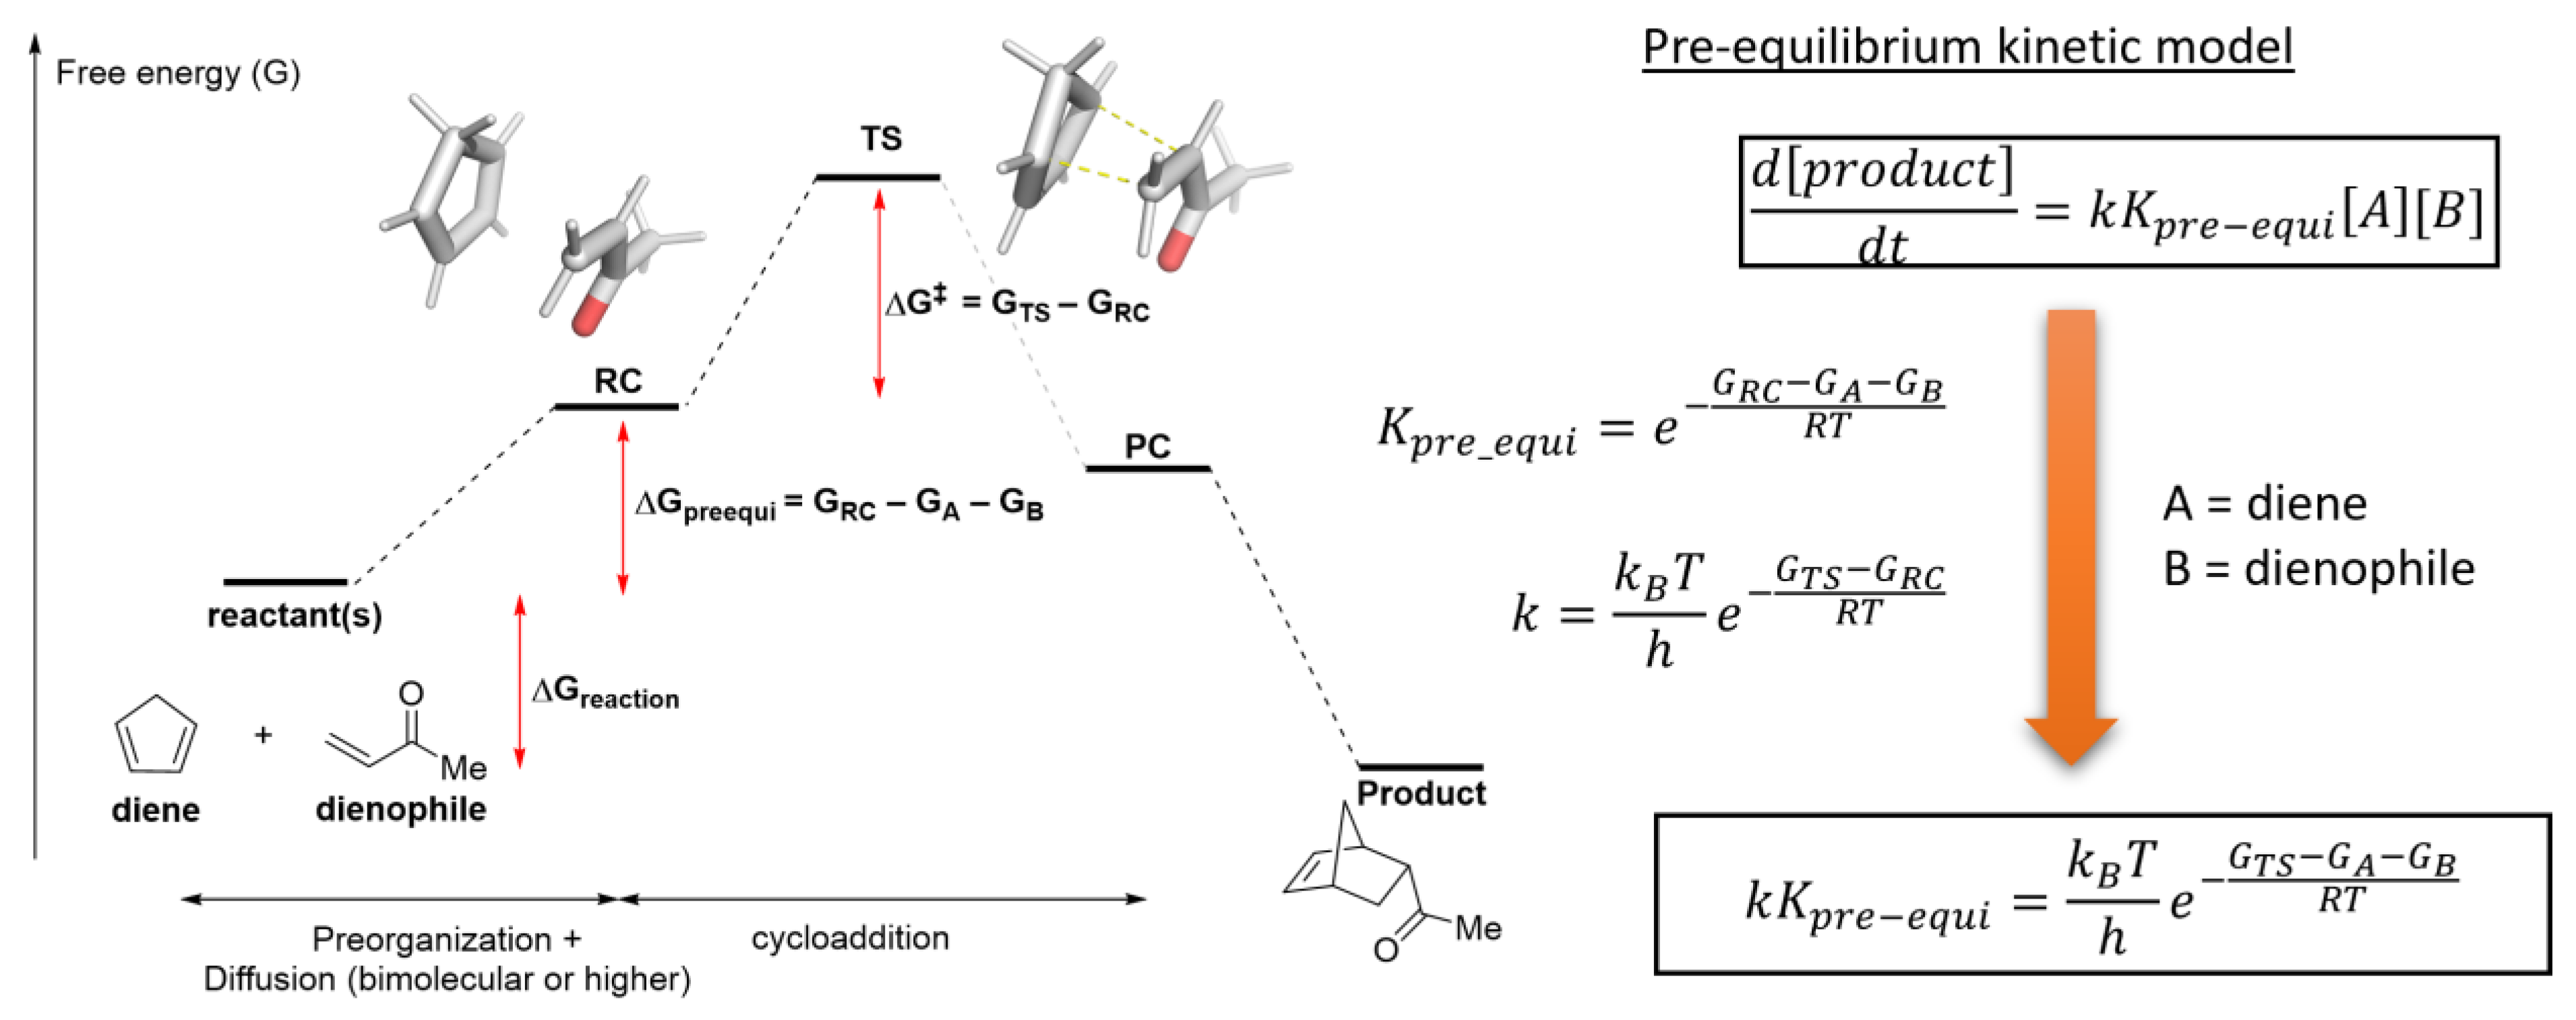
2.4. Translating from Calculated Barrier to Rate Constant
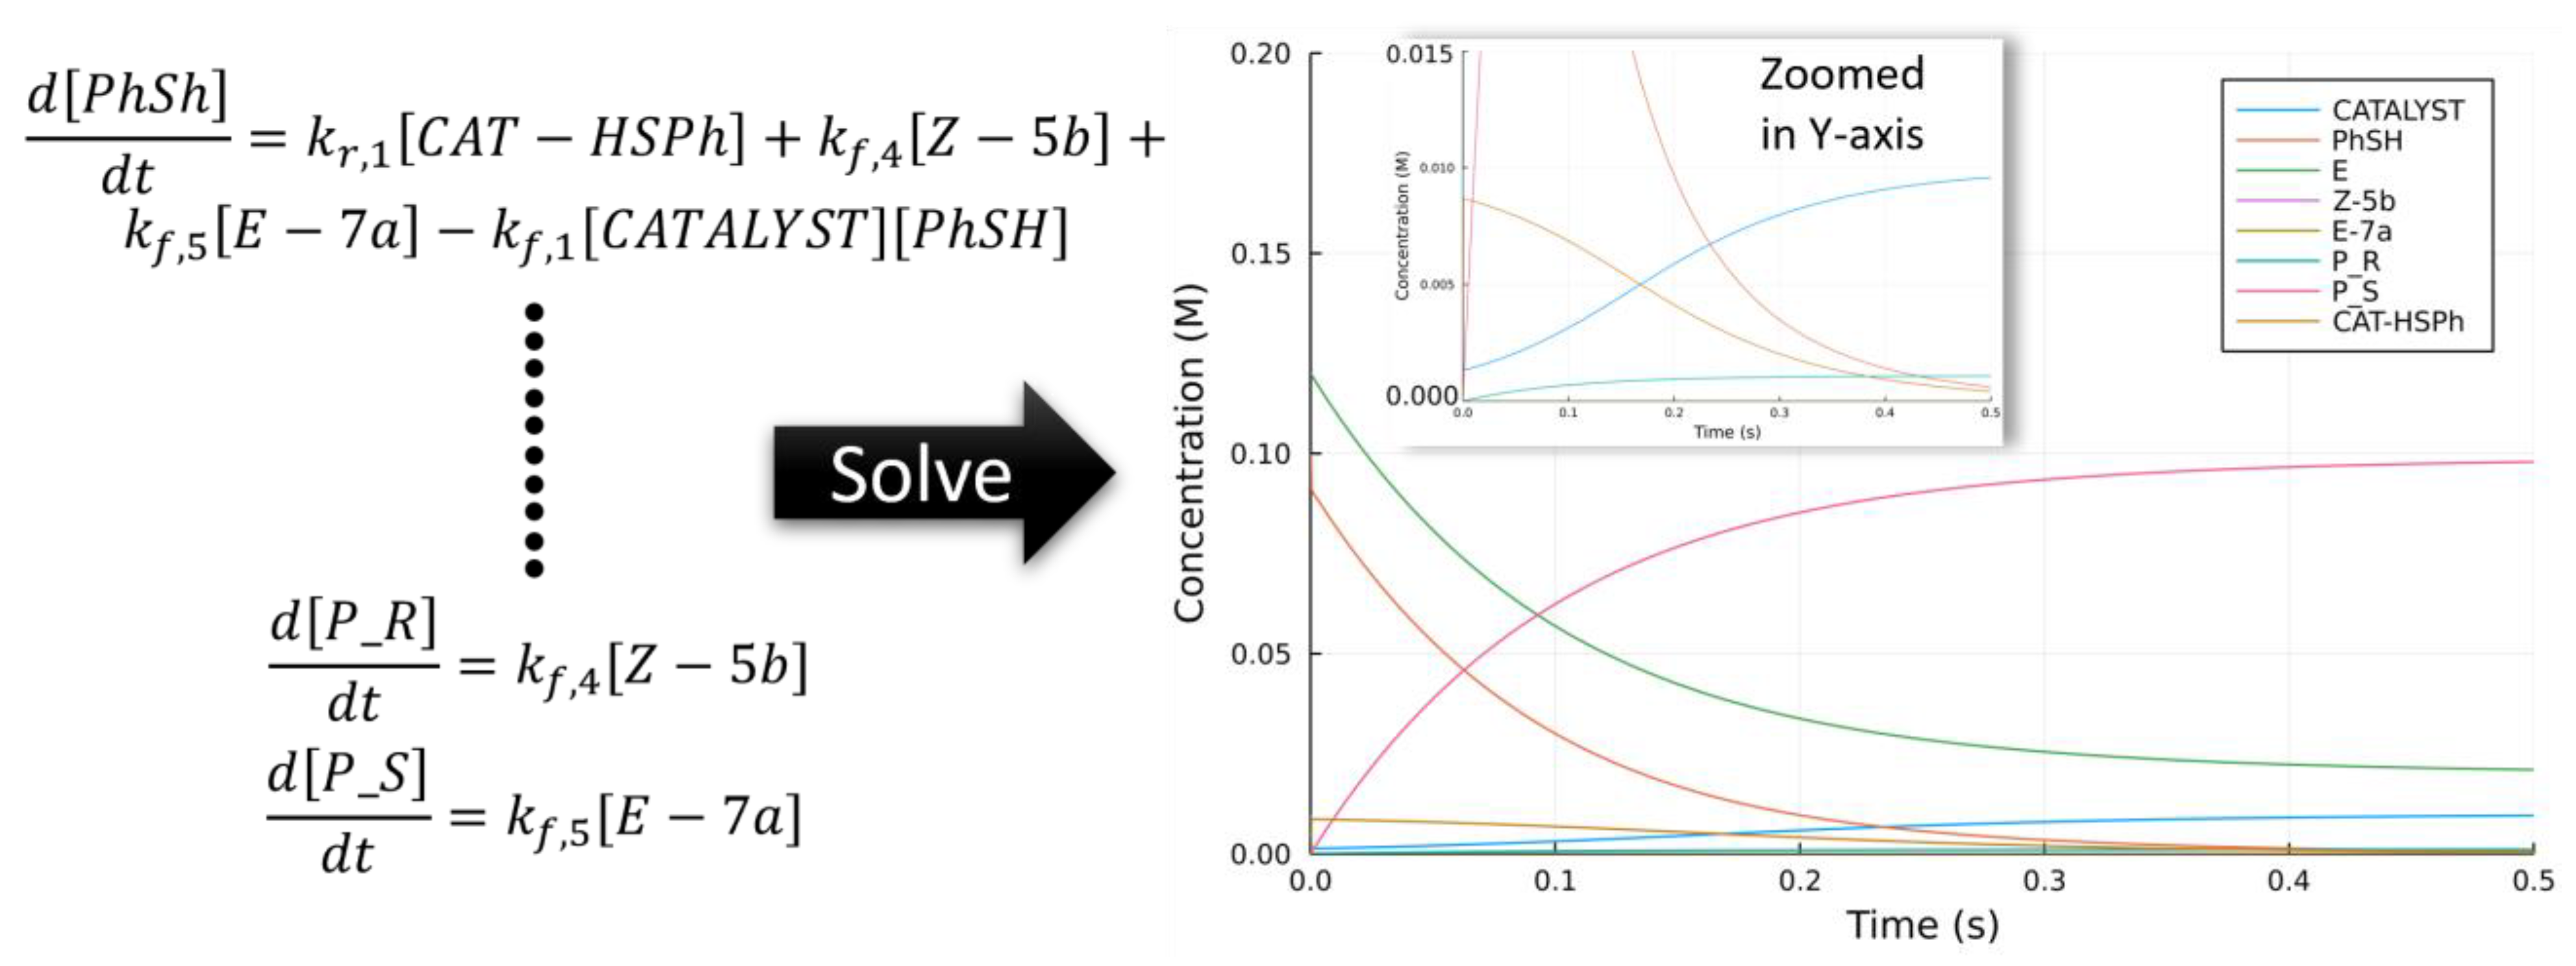
2.5. Extending to Catalysis—Turnover Frequency
2.6. The Computational Challenge—Mechanism
- Active species involved in catalysis: Aggregation of catalysts is well-documented, and the non-linear effect is closely associated with such a phenomenon.
- Validity of the transition state theory:
- Solvation: Extensive discussion on the choice of theoretical methods based on high-quality benchmarks is restricted to gas-phase modeling. Organocatalysis and PTC inevitably are solution-based chemistry. Therefore, the influence of solvents, which can be game-changing at times, often needs to be addressed.
2.6.1. Non-Linear Effect in Asymmetric Catalysis
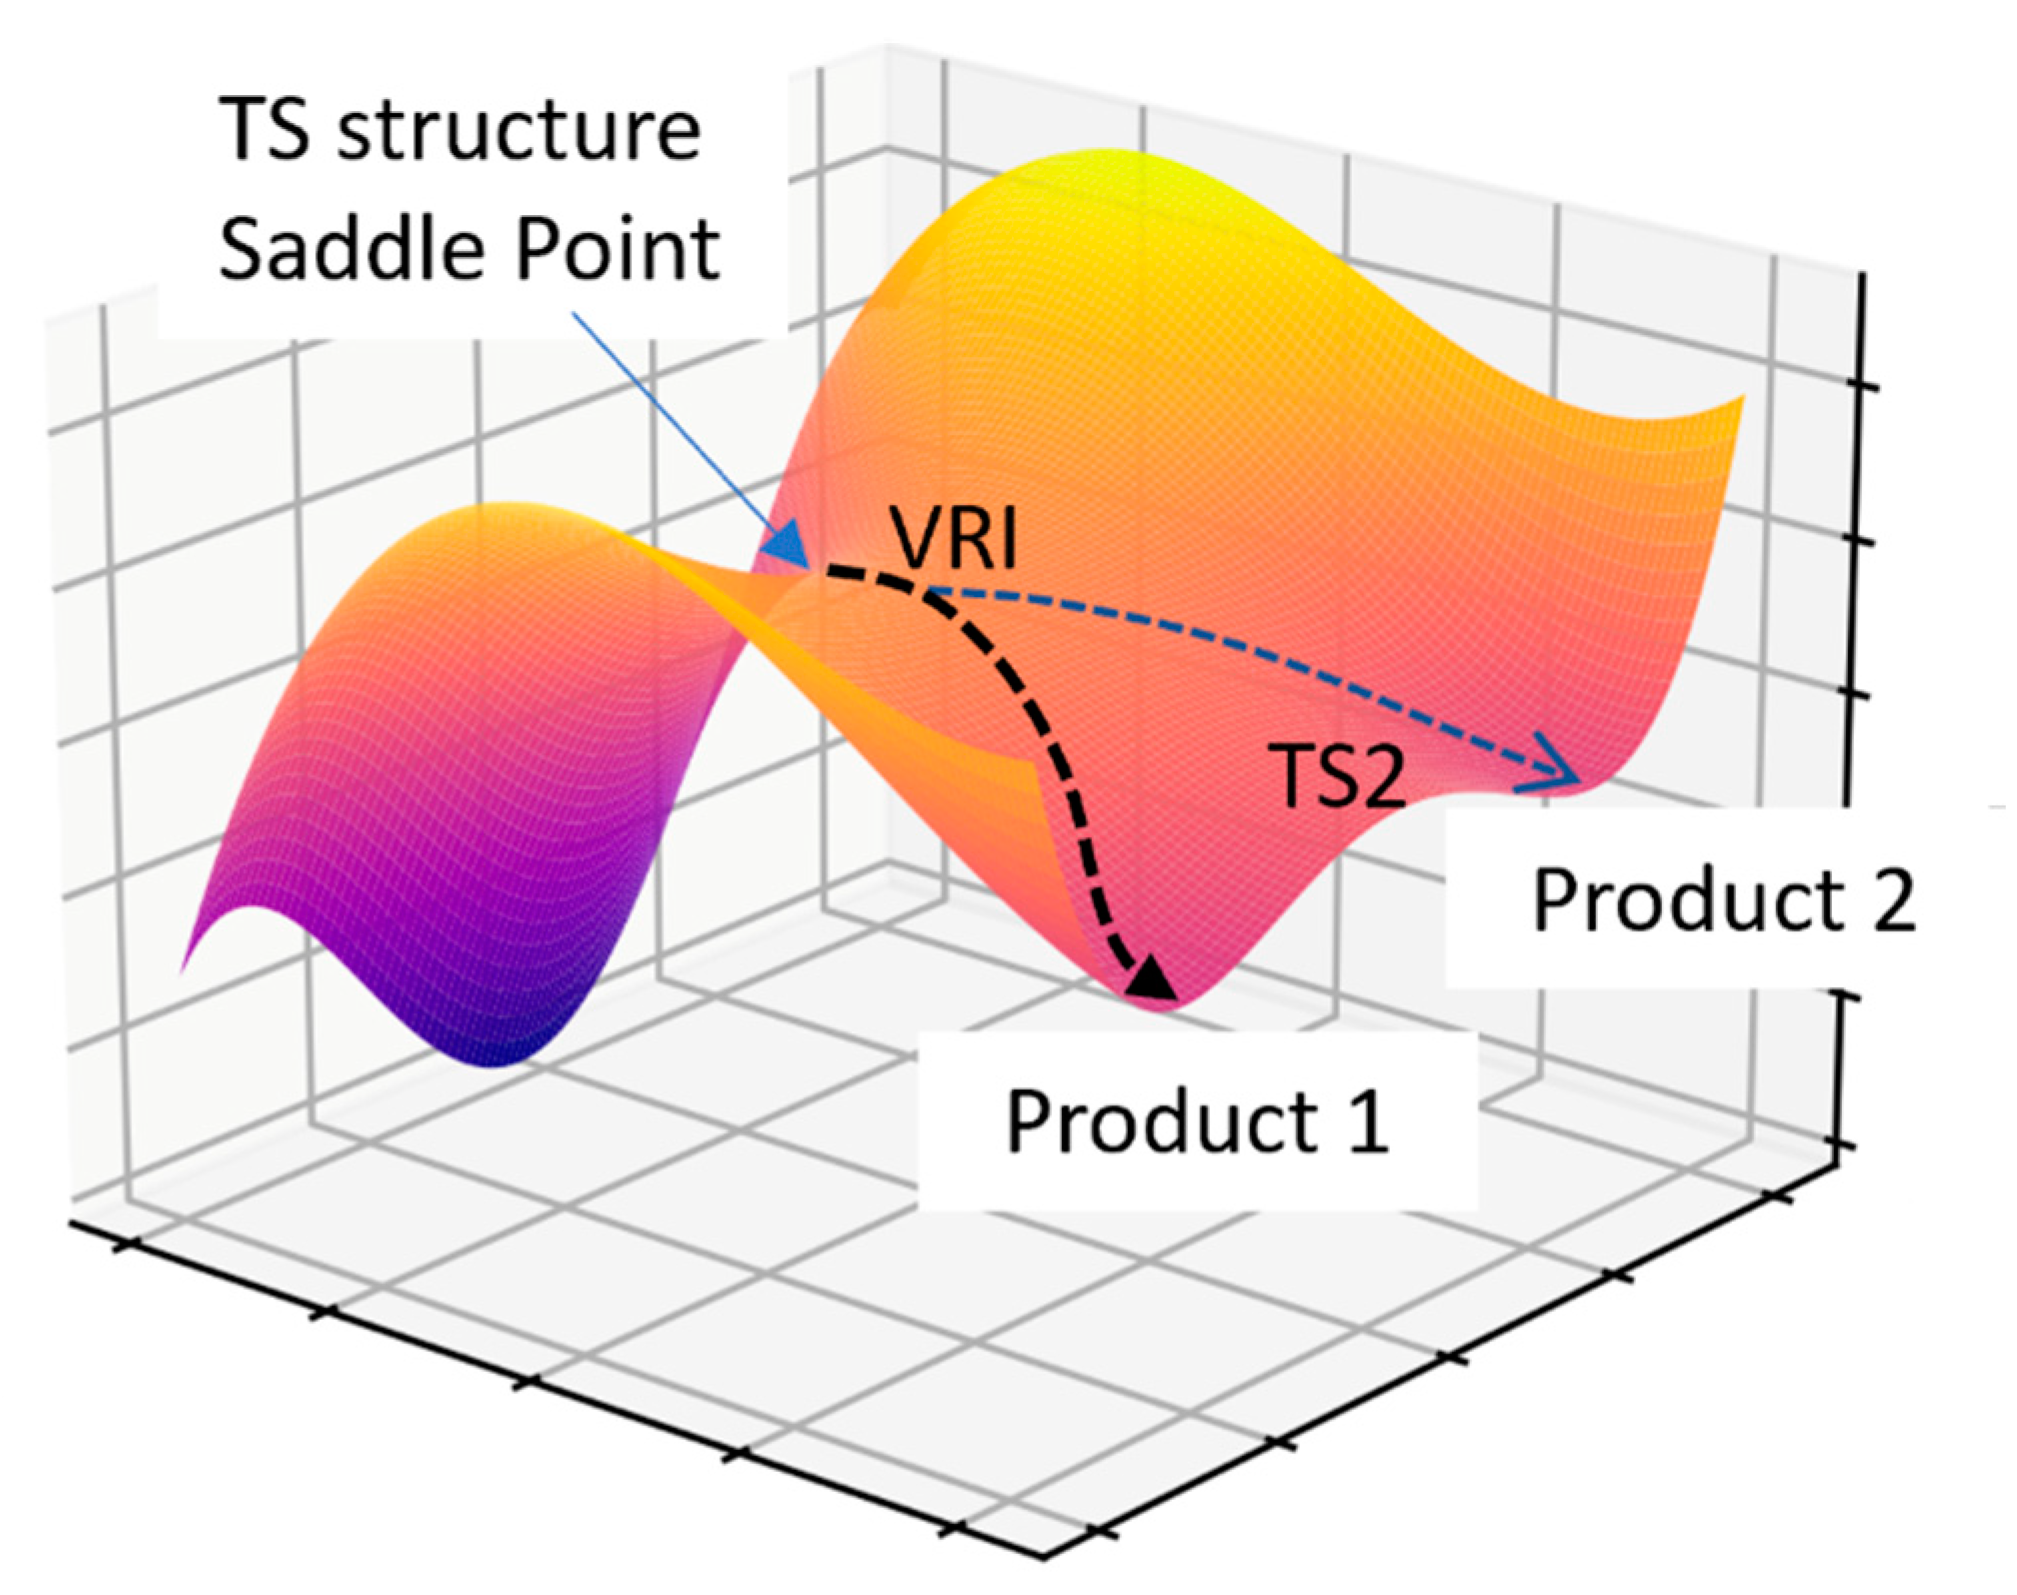
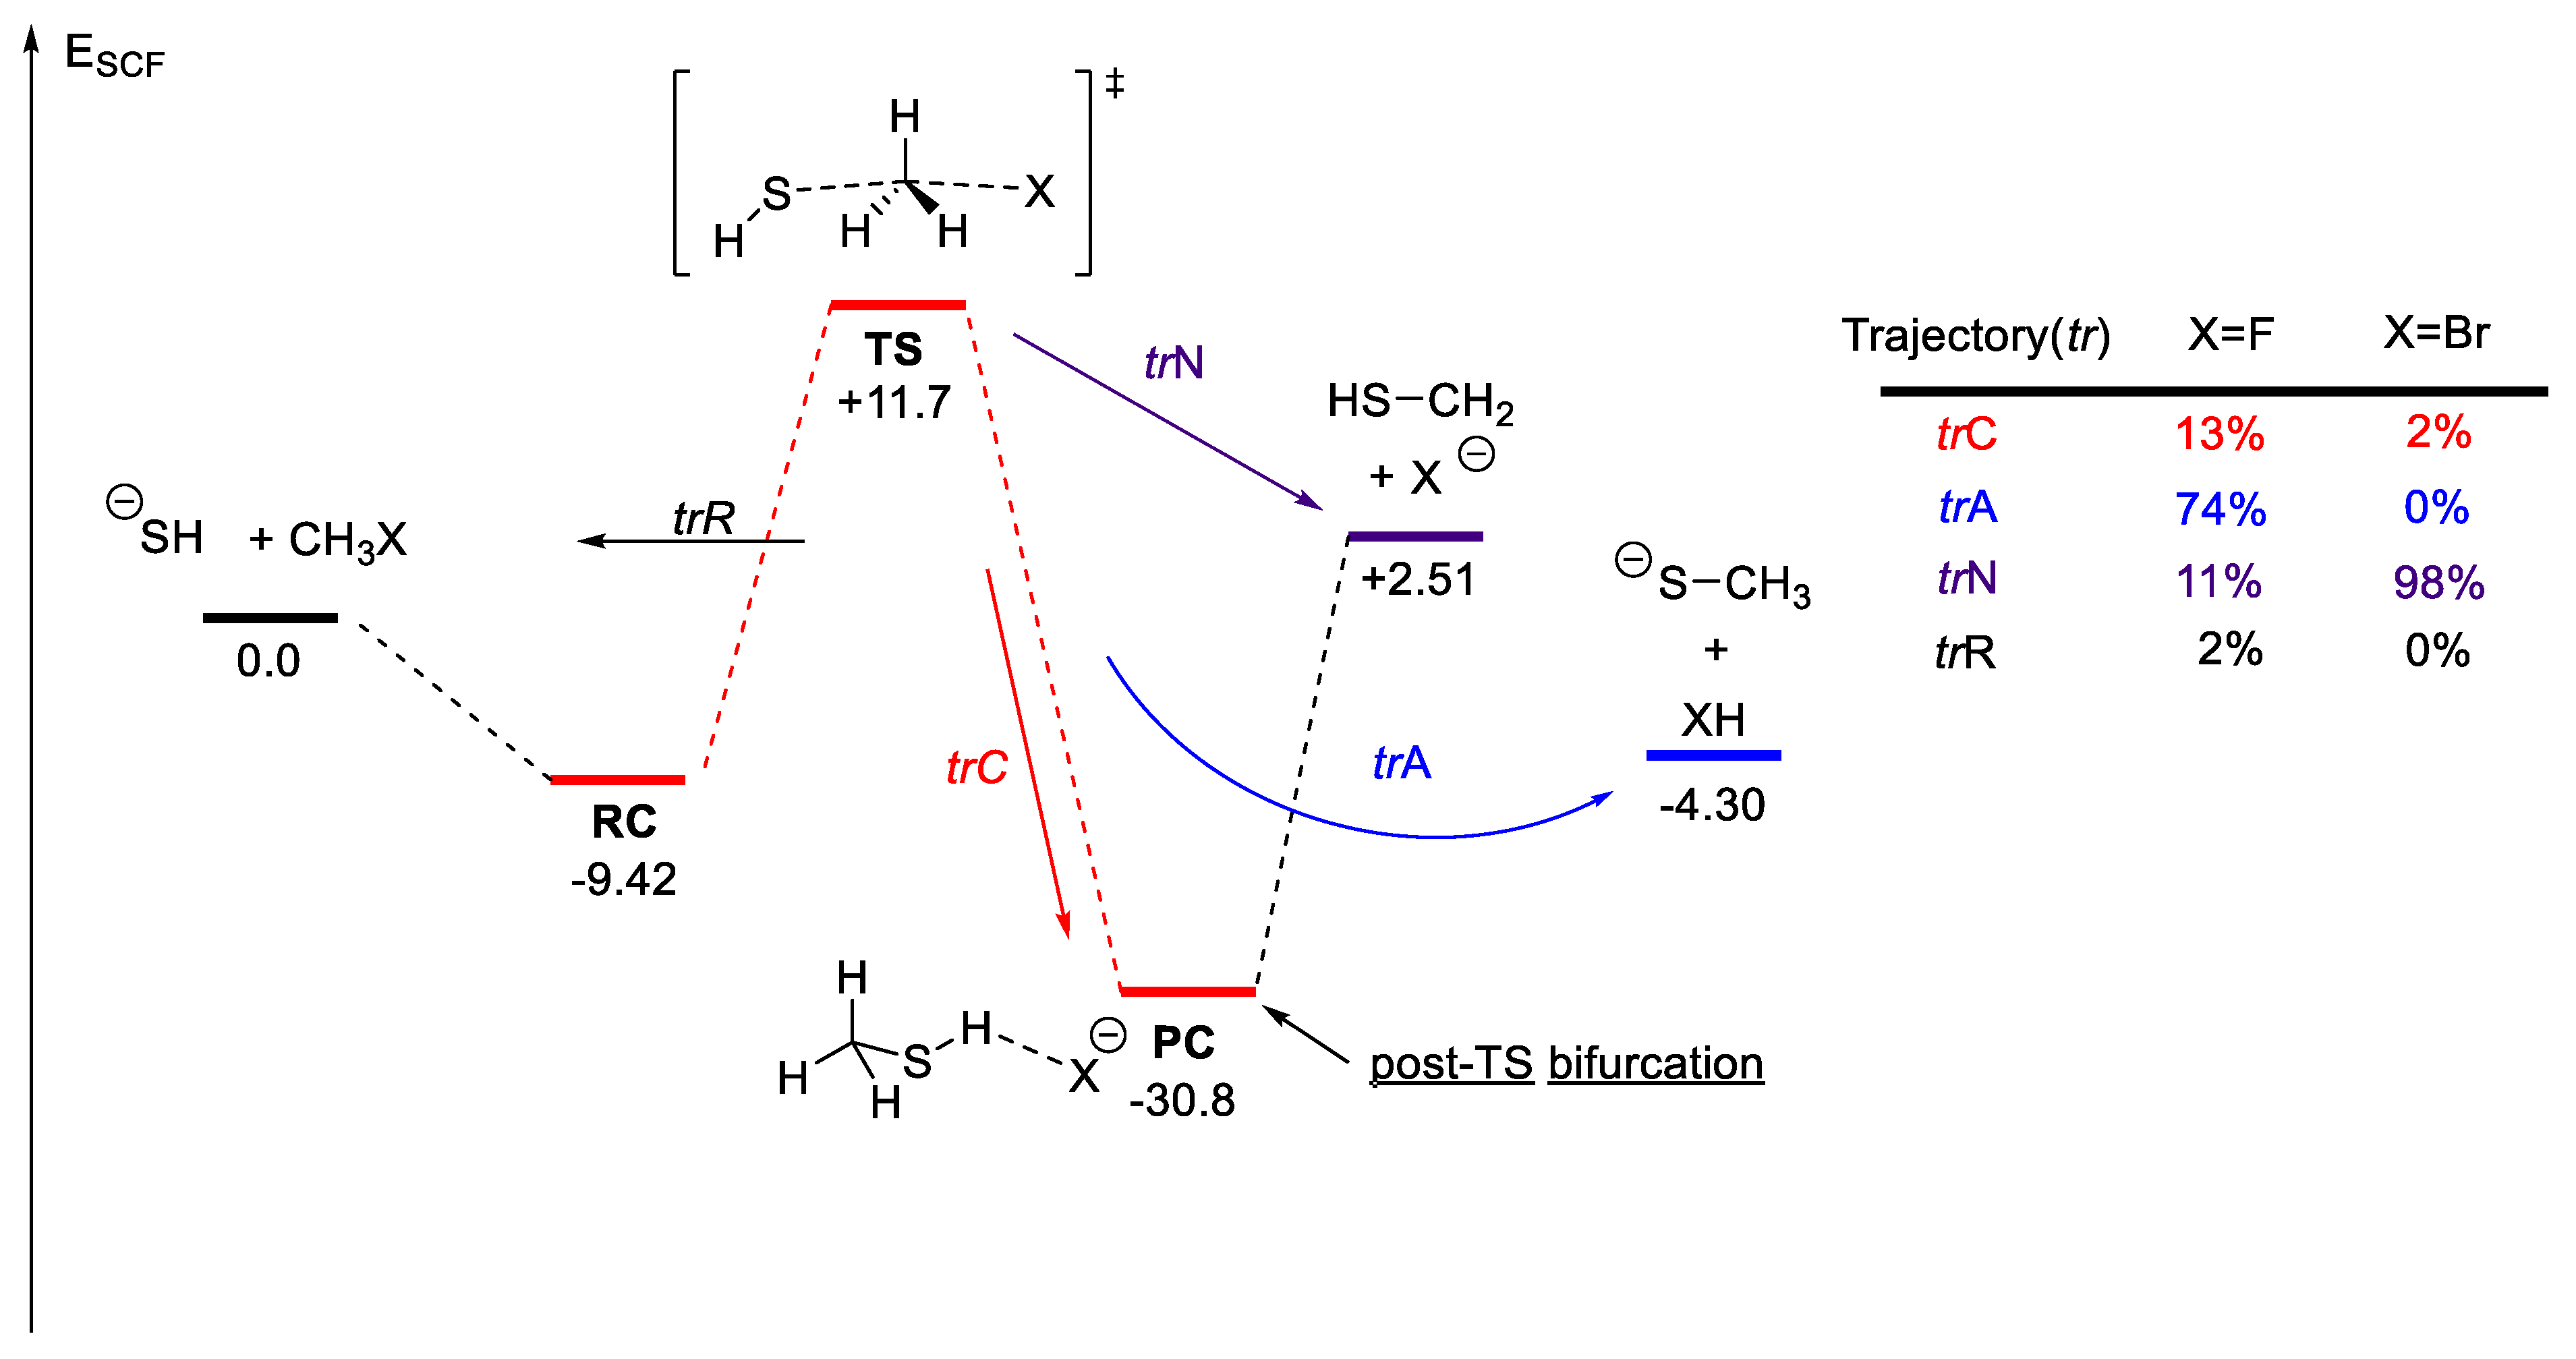
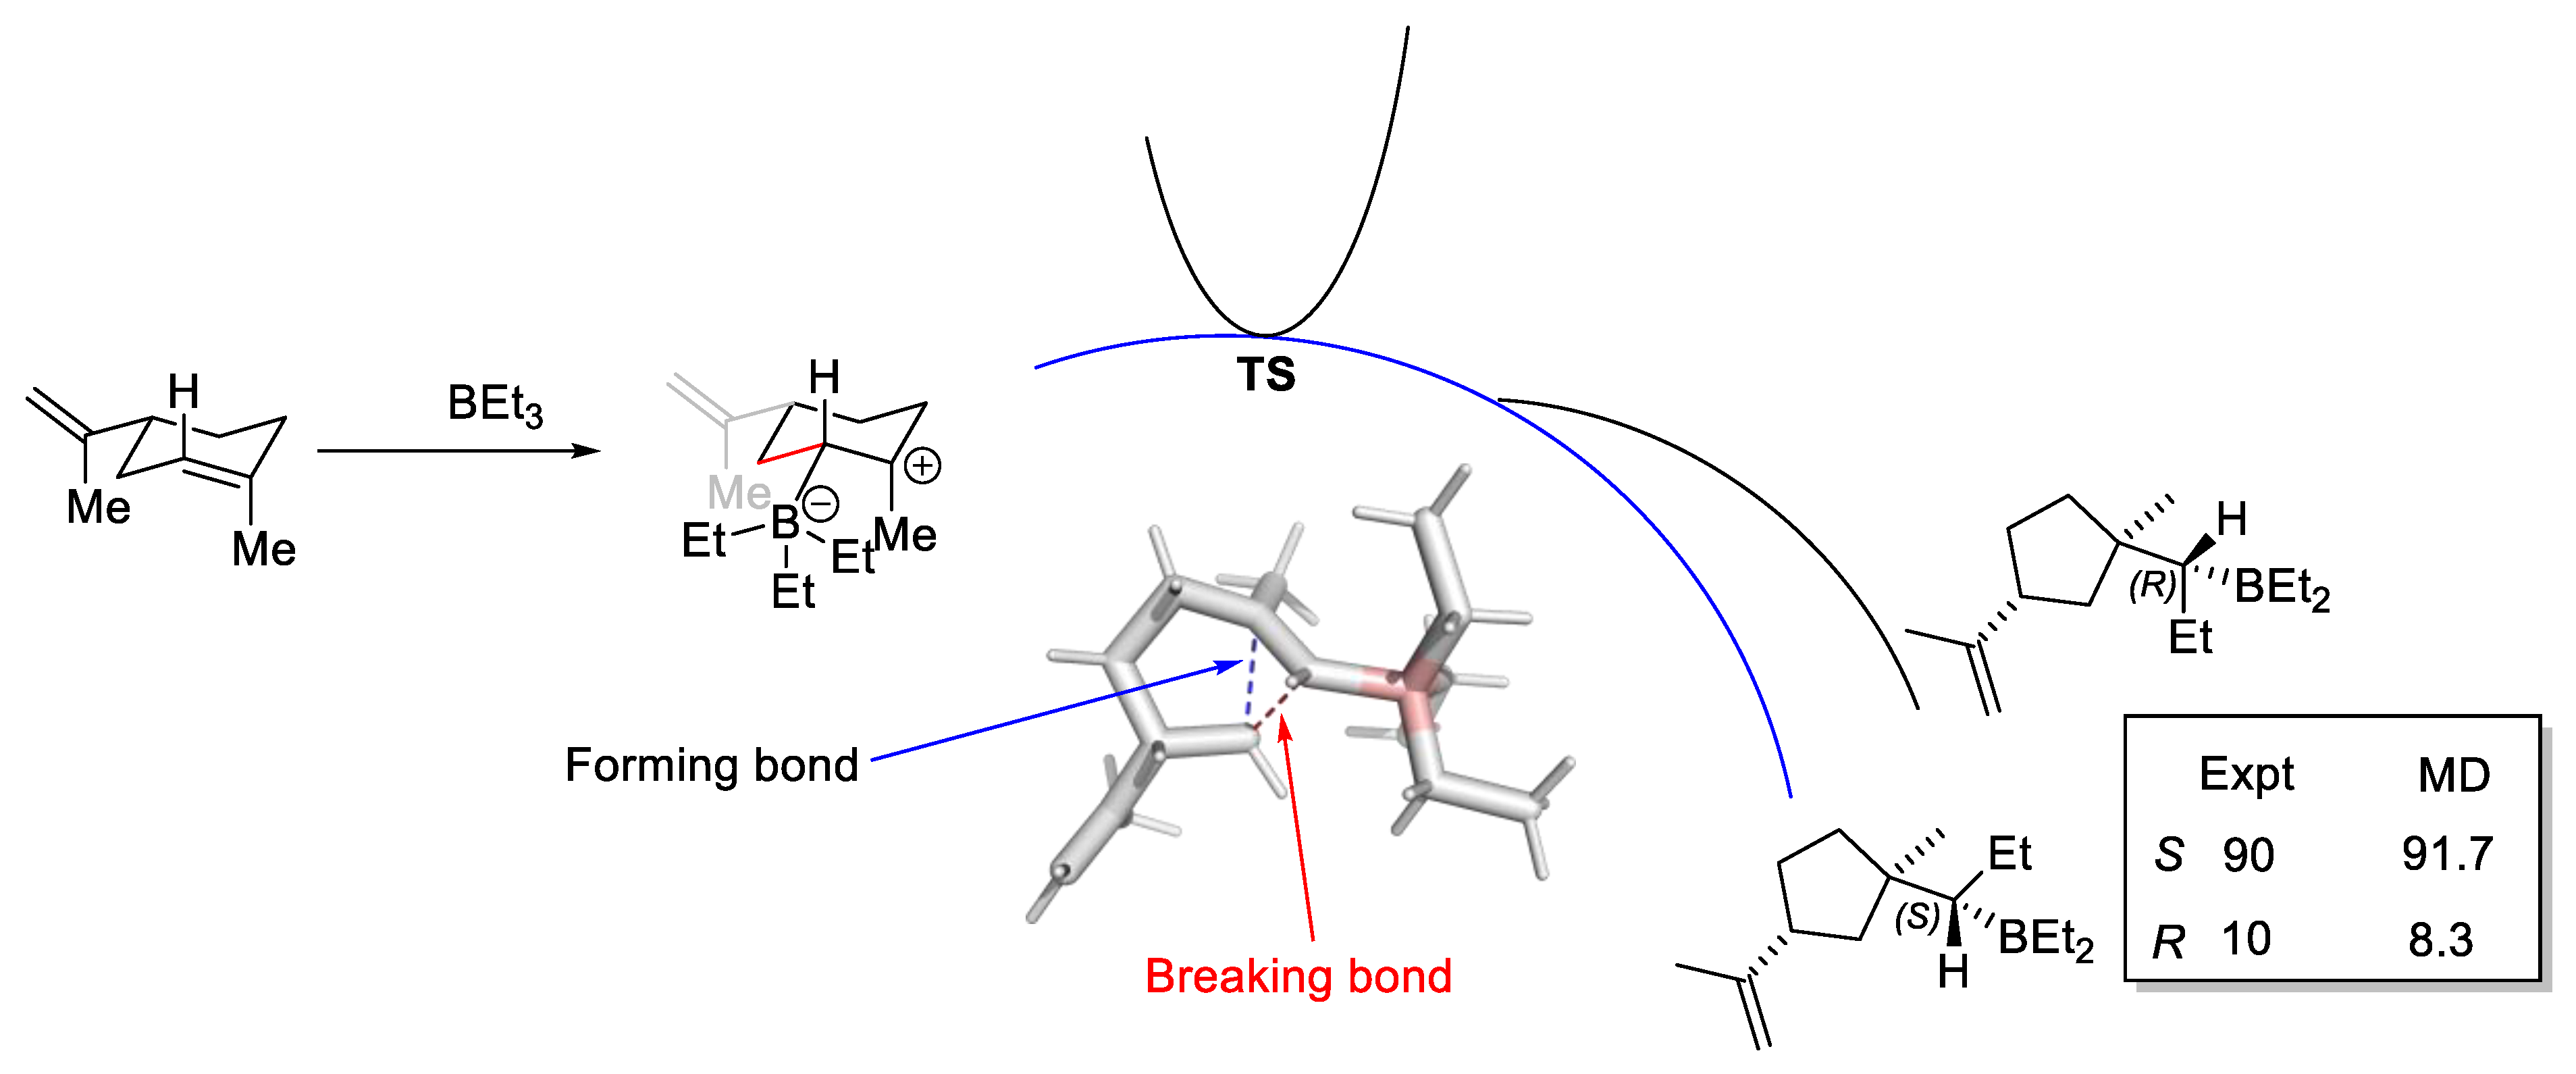
2.6.2. Bifurcating Potential Energy Surface
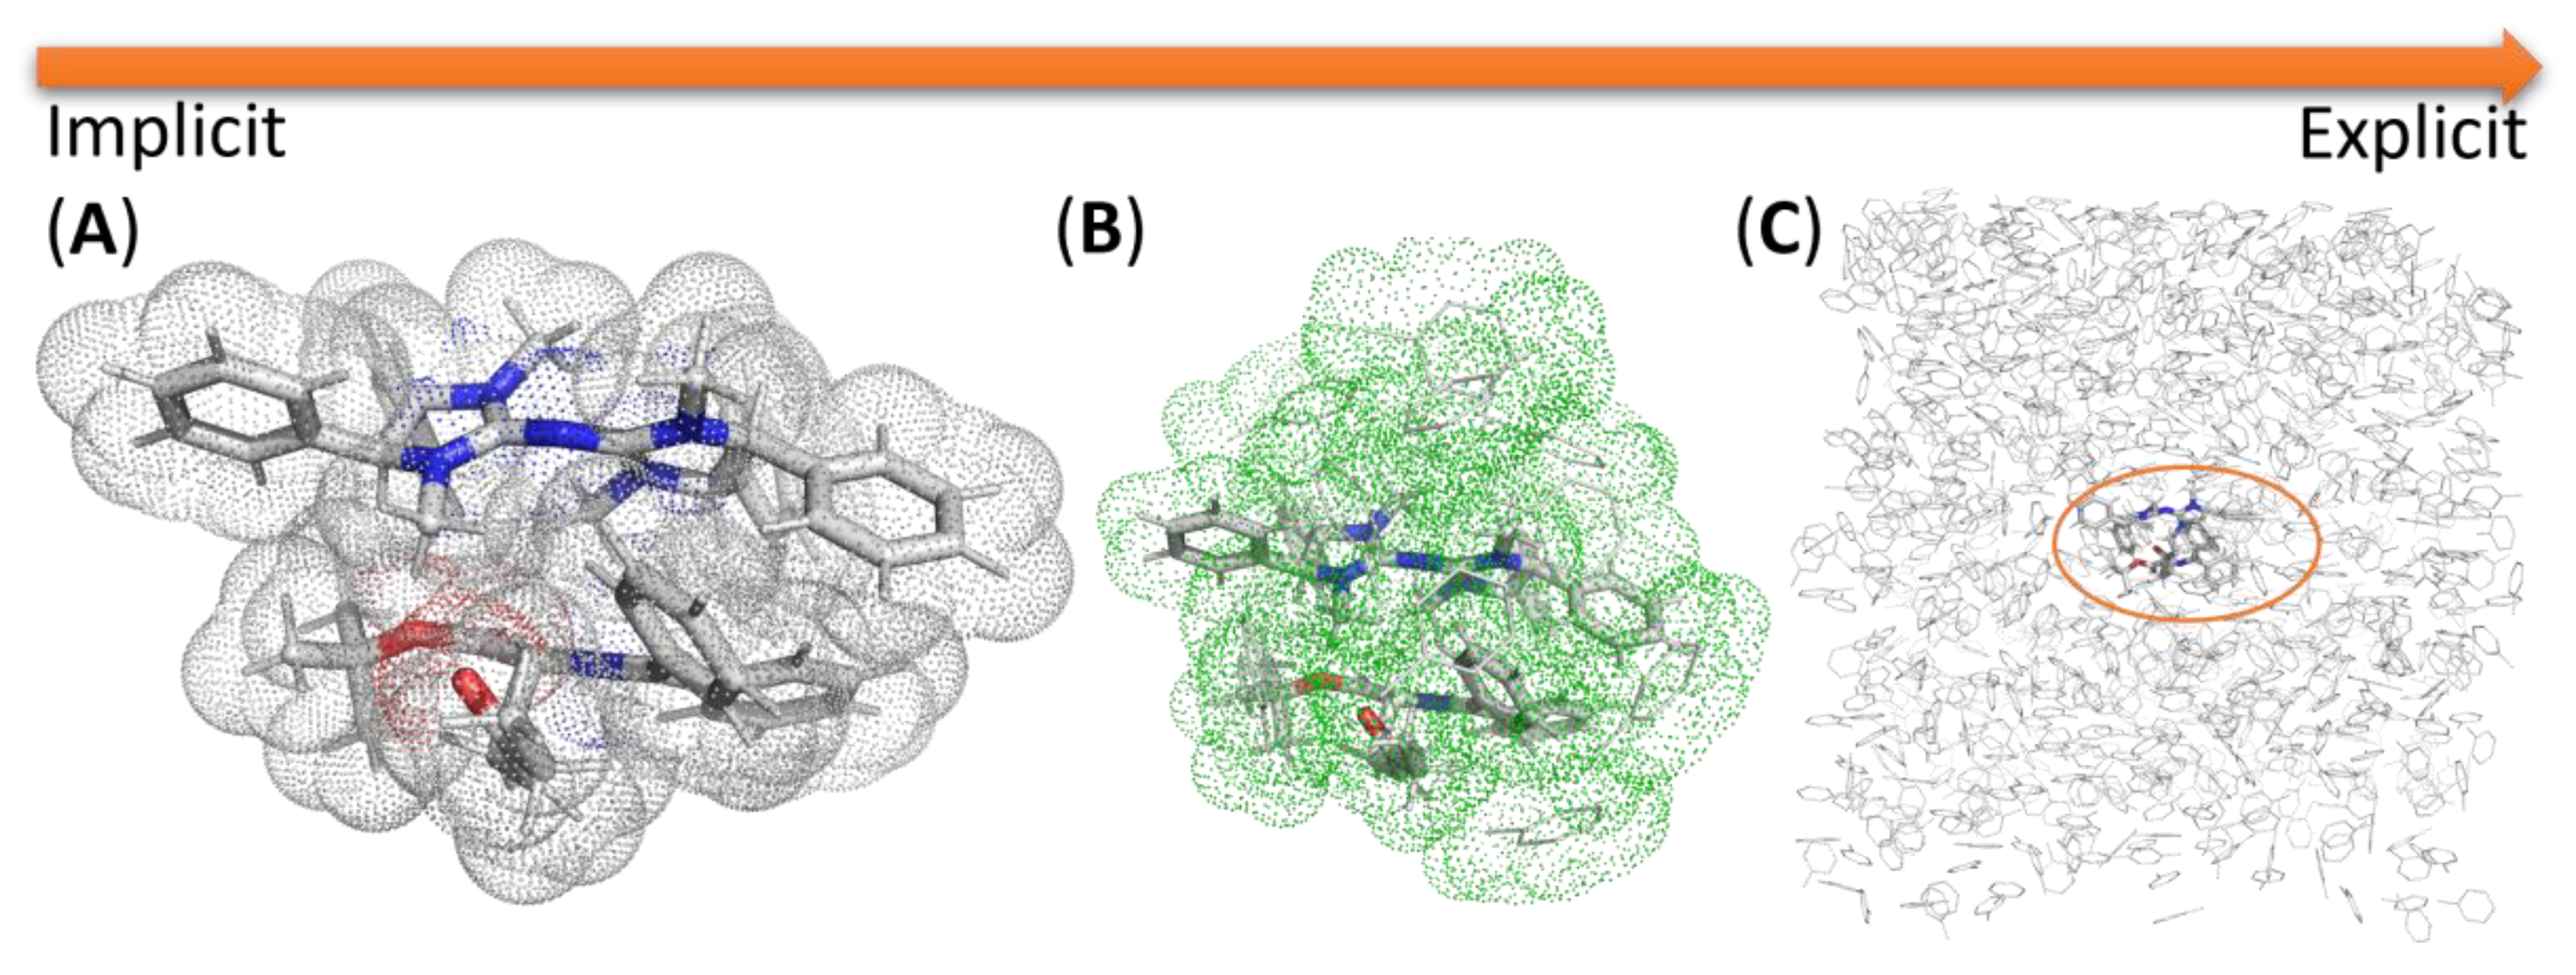
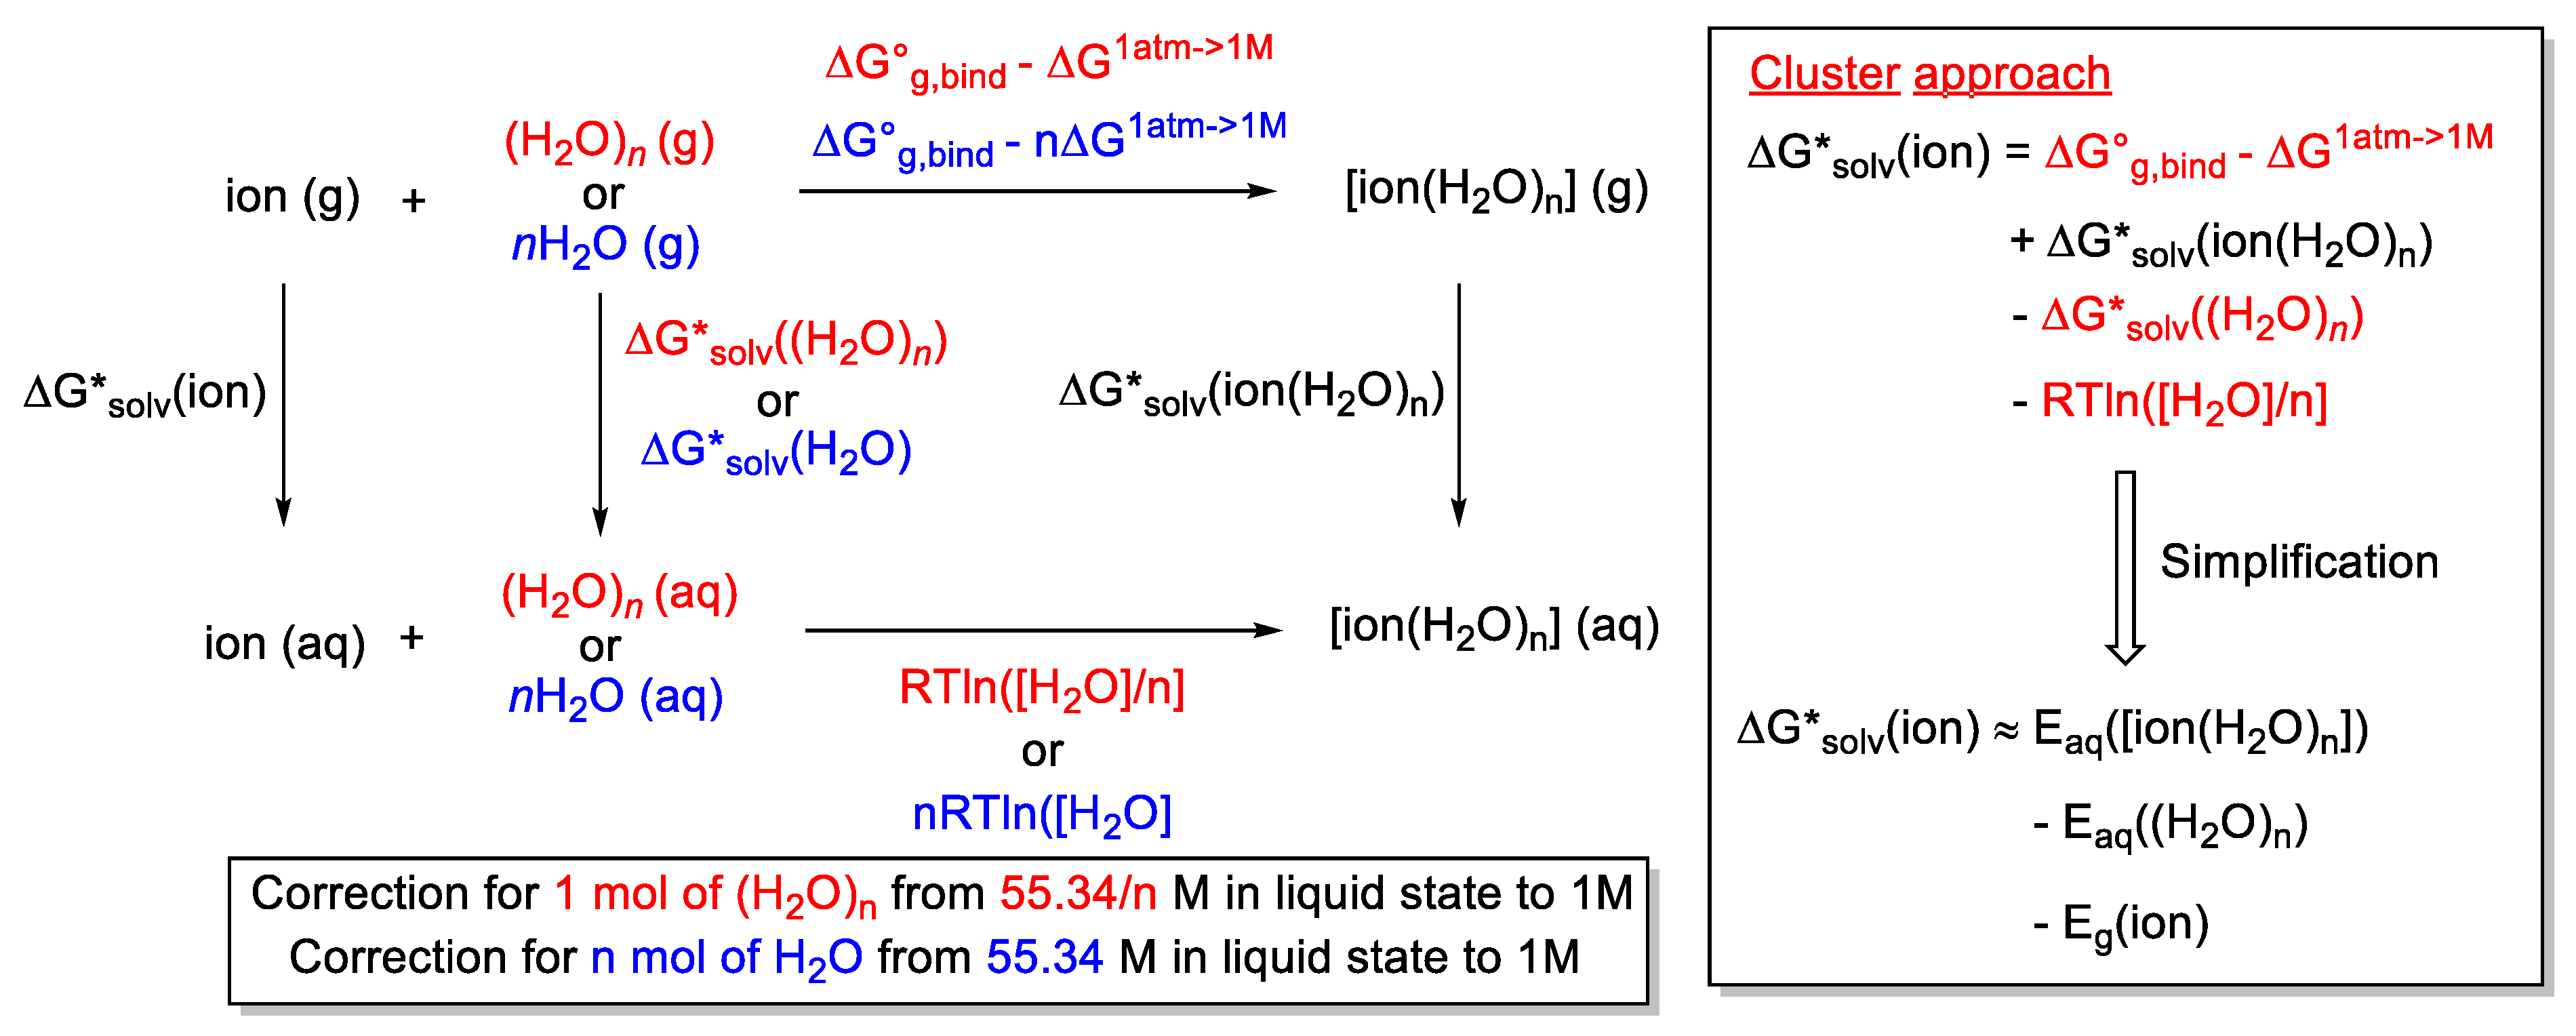
2.7. Modeling Solvation
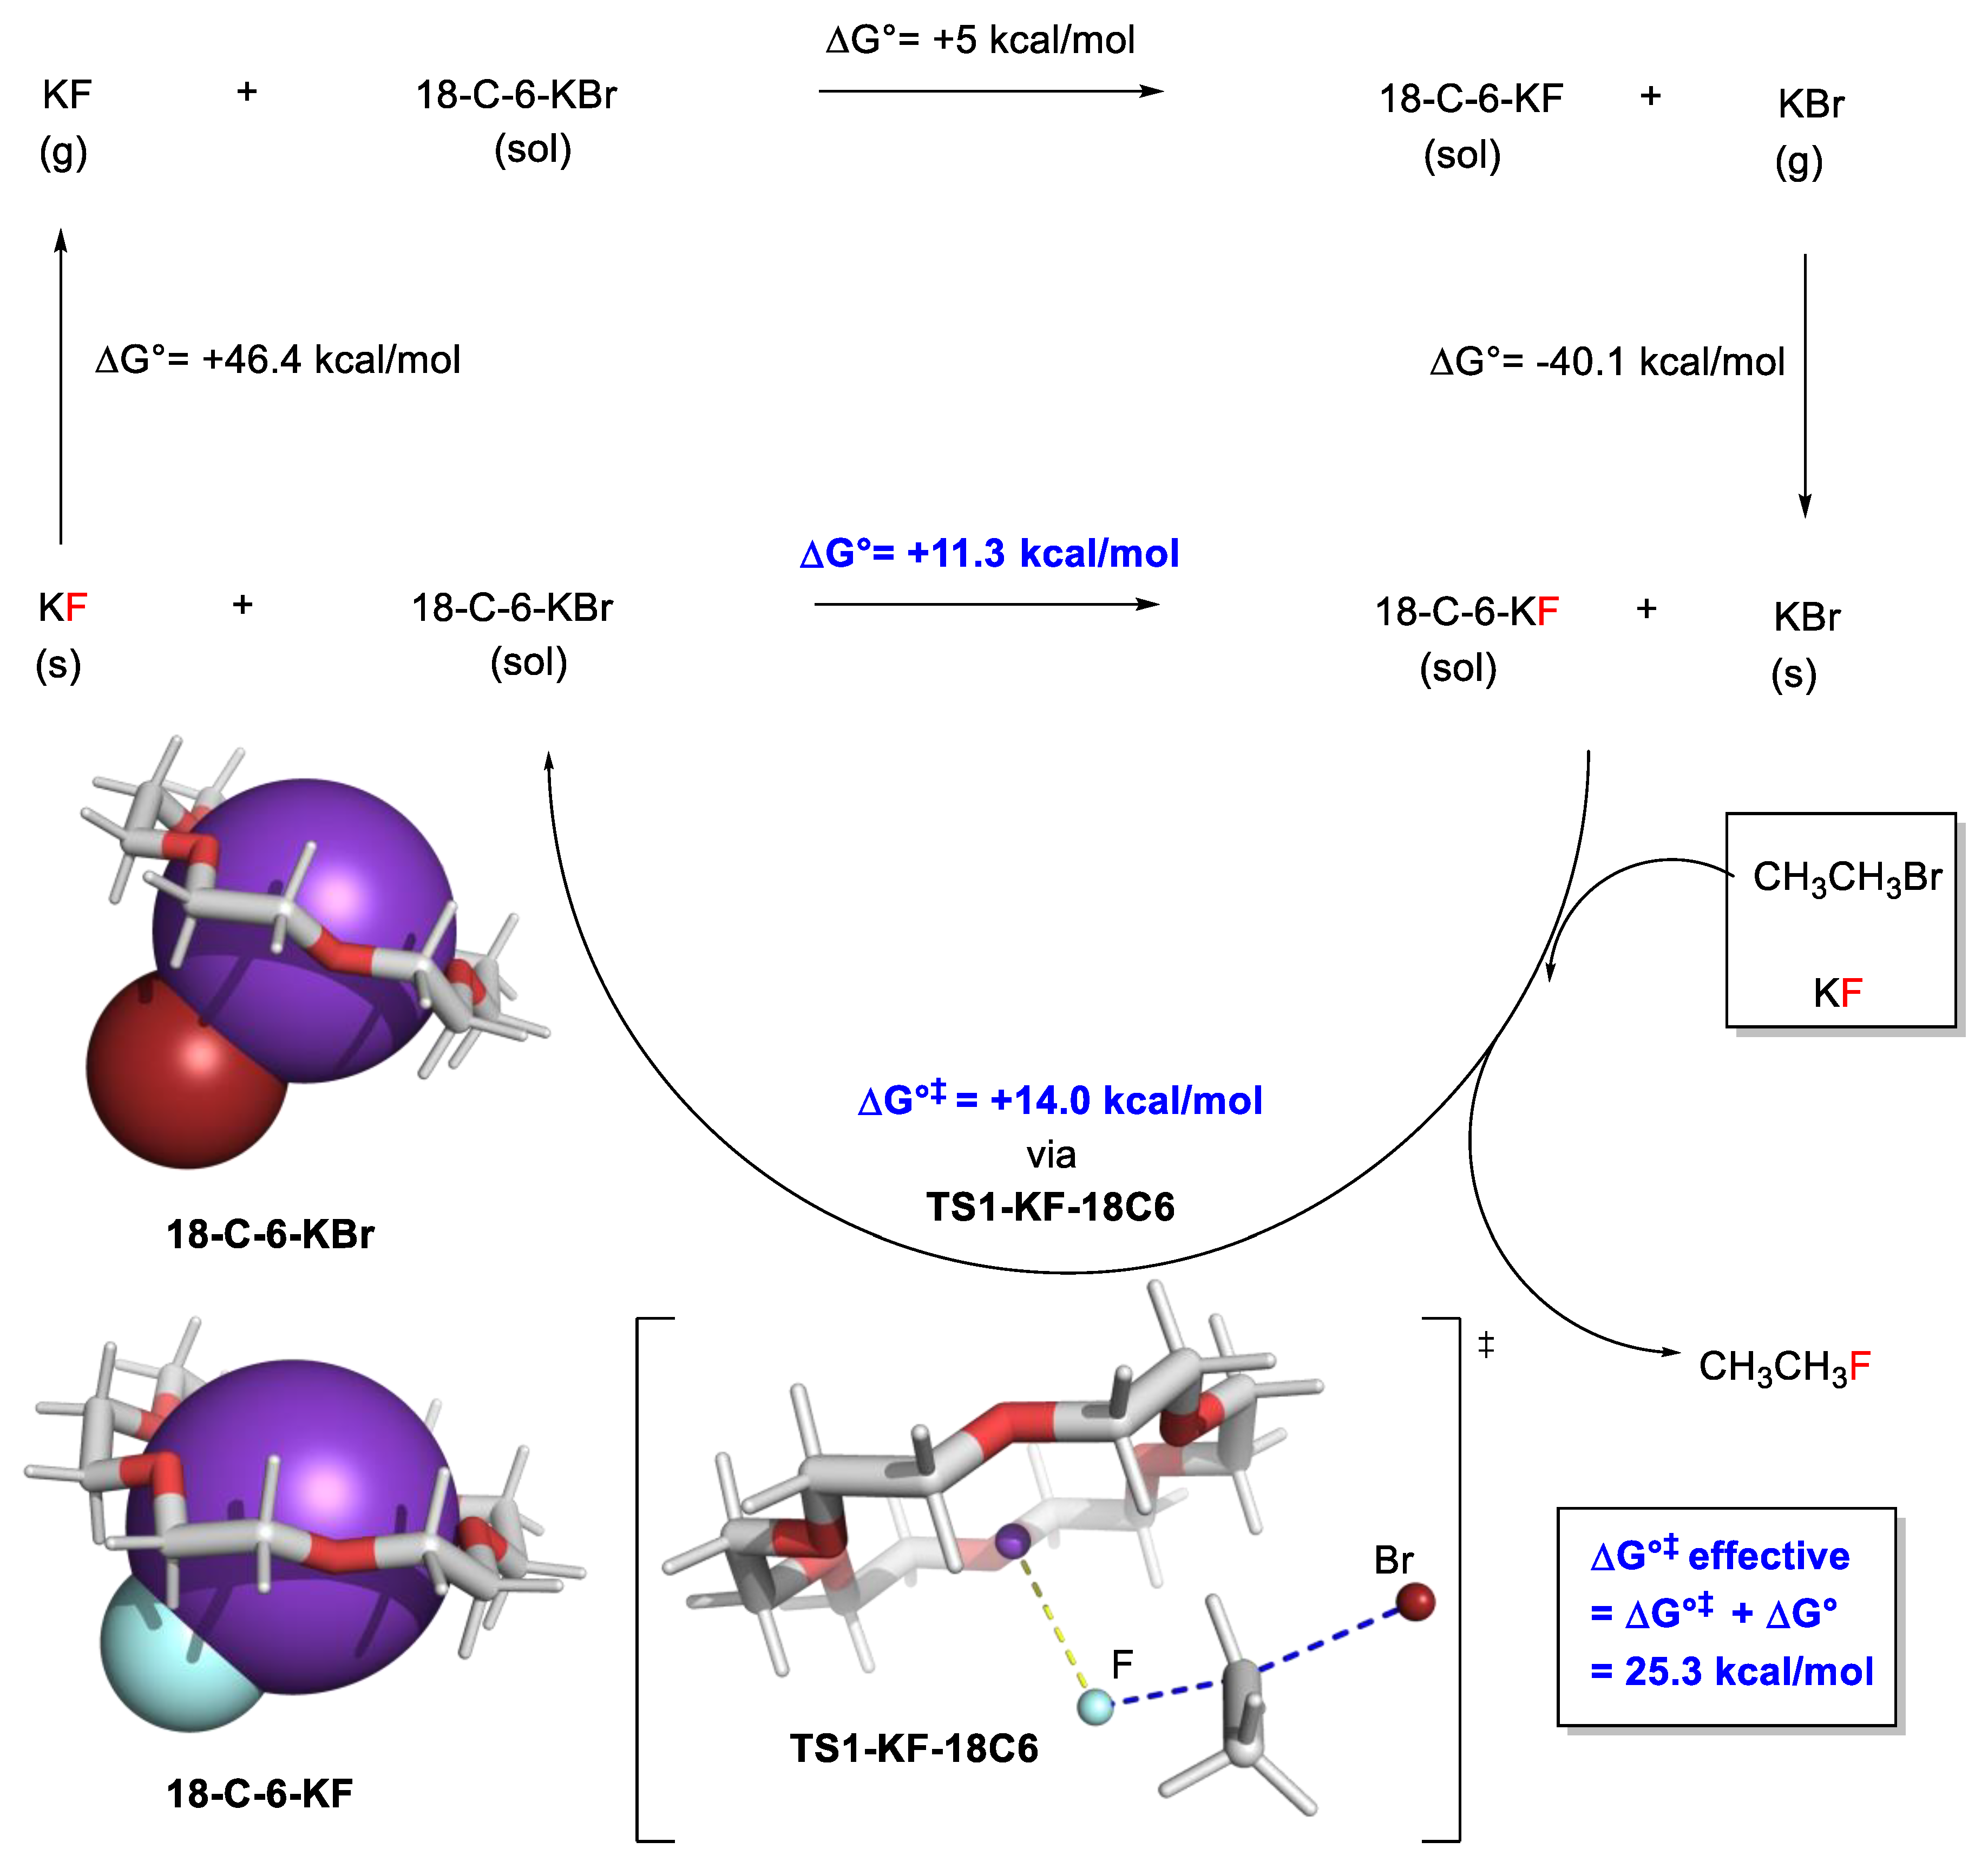
2.7.1. Examples Related to Solvation
2.8. Validation of Calculations
2.8.1. Validation: Heavy-Atom Kinetic Isotope Effect
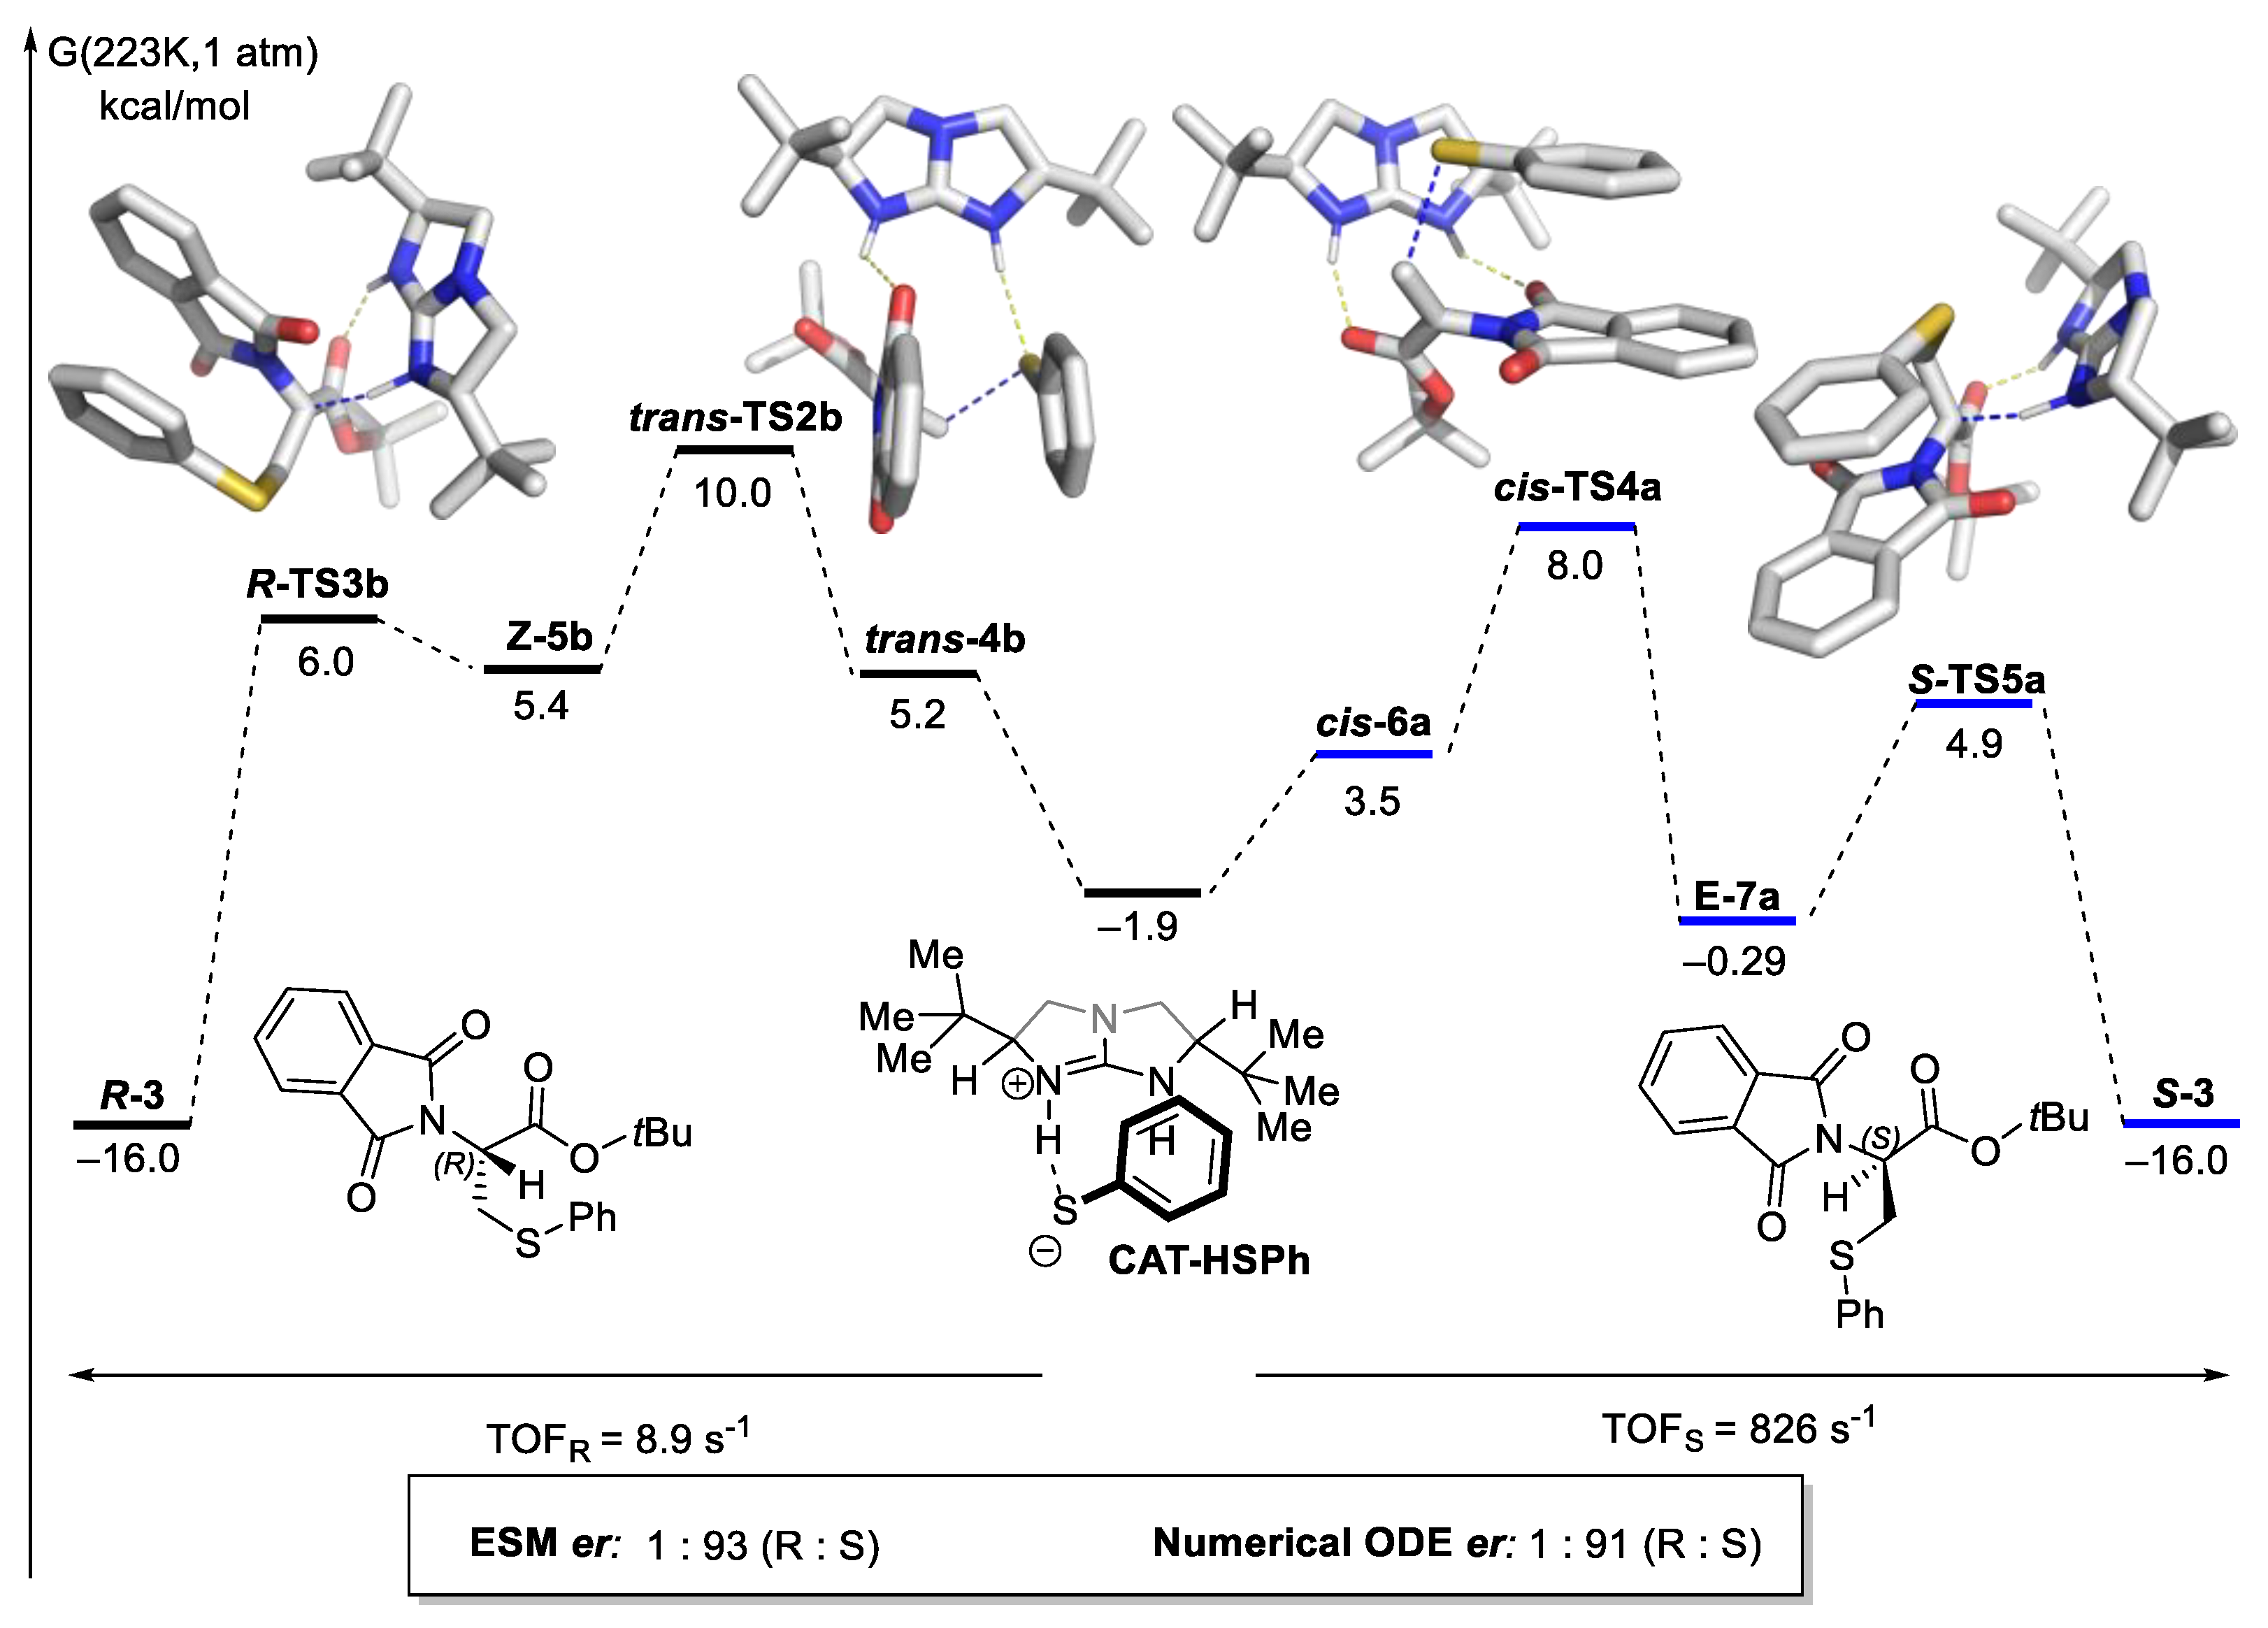
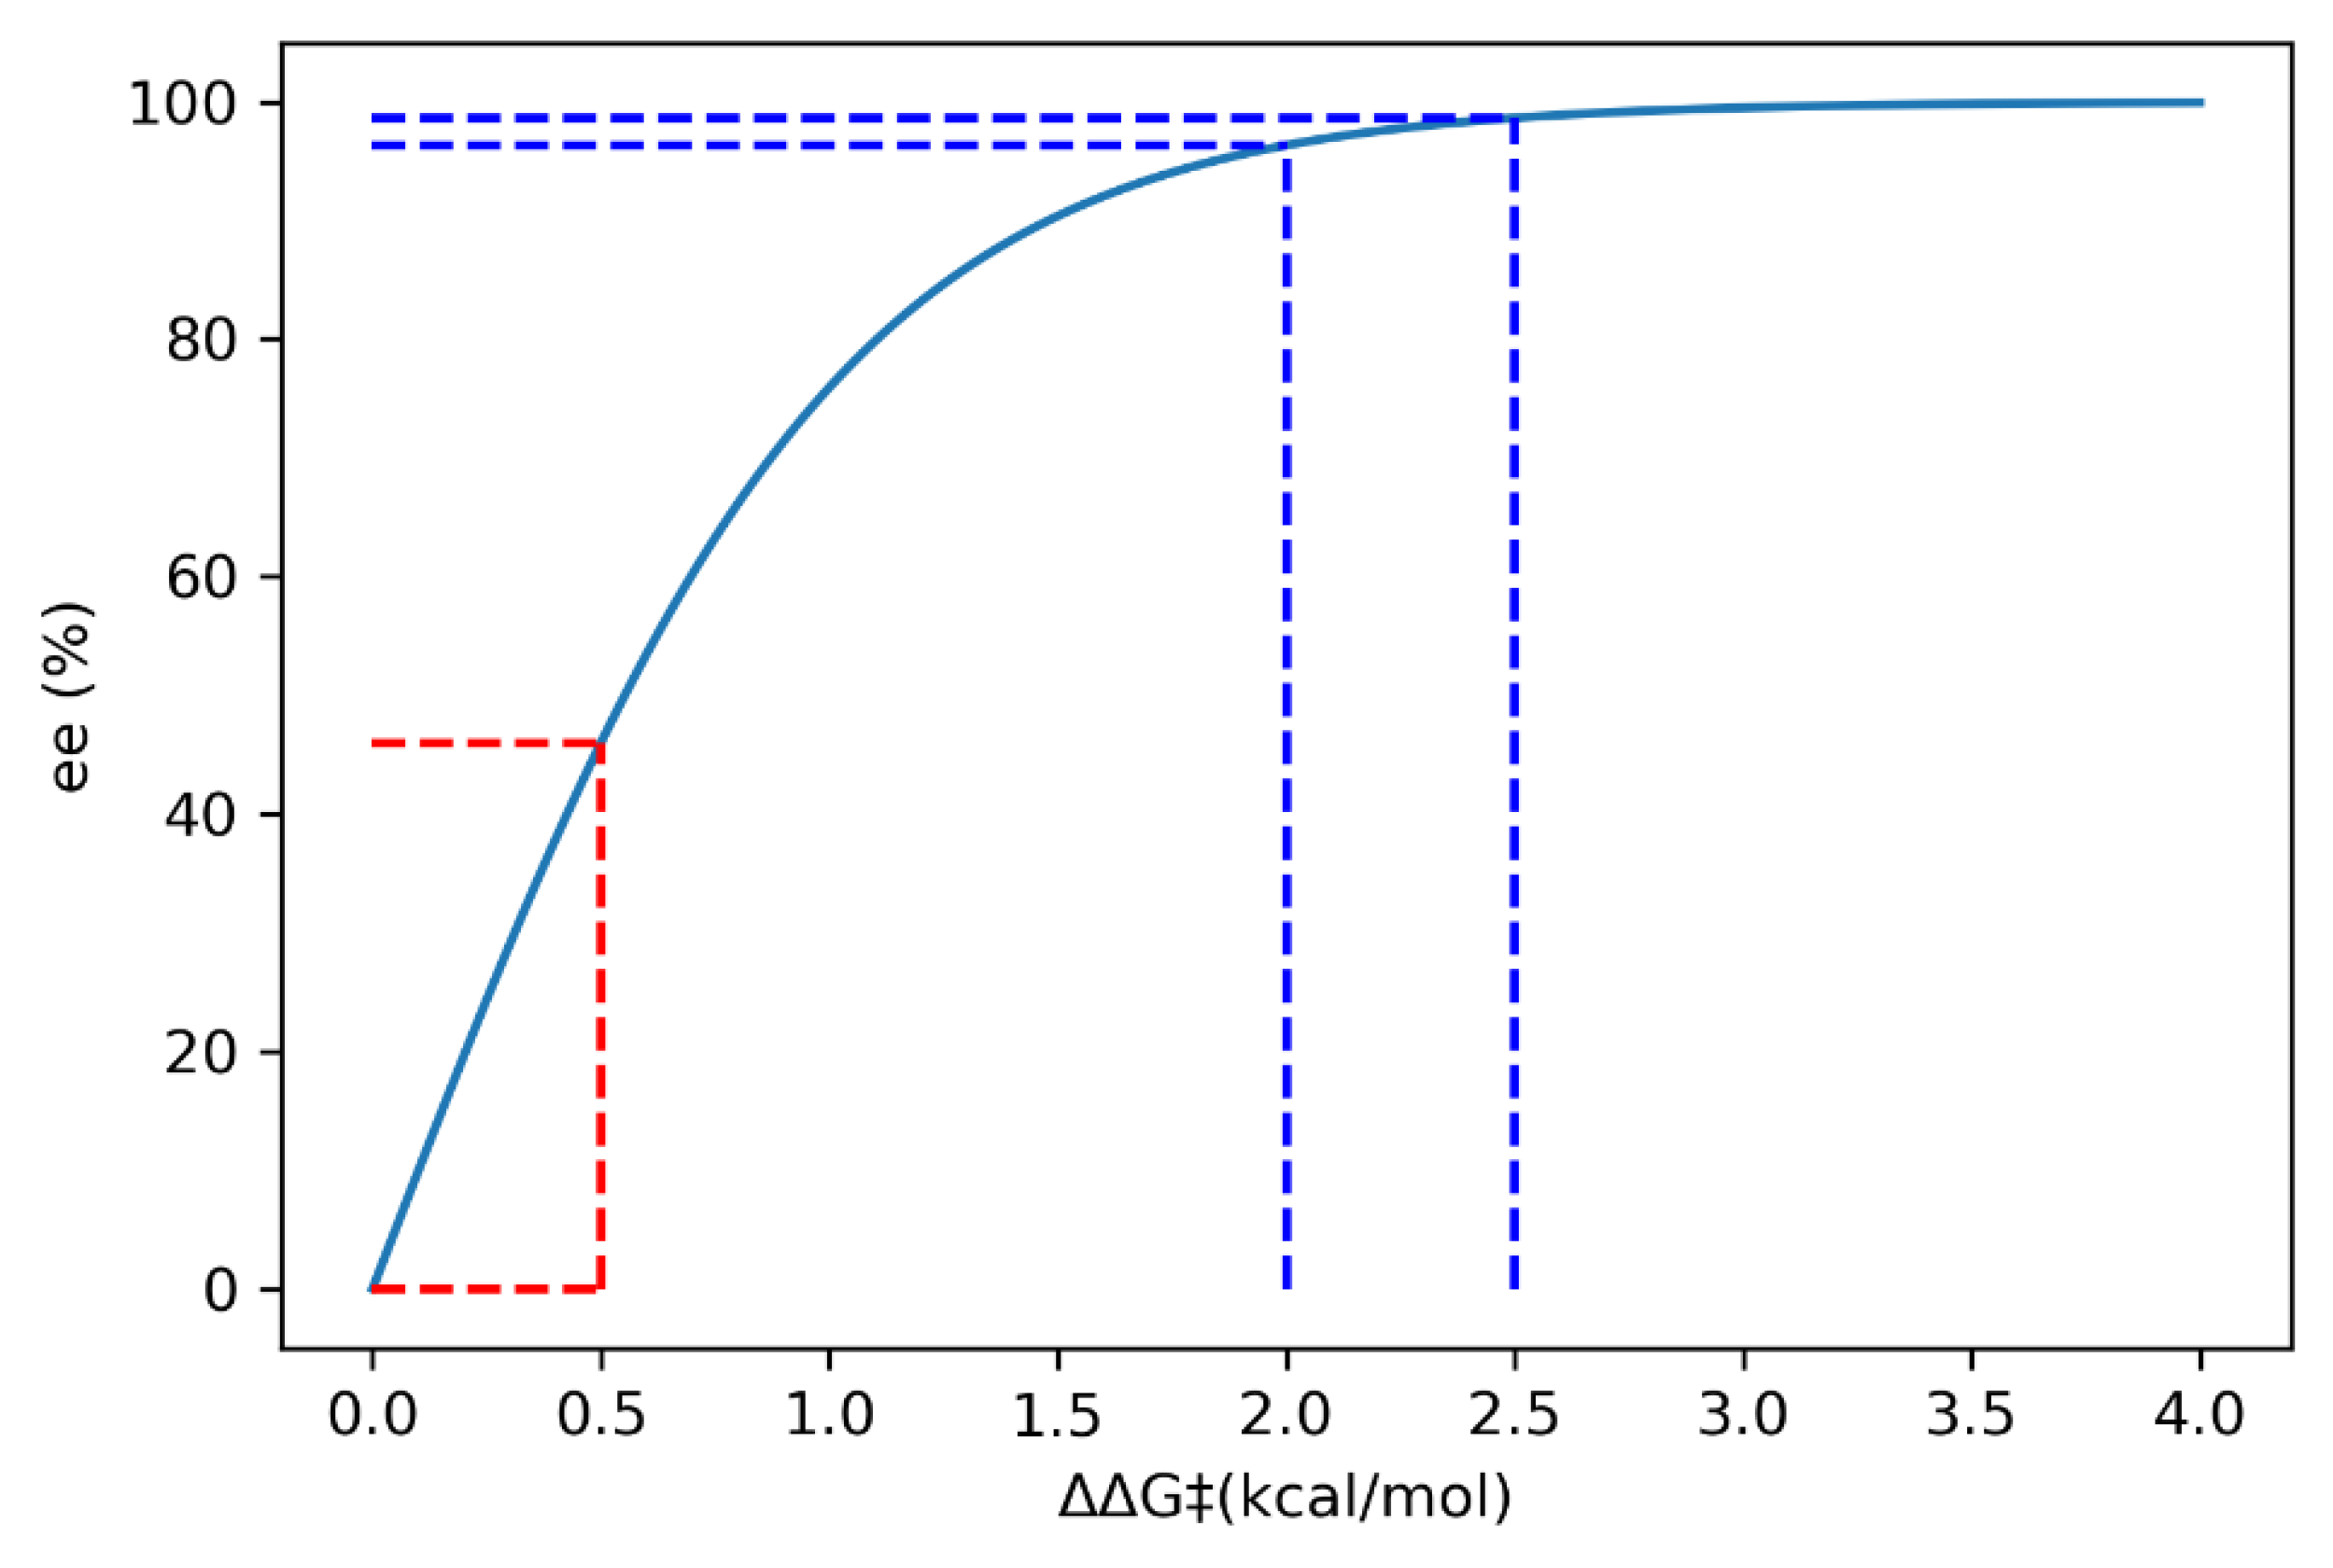
2.8.2. Validation: Enantioselectivity
2.9. Understanding/Interpretation
2.10. Machine Learning and its Relevance to the Field
2.10.1. Supervised Learning
2.10.2. Machine Learning Potential
3. Conclusions and Outlook
Funding
Institutional Review Board Statement
Informed Consent Statement
Data Availability Statement
Acknowledgments
Conflicts of Interest
Sample Availability
References
- Xiang, S.-H.; Tan, B. Advances in Asymmetric Organocatalysis over the Last 10 Years. Nat. Commun. 2020, 11, 3786. [Google Scholar] [CrossRef] [PubMed]
- Han, B.; He, X.-H.; Liu, Y.-Q.; He, G.; Peng, C.; Li, J.-L. Asymmetric Organocatalysis: An Enabling Technology for Medicinal Chemistry. Chem. Soc. Rev. 2021, 50, 1522–1586. [Google Scholar] [CrossRef]
- Hashimoto, T.; Maruoka, K. Recent Development and Application of Chiral Phase-Transfer Catalysts. Chem. Rev. 2007, 107, 5656–5682. [Google Scholar] [CrossRef] [PubMed]
- Qian, D.; Sun, J. Recent Progress in Asymmetric Ion-Pairing Catalysis with Ammonium Salts. Chem.—A Eur. J. 2019, 25, 3740–3751. [Google Scholar] [CrossRef]
- Nakamura, T.; Okuno, K.; Nishiyori, R.; Shirakawa, S. Hydrogen-Bonding Catalysis of Alkyl-Onium Salts. Chem.—An Asian J. 2020, 15, 463–472. [Google Scholar] [CrossRef]
- Zong, L.; Tan, C.H. Phase-Transfer and Ion-Pairing Catalysis of Pentanidiums and Bisguanidiniums. Acc. Chem. Res. 2017, 50, 842–856. [Google Scholar] [CrossRef]
- Li, H.; Liu, H.; Guo, H. Recent Advances in Phosphonium Salt Catalysis. Adv. Synth. Catal. 2021, 363, 2023–2036. [Google Scholar] [CrossRef]
- Pupo, G.; Gouverneur, V. Hydrogen Bonding Phase-Transfer Catalysis with Alkali Metal Fluorides and Beyond. J. Am. Chem. Soc. 2022, 144, 5200–5213. [Google Scholar] [CrossRef]
- Phipps, R.J.; Hamilton, G.L.; Toste, F.D. The Progression of Chiral Anions from Concepts to Applications in Asymmetric Catalysis. Nat. Chem. 2012, 4, 603–614. [Google Scholar] [CrossRef]
- Mąkosza, M.; Fedoryński, M. Interfacial Processes—The Key Steps of Phase Transfer Catalyzed Reactions. Catalysts 2020, 10, 1436. [Google Scholar] [CrossRef]
- Sterling, A.J.; Zavitsanou, S.; Ford, J.; Duarte, F. Selectivity in Organocatalysis—From Qualitative to Quantitative Predictive Models. Wiley Interdiscip. Rev. Comput. Mol. Sci. 2021, 11, e1518. [Google Scholar] [CrossRef]
- Chin, Y.P.; See, N.W.; Jenkins, I.D.; Krenske, E.H. Computational Discoveries of Reaction Mechanisms: Recent Highlights and Emerging Challenges. Org. Biomol. Chem. 2022, 20, 2028–2042. [Google Scholar] [CrossRef]
- Melnyk, N.; Iribarren, I.; Mates-Torres, E.; Trujillo, C. Theoretical Perspectives in Organocatalysis. Chem.—A Eur. J. 2022, 28, e202201570. [Google Scholar] [CrossRef] [PubMed]
- Iribarren, I.; Garcia, M.R.; Trujillo, C. Catalyst Design within Asymmetric Organocatalysis. Wiley Interdiscip. Rev. Comput. Mol. Sci. 2022, 12, e1616. [Google Scholar] [CrossRef]
- Houk, K.N.; Cheong, P.H.Y. Computational Prediction of Small-Molecule Catalysts. Nature 2008, 455, 309–313. [Google Scholar] [CrossRef] [PubMed]
- Peng, Q.; Duarte, F.; Paton, R.S. Computing Organic Stereoselectivity—From Concepts to Quantitative Calculations and Predictions. Chem. Soc. Rev. 2016, 45, 6093–6107. [Google Scholar] [CrossRef] [PubMed]
- Krenske, E.H. Challenges in Predicting Stereoselectivity. In Applied Theoretical Organic Chemistry; WORLD SCIENTIFIC (EUROPE): Singapore, 2018; pp. 583–604. ISBN 9781786344090. [Google Scholar]
- Chanussot, L.; Das, A.; Goyal, S.; Lavril, T.; Shuaibi, M.; Riviere, M.; Tran, K.; Heras-Domingo, J.; Ho, C.; Hu, W.; et al. Open Catalyst 2020 (OC20) Dataset and Community Challenges. ACS Catal. 2021, 11, 6059–6072. [Google Scholar] [CrossRef]
- Tran, R.; Lan, J.; Shuaibi, M.; Wood, B.M.; Goyal, S.; Das, A.; Heras-Domingo, J.; Kolluru, A.; Rizvi, A.; Shoghi, N.; et al. The Open Catalyst 2022 (OC22) Dataset and Challenges for Oxide Electrocatalysts. arXiv 2022, arXiv:2206.08917. [Google Scholar] [CrossRef]
- Grimme, S.; Schreiner, P.R. Computational Chemistry: The Fate of Current Methods and Future Challenges. Angew. Chem.—Int. Ed. 2018, 57, 4170–4176. [Google Scholar] [CrossRef] [PubMed]
- Houk, K.N.; Liu, F. Holy Grails for Computational Organic Chemistry and Biochemistry. Acc. Chem. Res. 2017, 50, 539–543. [Google Scholar] [CrossRef]
- Sunoj, R.B. Coming of Age of Computational Chemistry from a Resilient Past to a Promising Future. Isr. J. Chem. 2022, 62, e202100106. [Google Scholar] [CrossRef]
- Harvey, J.N.; Himo, F.; Maseras, F.; Perrin, L. Scope and Challenge of Computational Methods for Studying Mechanism and Reactivity in Homogeneous Catalysis. ACS Catal. 2019, 9, 6803–6813. [Google Scholar] [CrossRef]
- Funes-Ardoiz, I.; Schoenebeck, F. Established and Emerging Computational Tools to Study Homogeneous Catalysis—From Quantum Mechanics to Machine Learning. Chem 2020, 6, 1904–1913. [Google Scholar] [CrossRef]
- Bartlett, R.J. How and Why Coupled-Cluster Theory Became the Pre-Eminent Method in an Ab into Quantum Chemistry. In Theory and Applications of Computational Chemistry; Elsevier: Amsterdam, The Netherlands, 2005; pp. 1191–1221. ISBN 9780444517197. [Google Scholar]
- Vermeeren, P.; Dalla Tiezza, M.; Wolf, M.E.; Lahm, M.E.; Allen, W.D.; Schaefer, H.F.; Hamlin, T.A.; Bickelhaupt, F.M. Pericyclic Reaction Benchmarks: Hierarchical Computations Targeting CCSDT(Q)/CBS and Analysis of DFT Performance. Phys. Chem. Chem. Phys. 2022, 24, 18028–18042. [Google Scholar] [CrossRef]
- Seeger, Z.L.; Izgorodina, E.I. A Systematic Study of DFT Performance for Geometry Optimizations of Ionic Liquid Clusters. J. Chem. Theory Comput. 2020, 16, 6735–6753. [Google Scholar] [CrossRef]
- Tribedi, S.; Sunoj, R.B. Molecular Insights into Chirality Transfer from Double Axially Chiral Phosphoric Acid in a Synergistic Enantioselective Intramolecular Amination. Chem. Sci. 2022, 13, 1323–1334. [Google Scholar] [CrossRef]
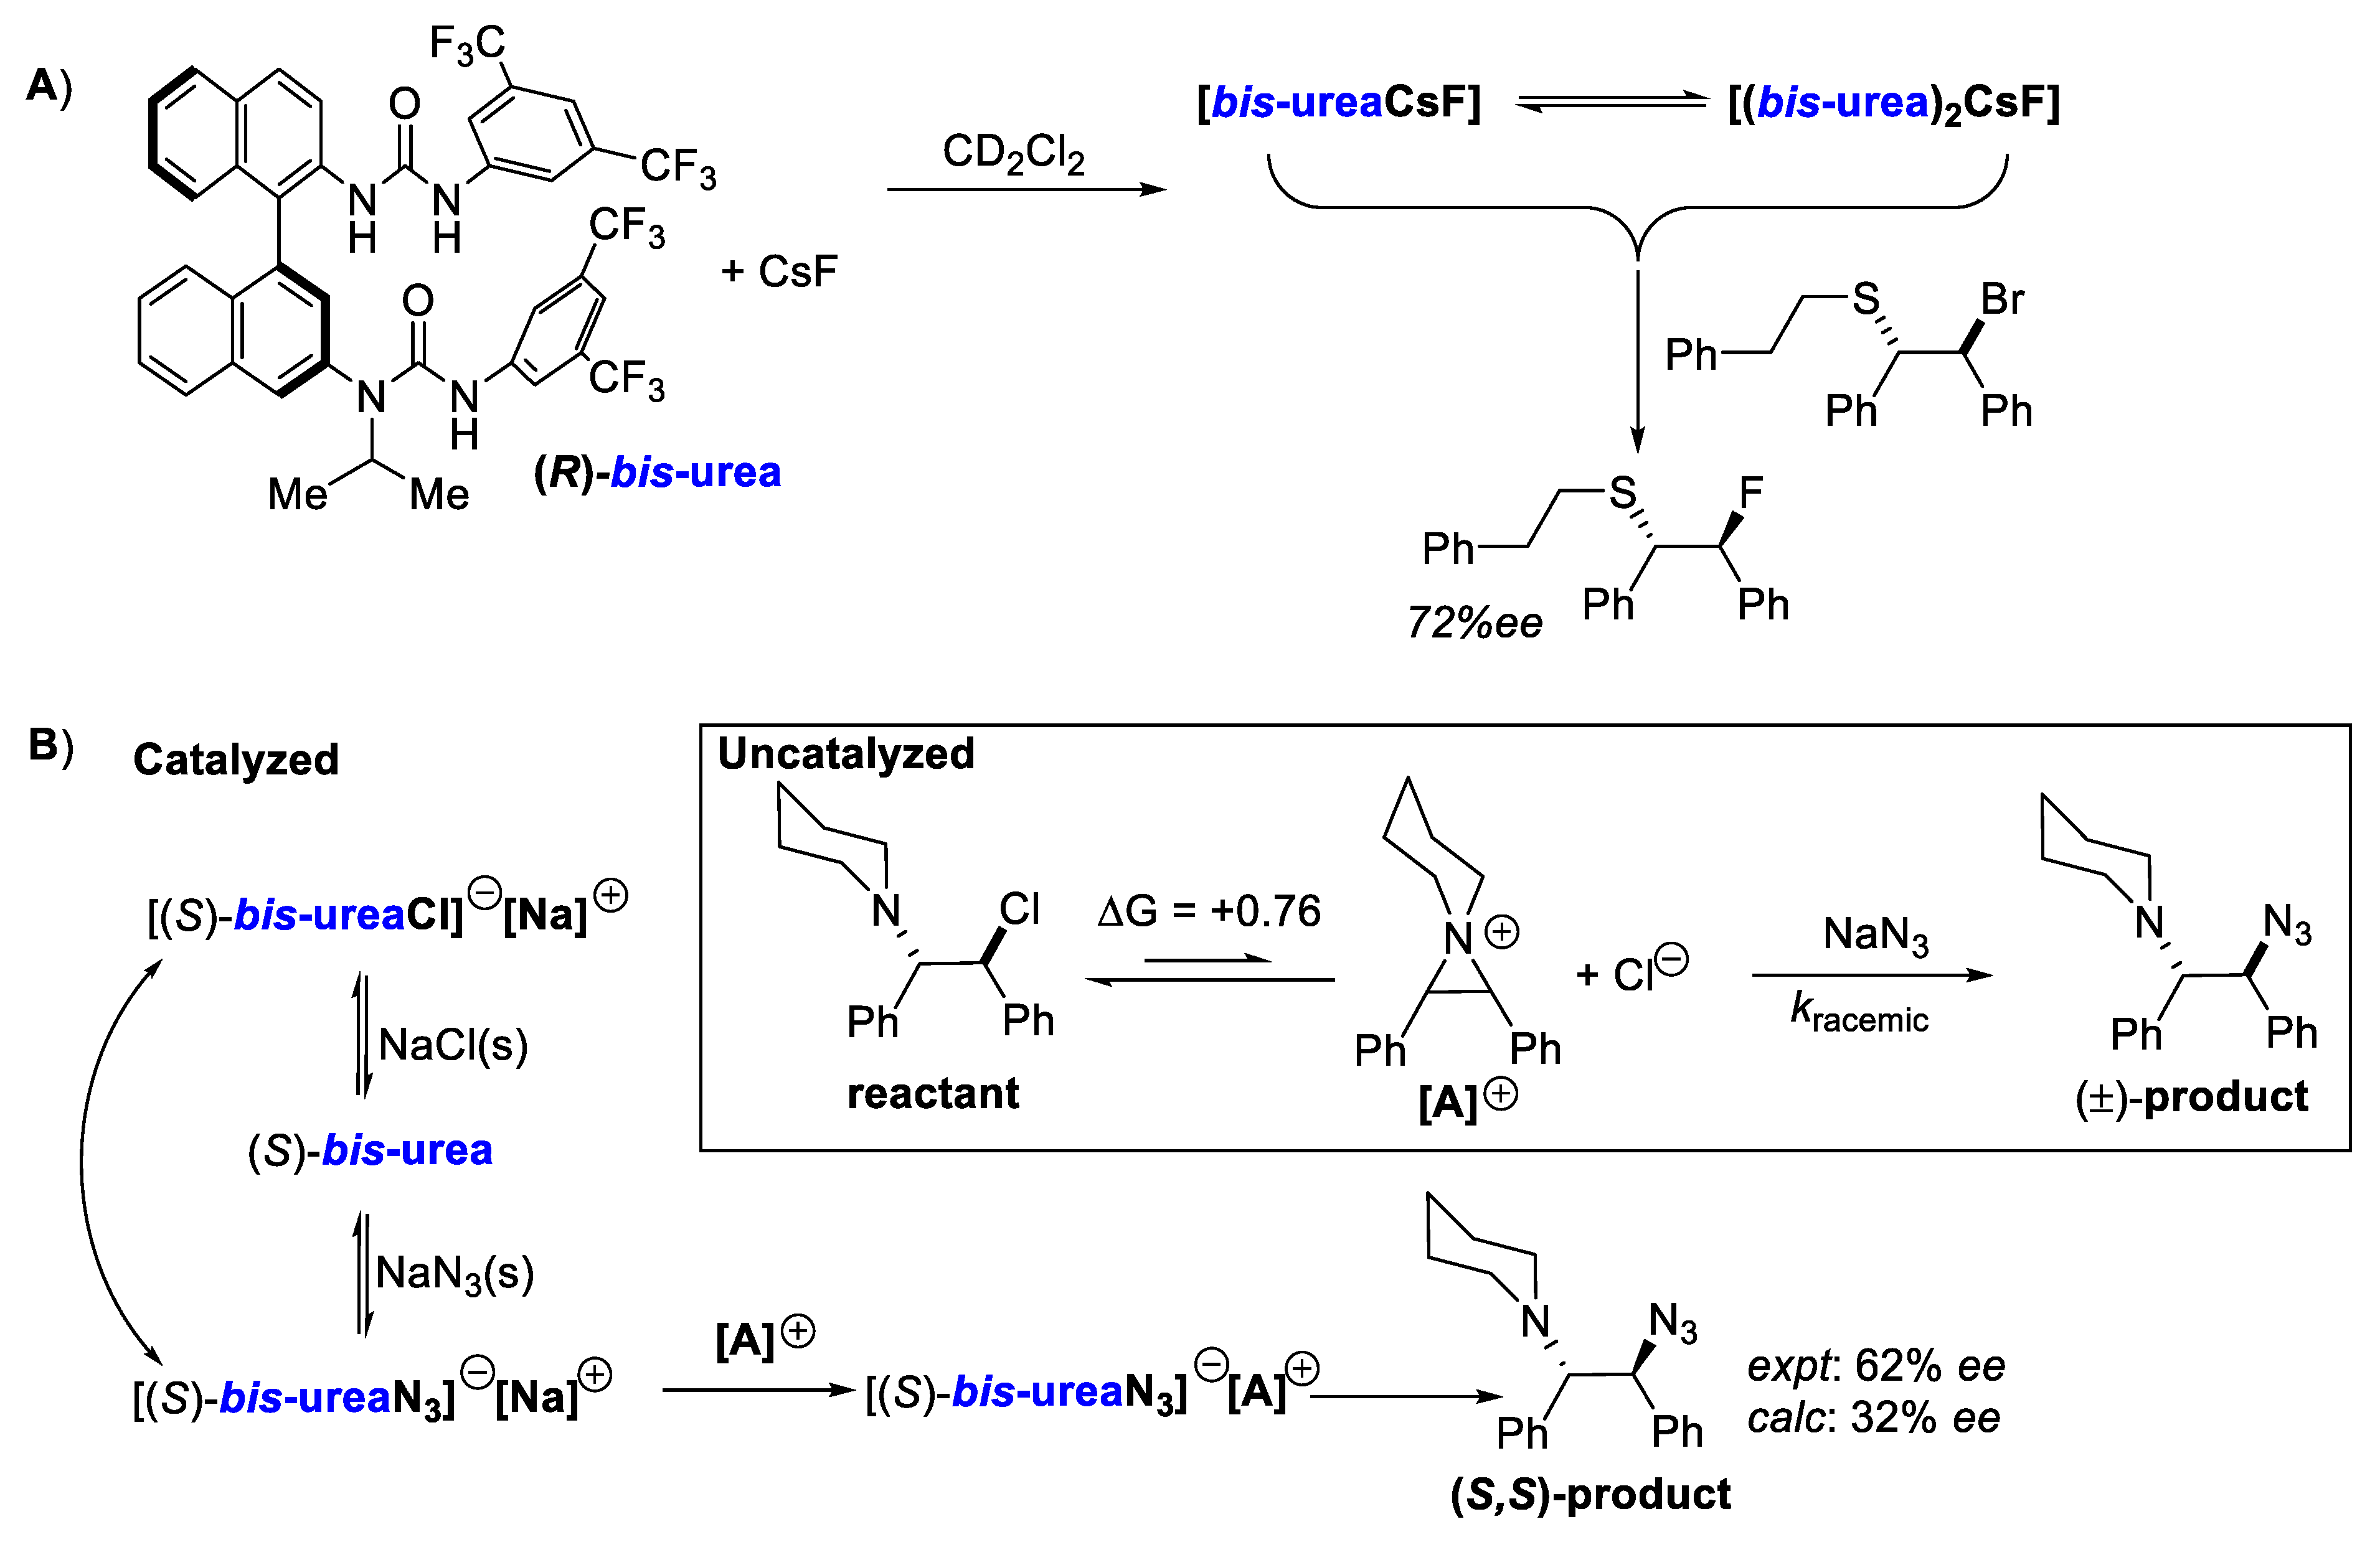
- Pupo, G.; Ibba, F.; Ascough, D.M.H.; Vicini, A.C.; Ricci, P.; Christensen, K.E.; Pfeifer, L.; Morphy, J.R.; Brown, J.M.; Paton, R.S.; et al. Asymmetric Nucleophilic Fluorination under Hydrogen Bonding Phase-Transfer Catalysis. Science 2018, 360, 638–642. [Google Scholar] [CrossRef] [PubMed]
- Zheng, H.; Sang, Y.; Houk, K.N.; Xue, X.S.; Cheng, J.P. Mechanism and Origins of Enantioselectivities in Spirobiindane-Based Hypervalent Iodine(III)-Induced Asymmetric Dearomatizing Spirolactonizations. J. Am. Chem. Soc. 2019, 141, 16046–16056. [Google Scholar] [CrossRef] [PubMed]
- Ermanis, K.; Colgan, A.C.; Proctor, R.S.J.; Hadrys, B.W.; Phipps, R.J.; Goodman, J.M. A Computational and Experimental Investigation of the Origin of Selectivity in the Chiral Phosphoric Acid Catalyzed Enantioselective Minisci Reaction. J. Am. Chem. Soc. 2020, 142, 21091–21101. [Google Scholar] [CrossRef]
- Kee, C.W.; Wong, M.W. Bicyclic Guanidine-Catalyzed Asymmetric Cycloaddition Reaction of Anthrones—Bifunctional Binding Modes and Origin of Stereoselectivity. J. Org. Chem. 2020, 85, 15139–15153. [Google Scholar] [CrossRef] [PubMed]
- Ren, J.; Ban, X.; Zhang, X.; Tan, S.M.; Lee, R.; Tan, C. Kinetic and Dynamic Kinetic Resolution of Racemic Tertiary Bromides by Pentanidium-Catalyzed Phase-Transfer Azidation. Angew. Chem. Int. Ed. 2020, 59, 9055–9058. [Google Scholar] [CrossRef]
- Laconsay, C.J.; Seguin, T.J.; Wheeler, S.E. Modulating Stereoselectivity through Electrostatic Interactions in a SPINOL-Phosphoric Acid-Catalyzed Synthesis of 2,3-Dihydroquinazolinones. ACS Catal. 2020, 10, 12292–12299. [Google Scholar] [CrossRef]
- Hamza, A.; Sorochkina, K.; Kótai, B.; Chernichenko, K.; Berta, D.; Bolte, M.; Nieger, M.; Repo, T.; Pápai, I. Origin of Stereoselectivity in FLP-Catalyzed Asymmetric Hydrogenation of Imines. ACS Catal. 2020, 10, 14290–14301. [Google Scholar] [CrossRef]
- Zhu, L.; Yang, H.; Wong, M.W. Asymmetric Nucleophilic Allylation of α-Chloro Glycinate via Squaramide Anion-Abstraction Catalysis: SN1 or SN2 Mechanism, or Both? J. Org. Chem. 2021, 86, 8414–8424. [Google Scholar] [CrossRef]
- Harden, I.; Neese, F.; Bistoni, G. An Induced-Fit Model for Asymmetric Organocatalytic Reactions: A Case Study of the Activation of Olefins via Chiral Brønsted Acid Catalysts. Chem. Sci. 2022, 13, 8848–8859. [Google Scholar] [CrossRef]
- Buttard, F.; Champagne, P.A. Binding Modes and Origins of Enantioselectivity in the Phase-Transfer-Catalyzed Conjugate Cyanation of β-Trifluoromethylated Chalcones. ACS Catal. 2022, 12, 8185–8194. [Google Scholar] [CrossRef]
- Xu, E.Y.; Werth, J.; Roos, C.B.; Bendelsmith, A.J.; Sigman, M.S.; Knowles, R.R. Noncovalent Stabilization of Radical Intermediates in the Enantioselective Hydroamination of Alkenes with Sulfonamides. J. Am. Chem. Soc. 2022, 144, 18948–18958. [Google Scholar] [CrossRef] [PubMed]
- Yepes, D.; Neese, F.; List, B.; Bistoni, G. Unveiling the Delicate Balance of Steric and Dispersion Interactions in Organocatalysis Using High-Level Computational Methods. J. Am. Chem. Soc. 2020, 142, 3613–3625. [Google Scholar] [CrossRef]
- Grimme, S.; Brandenburg, J.G.; Bannwarth, C.; Hansen, A. Consistent Structures and Interactions by Density Functional Theory with Small Atomic Orbital Basis Sets. J. Chem. Phys. 2015, 143, 054107. [Google Scholar] [CrossRef]
- Grimme, S.; Hansen, A.; Ehlert, S.; Mewes, J.M. R2SCAN-3c: A “Swiss Army Knife” Composite Electronic-Structure Method. J. Chem. Phys. 2021, 154, 064103. [Google Scholar] [CrossRef]
- Brandenburg, J.G.; Bannwarth, C.; Hansen, A.; Grimme, S. B97-3c: A Revised Low-Cost Variant of the B97-D Density Functional Method. J. Chem. Phys. 2018, 148, 064104. [Google Scholar] [CrossRef] [PubMed]
- Witte, J.; Neaton, J.B.; Head-Gordon, M. Effective Empirical Corrections for Basis Set Superposition Error in the Def2-SVPD Basis: GCP and DFT-C. J. Chem. Phys. 2017, 146, 234105. [Google Scholar] [CrossRef]
- Chung, L.W.; Sameera, W.M.C.; Ramozzi, R.; Page, A.J.; Hatanaka, M.; Petrova, G.P.; Harris, T.V.; Li, X.; Ke, Z.; Liu, F.; et al. The ONIOM Method and Its Applications. Chem. Rev. 2015, 115, 5678–5796. [Google Scholar] [CrossRef]
- Goerigk, L.; Hansen, A.; Bauer, C.; Ehrlich, S.; Najibi, A.; Grimme, S. A Look at the Density Functional Theory Zoo with the Advanced GMTKN55 Database for General Main Group Thermochemistry, Kinetics and Noncovalent Interactions. Phys. Chem. Chem. Phys. 2017, 19, 32184–32215. [Google Scholar] [CrossRef]
- Goerigk, L.; Mehta, N. A Trip to the Density Functional Theory Zoo: Warnings and Recommendations for the User. Aust. J. Chem. 2019, 72, 563. [Google Scholar] [CrossRef]
- Najibi, A.; Goerigk, L. The Nonlocal Kernel in van Der Waals Density Functionals as an Additive Correction: An Extensive Analysis with Special Emphasis on the B97M-V and Ωb97M-V Approaches. J. Chem. Theory Comput. 2018, 14, 5725–5738. [Google Scholar] [CrossRef]
- Mehta, N.; Casanova-Páez, M.; Goerigk, L. Semi-Empirical or Non-Empirical Double-Hybrid Density Functionals: Which Are More Robust? Phys. Chem. Chem. Phys. 2018, 20, 23175–23194. [Google Scholar] [CrossRef]
- Mardirossian, N.; Head-Gordon, M. Thirty Years of Density Functional Theory in Computational Chemistry: An Overview and Extensive Assessment of 200 Density Functionals. Mol. Phys. 2017, 115, 2315–2372. [Google Scholar] [CrossRef]
- Perdew, J.P. Jacob’s Ladder of Density Functional Approximations for the Exchange-Correlation Energy. In Proceedings of the AIP Conference Proceedings, Oxnard, CA, USA, 14 August 2001; AIP: College Park, MD, USA, 2001; Volume 577, pp. 1–20. [Google Scholar]
- Peverati, R.; Truhlar, D.G. Exchange-Correlation Functional with Good Accuracy for Both Structural and Energetic Properties While Depending Only on the Density and Its Gradient. J. Chem. Theory Comput. 2012, 8, 2310–2319. [Google Scholar] [CrossRef]
- Hao, P.; Sun, J.; Xiao, B.; Ruzsinszky, A.; Csonka, G.I.; Tao, J.; Glindmeyer, S.; Perdew, J.P. Performance of Meta-GGA Functionals on General Main Group Thermochemistry, Kinetics, and Noncovalent Interactions. J. Chem. Theory Comput. 2013, 9, 355–363. [Google Scholar] [CrossRef]
- Taylor, M.; Yu, H.; Ho, J. Predicting Solvent Effects on S N 2 Reaction Rates: Comparison of QM/MM, Implicit, and MM Explicit Solvent Models. J. Phys. Chem. B 2022, 126, 9047–9058. [Google Scholar] [CrossRef]
- Santra, G.; Sylvetsky, N.; Martin, J.M.L. Minimally Empirical Double-Hybrid Functionals Trained against the GMTKN55 Database: RevDSD-PBEP86-D4, RevDOD-PBE-D4, and DOD-SCAN-D4. J. Phys. Chem. A 2019, 123, 5129–5143. [Google Scholar] [CrossRef]
- Prasad, V.K.; Pei, Z.; Edelmann, S.; Otero-De-La-Roza, A.; Dilabio, G.A. BH9, a New Comprehensive Benchmark Data Set for Barrier Heights and Reaction Energies: Assessment of Density Functional Approximations and Basis Set Incompleteness Potentials. J. Chem. Theory Comput. 2022, 18, 151–166, Erratum in J. Chem. Theory Comput. 2022, 18, 4041–4044. [Google Scholar] [CrossRef]
- Santra, G.; Calinsky, R.; Martin, J.M.L. Benefits of Range-Separated Hybrid and Double-Hybrid Functionals for a Large and Diverse Data Set of Reaction Energies and Barrier Heights. J. Phys. Chem. A 2022, 126, 5492–5505. [Google Scholar] [CrossRef]
- Najibi, A.; Casanova-Páez, M.; Goerigk, L. Analysis of Recent BLYP- And PBE-Based Range-Separated Double-Hybrid Density Functional Approximations for Main-Group Thermochemistry, Kinetics, and Noncovalent Interactions. J. Phys. Chem. A 2021, 125, 4026–4035. [Google Scholar] [CrossRef] [PubMed]
- Santra, G.; Cho, M.; Martin, J.M.L. Exploring Avenues beyond Revised DSD Functionals: I. Range Separation, with XDSD as a Special Case. J. Phys. Chem. A 2021, 125, 4614–4627. [Google Scholar] [CrossRef]
- Santra, G.; Semidalas, E.; Martin, J.M.L. Exploring Avenues beyond Revised DSD Functionals: II. Random-Phase Approximation and Scaled MP3 Corrections. J. Phys. Chem. A 2021, 125, 4628–4638. [Google Scholar] [CrossRef]
- Mehta, N.; Martin, J.M.L. Explicitly Correlated Double-Hybrid DFT: A Comprehensive Analysis of the Basis Set Convergence on the GMTKN55 Database. J. Chem. Theory Comput. 2022, 18, 5978–5991. [Google Scholar] [CrossRef]
- Riplinger, C.; Neese, F. An Efficient and near Linear Scaling Pair Natural Orbital Based Local Coupled Cluster Method. J. Chem. Phys. 2013, 138, 034106. [Google Scholar] [CrossRef]
- Guo, Y.; Riplinger, C.; Becker, U.; Liakos, D.G.; Minenkov, Y.; Cavallo, L.; Neese, F. Communication: An Improved Linear Scaling Perturbative Triples Correction for the Domain Based Local Pair-Natural Orbital Based Singles and Doubles Coupled Cluster Method [DLPNO-CCSD(T)]. J. Chem. Phys. 2018, 148, 011101. [Google Scholar] [CrossRef]
- Nagy, P.R.; Kállay, M. Optimization of the Linear-Scaling Local Natural Orbital CCSD(T) Method: Redundancy-Free Triples Correction Using Laplace Transform. J. Chem. Phys. 2017, 146, 214106. [Google Scholar] [CrossRef]
- Nagy, P.R.; Samu, G.; Kállay, M. Optimization of the Linear-Scaling Local Natural Orbital CCSD(T) Method: Improved Algorithm and Benchmark Applications. J. Chem. Theory Comput. 2018, 14, 4193–4215. [Google Scholar] [CrossRef]
- Neese, F. Software Update: The ORCA Program System—Version 5.0. Wiley Interdiscip. Rev. Comput. Mol. Sci. 2022, 12, e1606. [Google Scholar] [CrossRef]
- Kállay, M.; Nagy, P.R.; Mester, D.; Rolik, Z.; Samu, G.; Csontos, J.; Csóka, J.; Szabó, P.B.; Gyevi-Nagy, L.; Hégely, B.; et al. The MRCC Program System: Accurate Quantum Chemistry from Water to Proteins. J. Chem. Phys. 2020, 152, 074107. [Google Scholar] [CrossRef]
- Riplinger, C.; Pinski, P.; Becker, U.; Valeev, E.F.; Neese, F. Sparse Maps—A Systematic Infrastructure for Reduced-Scaling Electronic Structure Methods. II. Linear Scaling Domain Based Pair Natural Orbital Coupled Cluster Theory. J. Chem. Phys. 2016, 144, 024109. [Google Scholar] [CrossRef]
- Liakos, D.G.; Sparta, M.; Kesharwani, M.K.; Martin, J.M.L.; Neese, F. Exploring the Accuracy Limits of Local Pair Natural Orbital Coupled-Cluster Theory. J. Chem. Theory Comput. 2015, 11, 1525–1539. [Google Scholar] [CrossRef]
- Seeger, Z.L.; Izgorodina, E.I. A DLPNO-CCSD(T) Benchmarking Study of Intermolecular Interactions of Ionic Liquids. J. Comput. Chem. 2022, 43, 106–120. [Google Scholar] [CrossRef]
- Al-Hamdani, Y.S.; Nagy, P.R.; Zen, A.; Barton, D.; Kállay, M.; Brandenburg, J.G.; Tkatchenko, A. Interactions between Large Molecules Pose a Puzzle for Reference Quantum Mechanical Methods. Nat. Commun. 2021, 12, 3927. [Google Scholar] [CrossRef]
- Carter-Fenk, K.; Lao, K.U.; Liu, K.Y.; Herbert, J.M. Accurate and Efficient Ab Initio Calculations for Supramolecular Complexes: Symmetry-Adapted Perturbation Theory with Many-Body Dispersion. J. Phys. Chem. Lett. 2019, 10, 2706–2714. [Google Scholar] [CrossRef]
- Patel, P.; Wilson, A.K. Domain-Based Local Pair Natural Orbital Methods within the Correlation Consistent Composite Approach. J. Comput. Chem. 2020, 41, 800–813. [Google Scholar] [CrossRef]
- Řezáč, J.; Šimová, L.; Hobza, P. CCSD[T] Describes Noncovalent Interactions Better than the CCSD(T), CCSD(TQ), and CCSDT Methods. J. Chem. Theory Comput. 2013, 9, 364–369. [Google Scholar] [CrossRef]
- Klein, R.A. Single Point Calculations Using Geometries Derived at a Lower Level of Theory: Caveats to Be Observed in Using Compound Levels of Theory or ‘Double-Barrelling’. Chem. Phys. Lett. 2006, 423, 413–416. [Google Scholar] [CrossRef]
- Chin, Y.P.; Krenske, E.H. Nazarov Cyclizations Catalyzed by BINOL Phosphoric Acid Derivatives: Quantum Chemistry Struggles to Predict the Enantioselectivity. J. Org. Chem. 2022, 87, 1710–1722. [Google Scholar] [CrossRef]
- Ribeiro, R.F.; Marenich, A.V.; Cramer, C.J.; Truhlar, D.G. Use of Solution-Phase Vibrational Frequencies in Continuum Models for the Free Energy of Solvation. J. Phys. Chem. B 2011, 115, 14556–14562. [Google Scholar] [CrossRef]
- Grimme, S. Supramolecular Binding Thermodynamics by Dispersion-Corrected Density Functional Theory. Chem.—A Eur. J. 2012, 18, 9955–9964. [Google Scholar] [CrossRef]
- Li, Y.P.; Gomes, J.; Sharada, S.M.; Bell, A.T.; Head-Gordon, M. Improved Force-Field Parameters for QM/MM Simulations of the Energies of Adsorption for Molecules in Zeolites and a Free Rotor Correction to the Rigid Rotor Harmonic Oscillator Model for Adsorption Enthalpies. J. Phys. Chem. C 2015, 119, 1840–1850. [Google Scholar] [CrossRef]
- Luchini, G.; Alegre-Requena, J.V.; Funes-Ardoiz, I.; Paton, R.S. GoodVibes: Automated Thermochemistry for Heterogeneous Computational Chemistry Data. F1000Research 2020, 9, 291. [Google Scholar] [CrossRef]
- Funes-Ardoiz, I.; Paton, R.S. GoodVibes: Version 2.0. Zenodo 2018, 3, 595246. [Google Scholar]
- Plata, R.E.; Singleton, D.A. A Case Study of the Mechanism of Alcohol-Mediated Morita Baylis-Hillman Reactions. The Importance of Experimental Observations. J. Am. Chem. Soc. 2015, 137, 3811–3826. [Google Scholar] [CrossRef]
- Leung, B.O.; Reid, D.L.; Armstrong, D.A.; Rauk, A. Entropies in Solution from Entropies in the Gas Phase. J. Phys. Chem. A 2004, 108, 2720–2725. [Google Scholar] [CrossRef]
- Dub, P.A.; Poli, R. A Computational Study of Solution Equilibria of Platinum-Based Ethylene Hydroamination Catalytic Species Including Solvation and Counterion Effects: Proper Treatment of the Free Energy of Solvation. J. Mol. Catal. A Chem. 2010, 324, 89–96. [Google Scholar] [CrossRef]
- McMullin, C.L.; Jover, J.; Harvey, J.N.; Fey, N. Accurate Modelling of Pd(0) + PhX Oxidative Addition Kinetics. Dalt. Trans. 2010, 39, 10833–10836. [Google Scholar] [CrossRef]
- Liu, Z.; Patel, C.; Harvey, J.N.; Sunoj, R.B. Mechanism and Reactivity in the Morita-Baylis-Hillman Reaction: The Challenge of Accurate Computations. Phys. Chem. Chem. Phys. 2017, 19, 30647–30657. [Google Scholar] [CrossRef]
- Besora, M.; Vidossich, P.; Lledós, A.; Ujaque, G.; Maseras, F. Calculation of Reaction Free Energies in Solution: A Comparison of Current Approaches. J. Phys. Chem. A 2018, 122, 1392–1399. [Google Scholar] [CrossRef]
- Strassfeld, D.A.; Algera, R.F.; Wickens, Z.K.; Jacobsen, E.N. A Case Study in Catalyst Generality: Simultaneous, Highly-Enantioselective Brønsted- And Lewis-Acid Mechanisms in Hydrogen-Bond-Donor Catalyzed Oxetane Openings. J. Am. Chem. Soc. 2021, 143, 9585–9594. [Google Scholar] [CrossRef]
- Pracht, P.; Bohle, F.; Grimme, S. Automated Exploration of the Low-Energy Chemical Space with Fast Quantum Chemical Methods. Phys. Chem. Chem. Phys. 2020, 22, 7169–7192. [Google Scholar] [CrossRef]
- Iribarren, I.; Trujillo, C. Efficiency and Suitability When Exploring the Conformational Space of Phase-Transfer Catalysts. J. Chem. Inf. Model. 2022, 62, 5568–5580. [Google Scholar] [CrossRef]
- Kee, C.W.; Wong, M.W. In Silico Design of Halogen-Bonding-Based Organocatalyst for Diels-Alder Reaction, Claisen Rearrangement, and Cope-Type Hydroamination. J. Org. Chem. 2016, 81, 7459–7470. [Google Scholar] [CrossRef]
- Bao, J.L.; Truhlar, D.G. Variational Transition State Theory: Theoretical Framework and Recent Developments. Chem. Soc. Rev. 2017, 46, 7548–7596. [Google Scholar] [CrossRef]
- Wigner, E. On the Quantum Correction For Thermodynamic Equilibrium. Phys. Rev. 1932, 40, 749. [Google Scholar] [CrossRef]
- Fernández-Ramos, A.; Miller, J.A.; Klippenstein, S.J.; Truhlar, D.G. Modeling the Kinetics of Bimolecular Reactions. Chem. Rev. 2006, 106, 4518–4584. [Google Scholar] [CrossRef]
- Anderson, T.; Kwan, E.E. Ekwan/PyQuiver: Kinetic Isotope Effect Prediction with Gaussian. Available online: https://github.com/ekwan/PyQuiver (accessed on 1 February 2023).
- Schreiner, P.R.; Reisenauer, H.P.; Ley, D.; Gerbig, D.; Wu, C.H.; Allen, W.D. Methylhydroxycarbene: Tunneling Control of a Chemical Reaction. Science 2011, 332, 1300–1303. [Google Scholar] [CrossRef]
- Schreiner, P.R. Tunneling Control of Chemical Reactions: The Third Reactivity Paradigm. J. Am. Chem. Soc. 2017, 139, 15276–15283. [Google Scholar] [CrossRef]
- Pu, J.; Gao, J.; Truhlar, D.G. Multidimensional Tunneling, Recrossing, and the Transmission Coefficient for Enzymatic Reactions. Chem. Rev. 2006, 106, 3140–3169. [Google Scholar] [CrossRef]
- Da Silva, P.L.; Guimarães, L.; Pliego, J.R. Revisiting the Mechanism of Neutral Hydrolysis of Esters: Water Autoionization Mechanisms with Acid or Base Initiation Pathways. J. Phys. Chem. B 2013, 117, 6487–6497. [Google Scholar] [CrossRef]
- Kozuch, S. A Refinement of Everyday Thinking: The Energetic Span Model for Kinetic Assessment of Catalytic Cycles. Wiley Interdiscip. Rev. Comput. Mol. Sci. 2012, 2, 795–815. [Google Scholar] [CrossRef]
- Sumiya, Y.; Maeda, S. Rate Constant Matrix Contraction Method for Systematic Analysis of Reaction Path Networks. Chem. Lett. 2020, 49, 553–564. [Google Scholar] [CrossRef]
- Garay-Ruiz, D.; Bo, C. Revisiting Catalytic Cycles: A Broader View through the Energy Span Model. ACS Catal. 2020, 10, 12627–12635. [Google Scholar] [CrossRef]
- Cho, B.; Tan, C.-H.; Wong, M.W. Origin of Asymmetric Induction in Bicyclic Guanidine-Catalyzed Thio-Michael Reaction: A Bifunctional Mode of Lewis Acid-Brønsted Acid Activation. J. Org. Chem. 2012, 77, 6553–6562. [Google Scholar] [CrossRef]
- Rackauckas, C.; Nie, Q. DifferentialEquations.Jl—A Performant and Feature-Rich Ecosystem for Solving Differential Equations in Julia. J. Open Res. Softw. 2017, 5, 15. [Google Scholar] [CrossRef]
- Bezanson, J.; Edelman, A.; Karpinski, S.; Shah, V.B. Julia: A Fresh Approach to Numerical Computing. SIAM Rev. 2017, 59, 65–98. [Google Scholar] [CrossRef]
- Wang, B.; Cao, Z. Hydration of Carbonyl Groups: The Labile H3O+ Ion as an Intermediate Modulated by the Surrounding Water Molecules. Angew. Chem.—Int. Ed. 2011, 50, 3266–3270. [Google Scholar] [CrossRef]
- Offei-Danso, A.; Hassanali, A.; Rodriguez, A. High-Dimensional Fluctuations in Liquid Water: Combining Chemical Intuition with Unsupervised Learning. J. Chem. Theory Comput. 2022, 18, 3136–3150. [Google Scholar] [CrossRef]
- Pliego, J.R.; Riveros, J.M. New Insights on Reaction Pathway Selectivity Promoted by Crown Ether Phase-Transfer Catalysis: Model Ab Initio Calculations of Nucleophilic Fluorination. J. Mol. Catal. A Chem. 2012, 363, 489–494. [Google Scholar] [CrossRef]
- Carvalho, N.F.; Pliego, J.R. Theoretical Design and Calculation of a Crown Ether Phase-Transfer-Catalyst Scaffold for Nucleophilic Fluorination Merging Two Catalytic Concepts. J. Org. Chem. 2016, 81, 8455–8463. [Google Scholar] [CrossRef]
- Sameera, W.M.C.; Maeda, S.; Morokuma, K. Computational Catalysis Using the Artificial Force Induced Reaction Method. Acc. Chem. Res. 2016, 49, 763–773. [Google Scholar] [CrossRef]
- Dewyer, A.L.; Argüelles, A.J.; Zimmerman, P.M. Methods for Exploring Reaction Space in Molecular Systems. Wiley Interdiscip. Rev. Comput. Mol. Sci. 2018, 8, e1354. [Google Scholar] [CrossRef]
- Simm, G.N.; Vaucher, A.C.; Reiher, M. Exploration of Reaction Pathways and Chemical Transformation Networks. J. Phys. Chem. A 2019, 123, 385–399. [Google Scholar] [CrossRef]
- Unsleber, J.P.; Reiher, M. The Exploration of Chemical Reaction Networks. Annu. Rev. Phys. Chem. 2020, 71, 121–142. [Google Scholar] [CrossRef]
- Miller, J.A.; Sivaramakrishnan, R.; Tao, Y.; Goldsmith, C.F.; Burke, M.P.; Jasper, A.W.; Hansen, N.; Labbe, N.J.; Glarborg, P.; Zádor, J. Combustion Chemistry in the Twenty-First Century: Developing Theory-Informed Chemical Kinetics Models. Prog. Energy Combust. Sci. 2021, 83, 100886. [Google Scholar] [CrossRef]
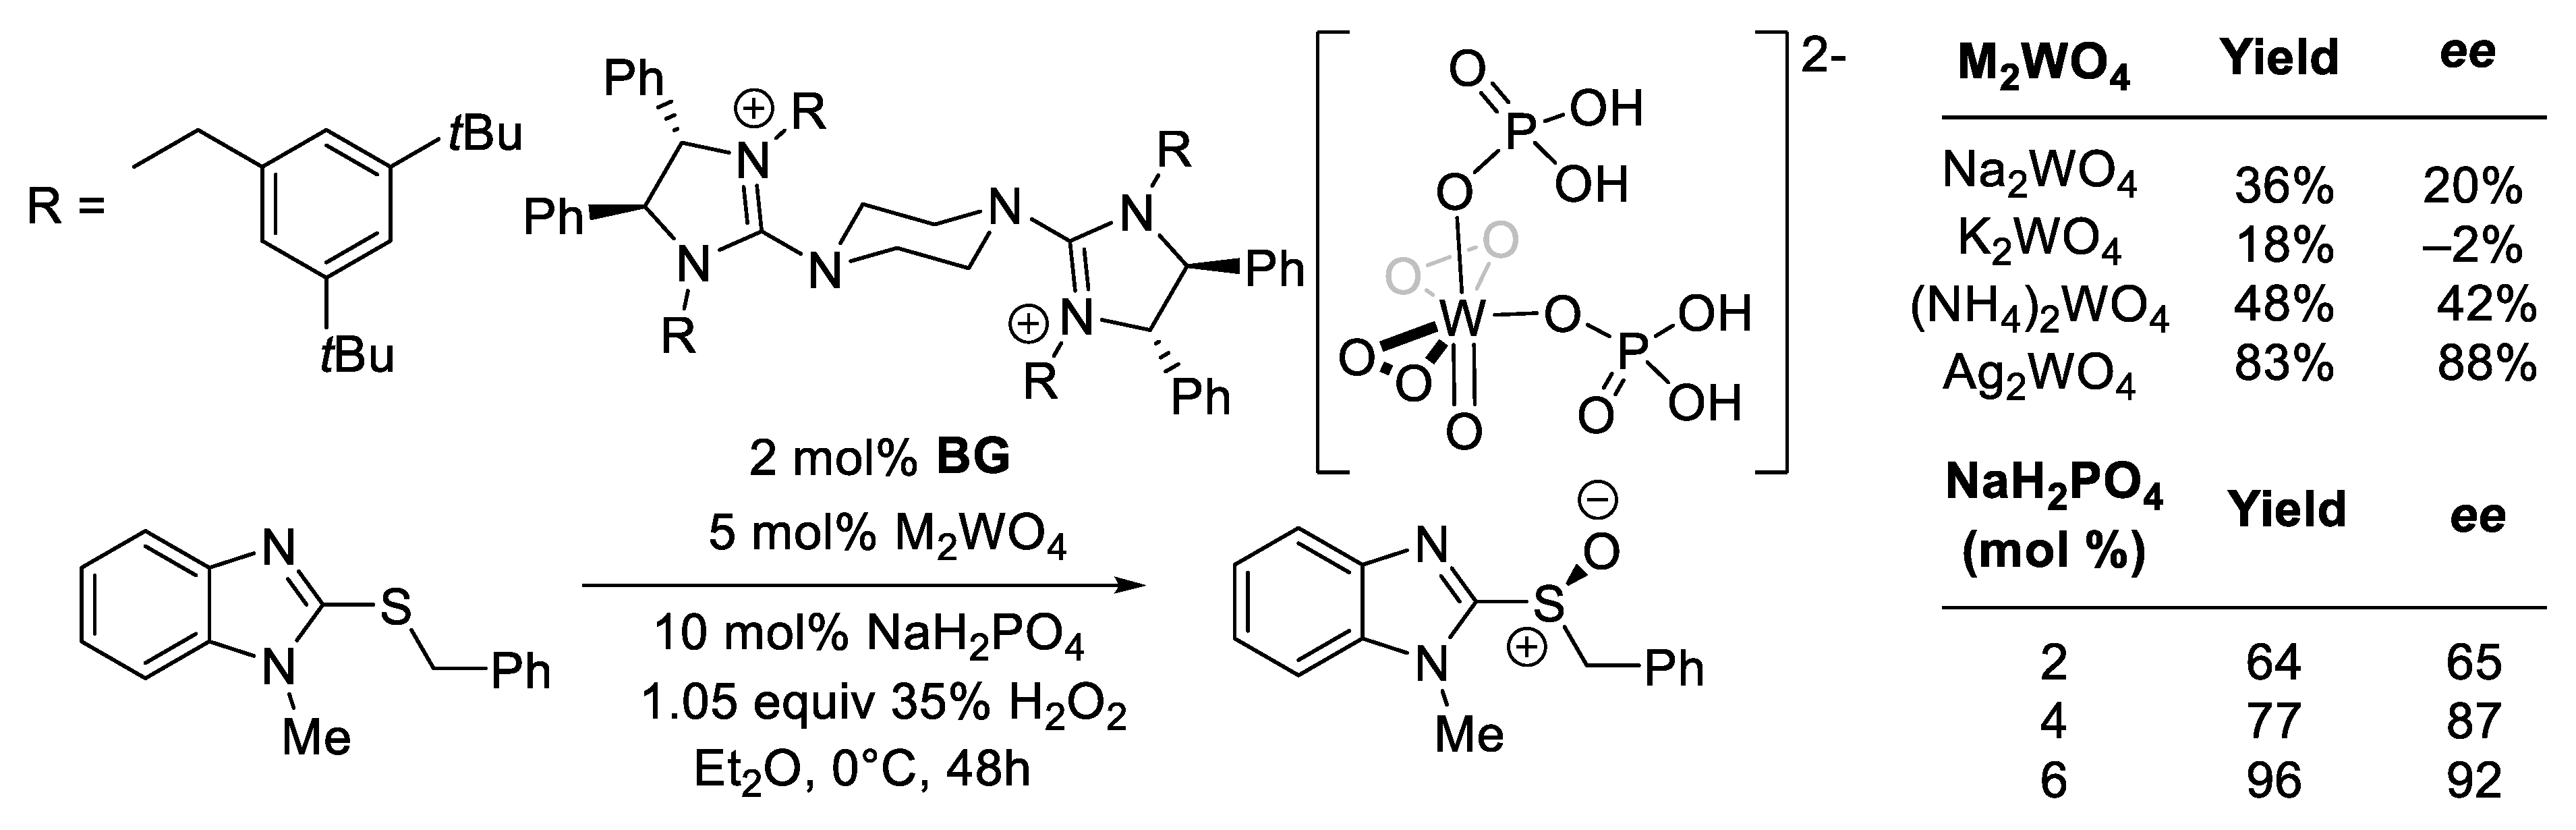
- Ye, X.; Moeljadi, A.M.P.; Chin, K.F.; Hirao, H.; Zong, L.; Tan, C.H. Enantioselective Sulfoxidation Catalyzed by a Bisguanidinium Diphosphatobisperoxotungstate Ion Pair. Angew. Chem.—Int. Ed. 2016, 55, 7101–7105. [Google Scholar] [CrossRef]
- Ibba, F.; Pupo, G.; Thompson, A.L.; Brown, J.M.; Claridge, T.D.W.; Gouverneur, V. Impact of Multiple Hydrogen Bonds with Fluoride on Catalysis: Insight from NMR Spectroscopy. J. Am. Chem. Soc. 2020, 142, jacs.0c09832. [Google Scholar] [CrossRef]
- Wang, J.; Horwitz, M.A.; Dürr, A.B.; Ibba, F.; Pupo, G.; Gao, Y.; Ricci, P.; Christensen, K.E.; Pathak, T.P.; Claridge, T.D.W.; et al. Asymmetric Azidation under Hydrogen Bonding Phase-Transfer Catalysis: A Combined Experimental and Computational Study. J. Am. Chem. Soc. 2022, 144, 4572–4584. [Google Scholar] [CrossRef]
- Bryliakov, K.P. Dynamic Nonlinear Effects in Asymmetric Catalysis. ACS Catal. 2019, 9, 5418–5438. [Google Scholar] [CrossRef]
- Mayer, L.C.; Heitsch, S.; Trapp, O. Nonlinear Effects in Asymmetric Catalysis by Design: Concept, Synthesis, and Applications. Acc. Chem. Res. 2022, 55, 3345–3361. [Google Scholar] [CrossRef]
- Kalek, M.; Fu, G.C. Caution in the Use of Nonlinear Effects as a Mechanistic Tool for Catalytic Enantioconvergent Reactions: Intrinsic Negative Nonlinear Effects in the Absence of Higher-Order Species. J. Am. Chem. Soc. 2017, 139, 4225–4229. [Google Scholar] [CrossRef]
- Geiger, Y.; Achard, T.; Maisse-François, A.; Bellemin-Laponnaz, S. Absence of Non-Linear Effects Despite Evidence for Catalyst Aggregation. Eur. J. Org. Chem. 2021, 2021, 2916–2922. [Google Scholar] [CrossRef]
- Satyanarayana, T.; Abraham, S.; Kagan, H.B. Nonlinear Effects in Asymmetric Catalysis. Angew. Chem.—Int. Ed. 2009, 48, 456–494. [Google Scholar] [CrossRef]
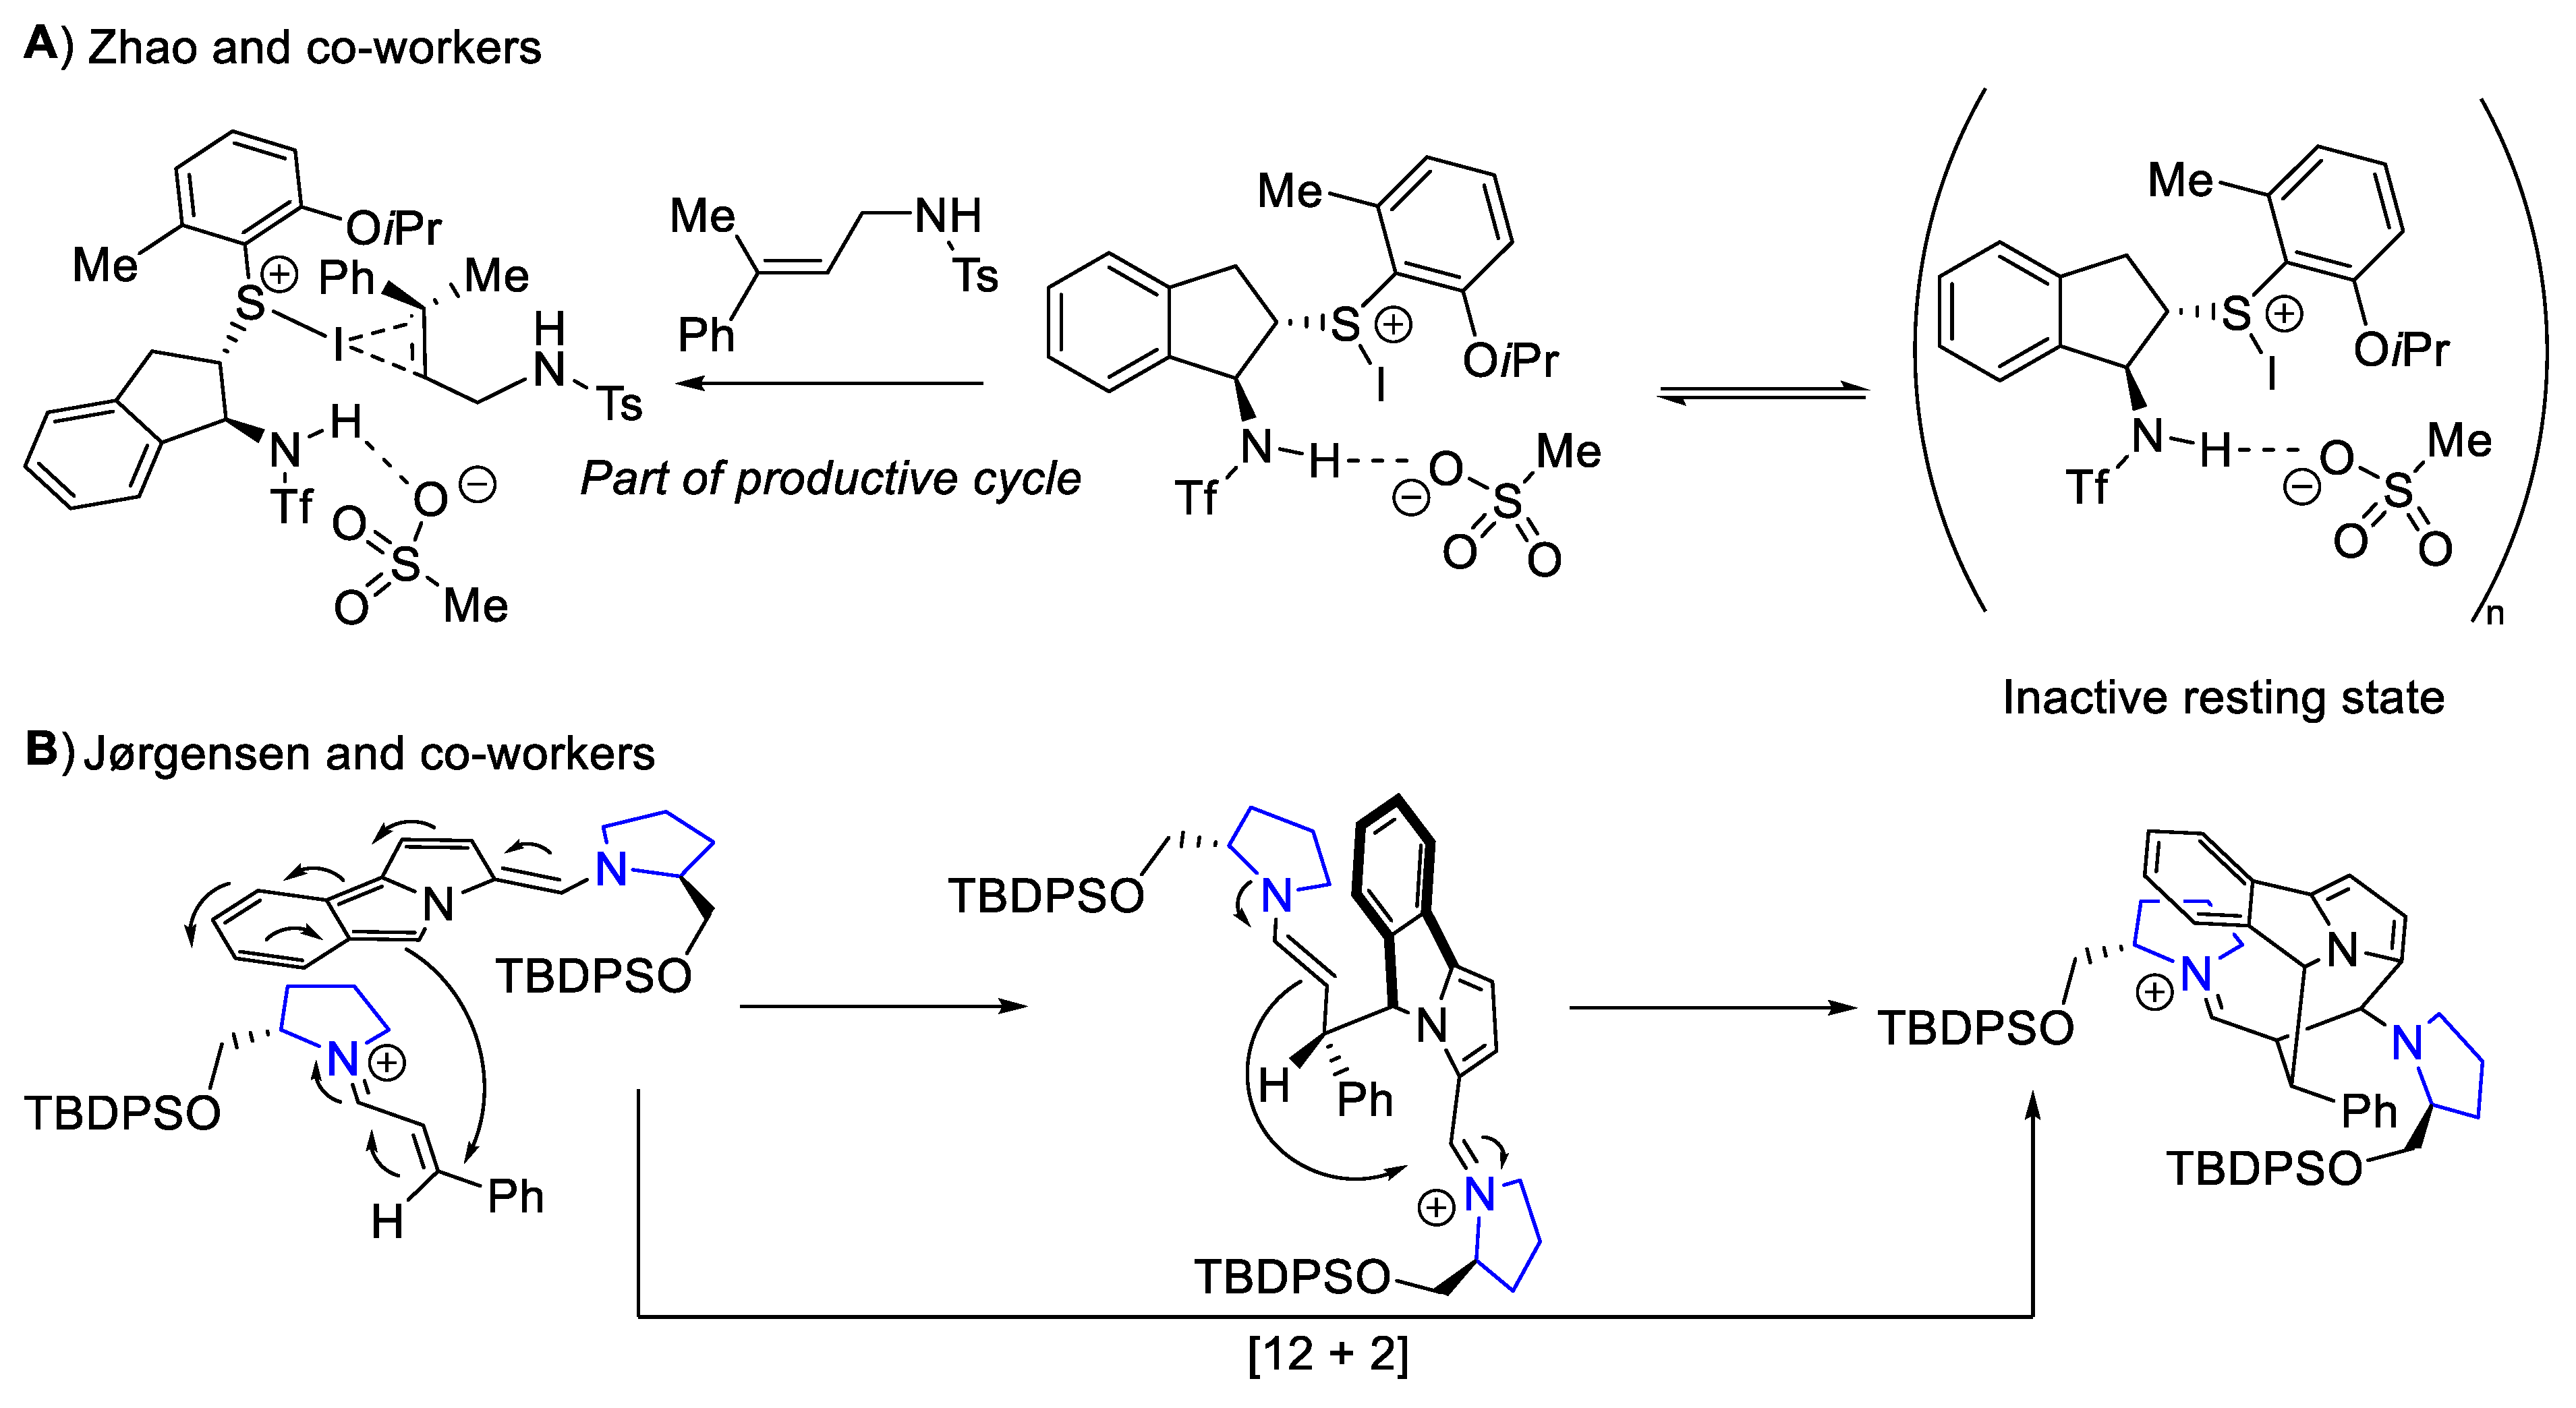
- Liao, L.; Xu, X.; Ji, J.; Zhao, X. Asymmetric Intermolecular Iodinative Difunctionalization of Allylic Sulfonamides Enabled by Organosulfide Catalysis: Modular Entry to Iodinated Chiral Molecules. J. Am. Chem. Soc. 2022, 144, 16490–16501. [Google Scholar] [CrossRef]
- Guo, W.; Wang, M.; Han, Z.; Huang, H.; Sun, J. Organocatalytic Asymmetric Synthesis of α-Amino Esters from Sulfoxonium Ylides. Chem. Sci. 2021, 12, 11191–11196. [Google Scholar] [CrossRef]
- Jessen, N.I.; Bertuzzi, G.; Bura, M.; Skipper, M.L.; Jørgensen, K.A. Enantioselective Construction of the Cycl[3.2.2]Azine Core via Organocatalytic [12 + 2] Cycloadditions. J. Am. Chem. Soc. 2021, 143, 6140–6151. [Google Scholar] [CrossRef]
- Ali, C.; Blackmond, D.G.; Burés, J. Kinetic Rationalization of Nonlinear Effects in Asymmetric Catalytic Cascade Reactions under Curtin-Hammett Conditions. ACS Catal. 2022, 16, 5776–5785. [Google Scholar] [CrossRef]
- Hase, W.L.; Song, K.; Gordon, M.S. Direct Dynamics Simulations. Comput. Sci. Eng. 2003, 5, 36–44. [Google Scholar] [CrossRef]
- Ess, D.H.; Wheeler, S.E.; Iafe, R.G.; Xu, L.; Çelebi-Ölçüm, N.; Houk, K.N. Bifurcations on Potential Energy Surfaces of Organic Reactions. Angew. Chem.—Int. Ed. 2008, 47, 7592–7601. [Google Scholar] [CrossRef]
- Hare, S.R.; Tantillo, D.J. Post-Transition State Bifurcations Gain Momentum-Current State of the Field. Pure Appl. Chem. 2017, 89, 679–698. [Google Scholar] [CrossRef]
- Carpenter, B.K. Energy Disposition in Reactive Intermediates. Chem. Rev. 2013, 113, 7265–7286. [Google Scholar] [CrossRef]
- Collins, P.; Carpenter, B.K.; Ezra, G.S.; Wiggins, S. Nonstatistical Dynamics on Potentials Exhibiting Reaction Path Bifurcations and Valley-Ridge Inflection Points. J. Chem. Phys. 2013, 139, 154108. [Google Scholar] [CrossRef]
- Sun, L.; Song, K.; Hase, W.L. A SN2 Reaction That Avoids Its Deep Potential Energy Minimum. Science 2002, 296, 875–878. [Google Scholar] [CrossRef]
- Proenza, Y.G.; de Souza, M.A.F.; Longo, R.L. Dynamical Bifurcation in Gas-Phase XH−+ CH3Y SN2 Reactions: The Role of Energy Flow and Redistribution in Avoiding the Minimum Energy Path. Chem.—A Eur. J. 2016, 22, 16220–16229. [Google Scholar] [CrossRef]
- Roytman, V.A.; Jin, S.; Nguyen, V.T.; Nguyen, V.D.; Haug, G.C.; Larionov, O.V.; Singleton, D.A. Bond Memory in Dynamically Determined Stereoselectivity. J. Am. Chem. Soc. 2020, 142, 85–88. [Google Scholar] [CrossRef]
- Lee, S.; Goodman, J.M. Rapid Route-Finding for Bifurcating Organic Reactions. J. Am. Chem. Soc. 2020, 142, 9210–9219. [Google Scholar] [CrossRef]
- Bharadwaz, P.; Maldonado-Domínguez, M.; Srnec, M. Bifurcating Reactions: Distribution of Products from Energy Distribution in a Shared Reactive Mode. Chem. Sci. 2021, 12, 12682–12694. [Google Scholar] [CrossRef]
- Peterson, T.H.; Carpenter, B.K. Estimation of Dynamic Effects on Product Ratios by Vectorial Decomposition of a Reaction Coordinate. Application to Thermal Nitrogen Loss from Bicyclic Azo Compounds. J. Am. Chem. Soc. 1992, 114, 766–767. [Google Scholar] [CrossRef]
- Yang, Z.; Dong, X.; Yu, Y.; Yu, P.; Li, Y.; Jamieson, C.; Houk, K.N. Relationships between Product Ratios in Ambimodal Pericyclic Reactions and Bond Lengths in Transition Structures. J. Am. Chem. Soc. 2018, 140, 3061–3067. [Google Scholar] [CrossRef]
- Samanta, D.; Rana, A.; Schmittel, M. Quantification of Nonstatistical Dynamics in an Intramolecular Diels-Alder Cyclization without Trajectory Computation. J. Org. Chem. 2014, 79, 2368–2376. [Google Scholar] [CrossRef]
- Ang, S.J.; Wang, W.; Schwalbe-Koda, D.; Axelrod, S.; Gómez-Bombarelli, R. Active Learning Accelerates Ab Initio Molecular Dynamics on Reactive Energy Surfaces. Chem 2021, 7, 738–751. [Google Scholar] [CrossRef]
- Maldonado, A.M.; Basdogan, Y.; Berryman, J.T.; Rempe, S.B.; Keith, J.A. First-Principles Modeling of Chemistry in Mixed Solvents: Where to Go from Here? J. Chem. Phys. 2020, 152, 130902. [Google Scholar] [CrossRef]
- Norjmaa, G.; Ujaque, G.; Lledós, A. Beyond Continuum Solvent Models in Computational Homogeneous Catalysis. Top. Catal. 2022, 65, 118–140. [Google Scholar] [CrossRef]
- Das, M.; Gogoi, A.R.; Sunoj, R.B. Molecular Insights on Solvent Effects in Organic Reactions as Obtained through Computational Chemistry Tools. J. Org. Chem. 2022, 87, 1630–1640. [Google Scholar] [CrossRef]
- Burrows, C.J.; Harper, J.B.; Sander, W.; Tantillo, D.J. Solvation Effects in Organic Chemistry. J. Org. Chem. 2022, 87, 1599–1601. [Google Scholar] [CrossRef]
- Ma, T.; Fu, X.; Kee, C.W.; Zong, L.; Pan, Y.; Huang, K.W.; Tan, C.H. Pentanidium-Catalyzed Enantioselective Phase-Transfer Conjugate Addition Reactions. J. Am. Chem. Soc. 2011, 133, 2828–2831. [Google Scholar] [CrossRef]
- Tomasi, J.; Mennucci, B.; Cammi, R. Quantum Mechanical Continuum Solvation Models. Chem. Rev. 2005, 105, 2999–3093. [Google Scholar] [CrossRef]
- Ho, J.; Klamt, A.; Coote, M.L. Comment on the Correct Use of Continuum Solvent Models. J. Phys. Chem. A 2010, 114, 13442–13444. [Google Scholar] [CrossRef]
- Marenich, A.V.; Cramer, C.J.; Truhlar, D.G. Universal Solvation Model Based on Solute Electron Density and on a Continuum Model of the Solvent Defined by the Bulk Dielectric Constant and Atomic Surface Tensions. J. Phys. Chem. B 2009, 113, 6378–6396. [Google Scholar] [CrossRef]
- Klamt, A.; Mennucci, B.; Tomasi, J.; Barone, V.; Curutchet, C.; Orozco, M.; Luque, F.J. On the Performance of Continuum Solvation Methods. A Comment on “Universal Approaches to Solvation Modeling”. Acc. Chem. Res. 2009, 42, 489–492. [Google Scholar] [CrossRef]
- Xu, L.; Coote, M.L. Methods to Improve the Calculations of Solvation Model Density Solvation Free Energies and Associated Aqueous p Ka Values: Comparison between Choosing an Optimal Theoretical Level, Solute Cavity Scaling, and Using Explicit Solvent Molecules. J. Phys. Chem. A 2019, 123, 7430–7438. [Google Scholar] [CrossRef]
- Hénin, J.; Lelièvre, T.; Shirts, M.R.; Valsson, O.; Delemotte, L. Enhanced Sampling Methods for Molecular Dynamics Simulations. arXiv 2022, arXiv:2202.04164. [Google Scholar] [CrossRef]
- Tawa, G.J.; Martin, R.L.; Pratt, L.R.; Russo, T.V. Solvation Free Energy Calculations Using a Continuum Dielectric Model for the Solvent and Gradient-Corrected Density Functional Theory for the Solute. J. Phys. Chem. 1996, 100, 1515–1523. [Google Scholar] [CrossRef]
- Pliego, J.R.; Riveros, J.M. The Cluster-Continuum Model for the Calculation of the Solvation Free Energy of Ionic Species. J. Phys. Chem. A 2001, 105, 7241–7247. [Google Scholar] [CrossRef]
- Tawa, G.J.; Topol, I.A.; Burt, S.K.; Caldwell, R.A.; Rashin, A.A. Calculation of the Aqueous Solvation Free Energy of the Proton. J. Chem. Phys. 1998, 109, 4852. [Google Scholar] [CrossRef]
- Bryantsev, V.S.; Diallo, M.S.; Goddard, W.A. Calculation of Solvation Free Energies of Charged Solutes Using Mixed Cluster/Continuum Models. J. Phys. Chem. B 2008, 112, 9709–9719. [Google Scholar] [CrossRef]
- Wu, W.; Kieffer, J. New Hybrid Method for the Calculation of the Solvation Free Energy of Small Molecules in Aqueous Solutions. J. Chem. Theory Comput. 2019, 15, 371–381. [Google Scholar] [CrossRef]
- Spicher, S.; Plett, C.; Pracht, P.; Hansen, A.; Grimme, S. Automated Molecular Cluster Growing for Explicit Solvation by Efficient Force Field and Tight Binding Methods. J. Chem. Theory Comput. 2022, 18, 3189. [Google Scholar] [CrossRef]
- Zhang, J.; Dolg, M. ABCluster: The Artificial Bee Colony Algorithm for Cluster Global Optimization. Phys. Chem. Chem. Phys. 2015, 17, 24173–24181. [Google Scholar] [CrossRef]
- Basdogan, Y.; Keith, J.A. A Paramedic Treatment for Modeling Explicitly Solvated Chemical Reaction Mechanisms. Chem. Sci. 2018, 9, 5341–5346. [Google Scholar] [CrossRef]
- Gunaydin, H.; Houk, K.N. Molecular Dynamics Prediction of the Mechanism of Ester Hydrolysis in Water. J. Am. Chem. Soc. 2008, 130, 15232–15233. [Google Scholar] [CrossRef]
- Ali, H.S.; Higham, J.; De Visser, S.P.; Henchman, R.H. Comparison of Free-Energy Methods to Calculate the Barriers for the Nucleophilic Substitution of Alkyl Halides by Hydroxide. J. Phys. Chem. B 2020, 124, 6835–6842. [Google Scholar] [CrossRef]
- Klamt, A.; Eckert, F.; Arlt, W. COSMO-RS: An Alternative to Simulation for Calculating Thermodynamic Properties of Liquid Mixtures. Annu. Rev. Chem. Biomol. Eng. 2010, 1, 101–122. [Google Scholar] [CrossRef]
- Nishihara, S.; Otani, M. Hybrid Solvation Models for Bulk, Interface, and Membrane: Reference Interaction Site Methods Coupled with Density Functional Theory. Phys. Rev. B 2017, 96, 115429. [Google Scholar] [CrossRef]
- Maldonado, A.M.; Hagiwara, S.; Choi, T.H.; Eckert, F.; Schwarz, K.; Sundararaman, R.; Otani, M.; Keith, J.A. Quantifying Uncertainties in Solvation Procedures for Modeling Aqueous Phase Reaction Mechanisms. J. Phys. Chem. A 2021, 125, 154–164. [Google Scholar] [CrossRef]
- Kee, C.W.; Wong, M.W. Pentanidium-Catalyzed Asymmetric Phase-Transfer Conjugate Addition: Prediction of Stereoselectivity via DFT Calculations and Docking Sampling of Transition States, and Origin of Stereoselectivity. Aust. J. Chem. 2016, 69, 983. [Google Scholar] [CrossRef]
- Chief Elk, J.; Benjamin, I. β-Cyclodextrin at the Water/1-Bromobutane Interface: Molecular Insight into Reverse Phase Transfer Catalysis. Langmuir 2015, 31, 5086–5092. [Google Scholar] [CrossRef]
- Karnes, J.J.; Benjamin, I. Structure and Dynamics of Host/Guest Complexation at the Liquid/Liquid Interface: Implications for Inverse Phase Transfer Catalysis. J. Phys. Chem. C 2017, 121, 4999–5011. [Google Scholar] [CrossRef]
- Karnes, J.J.; Benjamin, I. SN2 Reaction Rate Enhancement by β-Cyclodextrin at the Liquid/Liquid Interface. J. Phys. Chem. C 2017, 121, 19209–19217. [Google Scholar] [CrossRef]
- Uyeda, C.; Jacobsen, E.N. Transition-State Charge Stabilization through Multiple Non-Covalent Interactions in the Guanidinium-Catalyzed Enantioselective Claisen Rearrangement. J. Am. Chem. Soc. 2011, 133, 5062–5075. [Google Scholar] [CrossRef]
- Xue, H.; Jiang, D.; Jiang, H.; Kee, C.W.; Hirao, H.; Nishimura, T.; Wong, M.W.; Tan, C.H. Mechanistic Insights into Bicyclic Guanidine-Catalyzed Reactions from Microscopic and Macroscopic Perspectives. J. Org. Chem. 2015, 80, 5745–5752. [Google Scholar] [CrossRef]
- Zotova, N.; Franzke, A.; Armstrong, A.; Blackmond, D.G. Clarification of the Role of Water in Proline-Mediated Aldol Reactions. J. Am. Chem. Soc. 2007, 129, 15100–15101. [Google Scholar] [CrossRef]
- Zotova, N.; Broadbelt, L.J.; Armstrong, A.; Blackmond, D.G. Kinetic and Mechanistic Studies of Proline-Mediated Direct Intermolecular Aldol Reactions. Bioorg. Med. Chem. Lett. 2009, 19, 3934–3937. [Google Scholar] [CrossRef]
- Orlandi, M.; Ceotto, M.; Benaglia, M. Kinetics versus Thermodynamics in the Proline Catalyzed Aldol Reaction. Chem. Sci. 2016, 7, 5421–5427. [Google Scholar] [CrossRef]
- Zuend, S.J.; Jacobsen, E.N. Mechanism of Amido-Thiourea Catalyzed Enantioselective Imine Hydrocyanation: Transition State Stabilization via Multiple Non-Covalent Interactions. J. Am. Chem. Soc. 2009, 131, 15358–15374. [Google Scholar] [CrossRef]
- Meyer, M.P. New Applications of Isotope Effects in the Determination of Organic Reaction Mechanisms. In Advances in Physical Organic Chemistry; Academic Press: Cambridge, MA, USA, 2012; Volume 46, pp. 57–120. ISBN 9780123984845. [Google Scholar]
- Dale, H.J.A.; Leach, A.G.; Lloyd-Jones, G.C. Heavy-Atom Kinetic Isotope Effects: Primary Interest or Zero Point? J. Am. Chem. Soc. 2021, 143, 21079–21099. [Google Scholar] [CrossRef]
- Zhu, H.; Clemente, F.R.; Houk, K.N.; Meyer, M.P. Rate Limiting Step Precedes C-C Bond Formation in the Archetypical Proline-Catalyzed Intramolecular Aldol Reaction. J. Am. Chem. Soc. 2009, 131, 1632–1633. [Google Scholar] [CrossRef]
- Kwan, E.E.; Park, Y.; Besser, H.A.; Anderson, T.L.; Jacobsen, E.N. Sensitive and Accurate 13c Kinetic Isotope Effect Measurements Enabled by Polarization Transfer. J. Am. Chem. Soc. 2017, 139, 43–46. [Google Scholar] [CrossRef]
- Park, Y.; Harper, K.C.; Kuhl, N.; Kwan, E.E.; Liu, R.Y.; Jacobsen, E.N. Macrocyclic Bis-Thioureas Catalyze Stereospecific Glycosylation Reactions. Science 2017, 355, 162–166. [Google Scholar] [CrossRef]
- Bigeleisen, J.; Mayer, M.G. Calculation of Equilibrium Constants for Isotopic Exchange Reactions. J. Chem. Phys. 1947, 15, 261–267. [Google Scholar] [CrossRef]
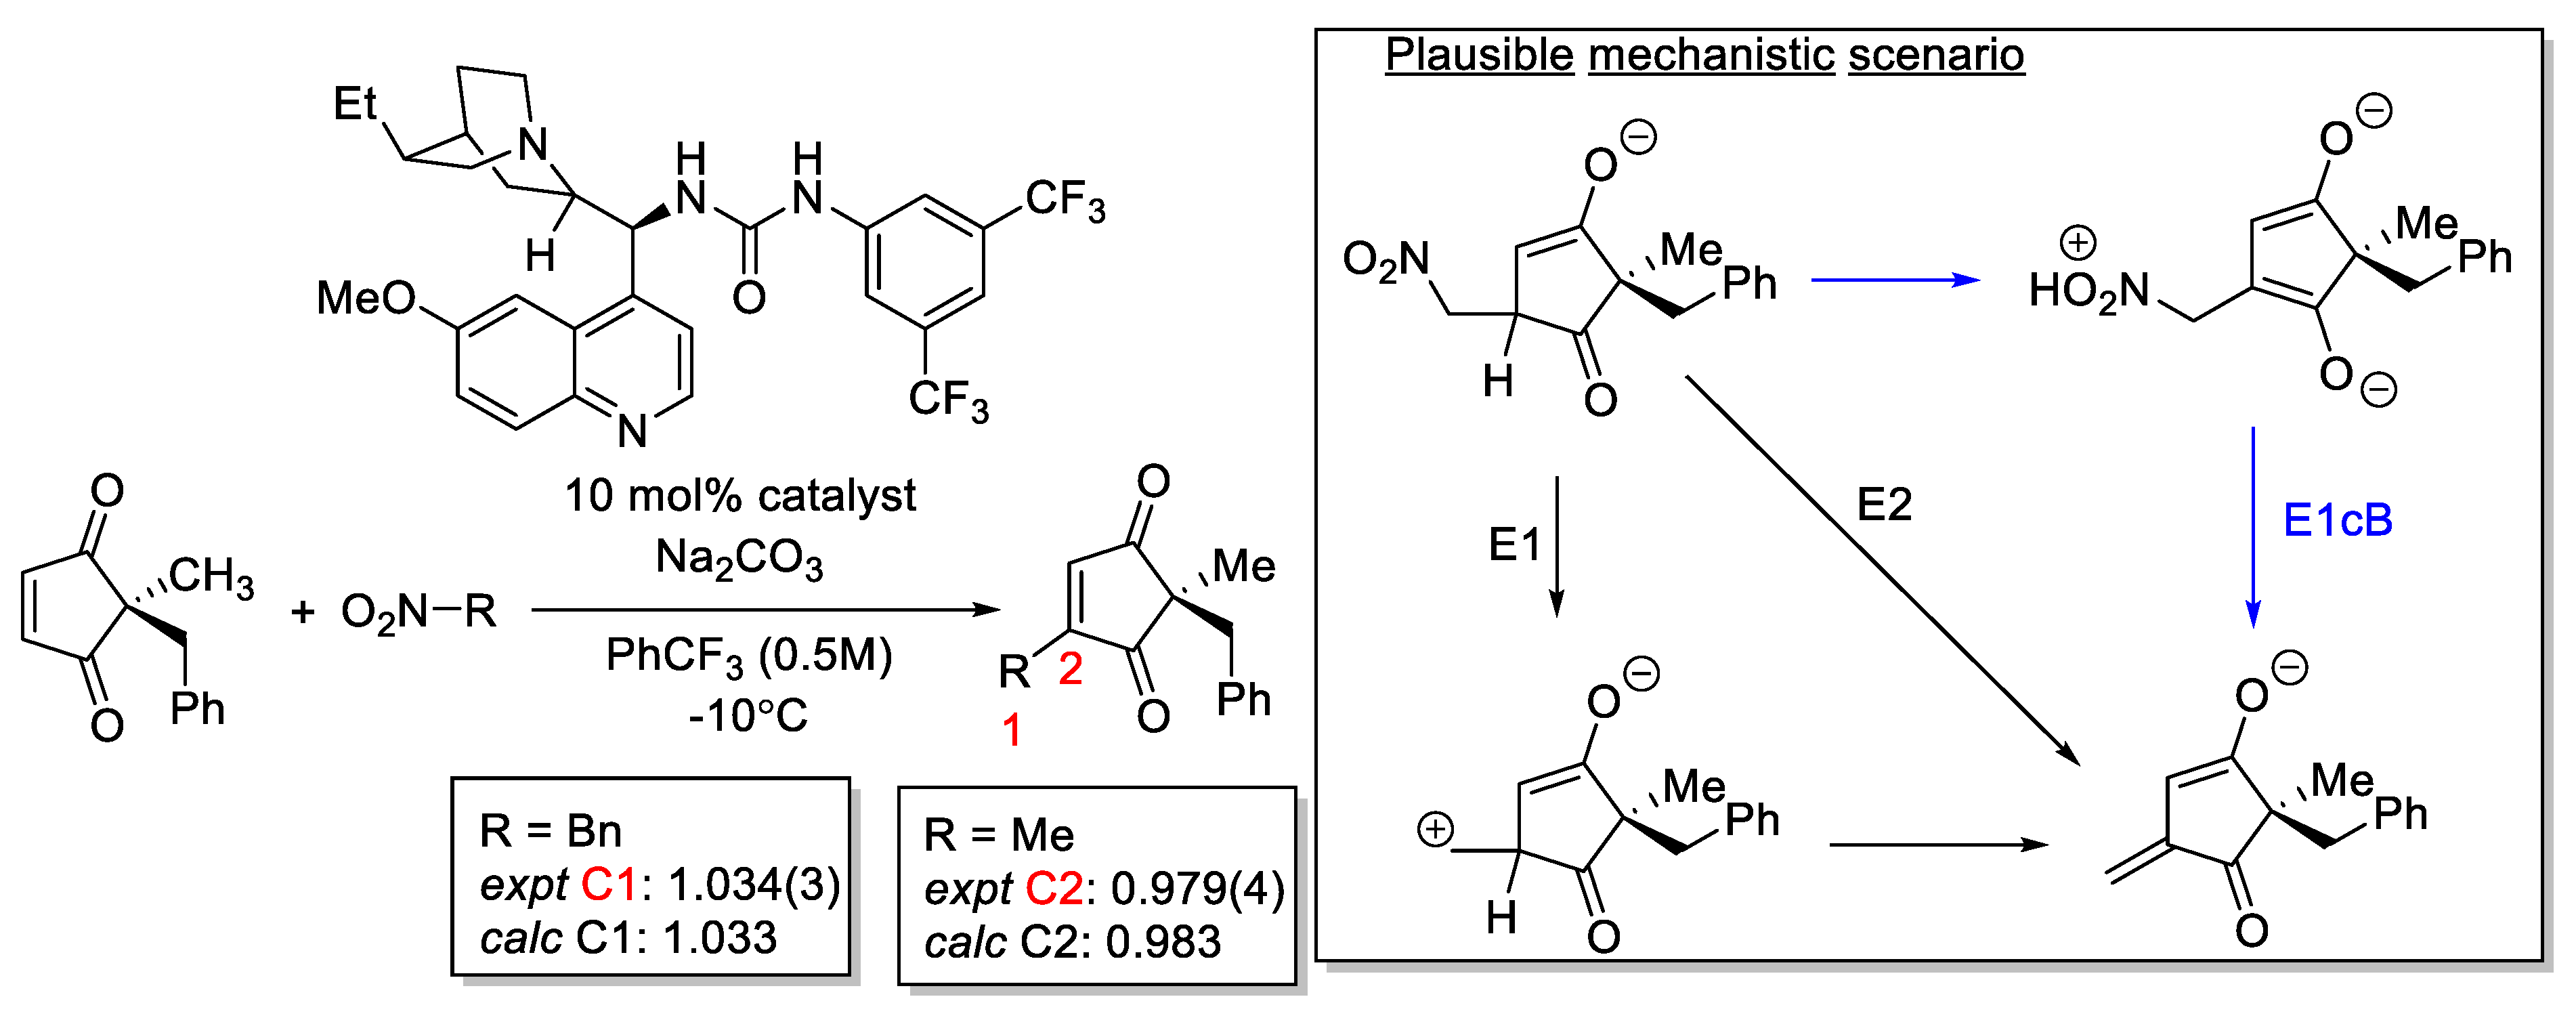
- Chandra Mallojjala, S.; Sarkar, R.; Karugu, R.W.; Manna, M.S.; Ray, S.; Mukherjee, S.; Hirschi, J.S. Mechanism and Origin of Remote Stereocontrol in the Organocatalytic Enantioselective Formal C(Sp2)-H Alkylation Using Nitroalkanes as Alkylating Agents. J. Am. Chem. Soc. 2022, 144, 17399–17406. [Google Scholar] [CrossRef]
- Manna, M.S.; Mukherjee, S. Organocatalytic Enantioselective Formal C(Sp2)-H Alkylation. J. Am. Chem. Soc. 2015, 137, 130–133. [Google Scholar] [CrossRef]
- Ryu, H.; Park, J.Y.; Kim, H.K.; Park, J.Y.; Kim, S.T.; Baik, M.H. Pitfalls in Computational Modeling of Chemical Reactions and How to Avoid Them. Organometallics 2018, 37, 3228–3239. [Google Scholar] [CrossRef]
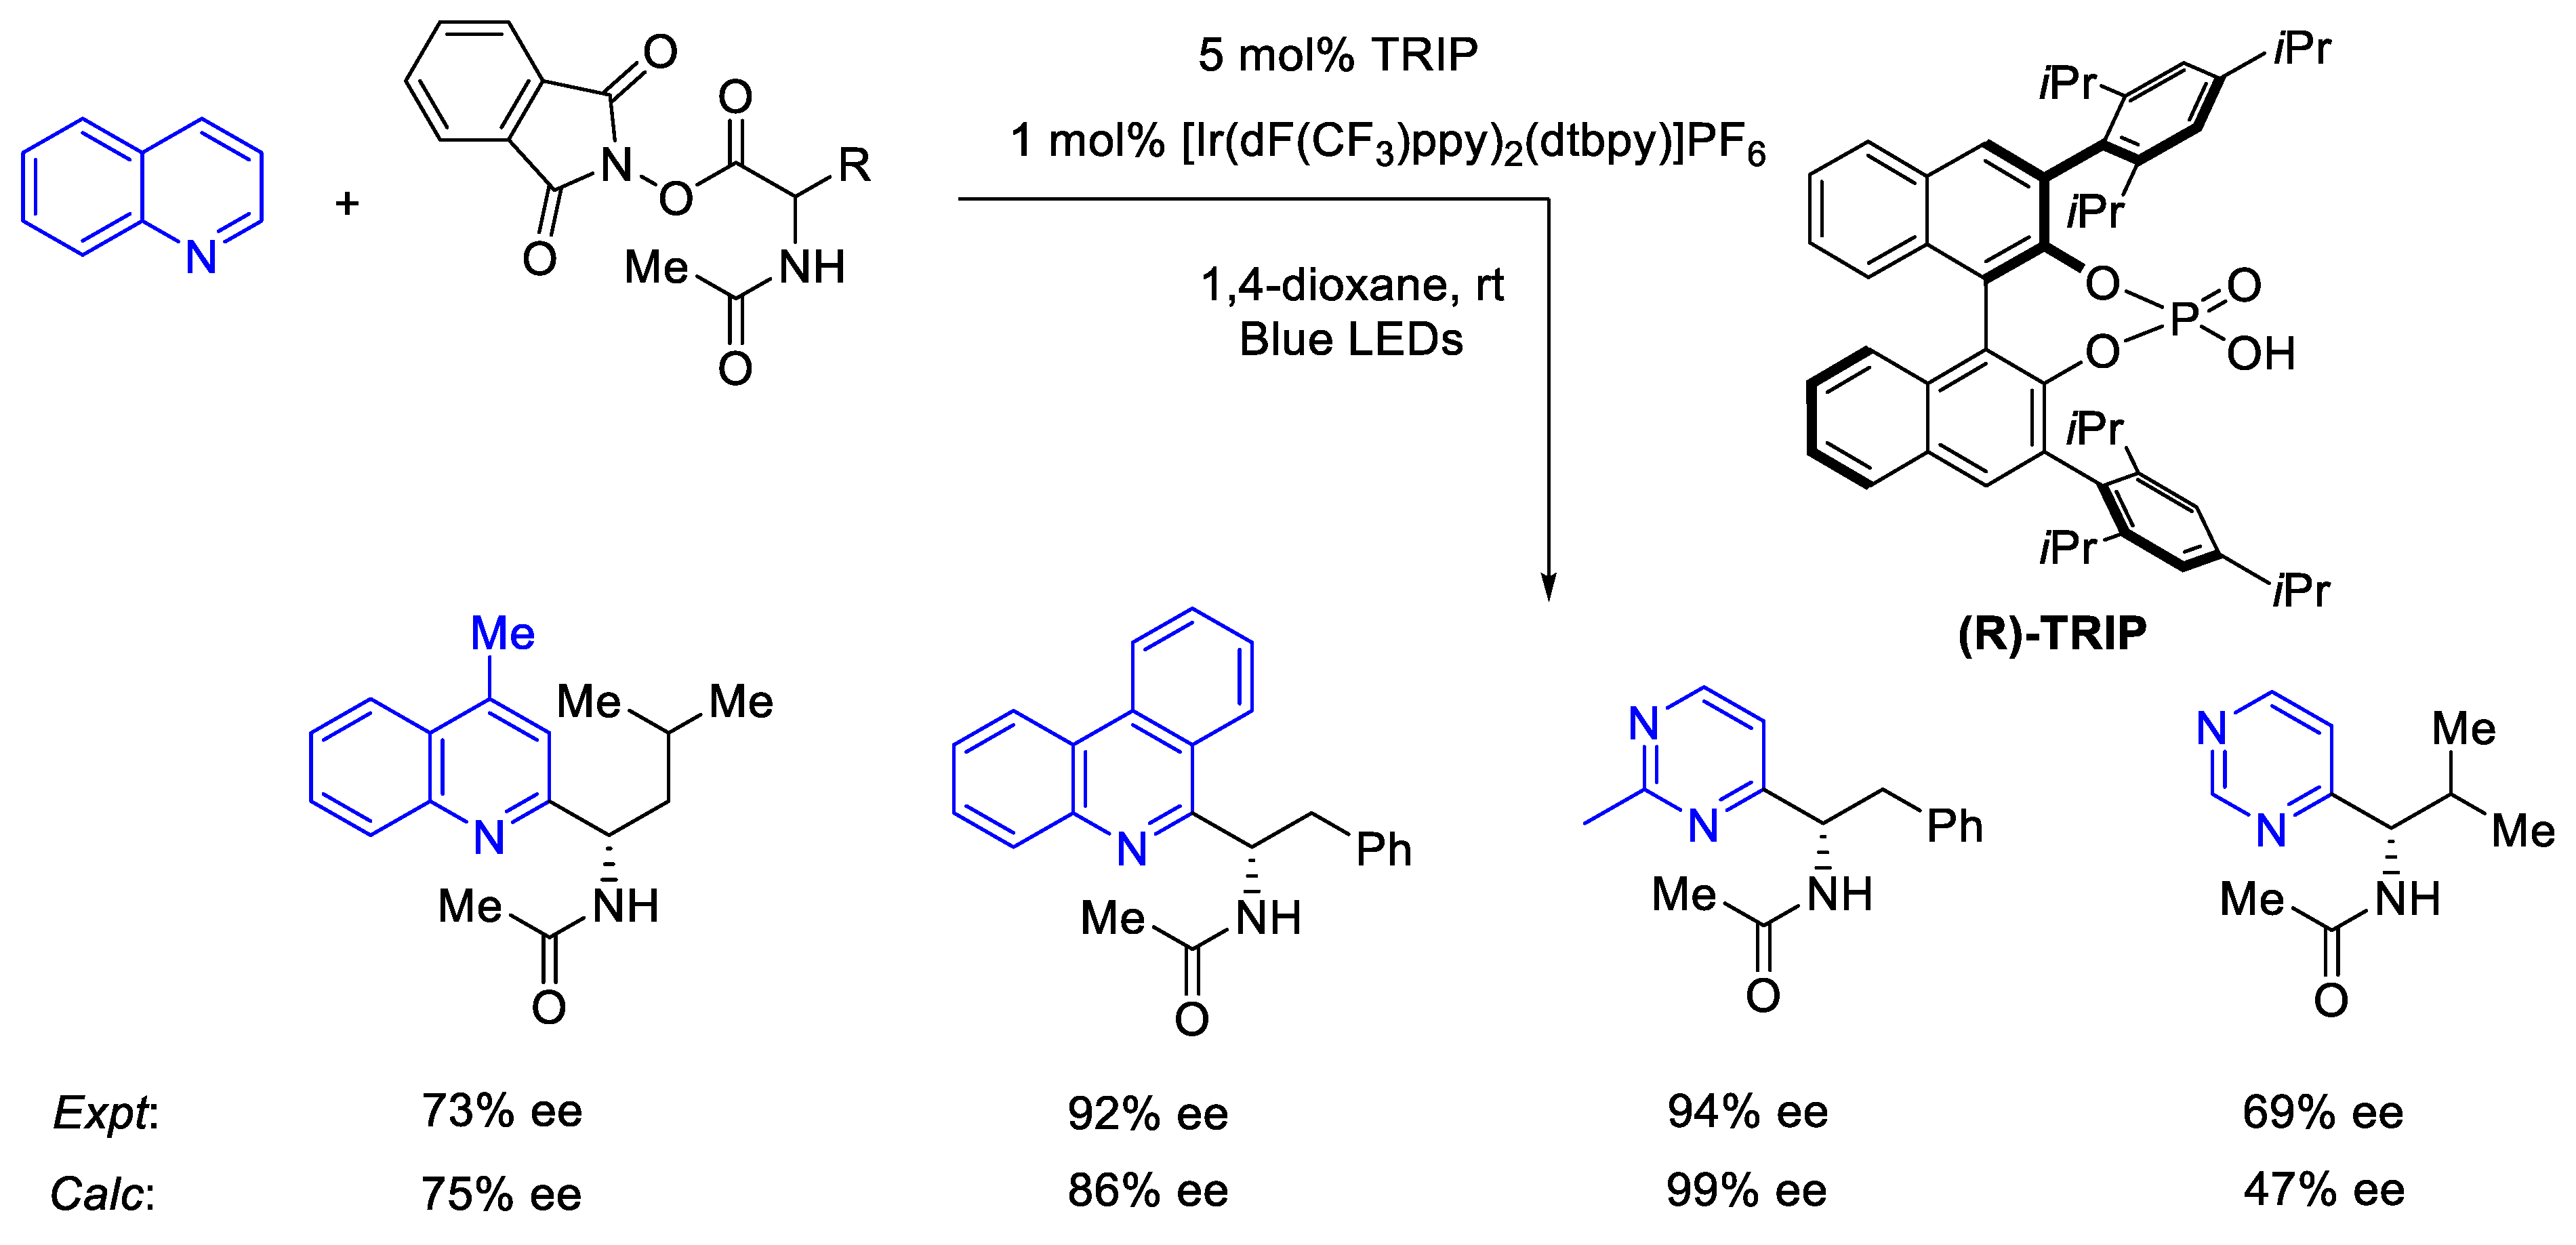
- Proctor, R.S.J.; Davis, H.J.; Phipps, R.J. Catalytic Enantioselective Minisci-Type Addition to Heteroarenes. Science 2018, 360, 419–422. [Google Scholar] [CrossRef]
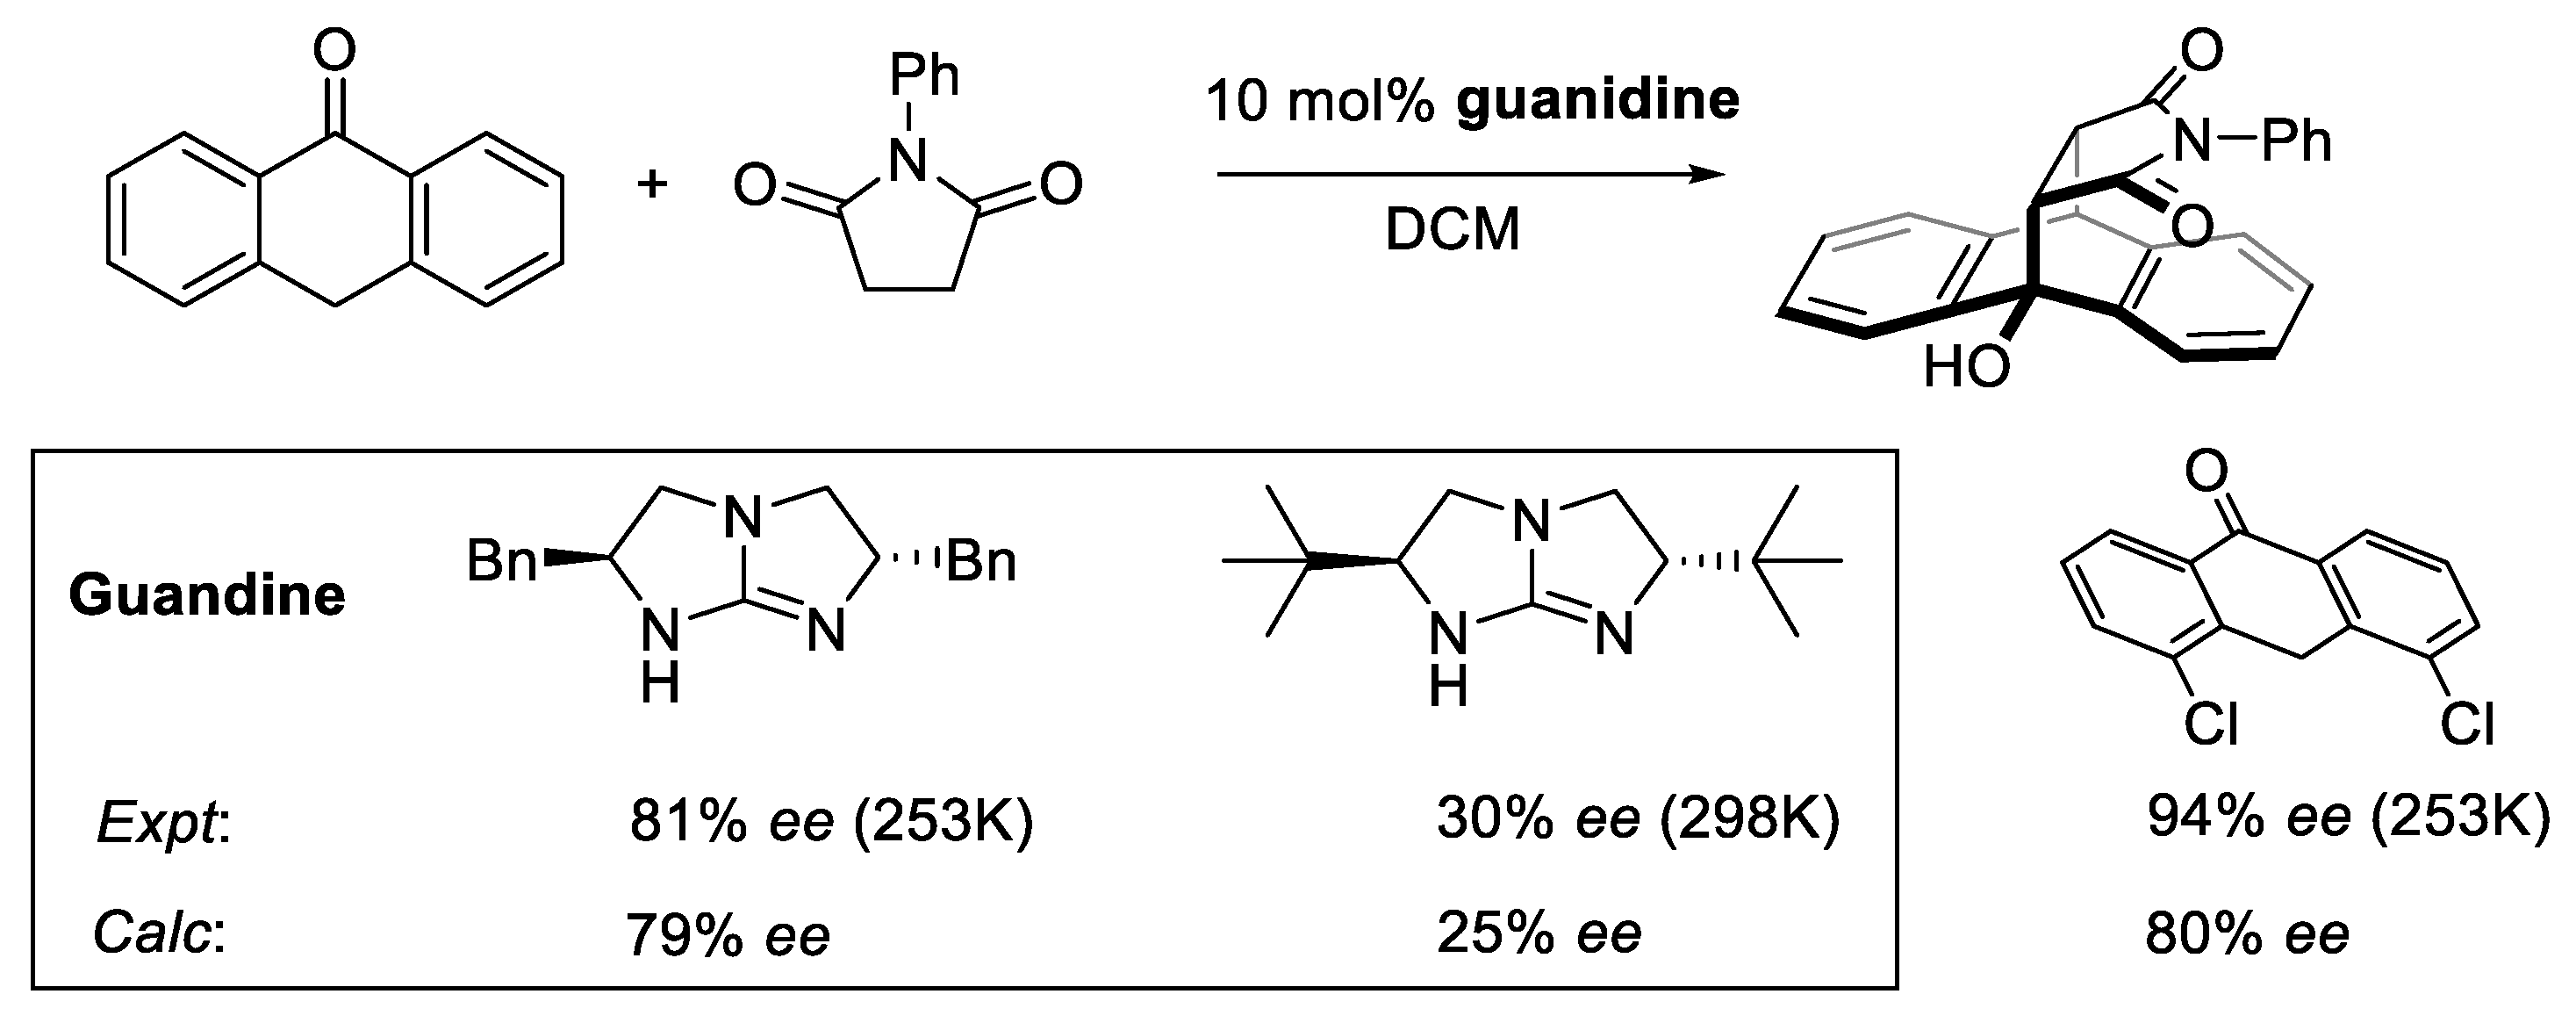
- Shen, J.; Nguyen, T.T.; Goh, Y.-P.; Ye, W.; Fu, X.; Xu, J.; Tan, C.-H. Chiral Bicyclic Guanidine-Catalyzed Enantioselective Reactions of Anthrones. J. Am. Chem. Soc. 2006, 128, 13692–13693. [Google Scholar] [CrossRef]
- Huang, D.; Li, X.; Xu, F.; Li, L.; Lin, X. Highly Enantioselective Synthesis of Dihydroquinazolinones Catalyzed by SPINOL-Phosphoric Acids. ACS Catal. 2013, 3, 2244–2247. [Google Scholar] [CrossRef]
- Van Zeist, W.J.; Bickelhaupt, F.M. The Activation Strain Model of Chemical Reactivity. Org. Biomol. Chem. 2010, 8, 3118–3127. [Google Scholar] [CrossRef]
- Bickelhaupt, F.M.; Houk, K.N. Analyzing Reaction Rates with the Distortion/Interaction-Activation Strain Model. Angew. Chem.—Int. Ed. 2017, 56, 10070–10086. [Google Scholar] [CrossRef]
- Vermeeren, P.; van der Lubbe, S.C.C.; Fonseca Guerra, C.; Bickelhaupt, F.M.; Hamlin, T.A. Understanding Chemical Reactivity Using the Activation Strain Model. Nat. Protoc. 2020, 15, 649–667. [Google Scholar] [CrossRef] [PubMed]
- Schneider, W.B.; Bistoni, G.; Sparta, M.; Saitow, M.; Riplinger, C.; Auer, A.A.; Neese, F. Decomposition of Intermolecular Interaction Energies within the Local Pair Natural Orbital Coupled Cluster Framework. J. Chem. Theory Comput. 2016, 12, 4778–4792. [Google Scholar] [CrossRef]
- Gatzenmeier, T.; Van Gemmeren, M.; Xie, Y.; Höfler, D.; Leutzsch, M.; List, B. Asymmetric Lewis Acid Organocatalysis of the Diels-Alder Reaction by a Silylated C-H Acid. Science 2016, 351, 949–952. [Google Scholar] [CrossRef]
- Johnson, E.R.; Keinan, S.; Mori-Sánchez, P.; Contreras-García, J.; Cohen, A.J.; Yang, W.; Mori-Sánchez, P.; Contreras-García, J.; Cohen, A.J.; Yang, W. Revealing Noncovalent Interactions. J. Am. Chem. Soc. 2010, 132, 6498–6506. [Google Scholar] [CrossRef]
- Boto, R.A.; Peccati, F.; Laplaza, R.; Quan, C.; Carbone, A.; Piquemal, J.P.; Maday, Y.; Contreras-Garcĺa, J. NCIPLOT4: Fast, Robust, and Quantitative Analysis of Noncovalent Interactions. J. Chem. Theory Comput. 2020, 16, 4150–4158. [Google Scholar] [CrossRef]
- Lu, T.; Chen, F. Multiwfn: A Multifunctional Wavefunction Analyzer. J. Comput. Chem. 2012, 33, 580–592. [Google Scholar] [CrossRef]
- Lefebvre, C.; Rubez, G.; Khartabil, H.; Boisson, J.C.; Contreras-García, J.; Hénon, E. Accurately Extracting the Signature of Intermolecular Interactions Present in the NCI Plot of the Reduced Density Gradient: Versus Electron Density. Phys. Chem. Chem. Phys. 2017, 19, 17928–17936. [Google Scholar] [CrossRef]
- Humphrey, W.; Dalke, A.; Schulten, K. VMD: Visual Molecular Dynamics. J. Mol. Graph. 1996, 14, 33–38. [Google Scholar] [CrossRef]
- Facco, E.; D’Errico, M.; Rodriguez, A.; Laio, A. Estimating the Intrinsic Dimension of Datasets by a Minimal Neighborhood Information. Sci. Rep. 2017, 7, 12140. [Google Scholar] [CrossRef] [PubMed]
- Melville, J.; Hargis, C.; Davenport, M.T.; Hamilton, R.S.; Ess, D.H. Machine Learning Analysis of Dynamic-Dependent Bond Formation in Trajectories with Consecutive Transition States. J. Phys. Org. Chem. 2022, 35, e4405. [Google Scholar] [CrossRef]
- Hueffel, J.A.; Sperger, T.; Funes-Ardoiz, I.; Ward, J.S.; Rissanen, K.; Schoenebeck, F. Accelerated Dinuclear Palladium Catalyst Identification through Unsupervised Machine Learning. Science 2021, 374, 1134–1140. [Google Scholar] [CrossRef]
- Strieth-Kalthoff, F.; Sandfort, F.; Segler, M.H.S.; Glorius, F. Machine Learning the Ropes: Principles, Applications and Directions in Synthetic Chemistry. Chem. Soc. Rev. 2020, 49, 6154–6168. [Google Scholar] [CrossRef]
- Liu, Y.; Esan, O.C.; Pan, Z.; An, L. Machine Learning for Advanced Energy Materials. Energy AI 2021, 3, 100049. [Google Scholar] [CrossRef]
- Crawford, J.M.; Kingston, C.; Toste, F.D.; Sigman, M.S. Data Science Meets Physical Organic Chemistry. Acc. Chem. Res. 2021, 54, 3136–3148. [Google Scholar] [CrossRef]
- Karthikeyan, A.; Priyakumar, U.D. Artificial Intelligence: Machine Learning for Chemical Sciences. J. Chem. Sci. 2022, 134, 1–20. [Google Scholar] [CrossRef]
- Bender, A.; Schneider, N.; Segler, M.; Patrick Walters, W.; Engkvist, O.; Rodrigues, T. Evaluation Guidelines for Machine Learning Tools in the Chemical Sciences. Nat. Rev. Chem. 2022, 6, 428–442. [Google Scholar] [CrossRef]
- Żurański, A.M.; Martinez Alvarado, J.I.; Shields, B.J.; Doyle, A.G. Predicting Reaction Yields via Supervised Learning. Acc. Chem. Res. 2021, 54, 1856–1865. [Google Scholar] [CrossRef]
- Jorner, K.; Tomberg, A.; Bauer, C.; Sköld, C.; Norrby, P.O. Organic Reactivity from Mechanism to Machine Learning. Nat. Rev. Chem. 2021, 5, 240–255. [Google Scholar] [CrossRef]
- Williams, W.L.; Zeng, L.; Gensch, T.; Sigman, M.S.; Doyle, A.G.; Anslyn, E.V. The Evolution of Data-Driven Modeling in Organic Chemistry. ACS Cent. Sci. 2021, 7, 1622–1637. [Google Scholar] [CrossRef]
- Ahneman, D.T.; Estrada, J.G.; Lin, S.; Dreher, S.D.; Doyle, A.G. Predicting Reaction Performance in C–N Cross-Coupling Using Machine Learning. Science 2018, 360, 186–190. [Google Scholar] [CrossRef]
- Santiago, C.B.; Guo, J.Y.; Sigman, M.S. Predictive and Mechanistic Multivariate Linear Regression Models for Reaction Development. Chem. Sci. 2018, 9, 2398–2412. [Google Scholar] [CrossRef]
- Singh, S.; Pareek, M.; Changotra, A.; Banerjee, S.; Bhaskararao, B.; Balamurugan, P.; Sunoj, R.B. A Unified Machine-Learning Protocol for Asymmetric Catalysis as a Proof of Concept Demonstration Using Asymmetric Hydrogenation. Proc. Natl. Acad. Sci. USA 2020, 117, 1339–1345. [Google Scholar] [CrossRef]
- Xu, L.C.; Zhang, S.Q.; Li, X.; Tang, M.J.; Xie, P.P.; Hong, X. Towards Data-Driven Design of Asymmetric Hydrogenation of Olefins: Database and Hierarchical Learning. Angew. Chem.—Int. Ed. 2021, 60, 22804–22811. [Google Scholar] [CrossRef]
- Singh, S.; Sunoj, R.B. A Transfer Learning Protocol for Chemical Catalysis Using a Recurrent Neural Network Adapted from Natural Language Processing. Digit. Discov. 2022, 1, 303–312. [Google Scholar] [CrossRef]
- Zhu, X.Y.; Ran, C.K.; Wen, M.; Guo, G.L.; Liu, Y.; Liao, L.L.; Li, Y.Z.; Li, M.L.; Yu, D.G. Prediction of Multicomponent Reaction Yields Using Machine Learning. Chin. J. Chem. 2021, 39, 3231–3237. [Google Scholar] [CrossRef]
- Owen, B.; Wheelhouse, K.; Figueredo, G.; Özcan, E.; Woodward, S. Machine Learnt Patterns in Rhodium-Catalysed Asymmetric Michael Addition Using Chiral Diene Ligands. Results Chem. 2022, 4, 100379. [Google Scholar] [CrossRef]
- Zahrt, A.F.; Henle, J.J.; Rose, B.T.; Wang, Y.; Darrow, W.T.; Denmark, S.E. Prediction of Higher-Selectivity Catalysts by Computer-Driven Workflow and Machine Learning. Science 2019, 363, eaau5631. [Google Scholar] [CrossRef]
- Rinehart, N.I.; Zahrt, A.F.; Henle, J.J.; Denmark, S.E. Dreams, False Starts, Dead Ends, and Redemption: A Chronicle of the Evolution of a Chemoinformatic Workflow for the Optimization of Enantioselective Catalysts. Acc. Chem. Res. 2021, 54, 2041–2054. [Google Scholar] [CrossRef]
- Zahrt, A.F.; Henle, J.J.; Denmark, S.E. Cautionary Guidelines for Machine Learning Studies with Combinatorial Datasets. ACS Comb. Sci. 2020, 22, 586–591. [Google Scholar] [CrossRef]
- Chuang, K.V.; Keiser, M.J. Comment on “Predicting Reaction Performance in C–N Cross-Coupling Using Machine Learning”. Science 2018, 362, eaat8603. [Google Scholar] [CrossRef]
- Estrada, J.G.; Ahneman, D.T.; Sheridan, R.P.; Dreher, S.D.; Doyle, A.G. Response to Comment on “Predicting Reaction Performance in C–N Cross-Coupling Using Machine Learning”. Science 2018, 362, 8763. [Google Scholar] [CrossRef]
- Sandfort, F.; Strieth-Kalthoff, F.; Kühnemund, M.; Beecks, C.; Glorius, F. A Structure-Based Platform for Predicting Chemical Reactivity. Chem 2020, 6, 1379–1390. [Google Scholar] [CrossRef]
- Yang, Q.; Liu, Y.; Cheng, J.; Li, Y.; Liu, S.; Duan, Y.; Zhang, L.; Luo, S. An Ensemble Structure and Physicochemical (SPOC) Descriptor for Machine-Learning Prediction of Chemical Reaction and Molecular Properties. ChemPhysChem 2022, 23, e202200255. [Google Scholar] [CrossRef]
- Behler, J. Four Generations of High-Dimensional Neural Network Potentials. Chem. Rev. 2021, 121, 10037–10072. [Google Scholar] [CrossRef]
- Unke, O.T.; Chmiela, S.; Sauceda, H.E.; Gastegger, M.; Poltavsky, I.; Schütt, K.T.; Tkatchenko, A.; Müller, K.R. Machine Learning Force Fields. Chem. Rev. 2021, 121, 10142–10186. [Google Scholar] [CrossRef]
- Pinheiro, M.; Ge, F.; Ferré, N.; Dral, P.O.; Barbatti, M. Choosing the Right Molecular Machine Learning Potential. Chem. Sci. 2021, 12, 14396–14413. [Google Scholar] [CrossRef]
- Devereux, C.; Smith, J.S.; Davis, K.K.; Barros, K.; Zubatyuk, R.; Isayev, O.; Roitberg, A.E. Extending the Applicability of the ANI Deep Learning Molecular Potential to Sulfur and Halogens. J. Chem. Theory Comput. 2020, 16, 4192–4202. [Google Scholar] [CrossRef]
- Gasteiger, J.; Groß, J.; Günnemann, S. Directional Message Passing for Molecular Graphs. arXiv 2020, arXiv:2003.03123. [Google Scholar] [CrossRef]
- Klicpera, J.; Becker, F.; Günnemann, S. GemNet: Universal Directional Graph Neural Networks for Molecules. Adv. Neural Inf. Process. Syst. 2021, 9, 6790–6802. [Google Scholar] [CrossRef]
- Schütt, K.T.; Kindermans, P.J.; Sauceda, H.E.; Chmiela, S.; Tkatchenko, A.; Müller, K.R. SchNet: A Continuous-Filter Convolutional Neural Network for Modeling Quantum Interactions. Adv. Neural Inf. Process. Syst. 2017, 2017, 992–1002. [Google Scholar] [CrossRef]
- Hellström, M.; Behler, J. Concentration-Dependent Proton Transfer Mechanisms in Aqueous NaOH Solutions: From Acceptor-Driven to Donor-Driven and Back. J. Phys. Chem. Lett. 2016, 7, 3302–3306. [Google Scholar] [CrossRef]
- Zhang, C.; Yue, S.; Panagiotopoulos, A.Z.; Klein, M.L.; Wu, X. Dissolving Salt Is Not Equivalent to Applying a Pressure on Water. Nat. Commun. 2022, 13, 822. [Google Scholar] [CrossRef]
- Ghorbanfekr, H.; Behler, J.; Peeters, F.M. Insights into Water Permeation through HBN Nanocapillaries by Ab Initio Machine Learning Molecular Dynamics Simulations. J. Phys. Chem. Lett. 2020, 11, 7363–7370. [Google Scholar] [CrossRef]
- Jin, M.; Liu, M.; Nachtigall, P.; Grajciar, L.; Heard, C.J. Mechanism of Zeolite Hydrolysis under Basic Conditions. Chem. Mater. 2021, 33, 9202–9212. [Google Scholar] [CrossRef]
- Zhang, Y.; Wang, H.; Chen, W.; Zeng, J.; Zhang, L.; Wang, H.; Weinan, E. DP-GEN: A Concurrent Learning Platform for the Generation of Reliable Deep Learning Based Potential Energy Models. Comput. Phys. Commun. 2020, 253, 107206. [Google Scholar] [CrossRef]
- Piaggi, P.M.; Weis, J.; Panagiotopoulos, A.Z.; Debenedetti, P.G.; Car, R. Homogeneous Ice Nucleation in an Ab Initio Machine-Learning Model of Water. Proc. Natl. Acad. Sci. USA 2022, 119, e2207294119. [Google Scholar] [CrossRef]
- Groenenboom, M.C.; Keith, J.A. Explicitly Unraveling the Roles of Counterions, Solvent Molecules, and Electron Correlation in Solution Phase Reaction Pathways. J. Phys. Chem. B 2016, 120, 10797–10807. [Google Scholar] [CrossRef]
- Chmiela, S.; Sauceda, H.E.; Müller, K.R.; Tkatchenko, A. Towards Exact Molecular Dynamics Simulations with Machine-Learned Force Fields. Nat. Commun. 2018, 9, 3887. [Google Scholar] [CrossRef]
- Ryczko, K.; Krogel, J.T.; Tamblyn, I. Machine Learning Diffusion Monte Carlo Energies. J. Chem. Theory Comput. 2022, 18, 7695–7701. [Google Scholar] [CrossRef]
- Li, Z.; Kermode, J.R.; De Vita, A. Molecular Dynamics with On-the-Fly Machine Learning of Quantum-Mechanical Forces. Phys. Rev. Lett. 2015, 114, 096405. [Google Scholar] [CrossRef]
- Huang, B.; von Lilienfeld, O.A. Quantum Machine Learning Using Atom-in-Molecule-Based Fragments Selected on the Fly. Nat. Chem. 2020, 12, 945–951. [Google Scholar] [CrossRef]
- Vandermause, J.; Torrisi, S.B.; Batzner, S.; Xie, Y.; Sun, L.; Kolpak, A.M.; Kozinsky, B. On-the-Fly Active Learning of Interpretable Bayesian Force Fields for Atomistic Rare Events. Npj Comput. Mater. 2020, 6, 20. [Google Scholar] [CrossRef]
- Kulik, H.J.; Hammerschmidt, T.; Schmidt, J.; Botti, S.; Marques, M.A.L.; Boley, M.; Scheffler, M.; Todorović, M.; Rinke, P.; Oses, C.; et al. Roadmap on Machine Learning in Electronic Structure. Electron. Struct. 2022, 4, 023004. [Google Scholar] [CrossRef]


| Temperature | Energetic Span (kcal/mol) * | TOF (h−1) * |
|---|---|---|
| 298.15 | 20 | 49 |
| 21 | 9.1 | |
| 22 | 1.67 | |
| 223.15 | 15 | 34 |
| 16 | 3.58 | |
| 17 | 0.38 |
| DFA | Relative Cost of Energy Calculation [a]* | Relative Cost of Gradient Calculation * |
|---|---|---|
| revPBE | 1.0 | 1.0 |
| r2SCAN | 1.1 | 1.0 |
| M06-2X | 5.5 | 4.5 |
| ωB97M-V | 3.3 | 3.0 [b] |
| revDSD-PBEP86 | 360 [c] | 510 [c] |
| Reactant Concentration (M) | Vol. of a Cube to Contain One Molecule (Å3) [a] | Number of H2O Molecules in the Volume Given on the Left [b] |
|---|---|---|
| 1 M | 1660 (11.84) | 56 |
| 0.1 M | 16,605 (25.512) | 555 |
| 0.01 M | 166,053 (54.965) | 5550 |
Disclaimer/Publisher’s Note: The statements, opinions and data contained in all publications are solely those of the individual author(s) and contributor(s) and not of MDPI and/or the editor(s). MDPI and/or the editor(s) disclaim responsibility for any injury to people or property resulting from any ideas, methods, instructions or products referred to in the content. |
© 2023 by the author. Licensee MDPI, Basel, Switzerland. This article is an open access article distributed under the terms and conditions of the Creative Commons Attribution (CC BY) license (https://creativecommons.org/licenses/by/4.0/).
Share and Cite
Kee, C.W. Molecular Understanding and Practical In Silico Catalyst Design in Computational Organocatalysis and Phase Transfer Catalysis—Challenges and Opportunities. Molecules 2023, 28, 1715. https://doi.org/10.3390/molecules28041715
Kee CW. Molecular Understanding and Practical In Silico Catalyst Design in Computational Organocatalysis and Phase Transfer Catalysis—Challenges and Opportunities. Molecules. 2023; 28(4):1715. https://doi.org/10.3390/molecules28041715
Chicago/Turabian StyleKee, Choon Wee. 2023. "Molecular Understanding and Practical In Silico Catalyst Design in Computational Organocatalysis and Phase Transfer Catalysis—Challenges and Opportunities" Molecules 28, no. 4: 1715. https://doi.org/10.3390/molecules28041715