Article

Identification of Phytochemicals in Bioactive Extracts of Acacia saligna Growing in Australia

by
Anjar P. Asmara
1,
Anchalee Prasansuklab
2,3,
Tewin Tencomnao
2,4 and
Alison T. Ung
1,*
1
School of Mathematical and Physical Sciences, Faculty of Science, University of Technology Sydney, Ultimo, NSW 2007, Australia
2
Natural Products for Neuroprotection and Anti-Ageing Research Unit, Chulalongkorn University, Bangkok 10330, Thailand
3
College of Public Health Sciences, Chulalongkorn University, Bangkok 10330, Thailand
4
Department of Clinical Chemistry, Faculty of Allied Health Sciences, Chulalongkorn University, Bangkok 10330, Thailand
*
Author to whom correspondence should be addressed.
Molecules 2023, 28(3), 1028; https://doi.org/10.3390/molecules28031028
Submission received: 20 December 2022 / Revised: 15 January 2023 / Accepted: 16 January 2023 / Published: 19 January 2023
(This article belongs to the Special Issue Key Role of Natural Bioactive Compounds in Health and Diseases)

Abstract

:
Acacia saligna growing in Australia has not been fully investigated for its bioactive phytochemicals. Sequential polarity-based extraction was employed to provide four different extracts from individual parts of A. saligna. Bioactive extracts were determined using in vitro antioxidant and yeast α-glucosidase inhibitory assays. Methanolic extracts from barks, leaves, and flowers are the most active and have no toxicity against 3T3-L1 adipocytes. Compound isolation of bioactive extracts provided us with ten compounds. Among them are two novel natural products; naringenin-7-O-α-L-arabinopyranoside 2 and (3S*,5S*)-3-hydroxy-5-(2-aminoethyl) dihydrofuran-2(3H)-one 9. D-(+)-pinitol 5a (from barks and flowers), (−)-pinitol 5b (exclusively from leaf), and 2,4-di-t-butylphenol 7 are known natural products and new to A. saligna. (−)-Epicatechin 6, quercitrin 4, and myricitrin 8 showed potent antioxidant activities consistently in DPPH and ABTS assays. (−)-Epicatechin 6 (IC50 = 63.58 μM), D-(+)-pinitol 5a (IC50 = 74.69 μM), and naringenin 1 (IC50 = 89.71 μM) are the strong inhibitors against the α-glucosidase enzyme. The presence of these compounds supports the activities exerted in our methanolic extracts. The presence of 2,4-di-t-butylphenol 7 may support the reported allelopathic and antifungal activities. The outcome of this study indicates the potential of Australian A. saligna as a rich source of bioactive compounds for drug discovery targeting type 2 diabetes.

1. Introduction

Acacia saligna (Labill.) H. L. Wendl. is a Western Australian species previously known as A. cyanophylla Lindl [1]. A. saligna plants growing in Saudi Arabia, Egypt, Tunisia, and other parts of Africa have been shown to have various bioactive phytochemicals. Flavonoids from the flower were shown to have antifungal, antioxidant, antiacetylcholinesterase, and antibacterial activity [2,3,4]. Volatile phytochemicals of A. saligna, possessing allelopathic activity, indicate their potential to be green herbicides [5,6]. The leaf extracts containing polyphenols have demonstrated antibacterial and antifungal activities, while some isolated compounds have exhibited antioxidant and cytotoxicity against liver cancer cells [7,8,9]. Two recent reports on the ethanolic crude extract of barks showed antifungal and antioxidant activities [10], and α-glucosidase inhibitory activity [11]. A. saligna has also been used in the Middle East, Africa, and South America as ruminants’ fodder [12,13,14]. The utility of A. saligna as animal feed indicates its low toxicity and high nutritional benefit.
There is no detailed study on isolating bioactive chemicals from the bark, leaves, and flowers of Australian A. saligna. Therefore, this warrants a detailed chemical analysis of beneficial bioactive molecules of this plant.
The literature also indicates that the potential of A. saligna growing in Australia has not been fully explored for antidiabetic properties for treating type 2 diabetes (T2D) [11,15]. T2D is a disorder driven by metabolic abnormalities connected to obesity and impaired insulin response, together with the rise of hepatic glucose production, ultimately disrupting glucose homeostasis [16,17]. Previous studies have shown that compounds with antioxidant activity can improve glycaemic control in animal models of T2D [18]. Furthermore, one known therapy for T2D is the application of α-glucosidase inhibitors such as acarbose, voglibose, and miglitol. These synthetic inhibitors are known to have adverse side effects, namely hepatotoxicity and gastrointestinal symptoms [19]. It would be beneficial to find safer and more affordable alternatives. Studies have revealed that the α-glucosidase inhibitors and antioxidants could be obtained from natural products such as flavonoids [20]. Therefore, antioxidant and α-glucosidase inhibitory activities would be useful to guide the selection of the most promising extracts for the isolation of pure bioactive compounds as a starting point for developing antidiabetic compounds from Australian A. saligna.
In this study, extracts from flowers, leaves, and bark of Australian A. saligna were prepared using a sequential polarity-based extraction method. This approach allowed compounds of similar polarity and structure to be pooled into a fraction, which could also streamline pure compound isolation by isolating fewer compounds in the mixture. The process has been known to improve the mass recovery of each pool of compounds [21,22]. The extracts were assessed for antioxidant activity and inhibition against the yeast α-glucosidase. The most bioactive extracts were selected for bioactive compound isolation and complete structure elucidation. Pure compounds’ activities were determined to confirm which were responsible for the activities observed in the extracts.

2. Results and Discussion

2.1. Fractionation of Crude Extracts of A. saligna

Dried ground powder (250 g) of either flowers, leaves, or bark were sequentially extracted using sequential steps adapted from the protocol of Subhan [23], as shown in Supplementary Figure S1, to give respective extracts as listed in Table 1. The fractionation of each extract was carried out only once; thus, the mass recovery values are presented without standard errors.

2.2. Antioxidant Evaluation of Fractions

2.2.1. DPPH Scavenging Activity

The dose-response DPPH scavenging activities of all extracts from flowers, leaves, and bark expressed in percentage of activity and IC50 are presented in Supplementary Tables S1 and S2 for vitamin C. Figure 1a displays the dose-response curves of the most active BK-MeOH extract. Table 2 shows the IC50 value of DPPH scavenging of each extract. The BK-MeOH extract (IC50 = 94.24 ± 19.89 µg/mL) has the highest antioxidant activity, followed by LF-MeOH (IC50 = 190.1 ± 59.15 µg/mL) and FL-MeOH (IC50 = 331.5 ± 17.21 µg/mL). Compared to vitamin C (49.97 ± 10.76 µg/mL), the decreasing antioxidant activities of the methanolic extracts can be expressed as BK-MeOH > LF-MeOH > FL-MeOH. This trend agrees with the previously reported finding that polar organic solvent extract seemed to have better antioxidant activity due to its high polyphenols content [24].
Using a similar DPPH method, the crude ethyl acetate extract from flowers collected in Tunisia was shown to have an IC50 of 67 µg/mL [2], while the water flower extract from Egyptian A. saligna showed poor activity with an IC50 of 461.7 µg/mL [3]. Elansary et al. [4] showed that their crude methanolic extract of leaves collected in Saudi Arabia has a potent antioxidant activity with an IC50 of 17 µg/mL. The crude methanolic extract from barks collected in Egypt was reported [10] to have an IC50 of 10.1 µg/mL. The variation in activities may mainly be attributed to each extract’s different chemical compositions affected by the growing conditions [25] and methods of extraction and assay.

2.2.2. ABTS●+ Radical Assay

The dose-response ABTS●+ radical scavenging activities of all extracts are summarised in Supplementary Tables S3 and S4 for vitamin C-positive control. Figure 1b displays the dose-response curves of ABTS●+ scavenging percentage for BK-MeOH extract. The IC50 values for the three extracts are listed in Table 2. Similar to the DPPH scavenging activity, the trend of antioxidant activities in this ABTS radical assay indicates that all methanolic extracts exert higher activities than their counterparts, compared to vitamin C. The decreasing antioxidant activities of the methanolic extracts can be expressed as BK-MeOH > LF-MeOH > FL-MeOH, compared to vitamin C. Interestingly, BK-MeOH was slightly more active than vitamin C against ABTS●+ radical.

2.3. Inhibition of Yeast A-Glucosidase Enzyme Assay

The dose-response inhibitory activities of the plant extracts and the positive control acarbose against the yeast α-glucosidase enzyme are shown in Supplementary Tables S5–S8 and Figures S2–S5. The detectable IC50 values are listed in Table 3. Non-alcoholic extracts, except aqueous barks extract (BK-H2O), are less active than the methanolic samples. BK-MeOH extract showed superior inhibitory activity (IC50 4.373 ± 0.24 µg/mL) compared to BK-H2O and the two methanolic counterparts. This value is comparable with the inhibitory activity of crude ethanolic bark and leaf extracts of the South African A. saligna with IC50 of 2.35 µg/mL and 3.64 µg/mL, respectively [11]. Notably, the inhibitory activity of crude ethanolic leaf extract is more potent than our LF-MeOH.

2.4. Toxicity of Bioactive Methanolic Fractions against 3T3-L1 Adipocytes

FL-MeOH, LF-MeOH, and BK-MeOH were tested for their toxicity against 3T3-L1 adipocytes using the 3-(4,5-dimethylthiazol-2-yl)-2,5-diphenyl-tetrazolium bromide (MTT) assay. The 3T3-L1 adipocytes were used in this study because they are the ideal cell model suitable for investigating the antidiabetic activities of A. saligna. The cell line can provide an excellent model of white adipose tissue to investigate glucose uptake, lipogenesis, and glycogen synthesis under an insulin-resistant state [26]. Figure 2a shows the results of the MTT assay on 3T3-L1 adipocytes treated with four different concentrations of FL-MeOH (25–200 μg/mL) for 24, 48, and 72 h. The cell viability was estimated between 93 and 116%. FL-MeOH showed no toxic effects at the highest test concentration (200 μg/mL). Similarly, LF-MeOH and BK-MeOH also showed no toxicity against 3T3-L1 adipocytes at 200 μg/mL after incubation for 72 h (Figure 2b,c).
Elansary et al. [4] reported the non-cytotoxic activity of their crude methanolic extract of A. saligna leaves from Saudi Arabia against HEK-293 (non-cancerous human embryonic kidney cells). Their MTT assays revealed no significant toxicity against HEK-293 cells at the highest test concentration of 400 μg/mL. Buttner et al. [11] also reported the non-toxicity of their leaf and bark extracts of A. saligna from Saudi Arabia against Caco-2 cells at the highest test concentration of 300 mg/mL. Although our non-toxic results against murine 3T3-L1 cells cannot be directly compared to these reported results; however, their findings have highlighted the non-toxicity potential of A. saligna.

2.5. Isolation of Pure Compounds Active Fractions

The most bioactive extracts were selected for compound isolation by column chromatography. Isolated compounds were structure elucidated by NMR and HRMS analysis. We have successfully isolated ten compounds through this effort, as shown in Figure 3. Among these, compounds 2 and 9 are novel. Their isolation and identification are discussed in the following sections.

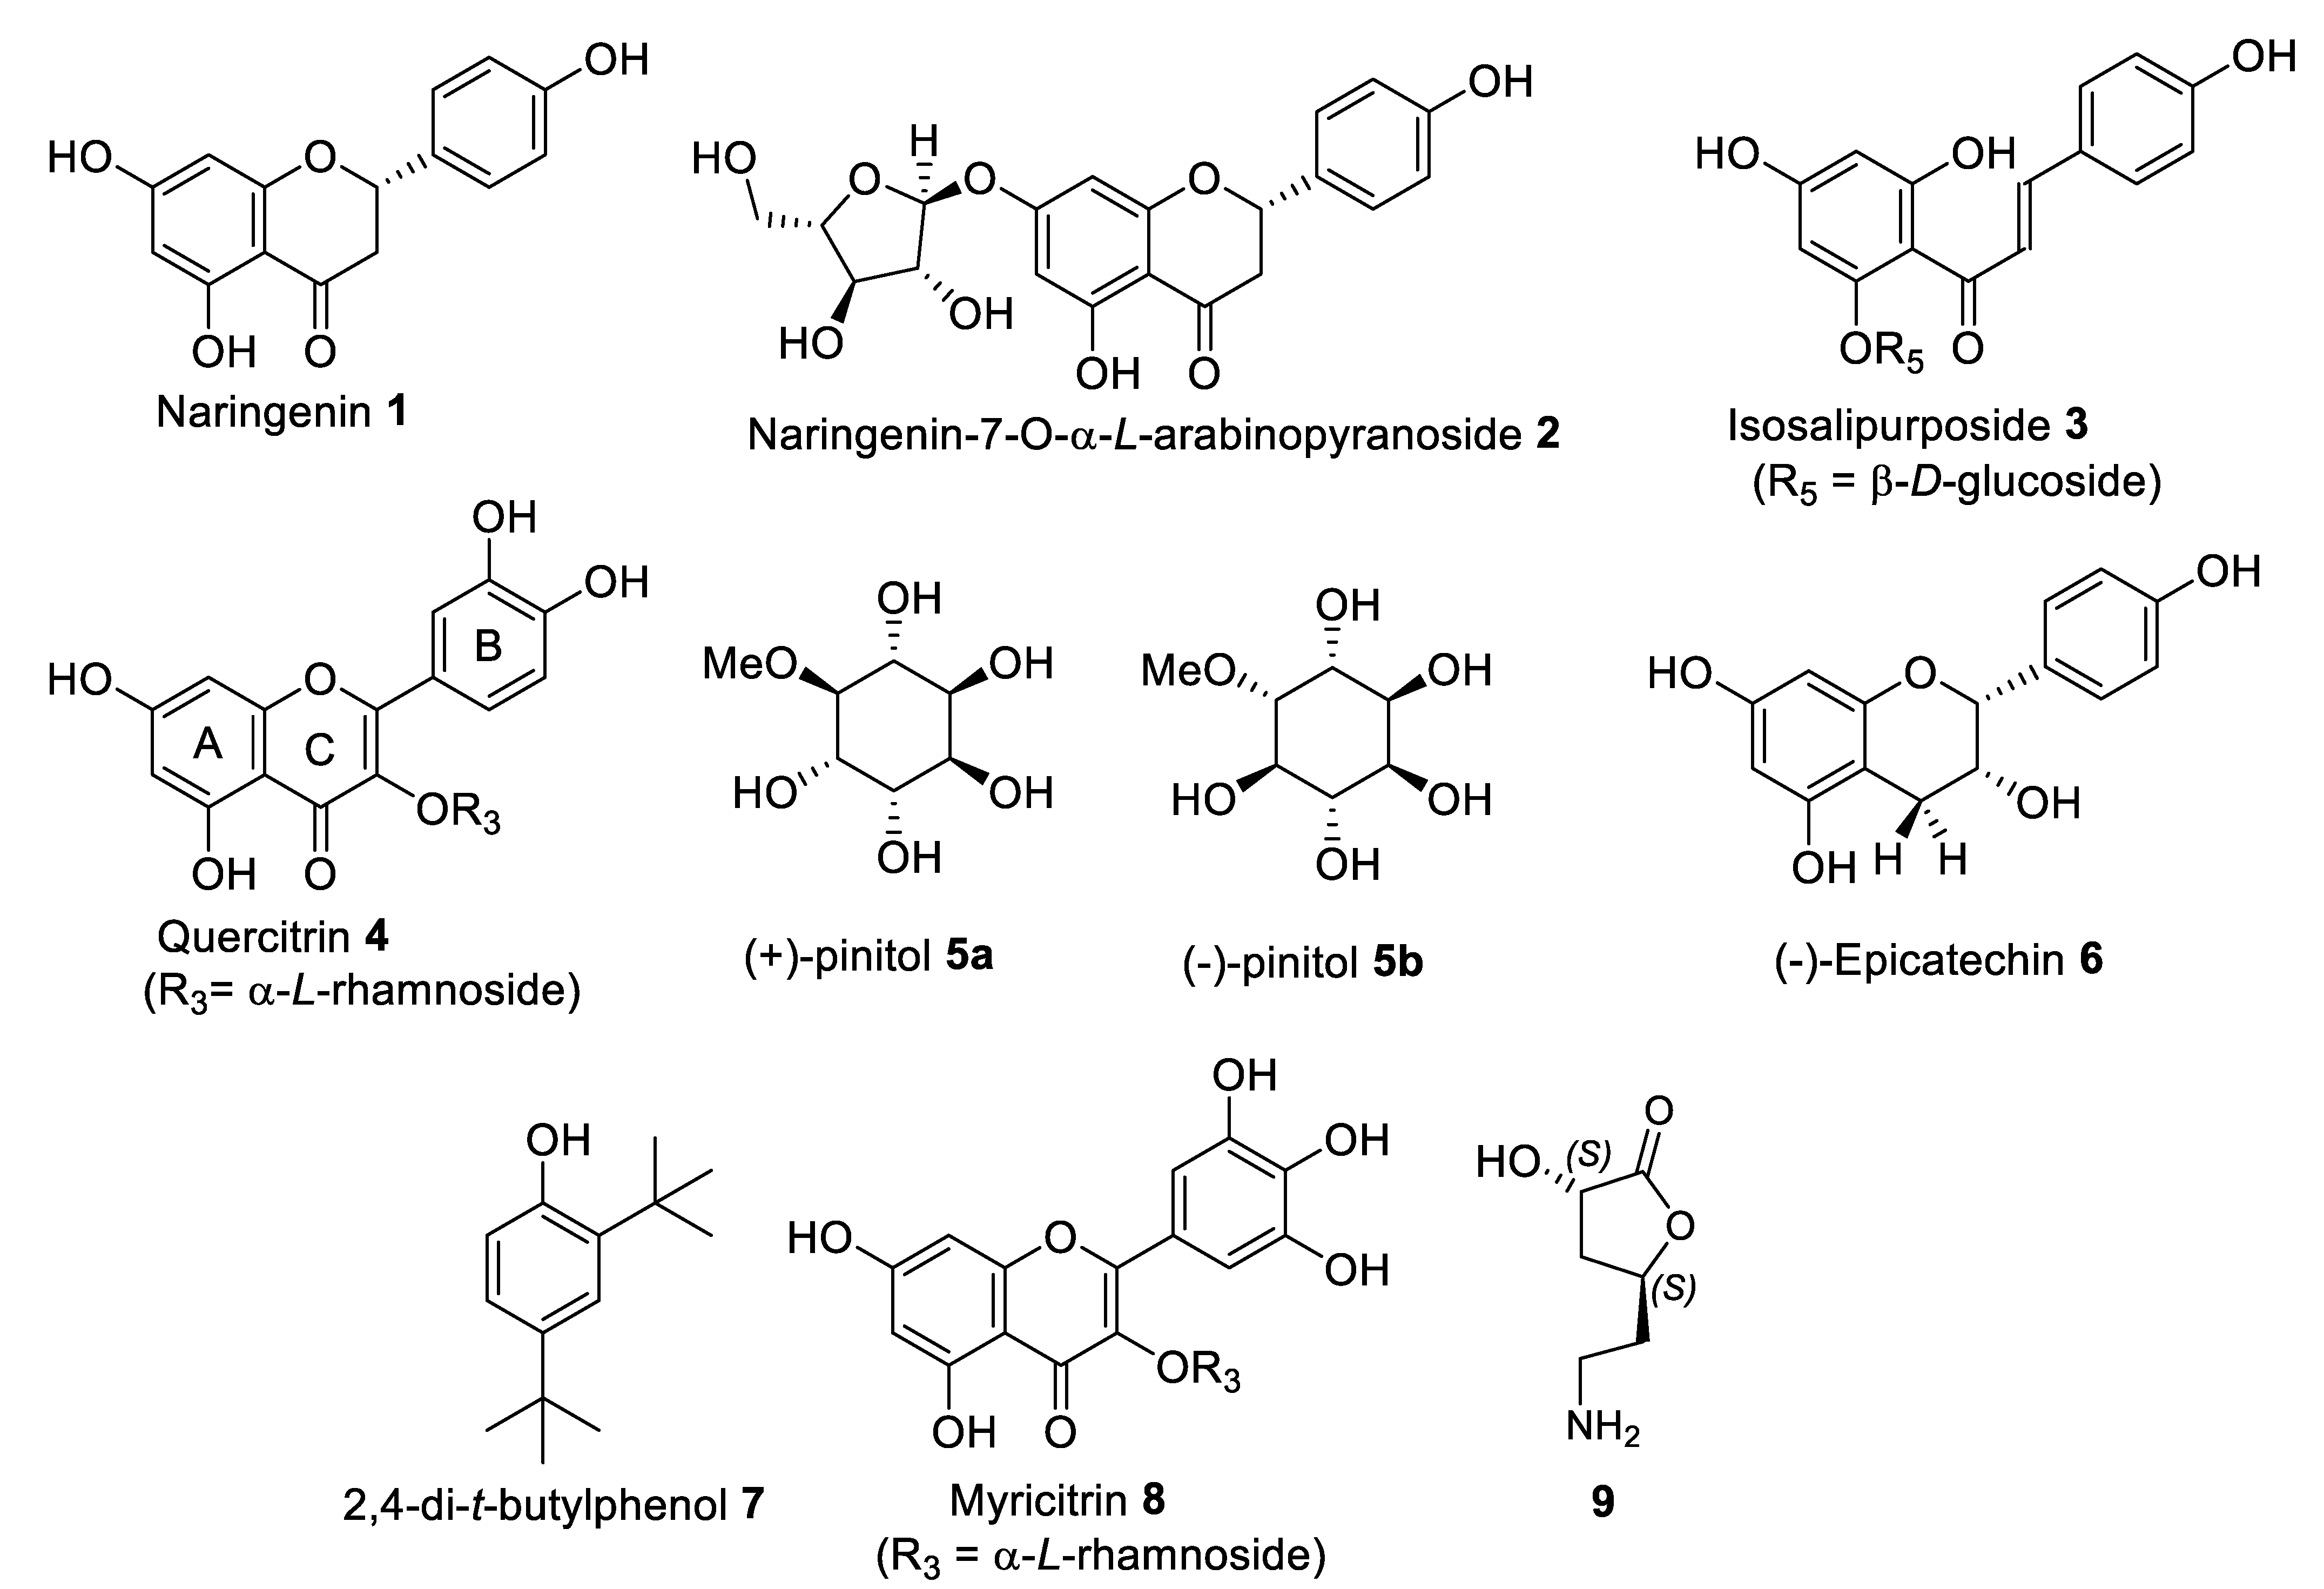
2.5.1. Isolation and Structural Identification of Compounds from FL-MeOH

FL-MeOH has been prioritised for pure compound isolation because of its superior biological activities and non-toxicity. Two successive column purification of FL-MeOH (Supplementary Figure S6) was performed to give five pure fractions.
Fraction FL-MeOH-A1 is a yellow solid. Complete spectral data analysis of FL-MeOH-A1 revealed that it is naringenin 1 (Figure 3). The NMR data provided in Supplementary Table S9 agrees with that reported in the literature [27,28]. The work by Al-Huqail et al. only reported the presence of naringenin 1 in the water extract of A. saligna flowers via their HPLC analysis. Although naringenin 1 has been isolated from other plants [29], it is the first time that we have isolated pure naringenin 1 from the flowers of Australian A. saligna. Our study showed that the specific optical rotation of naringenin 1 was α 23 = −16.68° (c 0.1, EtOH), which is slightly lower than the previous report α 22 = −14.7° (c 0.36, EtOH). This finding confirms the stereochemistry of laevorotatory (−)- or (2S)-flavanone comparable to the reported naringenin 1 [28].
Fraction FL-MeOH-A3 is a bright yellow solid with a melting point of 229–230 °C. The optical rotation of the compound is α 23 = −44.54° (c 0.1, MeOH). Detailed NMR analysis of FL-MeOH-A3 is shown in Table 4. The 13C NMR chemical shifts of the core skeleton of the compound are identified as a naringenin-related core structure [29]. The following data confirm the typical proton peaks of flavanone. An ABX-system comprises the geminal proton of H3a (2.606 ppm, td, J = 17.64, 2.95 Hz, 1H) and H3b (2.946 ppm, m, 1H) coupled to proton H2 (5.255 ppm, td, J = 12.96, 2.8 Hz, 1H) in ring C assigned by COSY relationship (Figure 4a). The p-substituted aromatic ring B is represented by two stronger downfield signals of δ 7.223 ppm (dd, J = 8.56, 3.16 Hz, H2′ and H6′) and δ 6.735 ppm (dd, J = 8.64, 1.96 Hz, H3′ and H5′). The catechol ring A was identified by tiny upfield signals for aromatic at δ 6.406 ppm (d, J = 2.2 Hz, H8) o-coupled to δ 6.059 ppm (d, J = 2.24 Hz, H6).
13C NMR signals of the sugar moiety are similar to those reported for arabinopyranoside structure by Zhang et al. [30]. The anomeric proton of δ 4.694 ppm (d, J = 7.48 Hz, H1″) represented an α-conformation with smaller J constants due to the equatorial-axial relationship of H1″ to H2″. The triplet couple of H3″ (3.375 ppm, J = 8.4 Hz) and H4″ (3.424 ppm, J = 8.08 Hz) with larger J constants represents the equatorial-equatorial relationship as an indication of L-orientation of the sugar moiety. The geminal protons of 3.876 ppm (m, H5a″) and 3.686 ppm (m, H5b″) as the typical signals for a furanose ring. TOCSY NMR experiment confirmed that the sugar is a 5-membered ring.
The attachment of the sugar moiety at 7-O of aromatic ring A was confirmed by C1″-C7 connectivity observed in the 2D HMBC NMR experiment (Figure 4a). Moreover, NOESY NMR (Figure 4b) showed strong cross-peaks between H1″ of the sugar and H8 of aromatic ring A, representing a closer space configuration. The IR spectra gave prominent bands at 3300.70 (OH stretching), 2920.64 (sp3 CH stretching), 1605.11 (C=O carbonyl stretching), 1515.07 (C=C aromatic stretching), and 1021.40 cm−1 (C–O bending). HRMS showed m/z [M + H]+ of 405.1189 with corresponding molecular formula of C20H20O9 (calculated m/z = 405.1186). Our spectral data analysis, therefore, concludes FL-MeOH-A3 to be naringenin-7-O-α-L-arabinopyranoside 2 (Figure 4b), a novel flavanone glycone to be isolated from the flowers of Australian A. saligna.
FL-MeOH-B1b was isolated as a yellow powder. A complete spectral data interpretation (Supplementary Table S10) of FL-MeOH-B1b was confirmed to be isosalipurposide 3 (Figure 3), which agrees with the literature [2,31]. Isosalipurposide 3 was previously isolated from flowers of A. saligna by various groups [2,32,33]. FL-MeOH-B2b was obtained as a yellow powder. Its complete spectral data analysis of this fraction revealed the structure to be quercetin-3-O-rhamnoside, also known as quercitrin 4 (Figure 3). The NMR data of FL-MeOH-B2b (Supplementary Table S11) agrees with that reported in the literature [34]. Quercitrin 4 was previously identified in the leaves [8]; it is noteworthy that this is the first time that quercitrin 4 has been isolated from the flowers of Australian A. saligna.
FL-MeOH-B3b was isolated as a white solid. Complete spectral data analysis (Supplementary Table S12) of this fraction revealed a structure identical to those reported for D-(+)-pinitol 5a (Figure 3). The optical rotation of FL-MeOH-B3b was found to be α 23 = +44.80° (c 0.1, H2O), which is lower than the reported value ( α 23 = +65° (c 0.4, H2O) [35]. This inositol ether was first isolated in the sugar pine (Pinus lambertiana) and could occur in various plants with both enantiomers [36,37]. It was first documented in the related genus A. nilotica [38]. However, it has never been isolated as a single enantiomer of pinitol from A. saligna flower until now. The compound has been reported as an antidiabetic compound [39,40].
Fractions FL-MeOH-A2, -B1a, -B2a, -B3a, and -C (Supplementary Figure S6) were not further purified due to their low quantities and high impurities.

2.5.2. Isolation and Structural Identification of Compounds from LF-MeOH

Pure compound isolation of LF-MeOH (1000 mg) was carried out with the outcome shown in Supplementary Figure S7 to give six pure fractions.
LF-MeOH-A1 is a colourless solid. Complete spectral data analysis of the compound revealed that it is (−)-epicatechin 6 (Figure 3), which has spectroscopic data (Supplementary Table S13) identical to that reported [41]. The isolation of compound 6 from the leaves of A. saligna was previously reported by E-Toumy et al. [7]. However, this study did not provide the compound’s specific optical rotation and absolute stereochemistry. In our work, the optical rotation of LF-MeOH A1 was determined to be α 23 = −69.6 °C (c 0.1, MeOH), identical to the literature value [41] of (−)-epicatechin 6 isolated from other plants.
LF-MeOH-A3 is a yellow solid identified by complete spectral data analysis (Supplementary Table S14) as 2,4-di-t-butylphenol 7 [42,43] (Figure 3). This compound has been known as a natural toxin and isolated from different groups of organisms, including plants, e.g., sweet potatoes [42] and pine trees [44]. However, for the first time, our group isolated it from the leaves of A. saligna. It has also been identified as an antioxidant [45], anticancer, antiviral [46], antibacterial, and antifungal [43]. Moreover, as 2,4-di-t-butylphenol 7 demonstrated allelopathic activities against weeds and lettuces [47,48], this compound could also be linked to the reported herbicide properties of A. saligna. Indeed, previous works have demonstrated the strong allelopathic [5,49,50] and antifungal activities [4] of A. saligna leaves. However, none of those reports identified 2,4-di-t-butylphenol 7 and tested its potential.
LF-MeOH-B2 is a yellow powder, similar to FL-MeOH-B2b, and was fully confirmed by spectral data to be quercitrin 7 (Figure 3).
The LF-MeOH-C2b is a yellow powder. Complete spectral data analysis revealed that C2 is myricetin-3-O-rhamnoside (Myricitrin) 8 (Figure 3). NMR data listed in Supplementary Table S14 are identical to those reported in the literature [51].
The LF-MeOH-C3 was isolated as a white solid. Complete NMR and HRMS analysis initially revealed that this compound is identical to D-(+)-pinitol 5a. However, its optical rotation α 23 = −79.44° (c 0.1, H2O) indicates that LF-MeOH-C3 is the enantiomer (−)-pinitol 5b as shown in Figure 3 ([37] α 20 = −61.5° (c 0.19, H2O). It is known that both enantiomers of pinitol 5 occur in various plants. However, this is the first time both enantiomers were isolated from Australian A saligna. Furthermore, (−)-pinitol 5b was exclusively isolated from the leaves of this plant.
LF-MeOH-D was isolated as a colourless solid. HRMS of the compound showed m/z [M + H]+ 146.0818 corresponding for C6H10NO3 (calculated m/z = 146.0817). The optical rotation of the compound is α 23 = −3.6° (c 0.1, H2O). IR showed strong bands at 3212.08 (OH stretch), 2929.09 (CH sp3), 1707.74 (C=O stretch), and 1053.09 cm−1 (C–O). Its 1H NMR revealed two signals, 1.845 and 4.175 ppm, with integrals of five protons. 13C spectrum revealed six carbons, including a carbonyl (δ 175.271 pm), two CH, and three CH2 (Table 5). The cross-peaks correlation of TOCSY demonstrated three patterns for (1) H5 to H3 and H4 as well as (2) H5 to H6 and H7; and (3) H4 to H3a and H5. HMBC revealed the key correlations, as shown in Figure 5a. This confirms that a five-membered lactone ring is the core of the compound. The aminoethyl substituent attached to the lactone ring at C5 via C6. The second OH group could be at C4 or C3. The chemical shift of C-3 indicates that the OH is appropriately attached to C3. NOESY NMR analysis (Figure 5b) showed strong crossed peaks between H3-H4a and H5-H4b, indicating that H5 is trans to H3. Our spectral data analysis, therefore, concludes LF-MeOH-D to be (3S,5S)-3-hydroxy-5-(2-aminoethyl)-dihydrofuran-2(3H)-one 9 or the (3R,5R)-enantiomer (Figure 5c). It is for the first time being isolated as a natural product from the leaves of A. saligna. Nothing in the literature indicates that compound 9 is a known natural product. The absolute configuration of 9 at C3 and C5 can be further confirmed by an X-ray crystallographic study or NMR analysis of Mosher diastereomeric esters of compound 9.
Fractions LF-MeOH-A2, -B1, -B3, -C1, C2a, and -C2c (Supplementary Figure S7) were not further purified as they are insufficient in quantity and purity.

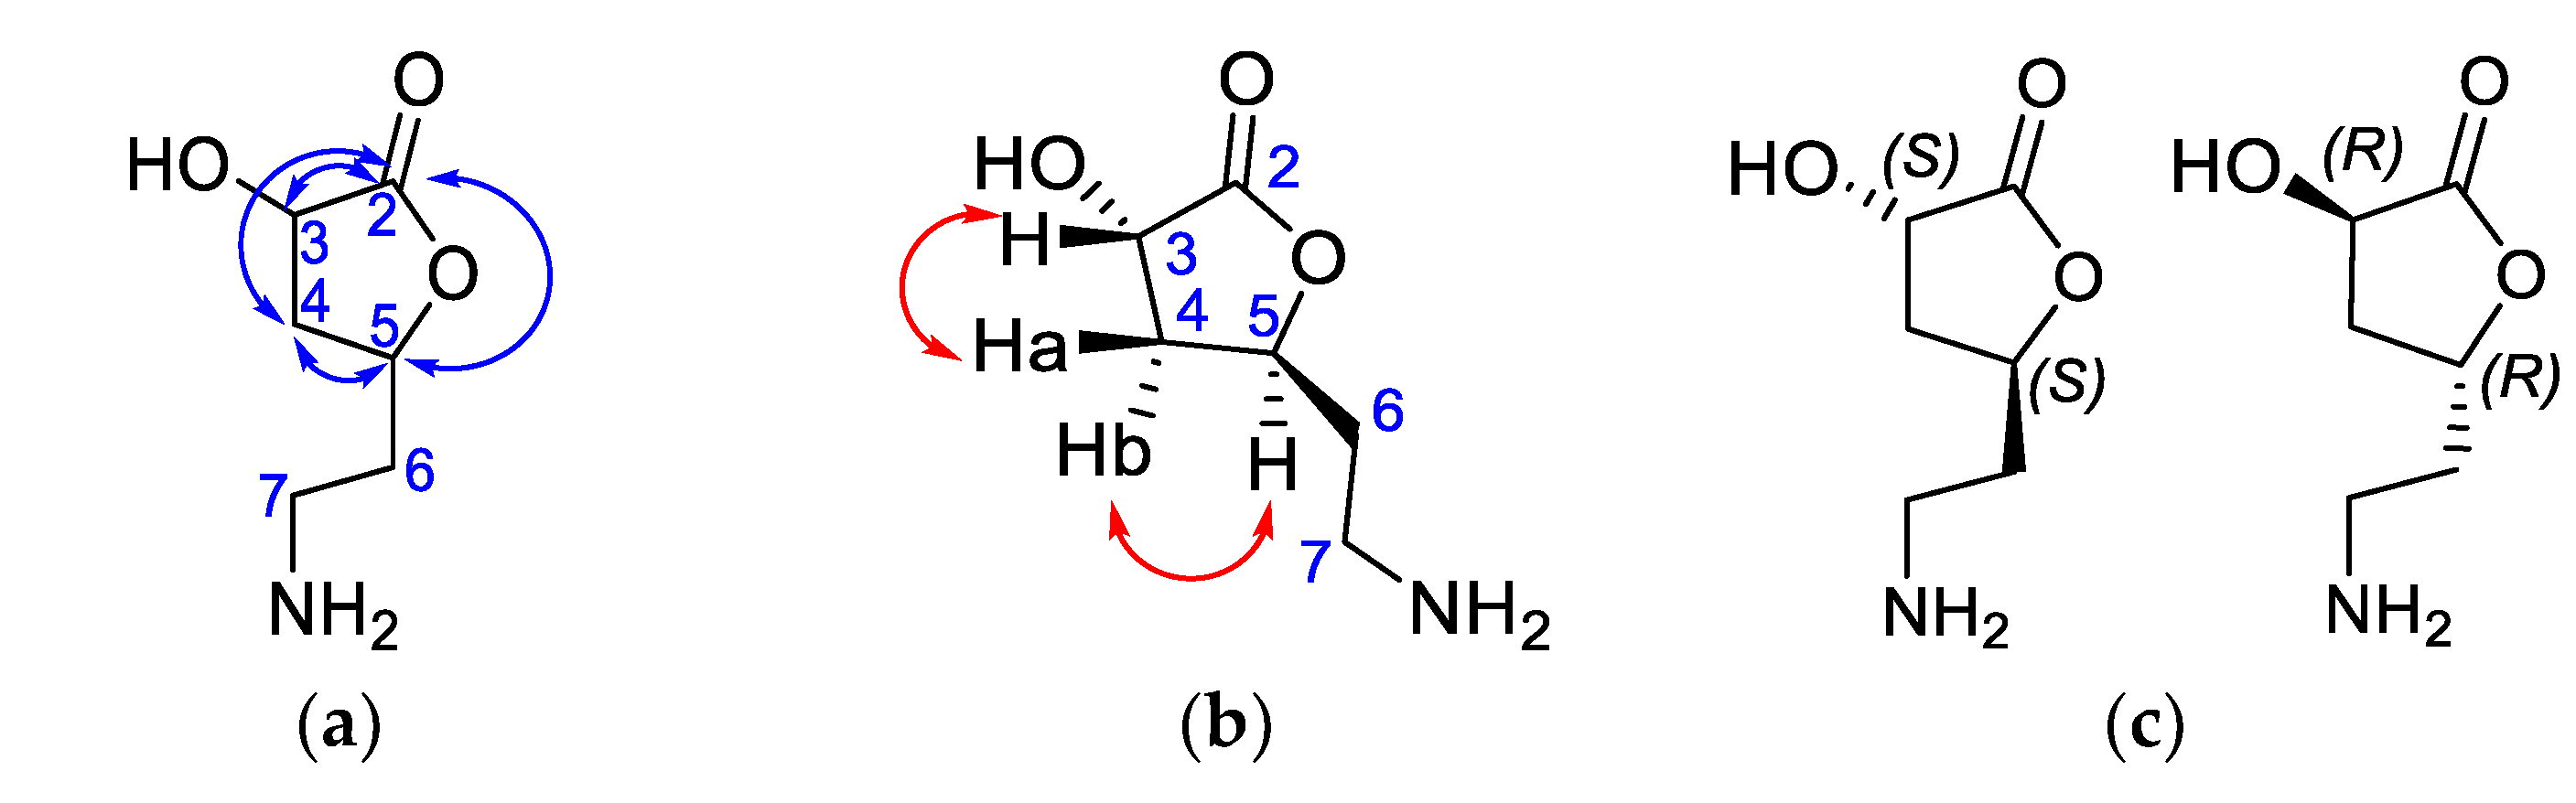
2.5.3. Isolation and Structural Identification of Compounds from BK-MeOH

Three main subfractions, BK-MeOH-A1, -B2, and -C2, were isolated (Supplementary Figure S8) from BK-MeOH (300 mg). The NMR data of BK-MeOH-A1 (2.53% w/w) were identified as (−)-epicatechin 6 (Figure 3). BK-MeOH-B2 (17.83% w/w) is the major component isolated from BK-MeOH, which was assigned to be D-(+)-pinitol 5a. To our surprise, a disaccharide, sucrose, was identified as the component of BK-MeOH-C2 (8.33% w/w) by NMR spectral analysis (Supplementary Table S16). The discovery of D-(+)-pinitol 5a in the flowers and the barks and only (−)-pinitol 5b in the leaves of A. saligna is intriguing. In summary, the presence of these compounds is new from the barks of Australia A. saligna.

2.6. Biological Activities of Isolated Compounds

2.6.1. Scavenging Activities of Isolates against DPPH and ABTS Free Radicals

Out of 10 isolated compounds, only (−)-epicatechin 6, quercitrin 4, and myricitrin 8 showed consistently potent antioxidant activities against DPPH and ABTS free radicals (Table 6). On the other hand, the IC50 of naringenin 1; naringenin-7-O-α-L-arabinopyranose 2; 2,4-di-t-butylphenol 7, and 3-hydroxy-5-(2-aminoethyl)-dihydrofuran-2(3H)-one 9 did not reach 50% at the highest tested concentration (10 mM) in the DPPH assay (Supplementary Table S17).
Naringenin 1, naringenin-7-O-α-L-arabinopyranose 2, and 2,4-di-t-butylphenol 7 demonstrated a weaker neutralising activity against ABTS●+ cation radicals (Table 6) than those of the three flavonoid derivatives. The activity of compound 9 was neglectable as its scavenging percentage remains under 50% even up to 10,000 μM. The lacking π-π conjugation OH groups required to donate H or an electron and the possibility of forming radical resonance intermediates [52,53]; that naringenin 1, compound 2, 5b, 7, and 9 performed poorly and inconsistently across against DPPH and ABTS free radicals (Supplementary Tables S17 and S18).
IC50 values reported in the literature obtained from similar DPPH methods; revealed that myricitrin 8 was active with the IC50 ranging from 2.8 to 165.75 µM [51,54]. While (−)-epicatechin 6 was active with IC50 in the range of 10.8 to 103.4 µM [55,56]. Similarly, the works by Li et al. [57] and Hong et al. [58] showed that quercitrin 4 has IC50 values in the range of 4.45 and 107.5 µM. While naringenin 1 was found to have poor activity by Cai et al. [52] with IC50 of 2 mM. Isosalipurposide 3 was also shown to be active with an IC50 of 81.9 µM in the DPPH assay [2]. These findings, including ours, reiterate that IC50 values are considerably variable.
The presence of quercitrin 4 (4.13% w/w) and perhaps naringenin 1 (1.75% w/w) and isosalipuposide 3 (1.52% w/w) in FL-MeOH supports the activity exerted by this extract.
The presence of the three active antioxidants, namely (−)-epicatechin 6 (0.9% w/w), quercitrin 4 (2.86% w/w), myricitrin 8 (5% w/w), logically supports the activity of LF-MeOH observed in both DPPH and ABTS assays. Quercitrin 4 and myricitrin 8 were also found in the leaf extract of Egyptian A. saligna [8]. The potent antioxidant activity of the leaf extract reported by Elansary et al. [4] was extensively exerted by many other flavonoids and polyphenols in the extract, as indicated in their HPLC analysis.
BK-MeOH extract is the most active in both DPPH and ABTS assays (Table 2). However, only 2.53% w/w of active (−)-epicatechin 6 is present in this extract, in which D-(+)-pinitol 5a (17.83% w/w) is the main component. In this case, the presence of (−)-epicatechin 6 may partly explain the high activity exerted by BK-MeOH in both assays. The inconsistent activities of D-(+)-pinitol 5a found between DPPH and ABTS assays would inadequately support the activity exerted by BK-MeOH. GC-MS analysis of BK-MeOH (Supplementary Table S19) revealed the presence of cinnamic acid, lamitol, D-asparagine, and thymidine-5′-monophosphate. However, these compounds do not have the antioxidant activity to support the observed antioxidant activity in BK-MeOH adequately. In comparison, the antioxidant activity of Egyptian crude ethanolic bark extract was reported to be (IC50 = 10.1 µg/mL) [10]. The potent activity of their bark extract is attributed to the presence of antioxidant compounds such as naringenin 1, kaempferol, rutin, gallic acid, vanillin acid, caffeic acid, ferulic acid, and chlorogenic acid.

2.6.2. α-Glucosidase Inhibition of Isolated Compounds

The yeast α-glucosidase inhibitory activities of isolated compounds were determined using the same procedure for the extracts. The dose-response inhibitory activities of isolated compounds are presented in Supplementary Figure S9 and Table S20. The IC50 values of isolated compounds are shown in Table 7. (−)-Epicatechin 6 (IC50 = 63.58 ± 11.83 μM), D-(+)-pinitol 5a (IC50 = 74.69 ± 0.226 μM), naringenin 1 (IC50 = 89.71 ± 10.22 μM), isosalipurposide 3 (IC50 = 116.5 ± 26.40 μM), (−)-pinitol 5b (IC50 = 164.2 ± 8.362 μM), and quercitrin 4 (IC50 = 177.3 ± 11.34 μM) inhibited the enzyme better than compounds 2, 7, 8, and the positive control, acarbose. In comparison, compound 9 showed no inhibition against the enzyme across the range of test concentrations. It is noteworthy that D-(+)-pinitol is a potent inhibitor and is 2-fold more active than its enantiomer (−)-pinitol 5b. It is important to note that acarbose has been reported to exert more inhibitory activity against mammalian α-glucosidase enzyme than the yeast enzyme. Pacillia et al. [59] reported that naringenin 2 displayed an effective inhibition against the yeast enzyme (IC50 6.51 μM). However, it was poorly active (IC50 384 μM) when tested on the rat intestinal glucosidase. They also reported that the positive control acarbose inhibited the rat α-glucosidase more effectively than the yeast enzyme. Therefore, further investigation is required to confirm the inhibitory activity of our extracts and active compounds against the mammalian α-glucosidase enzyme.
The inhibitory activity of (−)-epicatechin 6 against α-glucosidase was reported to have IC50 values in the range of 0.95 µM to 12.3 mM [56,60,61]. For naringenin 3, variable IC50 values were also observed in the range of 6.51 to 75 μM [59,62]. Furthermore, the literature indicates that the reported IC50 values of these compounds and other flavonoids are dispersed and variable [63].
The structure-activity relationships (SAR) investigation carried out by Proença et al. [63] suggested that flavonoids with two phenolic groups at the A or B ring and a hydroxy group at C3 possessed the highest α-glucosidase inhibitory activity. He et al. [64] and Şöhretoğlu et al. [20] further reiterated that the number of phenolic groups on ring B is vital for the activity. Their docking study indicated that the B ring of the flavonoids located deep inside the active side of the enzyme and the presence of the phenolics significantly improved interactions via hydrogen bonding. On the other hand, bulky flavonoid glycosides showed poor inhibition due to their inability to access the binding pocket, which explains the poor activity of 2, quercitrin 4, myricitrin 8 and 9. D-(+)-pinitol is a cyclic polyol known to have highly beneficial effects on inflammation and related diseases, such as T2D [65]. To the best of our knowledge, it is for the first time that both enantiomers of pinitol were shown to be inhibitors against the yeast α-glucosidase enzyme.
It is noteworthy that D-(+)-pinitol 5a (17.83% w/w) is the principal component in BK-MeOH and would be the main contributor to the α-glucosidase inhibitory activity observed in the BK-MeOH (IC50 = 4.37 ± 0.24 μg/mL) in combination from (−)-epicatechin 6 (2.53% w/w). BK-H2O (IC50 = 23.27 ± 3.88 μg/mL) was also active. However, NMR analysis of this fraction revealed that it contains mainly sucrose. Sucrose is a known α-glucosidase substrate [66]; it might outcompete the intended substrate (p-nitrophenyl-β-D-glucopyranose, pNPG) of the assay, resulting in the lower concentration of yellow-coloured p-nitrophenol cleaved by the enzyme. Therefore, the observed inhibitory activity of BK-H2O is more likely associated with a fault-positive inhibition.
(−)-Pinitol 5b (8% w/w), (−)-epicatechin 6 (0.9% w/w), and quercitrin 4 (2.86% w/w) contribute to inhibitory activity exerted by LF-MeOH (IC50 = 38.69 ± 1.01 μg/mL). In FL-MeOH, D-(+)-pinitol 5a (2.5% w/w), and three mid-range active compounds, namely naringenin 1 (1.75%, w/w), isosalipurposide 1 (1.52% w/w), and quercitrin 4 (4.13% w/w) are the main contributors to the activity found in FL-MeOH (IC50 = 34.93 ± 2.67 μg/mL).

3. Materials and Methods

3.1. General Experimental for Phytochemical Analysis

Isolated pure compounds were structure characterised by specific optical rotation (Jasco P-2000 Polarimeter, Easton, MD, USA), melting point (Gallenkamp apparatus, Apeldoorn, The Netherlands), GCMS (Agilent 6890GC coupled with Agilent 5973n MS (EI), Santa Clara, CA, USA), FTIR (Nicolet-FTIR 6700, Waltham, MA, USA), HRMS (Agilent 6510 QTOF MS (ESI), Santa Clara, CA, USA), 1D and 2D NMR (Bruker 400 MHz, Billerica, MA, USA and Agilent 500 MHz, Santa Clara, CA, USA). Silica gel 60 Å/40–63 µm particle size for flash chromatography, silica gel (SiO2) 60 F254-coated Thin Layer Chromatography (TLC) aluminium sheets, deuterium oxide (D2O), and methanol-d4 were supplied by Sigma-Aldrich (St. Louis, MO, USA). The solvents used in the analytical grade were n-hexane, methanol, ethyl acetate, dichloromethane, and formic acid.

3.2. Sample Collection and Identification

The samples, including leaves, flowers, and stem barks, were collected from 12 Tasman Street, Kurnell, Sutherland Shire, NSW (34°00′48.2″ S 151°12′27.7″ E) on 7 October 2019. The taxonomy of the plant was determined by Andrew Orme (voucher number BIS 21186), a technical identification officer from the National Herbarium of NSW, as Acacia saligna (Labill.) H.L.Wendl. The materials were washed with water, air-dried for a week, and finely powdered. The extraction applied sequential extraction with gradually increasing polarity of the solvents: n-hexane (hex), dichloromethane (DCM), methanol (MeOH), and water (H2O) in a shaker over 48 h at 30 °C, as shown in Supplementary Figure S1.

3.3. Sequential Extraction of Plant Parts

The method of extraction was adapted from Subhan [23]. Each extraction was carried out without repetition. Dried flower in powder form (250 g) was first soaked in hexane (1 L) with shaking (80 rpm) at RT for 48 hr, followed by vacuum filtration of the mixture. The resulting filtrate was concentrated under reduced pressure at 35 °C to give FL-hex extract (1.71 g). The solid residue was then air-dried at RT for 12 h and then soaked in dichloromethane (1 L) with the same conditions as above. The resulting filtrate was concentrated under reduced pressure at 35 °C to give FL-DCM extract (1.79 g). The process was repeated for methanol and water to provide the FL-MeOH (26.17 g) and FL-H2O (36.31 g). Sequential extraction of dried leaves (250 g) was carried out using the same steps to give LF-hex (3.08 g), LF-DCM (4.98 g), LF-MeOH (25.37 g), and LF-H2O (13.32 g), while the sequential extraction of dried barks (250 g) provided BK-hex (0.68 g), BK-DCM (2.12 g), BK-MeOH (18.26 g), and BK-H2O (4.34 g), as shown in the Supplementary Figure S1.

3.4. General Fractionation Method of Each Methanolic Extract of A. saligna

The methanolic extract from flowers, FL-MeOH (600 mg), was fractionated into three main fractions, namely FL-MeOH-A (109 mg), FL-MeOH-B (206 mg), and FL-MeOH-C (40 mg), as shown in Supplementary Figure S6, with silica gel 60 (Sigma-Aldrich, USA) column chromatography by which and DCM/MeOH (95:5, 90:10, 85:15, and 80:20) was the mobile phase. The selected fraction was then further purified using the same method with a combination of EtOAc/MeOH (100:0, 95:5, and 90:10) eluent system adapted from with a minor modification to afford another three sub-fractions. Successive column purification of fraction A using the gradient EtOAc/MeOH mobile phase gave two pure FL-MeOH-A1 (10.5 mg, 1.75% w/w) and FL-MeOH-A3 (15.5 mg, 2.58% w/w). In comparison, FL-MeOH-B provided three pure FL-MeOH-B1b (9.13 mg, 1.52% w/w) -B2b (24.77 mg, 4.13% w/w), and -B3b (15 mg, 2.5% w/w) as shown in Supplementary Figure S6.

3.5. Fractionation of LF-MeOH

Pure compound isolation of LF-MeOH (1000 mg) was carried out using the above method, with the outcome shown in Supplementary Figure S7. LF-MeOH-D was isolated in pure form (50 mg, 5% w/w), while fractions A, B, and C underwent further purification using a gradient EtOH/MeOH eluent system to give five pure sub-fractions: LF-MeOH A1 (9 mg, 0.9% w/w), LF-MeOH-A3 (10 mg, 1% w/w), LF-MeOH-B2 (28.6 mg, 2.86% w/w), LF-MeOH-C2b (50 mg, 5% w/w) and LF-MeOH-C3 (80 mg, 8% w/w).

3.6. Fractionation of BK-MeOH

BK-MeOH (300 mg) was purified using EtOAc/MeOH (100:0; 95:5, and 90:10) eluent system to give three main fractions (Supplementary Figure S8), BK-MeOH-A1 (7.6 mg, 2.53% w/w), BK-MeOH-B2 (53.5 mg, 17.83% w/w), and BK-MeOH-C2 (25 mg, 8.33% w/w) were isolated.

3.7. Spectral Data Analysis

Naringenin 1: FL-MeOH-A1 (10.5 mg, 1.75% w/w) is a yellow solid: IR (νmax, cm−1) 3246.22 (-OH), 2919.77 (sp3 CH), 1709.65 (C=O), 1597.51 (C=C aromatic), and 1013.25 cm−1 (C–O); HRMS (EI) m/z 273.0684 [M + H], cald for C15H12O5 273.0685; m.p. 253–255 °C. α 23 = −16.68° (c 0.1, EtOH) [lit. [67] α 22 = −14.7 (c 0.36, EtOH)]. For complete NMR analysis, see Supporting information (Supplementary Table S9).
Naringenin-7-O-α-L-arabinopyranoside 2: FL-MeOH-A3 (15.5 mg, 2.58% w/w) is yellow powder: IR (νmax, cm−1) 3300.70 (-OH stretching), 2920.64 (sp3 CH stretching), 1710 C=O), 1605.11 (C=C), and 1021.40 cm−1 (C–O); HRMS (EI) m/z 405.1189 [M + H], cald C20H20O9 405.1186; m.p. 229–230 °C. α 23 = −44.54° (c 0.1, MeOH). For a complete NMR analysis, see Table 3.
Isolisalipurposide 3: FL-MeOH-B1b is a yellow powder (9.13 mg, 1.52% w/w): IR (νmax, cm−1) 3255.08 (-OH), 2930.83 (sp3 CH), 1601.61 (C=O), 1550.28 (C=C), and 1070.60 cm−1 (C–O); HRMS (EI) m/z 435.1298 [M + H], cald C21H22O10 435.1291; m.p. 174–175 °C; α 23 = −119.02° (c 0.1, MeOH). For a complete NMR analysis, see Supplementary Table S10.
Quercitrin 4: FL-MeOH-B2b (24.77 mg, 4.13% w/w) and LF-MeOH-B2 (28.6 mg, 2.86 w/w) are the same isolated as yellow solids: IR (νmax, cm−1) 3248.57 (-OH), 2936.97 (sp3 CH), 1652.71 (C=O), 1499.15 (C=C), 1198.56, and 1070.60 cm−1 (C–O); HRMS(EI) m/z 449.1072 [M + H], cald C21H21O11 449.1084; m.p. 180–183 °C; α 23 = −120.86o (c 0.1, MeOH). For a complete NMR analysis, see Supplementary Table S11.
D-(+)-Pinitol 5a: FL-MeOH-B3b (15 mg, 2.5% w/w) and BK-MeOH-B2 (53.5 mg, 17.83% w/w) are the same, isolated as white solids: IR (νmax, cm−1) 3328.27 (-OH), 2918.85 (sp3 CH), and 1034.21 cm−1 (C–O); HRMS (EI) m/z 195.0865 [M + H]+, cald C7H14O6 195.0869; m.p. 171–172 °C; α 23 = +44.80° (c 0.1, H2O) [lit. [37] α 23 = +69.7° (c 0.56, MeOH)]. For full NMR analysis, see Supplementary Table S12.
(−)-Pinitol 5b: LF-MeOH-C3 (80 mg, 8%) a white solid: IR (νmax, cm−1) 3389.09 (-OH), 3302.90 and 2907.93 (sp3 CH), 1068.27 and 1070.60 cm−1 (C–O); HRMS (EI) m/z 195.0863 [M + H], cald C7H14O6 195.0869; m.p. 175–177 °C; α 23 = −79.44° (c 0.1, H2O) [lit. [37] α 20 = −61.5° (c 0.19, H2O)]. For full NMR analysis, see Supplementary Table S12.
(−)-Epicatechin 6: LF-MeOH A1 (9 mg, 0.9%) and BK-MeOH-A1 (7.6 mg, 2.53%) are the same, isolated as colourless solids: IR (νmax, cm−1) 3220.47 (-OH); 2919.54 (sp3 CH); 1604.73 (C=C); and 1031.13 cm−1 (C–O); HRMS (EI) m/z 291.0858 [M + H]+ cald C15H14O6 291.0869; m.p. 240–243 °C; α 23 = −69.6 oC (c 0.1, MeOH) [lit. [45] α 23 = −69.7° (c 0.56, MeOH)]. For full NMR analysis, see Supplementary Table S13.
2,4-di-t-butylphenol 7: LF-MeOH-A3 (10 mg, 1% w/w) is a yellow solid: IR (νmax, cm−1) 3330.29 (-OH), 2921.70 (sp3 CH), 1592.96 (C=C, aromatic), and 1029.41 cm−1 (C–O); HRMS (EI) m/z 207.1662 [M + H], cald C14H22O 207.1749; m.p. 61–62 °C. For full NMR analysis, see Supplementary Table S14.
Myricetin 3-O-rhamnoside (myricitrin) 8: LF-MeOH-C2b (50 mg, 5% w/w) is a yellow powder: IR (νmax, cm−1) 3266.81 (-OH), 2930.51 (sp3 CH), 1652.84 (C=O), 1499.04 (C=C aromatic), 1197.39 and 1070.60 cm−1 (C–O); HRMS (EI) m/z 465.1037 [M + H], cald C21H20O12 465.1033; m.p. 193–195 °C; α 23 = −246.32° (c 0.1, MeOH). For a complete NMR analysis, see Supplementary Table S15.
(3S*,5S*)-3-Hydroxy-5-(2-aminoethyl) dihydrofuran-2(3H)-one 9: LF-MeOH-D (50 mg, 5% w/w) a colourless solid: IR (νmax, cm−1) 3212.08 (OH), 2929.09 (sp3 CH), 1707.74 (C=O) and 1053.09 (C-O), HRMS (EI) m/z 146.0818 [M + H]+ cald C6H10O4 146.0817; m.p. 347–350 °C. α 23 = −3.6° (c 0.1, H2O). For a full NMR analysis, see Table 4.
Sucrose: BK-MeOH-C2 (25 mg, 4.1% w/w). For full NMR analysis, see Supplementary Table S16.

3.8. Biological Assay

Materials

All chemicals used in this assay were of analytical grade. Absolute ethanol was provided by Point of Care Diagnostics (North Rocks, NSW, Australia). Ascorbic acid was purchased from Merck (Darmstadt, Germany). 2,2-di(4-tert-octylphenyl)-1-picrylhydrazyl (DPPH), 2,2′-azino-bis-(3-ethylbenzothiazoline-6-sulphonic acid (ABTS), an α-glucosidase enzyme (EC-No.: 232-604-7) from Saccharomyces cerevisiae (lyophilised powder, 23 units/mg), 4-nitrophenyl α-D-glucopyranoside (p-NPG, ≥99%), acarbose (99%), Dulbecco’s Modified Eagle’s Medium High Glucose (DMEM), bovine calf serum (BCS), penicillin, streptomycin, glutamine (PSG), fetal bovine serum (FBS), rosiglitazone, dexamethasone, 3-isobutyl-1-methylxanthine (IBMX), insulin, phosphate-buffered saline (PBS), (3-(4,5 dimethylthiazol-2-yl)-2, 5 diphenyltetrazolium bromide) (MTT), trypsin-EDTA solution 0.25%, and dimethylsulfoxide (DMSO) were purchased from Sigma-Aldrich (St. Louis, MO, USA). The 3T3-L1 murine cell line was supplied by American Type Tissue Culture/ATCC (Manassas, VA, USA).

3.9. DPPH Scavenging Assay

The DPPH-free radical scavenging study based on a 96-well plate reading approach was performed following Jiang et al. [68] and Chen et al. [69] with slight modifications. Briefly, a 180 µL of DPPH 0.2 mM ethanolic solution was pipetted into each well (Corning, New York City, NY, USA), followed by 20 µL of ethanolic solution of extracts or ascorbic acid in a different concentration and, for the blank solution, 20 µL of ethanol. The blank extract and the blank positive solution were prepared by adding 180 µL of ethanol into 20 µL of samples and ascorbic acid solution. The plate was then incubated in a dark condition for 30 min at 30 °C. The absorbance was observed using a microplate reader (Tecan Infinite M1000 PRO, Männedorf, Switzerland) at 517 nm. The percentage of DPPH scavenging activity was determined by:
DPPH   scavenging   activity   % = 1 A 1 A 2 A 0 × 100 %  
A0 is the absorbance of the blank solution (DPPH 0.2 mM + EtOH), A1 is the absorbance of the sample (sample + DPPH 0.2 mM), and A2 is the absorbance of the blank sample (sample in EtOH).
The value was then converted into IC50 (µg/mL) from a graph correlating the sample concentration (mg/mL) and DPPH scavenging activity (%). The results were expressed as mean ± standard error mean (SEM) of three separate experiments (n = 3). The descriptive statistics are analysed in GraphPad Prism 8 (San Diego, CA, USA).

3.10. ABTS●+ Radical Decolourisation Assay

The ABTS●+ solution was prepared by generating a reaction between ABTS 7 mM and potassium persulfate 2.45 mM (1:1 of v/v) at room temperature for 16–18 h [70]. The ABTS●+ solution was further diluted to achieve an acceptable measurement at 734 nm [71]. The same experimental procedure used in the DPPH radical scavenging assay was applied to measure the percentage of ABTS●+ radical scavenging. The absorbance was observed using a microplate reader (Tecan Infinite M1000 PRO, Männedorf, Switzerland) at 734 nm.

3.11. In Vitro Assay of Yeast α-Glucosidase Inhibition

The enzyme deactivation assay was carried out following the modified microplates method adapted from Ning et al. [72]. A volume of 20 µL of the plant extract in different concentrations or acarbose solution (31.25 to 1000 µg/mL), isolates or acarbose solution (31.25 to 1000 µM), or solvent control was mixed with α-glucosidase (40 µL, 0.075 U/mL in potassium phosphate buffer solution (100 mM, pH 6.8) in 96-well polystyrene plates (Corning, New York City, NY, USA) and then incubated for 15 min at 37 °C. Afterwards, p-NPG solution in the buffer solution (40 µL, 1 mM) was added to the mixture, followed by further incubation for 30 min at 37 °C. The reaction was terminated by adding Na2CO3 solution (100 μL, 200 mM) to the wells. The spectrophotometric observation was then conducted to determine the absorbance of p-nitrophenol released from the reaction under 405 nm wavelength in a microplate reader (Tecan Infinite M1000 PRO, Männedorf, Switzerland). The percentage of inhibition was calculated from the following formula:
Percentage   of   inhibition   % = A c A s A c × 100 %  
where Ac is the absorbance of the solvent control and enzymatic reaction system and As is the absorbance of the sample with the enzymatic reaction system. The inhibitory activity was expressed in the value of half minimal inhibitory concentration (IC50).

3.12. Differentiation of 3T3-L1 Preadipocytes into Adipocytes

The 3T3-L1 preadipocytes (70–80% confluent from a culture flask) were grown in a 96-well microtiter plate (3 × 10³ cells/well in 100 µL final volume of basal medium 1 (M1 = 90% DMEM, 9% BCS, and 1% PSG) and incubated for 48 h in a humid condition (37 °C& 5% CO2) for adherence of the cells. After 48 h, the old M1 was replaced with new M1, and the cells were incubated for another 48 h (day −2 to 0) to get 100% confluent. The M1 was replaced by an identical volume of M2 (9% FBS, 1% PSG, and 90% DMEM containing rosiglitazone 2 µM, dexamethasone 2.2 mM, IBMX 500 mM, and insulin 4 mg/mL) followed by incubation for 48 h (day 0 to 2). After incubation and M2 removal at day 2 of differentiation, new M3 (90% DMEM, 9% FBS, 1% PSG, and insulin) was added, followed by incubation to day 6 with medium replacement every 48 h. On day six, M3 was replaced by M4 (90% DMEM, 9% FBS, and 1% PSG), followed by another 48 h of incubation, as shown in Table 8 below.

3.13. Effects of Extracts on the Viability of 3T3-L1 Adipocytes

The differentiated 3T3-L1 cells grown in three 96-well microtiter plates (Corning, New York City, NY, USA) were exposed to 100 μL of fresh test solution containing flower, leaf, and bark extracts in a range of concentration of 25–200 μg/mL and incubated for a further 24, 48, and 72 h. After incubation, the solution was replaced with 100 μL of fresh medium containing 10 % MTT solution (5 mg/mL in PBS). The treated cells were then incubated for an additional 4 h. Once finished the last incubation, the MTT solution was replaced by 100 μL of DMSO to solubilise the formazan crystal products. The absorbance was measured at the wavelength of 570 via a multiwell plate reader (Tecan Infinite M1000 PRO, Männedorf, Switzerland). Each concentration was performed twice times whereby each experiment was conducted in triplicate. The percentage of cell viability is expressed in the:
Cell   viability   ( % )   =   absorbance   of   sample absorbance   of   control ×   100 %

3.14. Statistical Method

The results were expressed as mean ± standard error mean (SEM) of three independent experiments (n = 3). The results were analysed using a one-way analysis of variance (ANOVA) with Tukey’s or Dunnett’s post hoc test using GraphPad Prism 8 (Boston, MA, USA). The difference was considered significant at p < 0.05.

4. Conclusions

Our approach in using sequential polarity-based extraction of A. saligna parts and bioactivity-guided fractionation has fast-tracked the identification of bioactive compounds in A. saligna. Isolation of pure compounds in the active methanolic extracts was greatly simplified, evidenced by the requirement of one or two successive steps in column chromatography. Through this effort, we have successfully isolated ten compounds of different categories. They are (i) isosalipurposide 3, myricitrin 8, and (−)-epicatechin 6 as known compounds isolated from A. saligna; (ii) naringenin 1 and quercitrin 4 as known compounds to exist in A. saligna; however, being isolated in pure form in this work, (iii) D-(+)-pinitol 5a, (−)-pinitol 5b and 2,4-di-t-butylphenol 7 as known natural products found elsewhere, however, are new to this plant, and (iv) naringenin-7-O-α-L-arabinopyranose 2 and (3S*,5S*)-3-hydroxy-5-(2-aminoethyl) dihydrofuran-2(3H)-one 9 as two novel natural products. The antioxidant and α-glucosidase inhibitory activities of the isolated compounds, especially (−)-epicatechin 6, naringenin 1, and D-(+)-pinitol 5b, quercitrin 4, and myricitrin 8, support the activities observed in our methanolic extracts and the reported activities of crude extracts of A. saligna. The presence of 2,4-di-t-butylphenol 7 may also help to explain the reported allelopathic and antifungal activities of A. saligna. The outcome of this study indicates the potential of A. saligna as a rich source of bioactive compounds for drug discovery targeting T2D.

Supplementary Materials

The following supporting information can be downloaded at: https://www.mdpi.com/article/10.3390/molecules28031028/s1. Figure S1: Sequential extraction of A. saligna’s plant parts; Tables S1 and S2: DPPH scavenging activity of the extracts of A. Saligna; Tables S3 and S4: ABTS●+ scavenging activity of the extracts of A. Saligna; Table S5a,b & Figure S2: Percentage of α-glucosidase inhibition (%) of FL-MeOH; Table S6a,b & Figure S3: Percentage of α-glucosidase inhibition (%) of LF-MeOH; Table S7a,b & Figure S4: Percentage of α-glucosidase inhibition (%) of BK-MeOH; Table S8 & Figure S5: Percentage of α-glucosidase inhibition (%) of acarbose; Figure S6: Schematic fractionation of FL-MeOH extract of A. saligna; Table S9: NMR data of FL-MeOH-A1 compared to reported naringenin 1; Table S10: NMR data of FL-MeOH-B1b compared to reported isosalipurposide 3; Table S11: NMR data FL-MeOH-B2b compared to reported quercitrin 4; Table S12: NMR data of FL-MeOH-B3b compared to reported D-pinitol 5a; Figure S7: Schematic of fractionation of LF-MeOH extract of A. saligna; Table S13: NMR data of LF-MeOH-A1 compared to reported (-)-epicatechin 6; Table S14: NMR data of LF-MeOH-A3 compared to 2,4-di-t-buylphenol 7; Table S15: NMR data of LF-MeOH-C2b compared to reported myricitrin 8; Figure S8: Schematic fractionation of BK-MeOH extract of A. saligna; Table S16: NMR data of BK-MeOH-C compared to reported sucrose; Table S17: The DPPH scavenging properties of the isolated compounds; Table S18: The ABTS●+ scavenging properties of the isolated compounds; Table S19: GC analysis of BK-MeOH; Figure S9: Inhibitory activity of isolated compounds against the α-glucosidase; Table S20: Inhibitory activity of the isolated compounds against the α-glucosidase enzyme.

Author Contributions

Conceptualisation, A.T.U. and A.P.A.; methodology, A.T.U., A.P.A. and A.P.; validation, A.T.U., A.P.A. and A.P.; formal analysis, A.P.A.; investigation, A.P.A.; data curation, A.P.A.; writing—original draft preparation, A.T.U. and A.P.A.; review and editing, A.T.U., A.P.A., T.T. and A.P.; supervision, A.T.U., A.P. and T.T.; project administration, A.T.U. All authors have read and agreed to the published version of the manuscript.

Funding

This research was funded by the Ministry of Religious Affairs and Indonesian Endowment Funds for Education: SK Dirjen Diktis No. 5379/2019.

Institutional Review Board Statement

Not applicable.

Informed Consent Statement

Not applicable.

Data Availability Statement

Data is contained within the article.

Acknowledgments

APA gratefully acknowledges The Ministry of Religious Affairs and the Indonesian Endowment Funds for Education for providing the scholarship. APA would like to thank the University of Technology Sydney for the Research Training Program. APA also like to thank the Faculty of Science and Technology, Universitas Islam Negeri Ar-Raniry for supporting his Ph.D. study at UTS. The authors would like to thank the University of Technology of Sydney for supporting this study.

Conflicts of Interest

The authors declare no conflict of interest.

Sample Availability

Samples of the compounds are not available from the authors.

References

  1. Orchard, A.E.; Wilson, A.G. Flora of Australia: Volume 11B, Mimosaceae, Acacia Part 2; CSIRO: Melbourne, Australia, 2001; p. 475. [Google Scholar]
  2. Ghribia, L.; Ghouilaa, H.; Omrib, A.; Besbesb, M.; Ben Janneta, H. Antioxidant and anti–acetylcholinesterase activities of extracts and secondary metabolites from Acacia cyanophylla. Asian Pac. J. Trop. Biomed. 2014, 4, S417–S423. [Google Scholar] [CrossRef] [PubMed] [Green Version]
  3. Al-Huqail, A.A.; Behiry, S.I.; Salem, M.Z.; Ali, H.M.; Siddiqui, M.H.; Salem, A.Z. Antifungal, antibacterial, and antioxidant activities of Acacia saligna (Labill.) HL Wendl. flower extract: HPLC analysis of phenolic and flavonoid compounds. Molecules 2019, 24, 700. [Google Scholar] [CrossRef] [PubMed] [Green Version]
  4. Elansary, H.O.; Szopa, A.; Kubica, P.; Ekiert, H.; Al-Mana, F.A.; Al-Yafrsi, M.A. Antioxidant and biological activities of Acacia saligna and Lawsonia inermis natural populations. Plants 2020, 9, 908. [Google Scholar] [CrossRef] [PubMed]
  5. El Ayeb-Zakhama, A.; Sakka-Rouis, L.; Bergaoui, A.; Flamini, G.; Jannet, H.B.; Harzallah-Skhiri, F. Chemical composition and allelopathic potential of essential oils obtained from Acacia cyanophylla Lindl cultivated in Tunisia. Chem. Biodivers. 2015, 12, 615–626. [Google Scholar] [CrossRef]
  6. Kaouthar, J.; Fakhfakh, L.M.; Siddique, K.H.; Hessini, K. Effect of Acacia saligna (Labill.) Wendl. extracts on seed germination and seedling performance of three native Mediterranean shrubs. Bot. Lett. 2022, 169, 51–60. [Google Scholar]
  7. El-Toumy, S.A.; Salib, J.; Mohamed, W.; Morsy, F. Phytochemical and antimicrobial studies on Acacia saligna leaves. Egypt J. Chem. 2010, 53, 705–717. [Google Scholar]
  8. Gedara, S.R.; Galala, A.A. New cytotoxic spirostane saponin and biflavonoid glycoside from the leaves of Acacia saligna (Labill.) HL Wendl. Nat. Prod. Res. 2014, 28, 324–329. [Google Scholar] [CrossRef]
  9. Gumgumjee, N.M.; Hajar, A.S. Antimicrobial efficacy of Acacia saligna (Labill.) HL Wendl. and Cordia sinensis Lam. leaves extracts against some pathogenic microorganisms. Int. J. Microbiol. Immunol. Res 2015, 3, 51–57. [Google Scholar]
  10. Salem, M.Z.M.; Mohamed, A.; Ali, H.; Al Farraj, D. Characterization of Phytoconstituents from Alcoholic Extracts of Four Woody Species and Their Potential Uses for Management of Six Fusarium oxysporum Isolates Identified from Some Plant Hosts. Plants 2021, 10, 1325. [Google Scholar] [CrossRef]
  11. Buttner, D.H.; Reddy, S.; Koekemoer, T.; van de Venter, M. An in vitro assessment of the potential antidiabetic activity and cytotoxic effects of ethanolic and aqueous extracts from three invasive Australian acacias. S. Afr. J. Bot. 2021, 141, 1–11. [Google Scholar] [CrossRef]
  12. Shaer, E. Utilization of Acacia saligna as livestock fodder in arid and semi-arid areas in Egypt. Cah. Options Mediterr. 2000, 45, 213–217. [Google Scholar]
  13. Mousa, M. Effect of feeding acacia as supplements on the nutrient digestion, growth performance, carcass traits and some blood constituents of Awassi lambs under the conditions of North Sinai. Asian J. Anim. Sci. 2011, 5, 102–117. [Google Scholar] [CrossRef] [Green Version]
  14. Gebru, G.; Tesfay, Y. Utilization of wheat bran and dried Acacia saligna (Labill) HL Wendl leaves by highland rams. Afr. J. Agric. Res. 2017, 12, 1286–1292. [Google Scholar]
  15. El-Toumy, S. Flavonoids from Acacia saligna leaves and Evaluation of Antihyperglycaemic Effect of Aqueous Extract. Planta Med. 2006, 72, P_004. [Google Scholar] [CrossRef]
  16. Leahy, J.L.; Hirsch, I.B.; Peterson, K.; Schneider, D.; Schneider, D. Targeting β-cell function early in the course of therapy for type 2 diabetes mellitus. J. Clin. Endocr. Metab. 2010, 95, 4206–4216. [Google Scholar] [CrossRef] [PubMed]
  17. Glastras, S.J.; Chen, H.; Teh, R.; McGrath, R.T.; Chen, J.; Pollock, C.A.; Wong, M.G.; Saad, S. Mouse models of diabetes, obesity and related kidney disease. PLoS ONE 2016, 11, e0162131–e0162146. [Google Scholar] [CrossRef] [Green Version]
  18. Houstis, N.; Rosen, E.D.; Lander, E.S. Reactive oxygen species have a causal role in multiple forms of insulin resistance. Nature 2006, 440, 944–948. [Google Scholar] [CrossRef]
  19. Ghani, U. Re-exploring promising α-glucosidase inhibitors for potential development into oral anti-diabetic drugs: Finding needle in the haystack. Eur. J. Med. Chem. 2015, 103, 133–162. [Google Scholar] [CrossRef]
  20. Şöhretoğlu, D.; Sari, S. Flavonoids as alpha-glucosidase inhibitors: Mechanistic approaches merged with enzyme kinetics and molecular modelling. Phytochem. Rev. 2020, 19, 1081–1092. [Google Scholar] [CrossRef]
  21. Zreen, Z.; Hameed, A.; Kiran, S.; Farooq, T.; Zaroog, M.S. A Comparative Study of Diospyros malabarica (Gaub) Extracts in Various Polarity-Dependent Solvents for Evaluation of Phy-toconstituents and Biological Activities. BioMed Res. Int. 2022, 2022, 4746223. [Google Scholar] [CrossRef]
  22. Zohra, T.; Ovais, M.; Khalil, A.T.; Qasim, M.; Ayaz, M.; Shinwari, Z.K. Extraction optimisation, total phenolic, flavonoid contents, HPLC-DAD analysis and diverse pharmacological evaluations of Dysphania ambrosioides (L.) Mosyakin & Clemants. Nat. Prod. Res. 2019, 33, 136–142. [Google Scholar]
  23. Subhan, N. Phytochemical and Pharmacological Investigations of Australian Acacia: An Ethnomedicine-Guided Bioprospective Approach; Charles Sturt University: Bathurst, Australia, 2016. [Google Scholar]
  24. Chatatikun, M.; Chiabchalard, A. Thai plants with high antioxidant levels, free radical scavenging activity, anti-tyrosinase and anti-collagenase activity. BMC Complement. Altern. Med. 2017, 17, 487. [Google Scholar] [CrossRef] [Green Version]
  25. Zheng, J.; Huang, C.; Yang, B.; Kallio, H.; Liu, P.; Ou, S. Regulation of phytochemicals in fruits and berries by environmental variation—Sugars and organic acids. J. Food Biochem. 2019, 43, e12642–e12660. [Google Scholar] [CrossRef]
  26. Ruiz-Ojeda, F.J.; Rupérez, A.I.; Gomez-Llorente, C.; Gil, A.; Aguilera, C.M. Cell models and their application for studying adipogenic differentiation in relation to obesity: A review. Int. J. Mol. Sci. 2016, 17, 1040. [Google Scholar] [CrossRef] [Green Version]
  27. Du, Q.; Jerz, G.; Winterhalter, P. Preparation of three flavonoids from the bark of Salix alba by high-speed countercurrent chromatographic separation. J. Liq. Chromatogr. Relat. Technol. 2004, 27, 3257–3264. [Google Scholar] [CrossRef]
  28. Andersen, O.M.; Markham, K.R. Flavonoids: Chemistry, Biochemistry and Applications, 1st ed.; CRC press: Boca Raton, FL, USA, 2005; pp. 10–13. [Google Scholar]
  29. Olsen, H.T.; Stafford, G.I.; van Staden, J.; Christensen, S.B.; Jäger, A.K. Isolation of the MAO-inhibitor naringenin from Mentha aquatica L. J. Ethnopharmacol. 2008, 117, 500–502. [Google Scholar] [CrossRef]
  30. Zhang, Z.; ElSohly, H.N.; Li, X.-C.; Khan, S.I.; Broedel, J.S.E.; Raulli, R.E.; Cihlar, R.L.; Walker, L.A. Flavanone glycosides from Miconia trailii. J. Nat. Prod. 2003, 66, 39–41. [Google Scholar] [CrossRef]
  31. Hendra, R.; Willis, A.; Keller, P.A. Phytochemical studies on the Australian native plant species Acacia pycnantha and Jacaranda mimosifolia D. Don. Nat. Prod. Res. 2019, 33, 1997–2003. [Google Scholar] [CrossRef] [Green Version]
  32. Imperato, F. A new chalcone glucoside and isosalipurposide from Acacia cyanophylla. Phytochemistry 1978, 17, 822–823. [Google Scholar] [CrossRef]
  33. Ghouila, H.; Meksi, N.; Haddar, W.; Mhenni, M.; Jannet, H. Extraction, identification and dyeing studies of Isosalipurposide, a natural chalcone dye from Acacia cyanophylla flowers on wool. Ind. Crop. Prod. 2012, 35, 31–36. [Google Scholar] [CrossRef]
  34. Kim, Y.-K.; Kim, Y.S.; Choi, S.U.; Ryu, S.Y. Isolation of flavonol rhamnosides from Loranthus tanakae and cytotoxic effect of them on human tumor cell lines. Arch. Pharmacal Res. 2004, 27, 44–47. [Google Scholar] [CrossRef] [PubMed]
  35. Raya-Gonzalez, D.; Pamatz-Bolanõs, T.; del Rio-Torres, R.E.; Munõz, R.E.M.; Ron-Echeverria, O.; Martinez-Pacheco, M.M. D-(+)-pinitol, a component of the heartwood of Enterolobium cyclocarpum (Jacq.). Z. Naturforsch. C J. Biosci. 2008, 63, 922–924. [Google Scholar] [CrossRef] [PubMed]
  36. Anderson, A.B.; MacDonald, D.; Fischer, H.O. The structure of pinitol. J. Am. Chem. Soc. 1952, 74, 1479–1480. [Google Scholar] [CrossRef]
  37. Hudlicky, T.; Price, J.D.; Rulin, F.; Tsunoda, T. Efficient and Enantiodivergent Synthesis of (+)- and (−)-Pinitol. J. Am. Chem. Soc. 1990, 112, 9439–9440. [Google Scholar] [CrossRef]
  38. Chaubal, R.; Pawar, P.V.; Hebbalkar, G.D.; Tungikar, V.B.; Puranik, V.G.; Deshpande, V.H.; Deshpande, N.R. Larvicidal Activity of Acacia nilotica Extracts and Isolation of D-Pinitol–A Bioactive Carbohydrate. Chem. Biodivers. 2005, 2, 684–688. [Google Scholar] [CrossRef] [PubMed]
  39. Bates, S.H.; Jones, R.B.; Bailey, C.J. Insulin-like effect of pinitol. Br. J. Pharmacol. 2000, 130, 1944–1948. [Google Scholar] [CrossRef]
  40. Yap, A.; Nishiumi, S.; Yoshida, K.-I.; Ashida, H. Rat L6 myotubes as an in vitro model system to study GLUT4-dependent glucose uptake stimulated by inositol derivatives. Cytotechnology 2007, 55, 103–108. [Google Scholar] [CrossRef] [Green Version]
  41. Kim, H.J.; Lee, J.Y.; Kim, S.M.; Park, D.-A.; Jin, C.; Hong, S.P.; Lee, Y.S. A new epicatechin gallate and calpain inhibitory activity from Orostachys japonicus. Fitoterapia 2009, 80, 73–76. [Google Scholar] [CrossRef]
  42. Belghit, S.; Driche, E.; Bijani, C.; Zitouni, A.; Sabaou, N.; Badji, B.; Mathieu, F. Activity of 2, 4-Di-tert-butylphenol produced by a strain of Streptomyces mutabilis isolated from a Saharan soil against Candida albicans and other pathogenic fungi. J. Mycol. Med. 2016, 26, 160–169. [Google Scholar] [CrossRef] [Green Version]
  43. Dharni, S.; Sanchita; Maurya, A.; Samad, A.; Srivastava, S.K.; Sharma, A.; Patra, D.D. Purification, characterisation, and in vitro activity of 2,4-di-tert-butylphenol from Pseudomonas monteilii PsF84: Conforma-tional and molecular docking studies. J. Agric. Food Chem. 2014, 62, 6138–6146. [Google Scholar] [CrossRef]
  44. Zhao, F.; Wang, P.; Lucardi, R.; Su, Z.; Li, S. Natural sources and bioactivities of 2,4-di-tert-butylphenol and its analogs. Toxins 2020, 12, 35. [Google Scholar] [CrossRef] [Green Version]
  45. Varsha, K.K.; Devendra, L.; Shilpa, G.; Priya, S.; Pandey, A.; Nampoothiri, K.M. 2,4-Di-tert-butyl phenol as the antifungal, antioxidant bioactive purified from a newly isolated Lactococcus sp. Int. J. Food Microbiol. 2015, 211, 44–50. [Google Scholar] [CrossRef]
  46. Khiralla, A.; Spina, R.; Varbanov, M.; Philippot, S.; Lemiere, P.; Slezack-Deschaumes, S.; André, P.; Mohamed, I.; Yagi, S.M.; Laurain-Mattar, D. Evaluation of antiviral, antibacterial and antiproliferative activities of the endophytic fungus Curvularia papendorfii, and isolation of a new polyhydroxyacid. Microorganisms 2020, 8, 1353. [Google Scholar] [CrossRef]
  47. Chuah, T.; Norhafizah, M.; Ismail, B. Evaluation of the biochemical and physiological activity of the natural compound, 2,4-ditert-butylphenol on weeds. Crop Pasture Sci. 2015, 66, 214–223. [Google Scholar] [CrossRef]
  48. Huang, X.; Chao, L.; Jiang, P.; Zhang, X.; Zhang, X.; Qin, P.; Tian, W. Identification of chrysanthemum root exudates and allelopathic effects of the three plants. Hubei Agric. Sci. 2017, 56, 1061–1071. [Google Scholar]
  49. Abd El Gawad, Y.; El-Amier, A. Allelopathy and potential impact of invasive Acacia saligna (Labill.) wendl. on plant diversity in the Nile delta coast of Egypt. Int. J. Environ. Res. 2015, 9, 923–932. [Google Scholar]
  50. Kamel, M.; Hammad, S.A. The Allelopathic Effect of the Exotic Tree Acacia saligna on the Germination of Wheat and Canola. Ecol. Balk. 2015, 7, 103–112. [Google Scholar]
  51. Hwang, I.W.; Chung, S.K. Isolation and identification of myricitrin, an antioxidant flavonoid, from daebong persimmon peel. Prev. Nutr. Food Sci. 2018, 23, 341. [Google Scholar] [CrossRef]
  52. Cai, R.; Li, X.; Chen, B.; Xie, Y.; Xie, H.; Chen, D. Antioxidant change in biosynthesis from naringenin chalcone to flavonoid apingenin. Chem. Sel. 2019, 4, 5155–5159. [Google Scholar] [CrossRef]
  53. Ouyang, X.; Li, X.; Lu, W.; Zhao, X.; Chen, D. A null B-ring improves the antioxidant levels of Flavonol: A comparative study between Galangin and 3, 5, 7-Trihydroxychromone. Molecules 2018, 23, 3083. [Google Scholar] [CrossRef] [Green Version]
  54. Domitrović, R.; Rashed, K.; Cvijanović, O.; Vladimir-Knežević, S.; Škoda, M.; Višnić, A. Myricitrin exhibits antioxidant, anti-inflammatory and antifibrotic activity in carbon tetrachloride-intoxicated mice. Chem.-Biol. Interact 2015, 239, 21–28. [Google Scholar] [CrossRef] [PubMed]
  55. Chen, W.; Zhu, X.; Lu, Q.; Zhang, L.; Wang, X.; Liu, R. C-ring cleavage metabolites of catechin and epicatechin enhanced antioxidant activities through intestinal microbiota. Food Res. Int. 2020, 135, 109271–109281. [Google Scholar] [CrossRef] [PubMed]
  56. Miao, J.; Li, X.; Zhao, C.; Gao, X.; Wang, Y.; Gao, W. Active compounds, antioxidant activity and α-glucosidase inhibitory activity of different varieties of Chaenomeles fruits. Food Chem. 2018, 248, 330–339. [Google Scholar] [CrossRef] [PubMed]
  57. Li, X.; Jiang, Q.; Wang, T.; Liu, J.; Chen, D. Comparison of the antioxidant effects of quercitrin and isoquercitrin: Understanding the role of the 6″-OH group. Molecules 2016, 21, 1246. [Google Scholar] [CrossRef]
  58. Hong, C.-O.; Lee, H.A.; Rhee, C.H.; Choung, S.-Y.; Lee, K.-W. Separation of the antioxidant compound quercitrin from Lindera obtusiloba Blume and its antimelanogenic effect on B16F10 melanoma cells. Biosci. Biotechnol. Biochem. 2013, 77, 58–64. [Google Scholar] [CrossRef] [Green Version]
  59. Priscilla, D.; Roy, D.; Suresh, A.; Kumar, V.; Thirumurugan, K. Naringenin inhibits a-glucosidase activity: A promising strategy for the regulation of postprandial hy-perglycemia in high fat diet fed streptozotocin induced diabetic rats. Chem.-Biol. Interact. 2014, 210, 77–85. [Google Scholar] [CrossRef]
  60. Zhang, L.-L.; Han, L.; Yang, S.-Y.; Meng, X.-M.; Ma, W.-F.; Wang, M. The mechanism of interactions between flavan-3-ols against a-glucosidase and their in vivo antihyperglycemic effects. Bioorg. Chem. 2019, 85, 364–372. [Google Scholar] [CrossRef]
  61. Gong, T.; Yang, X.; Bai, F.; Li, D.; Zhao, T.; Zhang, J.; Sun, L.; Guo, Y. Young apple polyphenols as natural α-glucosidase inhibitors: In vitro and in silico studies. Bioorg. Chem. 2020, 96, 103625–103635. [Google Scholar] [CrossRef]
  62. Tadera, K.; Minami, Y.; Takamatsu, K.; Matsuoka, T. Inhibition of alpha-glucosidase and alpha-amylase by flavonoids. J. Nutr. Sci. Vitaminol. 2006, 52, 149–153. [Google Scholar] [CrossRef]
  63. Proença, C.; Freitas, M.; Ribeiro, D.; Oliveira, E.; Sousa, J.; Tomé, S.; Ramos, M.; Silva, A.; Fernandes, P.; Fernandes, E. α-Glucosidase inhibition by flavonoids: An in vitro and in silico structure–activity relationship study. J. Enzym. Inhib. Med. Chem. 2017, 32, 1216–1228. [Google Scholar] [CrossRef] [Green Version]
  64. He, C.; Liu, X.; Jiang, Z.; Geng, S.; Ma, H. Interaction Mechanism of Flavonoids and α-Glucosidase: Experimental and Molecular Modelling Studies. Foods 2019, 8, 355. [Google Scholar] [CrossRef] [PubMed] [Green Version]
  65. Sánchez-Hidalgo, M.; León-González, A.J.; Gálvez-Peralta, M.; González-Mauraza, N.H.; Martin-Cordero, C. D-Pinitol: A cyclitol with versatile biological and pharmacological activities. Phytochem. Rev. 2021, 20, 211–224. [Google Scholar] [CrossRef]
  66. Matsui, T.; Tanaka, T.; Tamura, S.; Toshima, A.; Tamaya, K.; Miyata, Y.; Tanaka, K.; Matsumoto, K. α-Glucosidase inhibitory profile of catechins and theaflavins. J. Agric. Food Chem. 2007, 55, 99–105. [Google Scholar] [CrossRef]
  67. Giorgio, E.; Parrinello, N.; Caccamese, S.; Rosini, C. Non-empirical assignment of the absolute configuration of (−)-naringenin, by coupling the exciton analysis of the circular dichroism spectrum and the ab initio calculation of the optical rotatory power. Org. Biomol. Chem. 2004, 2, 3602–3607. [Google Scholar] [CrossRef]
  68. Jiang, Y.; Li, D.; Ma, X.; Jiang, F.; He, Q.; Qiu, S.; Li, Y.; Wang, G. Ionic liquid–ultrasound-based extraction of biflavonoids from Selaginella helvetica and investigation of their antioxidant activity. Molecules 2018, 23, 3284. [Google Scholar] [CrossRef] [Green Version]
  69. Chen, Z.G.; Bishop, K.S.; Tanambell, H.; Buchanan, P.; Smith, C.; Quek, S.Y. Characterisation of the bioactivities of an ethanol extract and some of its constituents from the New Zealand native mushroom Hericium novae-zealandiae. Food Funct. 2019, 10, 6633–6643. [Google Scholar] [CrossRef]
  70. Konan, K.; Le Tien, C.; Mateescu, M. Electrolysis-induced fast activation of the ABTS reagent for an antioxidant capacity assay. Anal. Methods 2016, 8, 5638–5644. [Google Scholar] [CrossRef]
  71. Re, R.; Pellegrini, N.; Proteggente, A.; Pannala, A.; Yang, M.; Rice-Evans, C. Antioxidant activity applying an improved ABTS radical cation decolorization assay. Free Radic. Biol. Med. 1999, 26, 1231–1237. [Google Scholar] [CrossRef]
  72. Ning, Z.-W.; Zhai, L.-X.; Huang, T.; Peng, J.; Hu, D.; Xiao, H.-T.; Wen, B.; Lin, C.-Y.; Zhao, L.; Bian, Z.-X. Identification of α-glucosidase inhibitors from cyclocarya paliurus tea leaves using UF-UPLC-Q/TOF-MS/MS and molecular docking. Food Funct. 2019, 10, 1893–1902. [Google Scholar] [CrossRef]
Figure 1. (a) The dose-response curve of the inhibitory activity of BK-MeOH against DPPH, (b) The dose-response curve of the inhibitory activity of BK-MeOH against ABTS●+. Each point represents the average of triplicate measurements.
Molecules 28 01028 g001
Figure 2. Bar charts of the percentage of viability of 3T3-L1 adipocytes treated with (a) FL-MeOH, (b) LF-MeOH, and (c) BK-MeOH extracts (ANOVA, Dunnett, n = 3, ** p = 0.003 of treatment with FL-MeOH for 72 h against the vehicle control (0.1% DMSO)).
Molecules 28 01028 g002
Figure 3. Isolated compounds from FL-OH, LF-OH, and BK-OH extracts.
Molecules 28 01028 g003
Figure 4. (a) key COSY () proton-to-proton connection and HMBC () correlation, (b) NOESY () information of naringenin-7-O-α-L-arabinopyranoside 2.
Molecules 28 01028 g004
Figure 5. Structural assignment for LF-MeOH-D, 9. (a) HMBC () correlation, (b) NOESY () information, and (c) two possible conformations of 9.
Molecules 28 01028 g005
Table 1. The result of the extraction of the flowers, leaves, and barks of A. saligna.
Type of ExtractMass of Extract (g), Colour
Dried Flowers (FL)Dried Leaves (LF)Dried Barks (BK)
Hexane (hex)1.71, yellow3.08, dark green0.68, yellow
Dichloromethane (DCM)1.79, green4.98, green2.12, green
Methanol (MeOH)26.16, yellow25.37, green-yellow18.26, yellow
Water (H2O)36.31, yellow13.32, yellow4.34, yellow
Table 2. Antioxidant activities expressed in IC50 between methanolic flowers, leaves, and barks extract of A. saligna and vitamin C in DPPH and ABTS●+ scavenging assay, **** p < 0.0001 of the indicated extracts against vitamin C (n = 3, ANOVA, Tukey).
ExtractsIC50 (µg/mL)
DPPH AssayABTS●+ Assay
FL-MeOH331.5 ± 17.21 ****316.6 ± 11.45 ****
LF-MeOH190.1 ± 59.15 ****146.7 ± 0.99
BK-MeOH94.24 ± 19.8955.44 ± 6.84
Vitamin C49.97 ± 10.7672.25 ± 4.42
Table 3. IC50 values of active extracts from flowers, leaves, and barks of A. saligna and acarbose against yeast α-glucosidase, *** p = 0.0004 of FL-MeOH extract vs. acarbose; **** p < 0.0001 were inhibition of the LF-MeOH, BK-MeOH, and BK-H2O extracts vs. acarbose (n = 3, ANOVA, Dunnett).
ExtractsIC50 (µg/mL)
FL-MeOH34.93 ± 2.67 ***
LF-hex285.5 ± 100.9
LF-MeOH38.69 ± 1.01 ***
BK-hex289.9 ± 29.17
BK-MeOH4.37 ± 0.24 ****
BK-H2O23.27 ± 3.88 ****
Acarbose254 ± 22.18
Table 4. The 1- and 2-D NMR data of naringenin-7-O-α-L-arabinopyranoside 2 (FL-MeOH-A3 in CD3OD).
ID1H (δ ppm, m, J in Hz, Integration)δ 13C (ppm)COSYTOCSYNOESYHMBC(C→H) a
25.35 (td; 12.96, 2.8; 1H)80.48H3a H3bH3a, H3bH3b (strong), H3a (weak)C4, C2′, C6′
3a2.70 (td; 17.64, 2.95; 1H)46.45H2, H3bH2, H3bH2C4, C10
3b3.04 (m; 1H)H2, H3aH2, H3aH2C4, C2, C1′
4 193.22
5 166.70
66.15 (d; 2.24; 1H)99.56H6H8H8C4, C5, C8 C10
7 167.16
86.50 (d; 2.2; 1H)100.49H8H6H6C4, C7, C6, C9, C10
9 162.51
10 107.21
1′ 131.12
2′7.31 (dd; 8.56, 3.16; 1H)129.14H3′, H6′H3′, H6′H3′ (strong), H2 (weak)C2, C1′, C3′, C4′
3′6.83 (dd; 8.64, 1.96; 1H)116.46H2′, H5′H2′, H5′H2′C2′, C4′
4′ 159.13
5′6.83 (dd; 8.64, 1.96; 1H)116.46H3′, H6′H3′, H6′H6′C6′, C4′
6′7.31 (dd; 8.56, 3.16; 1H)129.14H2′, H5′H2′, H5′H5′C2, C1′, C5′, C4′
1”4.78 (d; 7.48; 1H)105.16H2″H2”, H3”, H4”H8 (strong), H2″, H3″, H4″C7, C2″
2”3.57 (m; 1H)74.81H1″H1″, H3″, H4″, H5″a, H5b″H1″, H5″a
3”3.45 (t; 8.4; 1H)78.79 H1″, H2″, H4″, H5″a, H5b″H1″, H5″a, H5″bC2″
4”3.51 (t; 8.08; 1H)77.3H5″bH1″, H2″, H3″, H5″a, H5b″H1″, H5″a, H5″bC2″
5”a3.97 (m; 1H)62.68H5″bH2″, H3″, H4″, H5b″H2″, H3″, H4″, H5″b
5”b3.78 (m; 1H)H4″, H5″aH2″, H3″, H4″, H5a″H3″, H4″, H5″a
a HMBC correlations are from carbon(s) stated to the indicated proton (ID).
Table 5. The 1- and 2-D NMR data of isolate from LF-MeOH-D in D2O (400 MHz).
ID1H (δ ppm, m, J Hz, Integration)13C (δ ppm)COSYTOCSYHMBC(C→H) aNOESY
2 175.27
33.86 (dd; 11.8, 3.68; 1H)53.90H4b, H4bH5, H4a, H4bC2, C4, C5H4a (strong), H4b
4a2.16 (m; 1H)32.74H3, H4b, H5H3, H5, H4b H3 (strong), H4b (strong)
4b1.91 (m; 1H)H3, H4a, H5H3, H5, H4aC2, C3, C5, C6H5 (strong), H4a
54.18 (m; 1H)61.80H4a, H4b, H6H3, H4a, H4b, H6, H7 H4b (strong), H6 (strong)
61.85 (m; 2H)26.50H5, H7H5, H7C4, C5, C7H5
73.26 (m; 2H)38.54H6H5, H6C5, C6H6 (strong)
a HMBC correlations are from carbon(s) stated to the indicated proton (ID).
Table 6. The DPPH and ABTS scavenging properties of the isolated compounds.
CompoundsIC50 against DPPH (µM)IC50 against ABTS (µM)
Isosalipurposide 31559 ± 28.16 ***1686 ± 95.26 ****
Naringenin 1>10,000 a1525 ± 316.50 ****
Quercitrin 4322.6 ± 14.05 ****355.3 ± 12.08
Myricitrin 8199.9 ± 4.83 ****285.9 ± 7.21
Naringenin-7-O-α-L-arabinopyranose 2>10,000 a4146 ± 99.15 ****
D-(+)-pinitol 5a1675 ± 65.72 ****475 ± 24.20
(−)-Pinitol 5b6865 ± 69.08 ****2096 ± 70.40 ****
(−)-Epicatechin 6278 ± 8.62 ****92.58 ± 13.03
2,4-Di-t-butylphenol 7>10,000 a2715 ± 64.02 ****
3-hydroxy-5-(2-aminoethyl)-dihydrofuran-2(3H)-one 9>10,000 a>10,000 a
Vitamin C1072 ± 47.64460.2 ± 56.29
a The activity did not reach 50% at the highest tested concentration (10 mM); *** p = 0.0002 of compound 3 vs. vitamin C; **** p < 0.0001 were from the indicated compounds vs. vitamin C (n = 3, ANOVA, Tukey).
Table 7. Inhibitory activity of the isolated compounds against yeast α-glucosidase.
CompoundIC50 (μM)
Isosalipurposide 3116.5 ± 26.40
Naringenin 289.71 ± 10.22 *
Quercitrin 4177.3 ± 11.34
Myricitrin 8351.6 ± 24.88
Naringenin-7-O-α-L-arabinopyranose 2769.1 ± 95.82 ****
D-(+)-pinitol 5a74.69 ± 0.23 *
(−)-pinitol 5b164.2 ± 8.36
(−)-Epicatechin 663.58 ± 11.83 *
2,4-Di-t-butylphenol 7259 ± 58.34
3-hydroxy-5-(2-aminoethyl) dihydrofuran-2(3H)-one 9>1000 a
Acarbose239.9 ± 31.74
a The activity did not reach 50% at the highest tested concentration (1 mM); * p = 0.03, **** p < 0.0001 were from the inhibition of the compound vs. acarbose (n = 3, ANOVA, Tukey).
Table 8. Schematic workflow diagram of the cell differentiation.
Cell growth100% confluentLipid droplets formation and developmentExcessive lipid droplets
48 h48 h (day −2 to 0)48 h (day 0 to 2)48 h (day 2 to 4)48 h (day 4 to 6)48h (day 6 to 8)Between day 8 & 12
Feed M1Feed M1Feed M2Feed M3Feed M3Feed M4Treatment with extracts/compounds
PreadipocyteMolecules 28 01028 i001mature adipocyte
Disclaimer/Publisher’s Note: The statements, opinions and data contained in all publications are solely those of the individual author(s) and contributor(s) and not of MDPI and/or the editor(s). MDPI and/or the editor(s) disclaim responsibility for any injury to people or property resulting from any ideas, methods, instructions or products referred to in the content.

