1. Introduction
Mediterranean countries are commonly known for their extensive cultivation of olive trees and large olive oil production. According to the International Olive Council (IOC), Spain is the largest producer and exporter of olive oil in the world, followed by Italy and Greece, with Tunisia, Turkey, Morocco, and Portugal also being significant olive-oil-producing and exporting countries [
1]. The favorable environmental conditions (climate, temperature, humidity, soil, etc.) that prevail in the countries of the Mediterranean Basin foster olive oil production and contribute to the production of high-quality olive oil, distinguished by its unique color, flavor, taste, and smell.
At the pinnacle of the olive oil hierarchy list, extra virgin olive oil (EVOO) is the premier olive oil, followed by virgin olive oil (VOO), along with regular olive oil (OO), refined olive oil (ROO), and pomace olive oil (POO) [
2]. EVOO and VOO are the most consumed ones by those who follow the Mediterranean diet, owing to their various health benefits. However, since the procedures for the extraction of olive oil are notably demanding, especially apropos of EVOOs and VOOs, they have an impact on the price of these products in the market [
3]. The large price gap between EVOO/VOO and other types of olive oils or non-olive oils is one of the main reasons for fraudulent activities to occur.
EVOO and VOO are generally susceptible to adulteration with lower-quality oils, including soybean, sunflower, sesame, canola, and corn oil, among others. In addition, pomace oil, which is extracted from the residue of olive oil fruits, is one of the commonly used adulterants. To prevent fraud and secure the authenticity of olive oil, authorities have established certification procedures, such as the European Union’s indices of Protected Designation of Origin (PDO) and Protected Geographical Identification (PGI) [
4], which guarantee that they have been prepared according to the highest quality standards and have characteristics that make them unique, such as certain olive varieties that are closely linked to a well-defined region and a time-honored tradition. Yet, these seals are not enough, and illegal practices still occur due to economic motives, raising the concern of food authorities and agencies for fraud traceability. In this regard, additional efforts have been directed toward developing new strategies for the protection of olive oil quality, particularly new cutting-edge technologies.
Among the proposed methods, photonic technologies and spectroscopic methods, which share a unique set of advantages (e.g., real-time, online, in situ, and/or remote operation; minimal or no sample preparation; and non-invasiveness), appear to be suitable for the detection of olive oil adulteration. Thus, Raman spectroscopy, Near-Infrared (NIR) spectroscopy, Fourier Transform Infrared spectroscopy (FTIR), and Laser-Induced Fluorescence spectroscopy (LIF) have been applied for food quality and safety issues and the detection of olive oil adulteration. Georgouli et al. [
5] used Raman spectroscopy and FTIR to detect EVOOs’ adulteration with hazelnut oil by studying samples with different levels of adulteration (e.g., from 1 to 90%) and employing different machine learning approaches (Continuous Locality Preserving Projections (CLPPs), k-Nearest Neighbors (k-NNs), etc.). They reported quite high discrimination accuracies. Mu et al. [
6] applied LIF and different chemometric tools (e.g., Principal Component Analysis (PCA), Partial Least Squares Regression (PLSR), Support Vector Machines (SVMs), and Artificial Neural Networks (ANNs)) to distinguish EVOOs from EVOOs adulterated with different percentages of peanut oil and rapeseed oil samples (in the range of 2.5 to 50%). In this study, classification accuracies up to 100% were attained using SVM and ANN algorithms, while a correlation coefficient value (R
2) of 0.99 was obtained for the PLSR model. Meng et al. [
7] performed a similar investigation by means of FTIR, VIS-NIR, and excitation–emission matrix fluorescence spectroscopies, studying various olive oils adulterated with soybean oil at percentages from 5 to 50%. For the analysis of the data, PCA/multi-way PCA and Partial Least Squares Discriminant Analysis (PLS-DA) were employed, providing successful results, as well.
More recently, Laser-Induced Breakdown Spectroscopy (LIBS) has also been proposed and applied for the authentication of olive oil. LIBS is a relatively simple laser-based technique in which a strong enough laser beam is focused on a sample, inducing dielectric breakdown, i.e., producing a micro-plasma, which consists of excited atoms, ions, molecules or fragments of molecular species, and electrons. The excited species thus produced can emit characteristic radiations, i.e., a “fingerprint” of the sample, thus providing valuable qualitative and quantitative information about the sample’s elemental composition. Besides the experimental simplicity of LIBS, its main attributes are minimum or no sample preparation and its ability to be applied to samples of all states (solid, liquid, and gas), whether dielectric or not [
8,
9]; it can also provide rapid, in-situ, online, and real-time measurements. Due to these advantages, LIBS has been proposed for a wide range of applications, such as industrial [
10], environmental/recycling [
11,
12], cultural heritage [
13,
14], food analysis [
15,
16], etc.
Regarding olive oil authenticity and traceability, LIBS has been successfully applied for the detection of olive oil adulteration. Specifically, Caceres et al. [
17] used LIBS for the detection of adulteration in olive oils mixed with different commercially available oils (i.e., sunflower seed, corn, and hazelnut oil) employing a neural network algorithm. They reported high classification accuracies, up to 95%. In a similar work conducted by Bellou et al. [
18], the discrimination of pure olive oil samples from samples adulterated with pomace oil was investigated using LIBS, Principal Component Analysis (PCA), and Linear Discriminant Analysis (LDA). Again, high classification accuracies were obtained. In another work, Kongbonga et al. [
19] employed LIBS to study the C
2 Swan band in various olive and vegetable oils (e.g., refined sunflower, corn, and palm oils, as well as crude palm oil) and correlated it to the content of saturated fatty acids.
Furthermore, LIBS has also been employed for the recognition of olive oil’s geographical and cultivar origin. Gazeli et al. [
20] and Gyftokostas et al. [
21] used LIBS, aided via machine learning, to discriminate olive oil samples from different regions of Crete, Greece. In both studies, high classification accuracies were obtained, i.e., from 90 to 99% in the former and up to 94% in the latter. In addition, Gyftokostas et al. [
22] employed LIBS and chemometrics to identify the geographical origin of olive oils from three regions of Greece, namely, Crete, Peloponnese, and Lesvos. The analysis of the spectroscopic data via machine learning tools resulted in accuracies up to 100%. In an extension of this work, Gyftokostas et al. [
23], using LIBS and UV-Vis-NIR absorption spectroscopy and chemometrics, studied the discrimination of several olive oils and binary mixes of them from different regions in Greece based on their geographical origin. The algorithmic models applied were evaluated for their efficiency, resulting in predictive accuracies up to 99%. Similarly, Stefas et al. [
24] used the fusion of the spectroscopic data from LIBS and UV-Vis-NIR absorption to discriminate olive oils in terms of cultivar origin. In all the above studies, remarkably successful results were obtained, and discrimination accuracies from 82% to 100% were reported.
The present work reports on the application of the LIBS technique, assisted via machine learning, for the detection of the adulteration of EVOOs with various lower-quality oils, often used in fraudulent activities. In this view, 40 Greek EVOOs from four regions of Greece traditionally known for the quality and special characteristics of their olive oil, namely, Crete, Lesvos, Kalamata, and Achaia, were mixed at different concentrations, with different commercially available oils of lower quality, namely, pomace, corn, soybean, and sunflower oil, and were studied using LIBS. The obtained spectroscopic data (i.e., LIBS spectra) were analyzed via different machine learning algorithms, i.e., Principal Component Analysis (PCA), Linear Discriminant Analysis (LDA), Support Vector Machines (SVMs), Logistic Regression (LR), and Gradient Boosting (GB), and were assessed for their efficiency to identify pure EVOOs from adulterated ones. Then, corresponding statistical models were constructed and used for the discrimination of the pure EVOOs from the adulterated ones and the identification of the adulterant used. The effectiveness and robustness of the models for successful predictions were evaluated via internal and external validation procedures. In all cases, high classification and prediction accuracies were obtained. The present findings demonstrate the ability of the LIBS technique, assisted via machine learning, for the fast and reliable real-time detection of adulteration in olive oil.
2. Results and Discussion
In the present work, the potential of the LIBS technique, aided via machine learning, to detect EVOOs’ adulteration was initially investigated. For this purpose, the LIBS spectroscopic data were divided into two classes: the class of pure EVOOs and the class of all mixtures with the four different lower-quality oils (i.e., corn, pomace, soybean, and sunflower oil). The first class comprised EVOOs from different geographical regions (i.e., 40 samples), and the second one comprised all the prepared binary mixtures of EVOO/lower-quality oil, with concentrations ranging from 10 to 90%, with a step of 10% (i.e., 144 samples in total). Additionally, the possibility of identifying the adulterant used was also examined. For this goal, the mixtures of EVOOs with each adulterant were considered as four separate classes (i.e., 36 corn-, 36 pomace-, 36 soybean-, and 36 sunflower-mixed samples), and all EVOOs as one class. Next, in a different approach, concerning the identification of the type of adulterant used, the EVOOs of each geographical region (i.e., Crete, Lesvos, Kalamata, and Achaia) and their mixtures with each one of the four adulterants (i.e., 9 samples for each adulterant/class, 46 samples in total) were considered separately and were analyzed.
2.1. Discrimination of Pure EVOOs from Adulterated EVOOs
First, for the analysis of the LIBS spectroscopic data of all EVOOs (considered as one class) and all adulterated EVOO samples (considered as another class), the PCA algorithm was applied for dimensionality reduction purposes. From the optimization of the algorithm, it was concluded that 60 Principal Components (PCs) were enough to maintain most of the initial spectral information. Then, the preprocessed data were introduced into the LDA, SVM, LR, and GB algorithms, and the corresponding predictive models were constructed. The obtained results were remarkable, as high classification and predictive accuracies were attained. Specifically, classification accuracies up to 100% were obtained using the LDA, SMV, and LR algorithms, as well as 99.7% using the GB one (see
Table 1). More importantly, predictive accuracies as high as 100% for the LDA, SMV, and LR algorithms, as well as 99.8% for the GB one (see
Table 1), were reached, demonstrating the efficiency of the models in distinguishing pure EVOO samples from adulterated ones. In more detail, this is also shown by the corresponding confusion matrices presented in
Table 1, where it is shown that the EVOOs and the adulterated ones were all correctly classified in their respective class, except one misclassification occurred using the GB algorithm.
2.2. Identification of the Type of Adulterant (i.e., Corn, Pomace, Soybean, and Sunflower Oils)
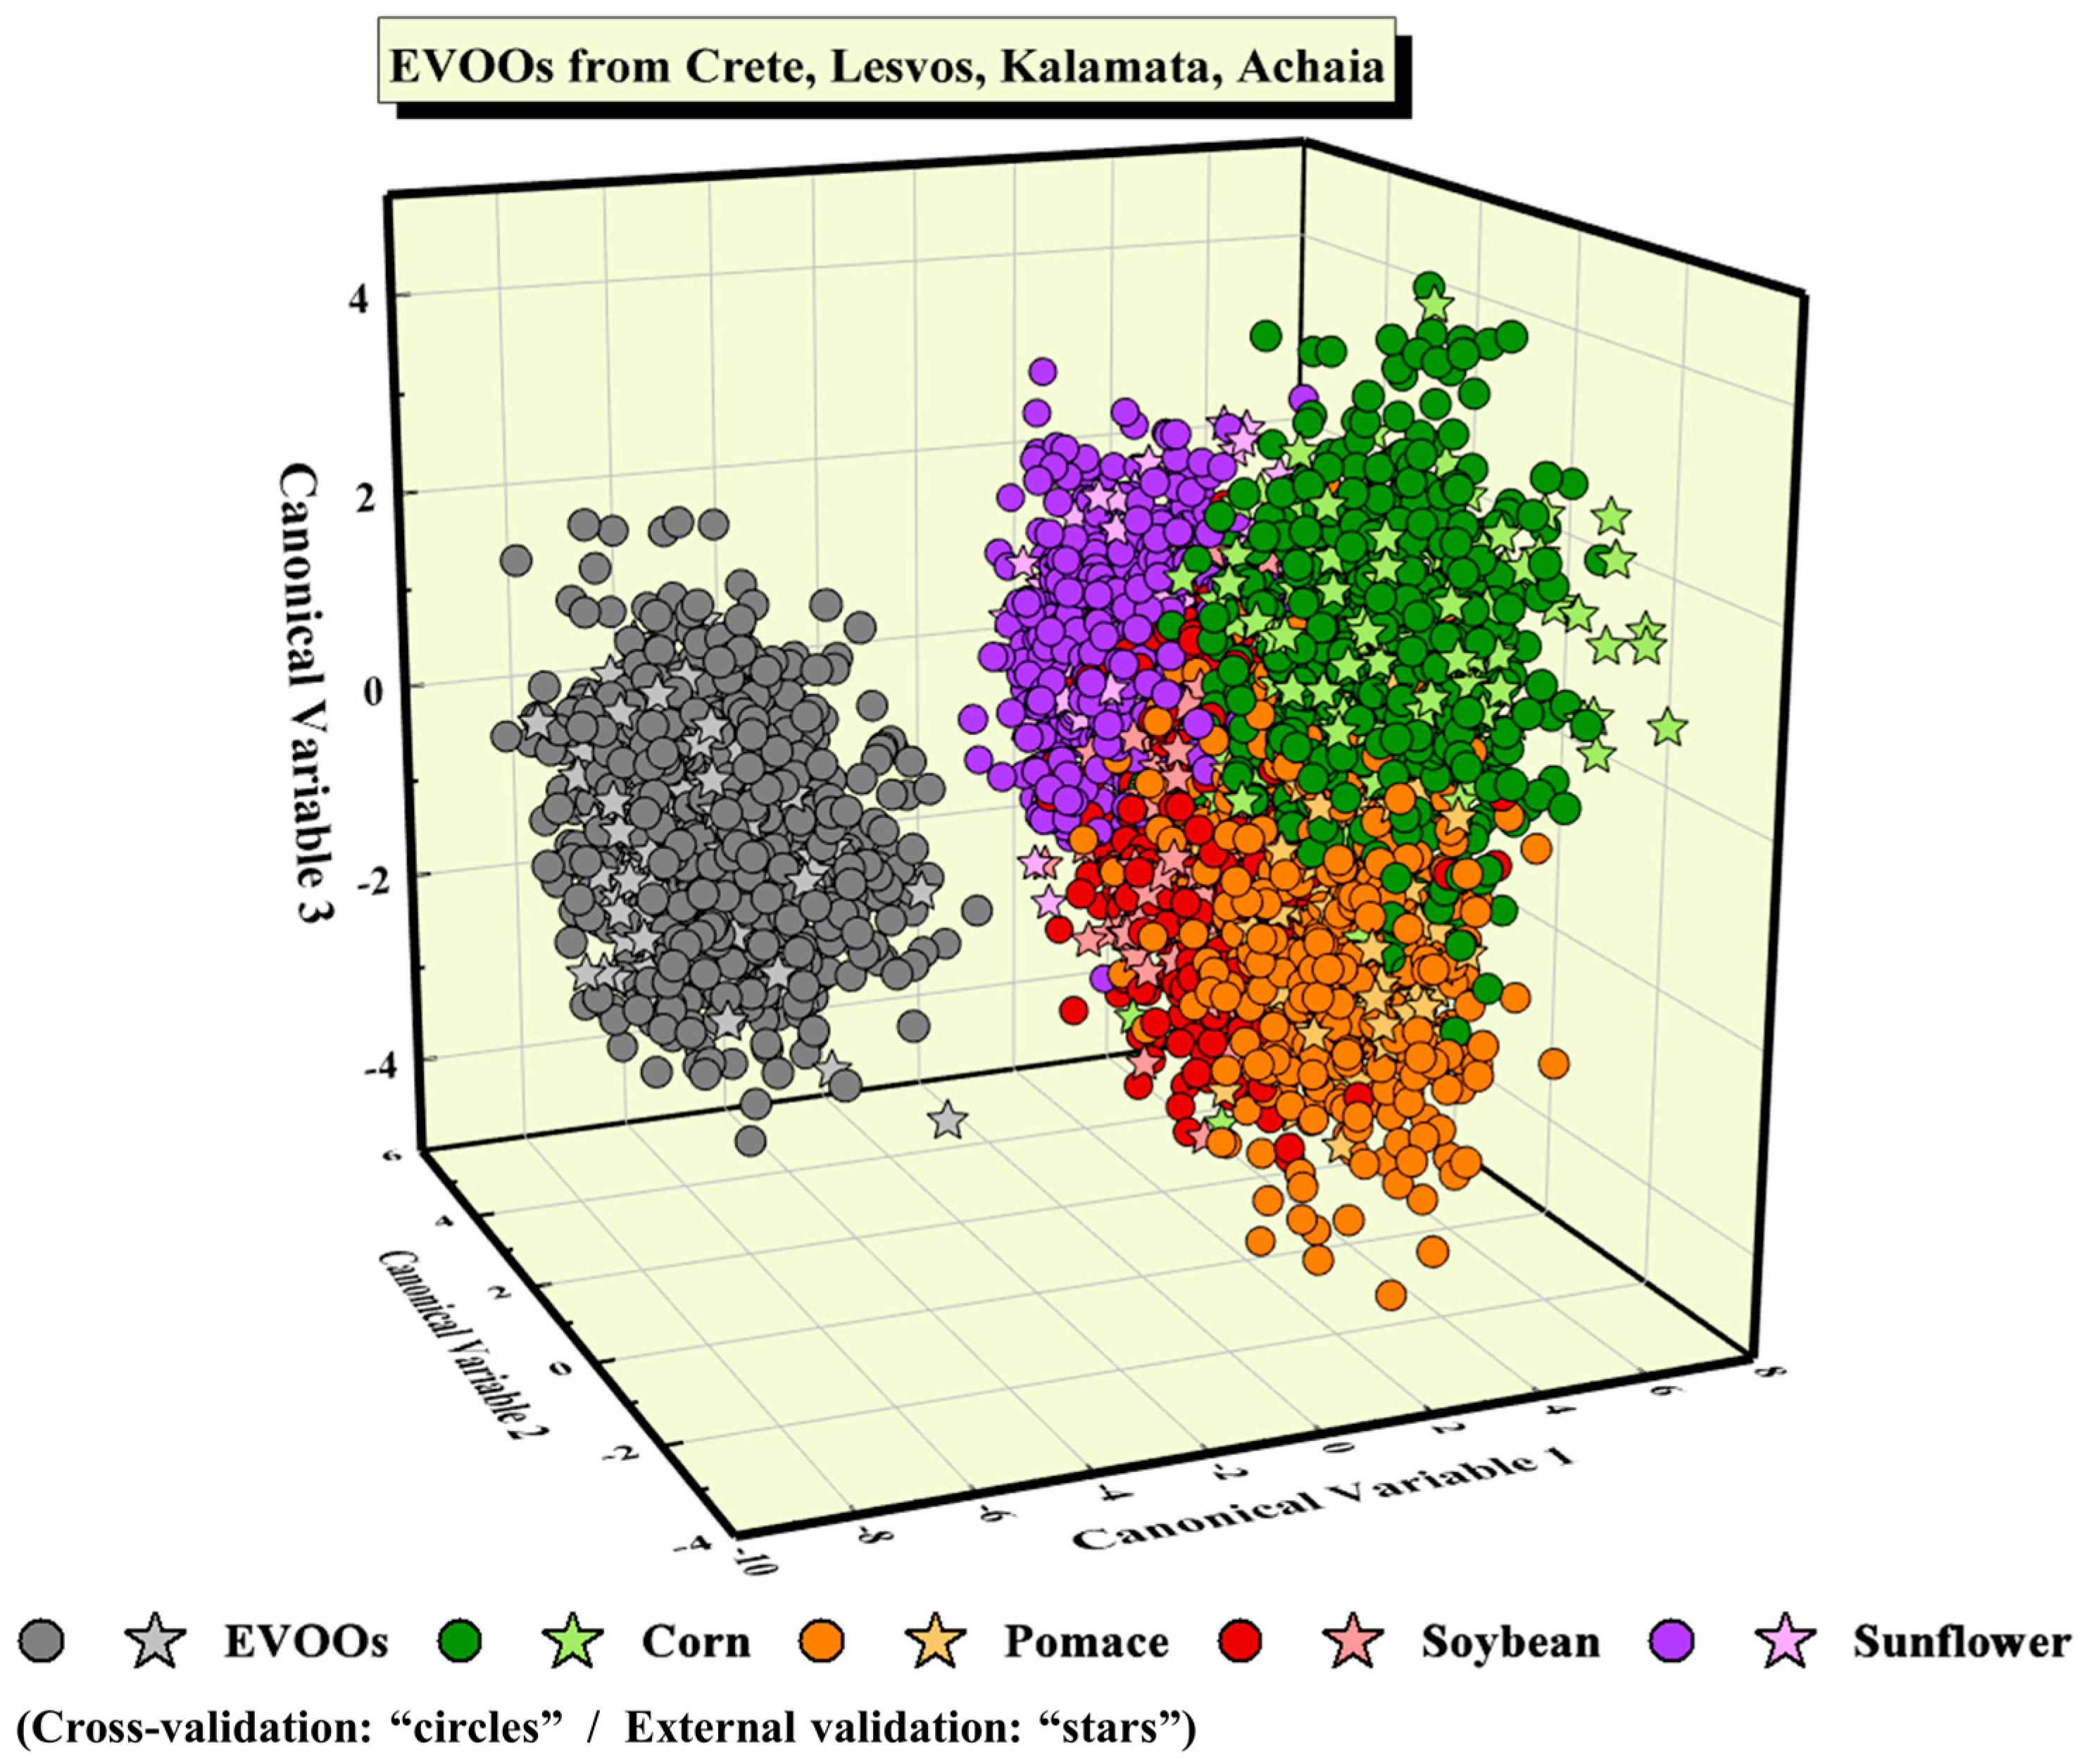
Next, the possibility of identifying the type of adulterant was studied; all EVOOs (i.e., 40 samples in total) were considered as one class, with the adulterated ones (i.e., 36 samples per adulterant) forming four classes. Again, the PCA algorithm was employed for dimensionality reduction, and the number of PCs required to construct robust predictive models was determined. It resulted that 130 PCs were adequate. Then, the PCA-pre-treated LIBS spectroscopic data were analyzed using the LDA algorithm. It is useful, at this point, to note that the LDA algorithm, apart from the construction of a predictive model, can provide a visualization of the classification of the data, which is very useful, in general, for quickly inspecting the success of the classification. The obtained LDA scatter plot is illustrated in
Figure 1, where the circles denote the LIBS spectra used for the training of the algorithm, while the same color (light) stars denote the LIBS spectra used for testing. Throughout this study, the data points of pure EVOOs’ are designated with a grey color, while each type of adulterated mixture is designated with a different color, according to the color code indicated in
Figure 1. As can be seen, the class of EVOOs is visibly well separated from the classes of the adulterated samples, with the test data points (i.e., the stars) being well-fitted within the class. However, regarding the adulterated EVOO samples, some limited overlapping occurs between the four classes of adulterants, as can be seen in
Figure 1.
The classification accuracy, obtained via a 10-fold cross-validation process, was determined to be (84.9 ± 1.5)%, while the predictive accuracy, estimated via external validation, was 87.6% (see also
Table 2). The classification results of the unknown LIBS spectra are also shown, in more detail, in the corresponding confusion matrix, as presented in
Table 2. As can be seen, the LDA model has successfully predicted all 240 spectra of the EVOOs used for testing, while it has falsely classified various spectra of their adulterated mixtures.
Next, an analysis of the LIBS spectra via the SVM, the LR, and the GB algorithms was performed. The obtained results were also successful, with the SVM reaching a classification accuracy of (88.5 ± 1.2%) and a high predictive accuracy of 92.2%, the LR algorithm attaining a classification accuracy of (85.9 ± 1.3%) and a predictive accuracy of 89.1%, and the GB algorithm achieving a classification accuracy of (88.8 ± 1.3%) and a predictive accuracy of 88.1% (see also
Table 2). For a better insight into the performance of each algorithm, the corresponding confusion matrices were constructed; they are all illustrated in
Table S1. It is worth noting that the majority of LIBS spectra were correctly classified.
The above findings demonstrate that the LIBS technique combined with machine learning can very successfully discriminate pure EVOOs from adulterated ones. All statistical models applied managed to discriminate the EVOOs from the adulterated ones and classify them correctly, in the respective classes, achieving excellent predictive accuracies. Concerning the identification of the adulterant used, successful predictive accuracies were obtained as well, although slightly lower, compared to the previous analysis. To shed more light on the aspects of identifying the type of adulterant, the EVOOs from each geographical region (Crete, Lesvos, Kalamata, and Achaia) and their mixtures were analyzed, and the obtained results are presented and discussed below.
2.3. Analysis of EVOOs from Different Geographical Regions and Their Mixtures with Lower-Quality Oils
In this view, the LIBS spectroscopic data of EVOOs and the mixtures of each region were initially pretreated by means of the PCA algorithm. Again, the optimum number of PCs for all the constructed predictive models was searched; it was found that 80, 50, 110, and 40 PCs were adequate for the EVOOs from Crete, Lesvos, Kalamata, and Achaia, respectively.
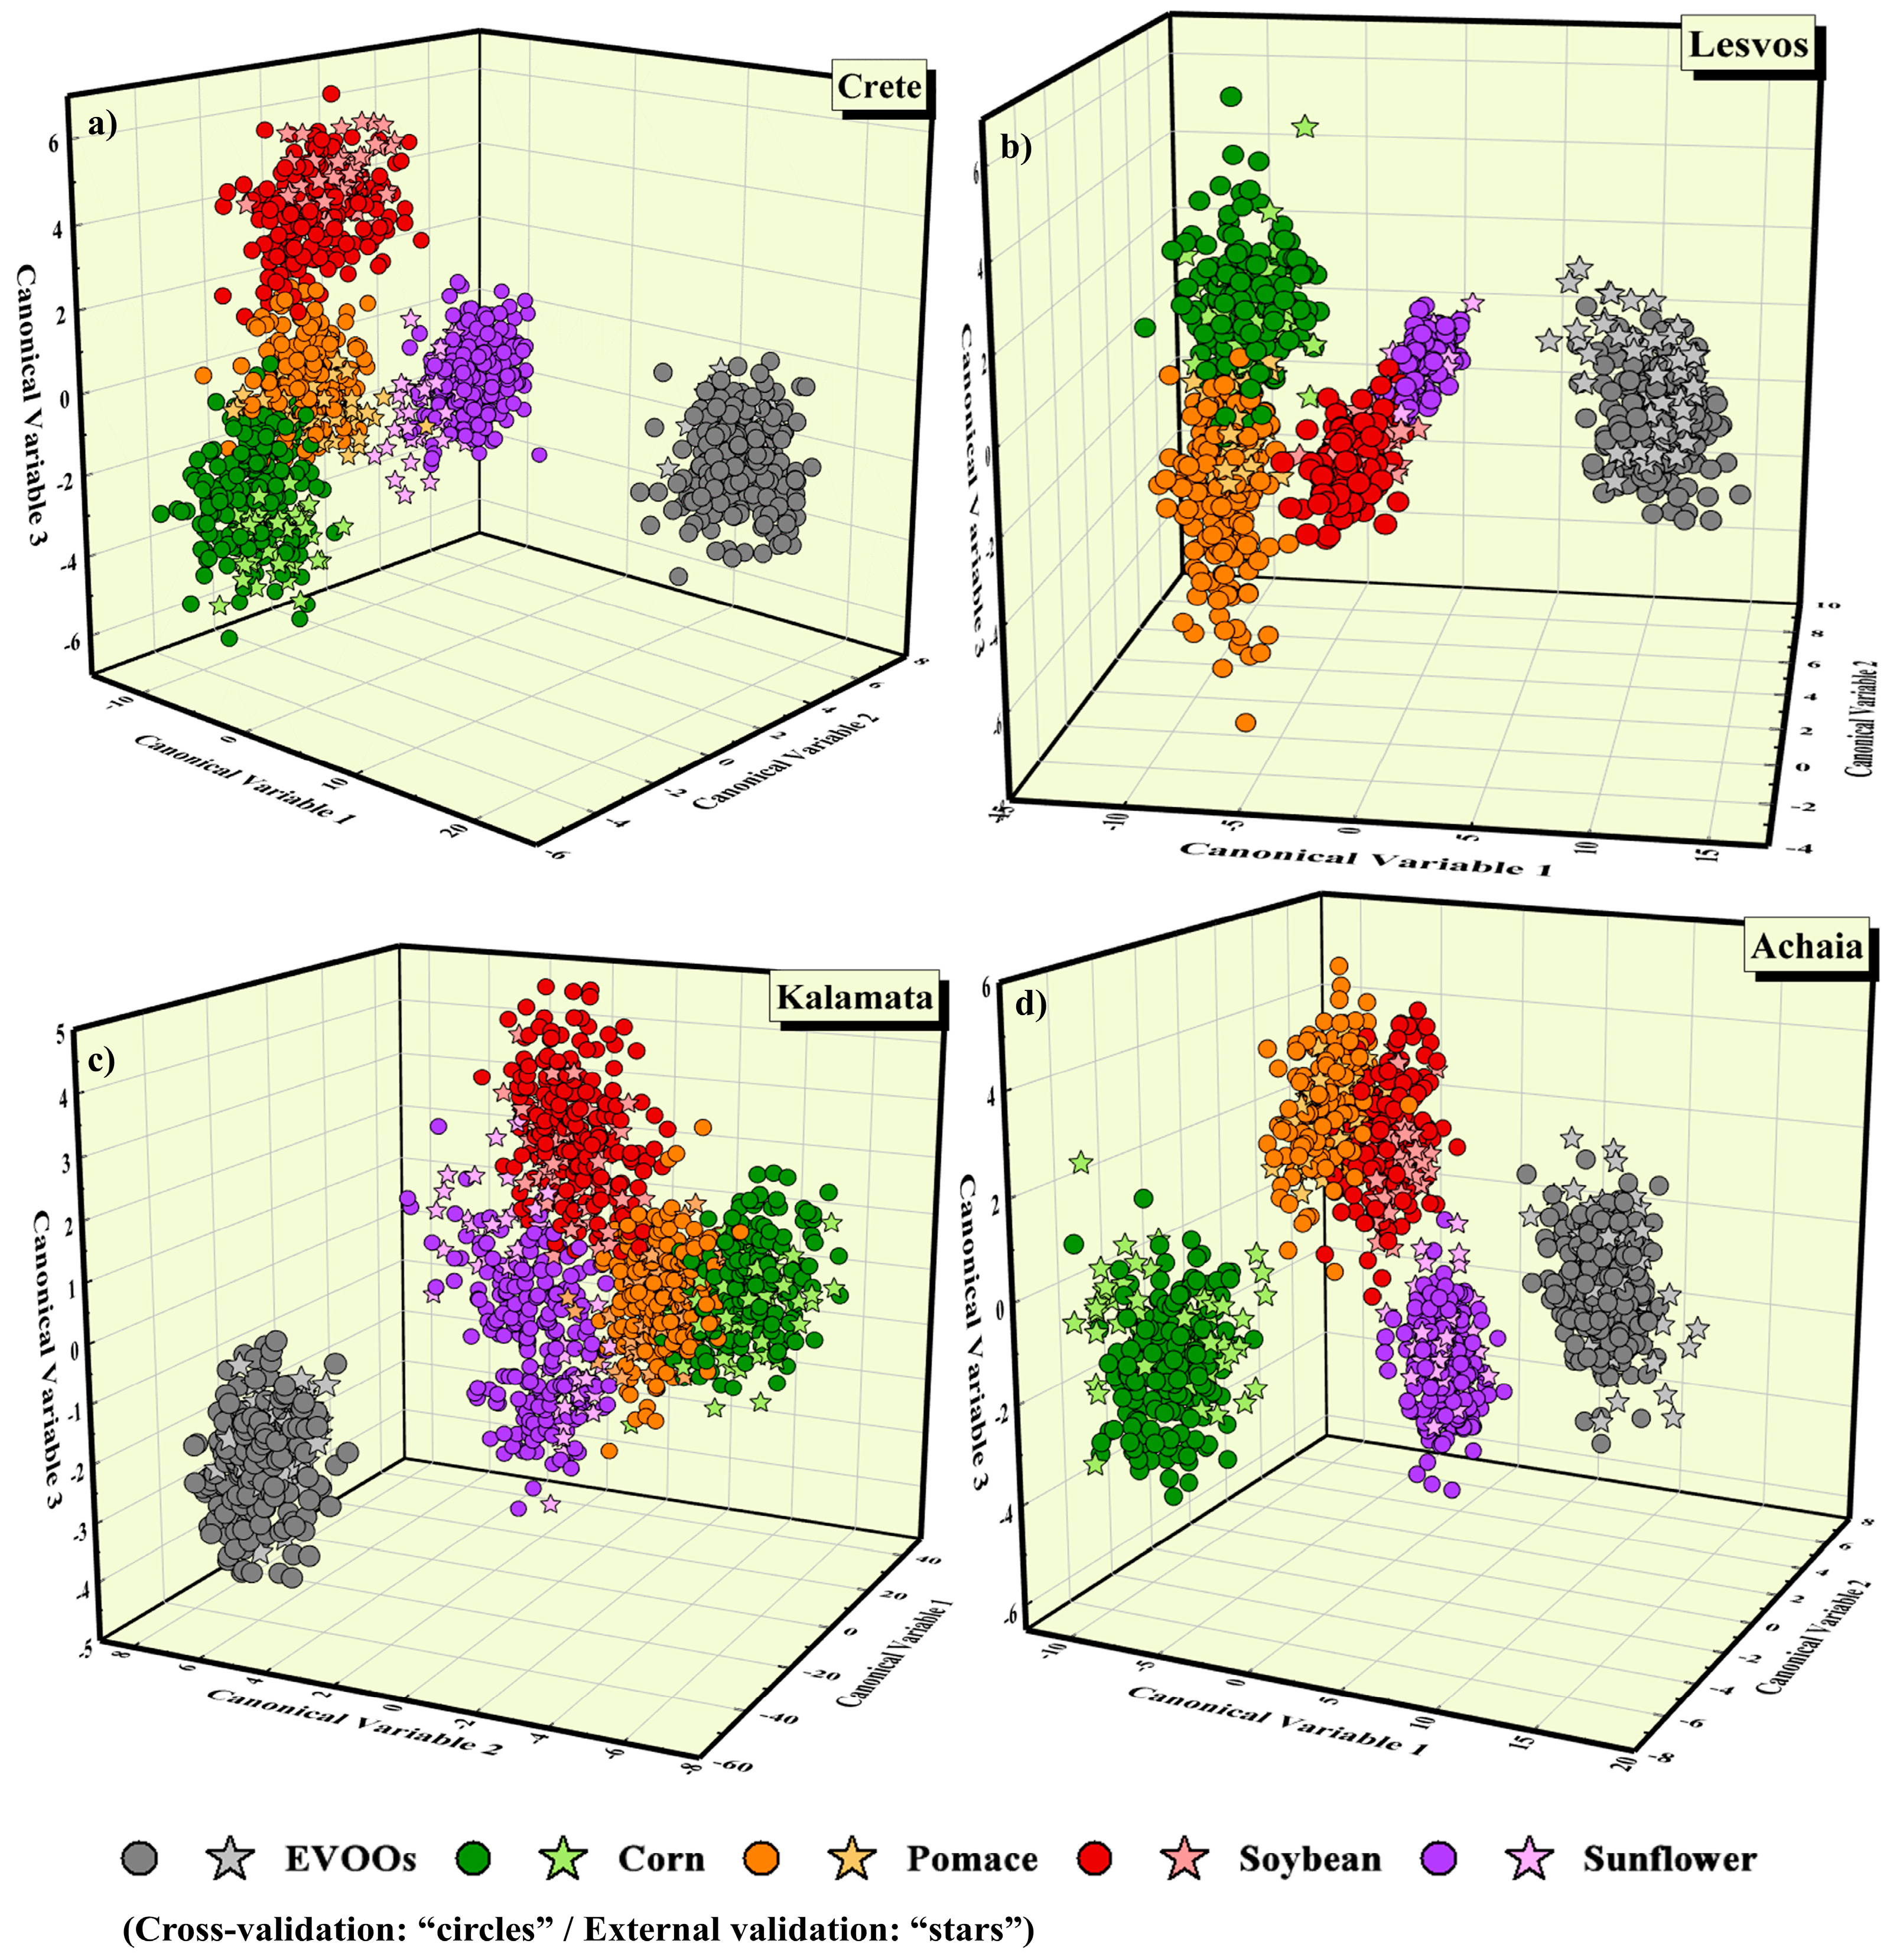
Then, the preprocessed data of each region were analyzed using the LDA algorithm; the corresponding LDA scatter plots are presented in
Figure 2. As shown, in all cases, the class of pure EVOOs was clearly separated from the four classes of adulterated samples. In addition, the EVOOs’ test data points (i.e., stars) were also well fitted in their respective class. As for the mixtures, in all cases, the four classes were found to be well formed, while minor overlapping and/or the dispersion of various data points was observed. In particular, the test data points of EVOOs from Crete and Kalamata mixed with sunflower oil showed some dispersion (see
Figure 2a,c). Moreover, for the EVOOs from Lesvos, some overlapping occurred between their mixtures with corn and pomace oils and between their mixtures with soybean and sunflower oils (see
Figure 2b). As for the EVOOs from Achaia, overlapping between the mixtures with pomace and soybean oils was observed (see
Figure 2d). A better view of the model’s performance can be found in the corresponding confusion matrices, as presented in
Table 3. As can be seen, the classification results were successful, as all the EVOOs’ LIBS spectra were correctly predicted, and only some LIBS spectra of mixtures were misclassified.
The classification and predictive accuracies attained using the LDA algorithm were remarkable since, for every geographical region, values reaching almost 99% were obtained. In more detail, classification accuracies of (98.5 ± 1.4%), (96.8 ± 1.5%), (92.9 ± 2.6%), and (97.0 ± 2.1%) were yielded for the EVOOs from Crete, Lesvos, Kalamata, and Achaia, respectively. More importantly, extremely high predictive accuracies were attained, i.e., 99.3%, 95.0%, 94.3%, and 98.3%, for the EVOOs from Crete, Lesvos, Kalamata, and Achaia, respectively (see
Table 3).
Subsequently, the SVM, LR, and GB algorithms were applied, and the corresponding predictive models were constructed and tested. Similarly successful results were reached (see
Table 3). Thus, in the case of EVOOs from Crete, the SVM, LR, and GB algorithms achieved classification accuracies of (98.4 ± 0.7%), (98.4 ± 1.2%), and (94.1 ± 1.3%), and predictive accuracies of 98.7%, 99.3%, and 91.3%, respectively. Concerning the EVOOs from Lesvos, the SVM, LR, and GB algorithms resulted in classification accuracies of (97.9 ± 1.2%), (98.1 ± 1.4%), and (95.3 ± 2.4%) and predictive accuracies of 96.0%, 97.3%, and 94.0%, respectively. For the EVOOs from Kalamata, the corresponding classification accuracies achieved using the SVM, LR, and GB algorithms were (93.7 ± 1.4%), (93.3 ± 1.5%), and (88.1 ± 3.4%) and the predictive accuracies were 95.0%, 94.6%, and 88.3%, respectively. As for the EVOOs from Achaia, classification accuracies of (96.7 ± 1.9%), (95.0 ± 2.4%), and (90.4 ± 2.4%) and predictive accuracies of 96.0%, 95.3%, and 88.6% were obtained, respectively, for the SVM, LR, and GB algorithms. A better insight into the classification results for these models is provided by the confusion matrices presented in
Table S1. As shown, the SVM and LR algorithms correctly classified almost all spectra, while the GB algorithm misclassified a few LIBS spectra. Overall, the classification results are considered very successful.
From a comparison of the models’ performances, it can be observed that the LDA, SVM, and LR algorithms were found to be the most efficient for identifying the type of adulterant, yielding the highest accuracies, with the GB algorithm attaining slightly lower values in all cases. This outcome might be due to the principles of the LDA, SVM, and LR algorithms, all employing a function for classification analysis, while the GB algorithm employs decision trees. This observation might imply some linear correlations between the LIBS spectroscopic data.
4. Conclusions
In the present work, the detection of the adulteration of olive oil samples using the LIBS technique employing machine learning algorithms was investigated. The different issues of the discrimination of a pure EVOO sample from an adulterated one and the identification of the adulterant were addressed. To accomplish these tasks, EVOOs from different regions of Greece, namely, Crete, Lesvos, Kalamata, and Achaia, were used, and various commercial lower-quality oils, namely, pomace, soybean, corn, and sunflower, were used to prepare binary/adulterated mixtures. The LIBS spectroscopic data were analyzed by employing several machine learning algorithms, i.e., PCA, LDA, SVMs, LR, and GB, which were evaluated systematically for their performance using both internal and external validation procedures. For the discrimination of the EVOO samples from the adulterated samples, all statistical models were found to operate successfully, achieving excellent predictive accuracies, attaining values as high as almost 100%. For the identification of the adulterant, accuracies between 92% and 99% were obtained. The present results unambiguously demonstrate the potential of LIBS for the detection of olive oil adulteration and its eventual implementation as an effective tool for fraud traceability, ensuring transparency in the supply chain and, consequently, the quality of olive oils.


