2.2. Lead
The International Programme of Chemical Safety (IPCS) [
11] and the International Agency for Research on Cancer (IARC) [
12] classify lead as a probable human carcinogen (2A). The high toxicity of lead might cause diseases and, at high concentrations, several types of cancer [
13,
14]. Our results showed that the concentration of lead in the 88 artisanal cheese samples we analyzed was below the 0.02 mg kg
−1 and 2 mg kg
−1 maximum limits for dairy products for human consumption established by the European Commission EC. (2001) [
15] and FAO/WHO [
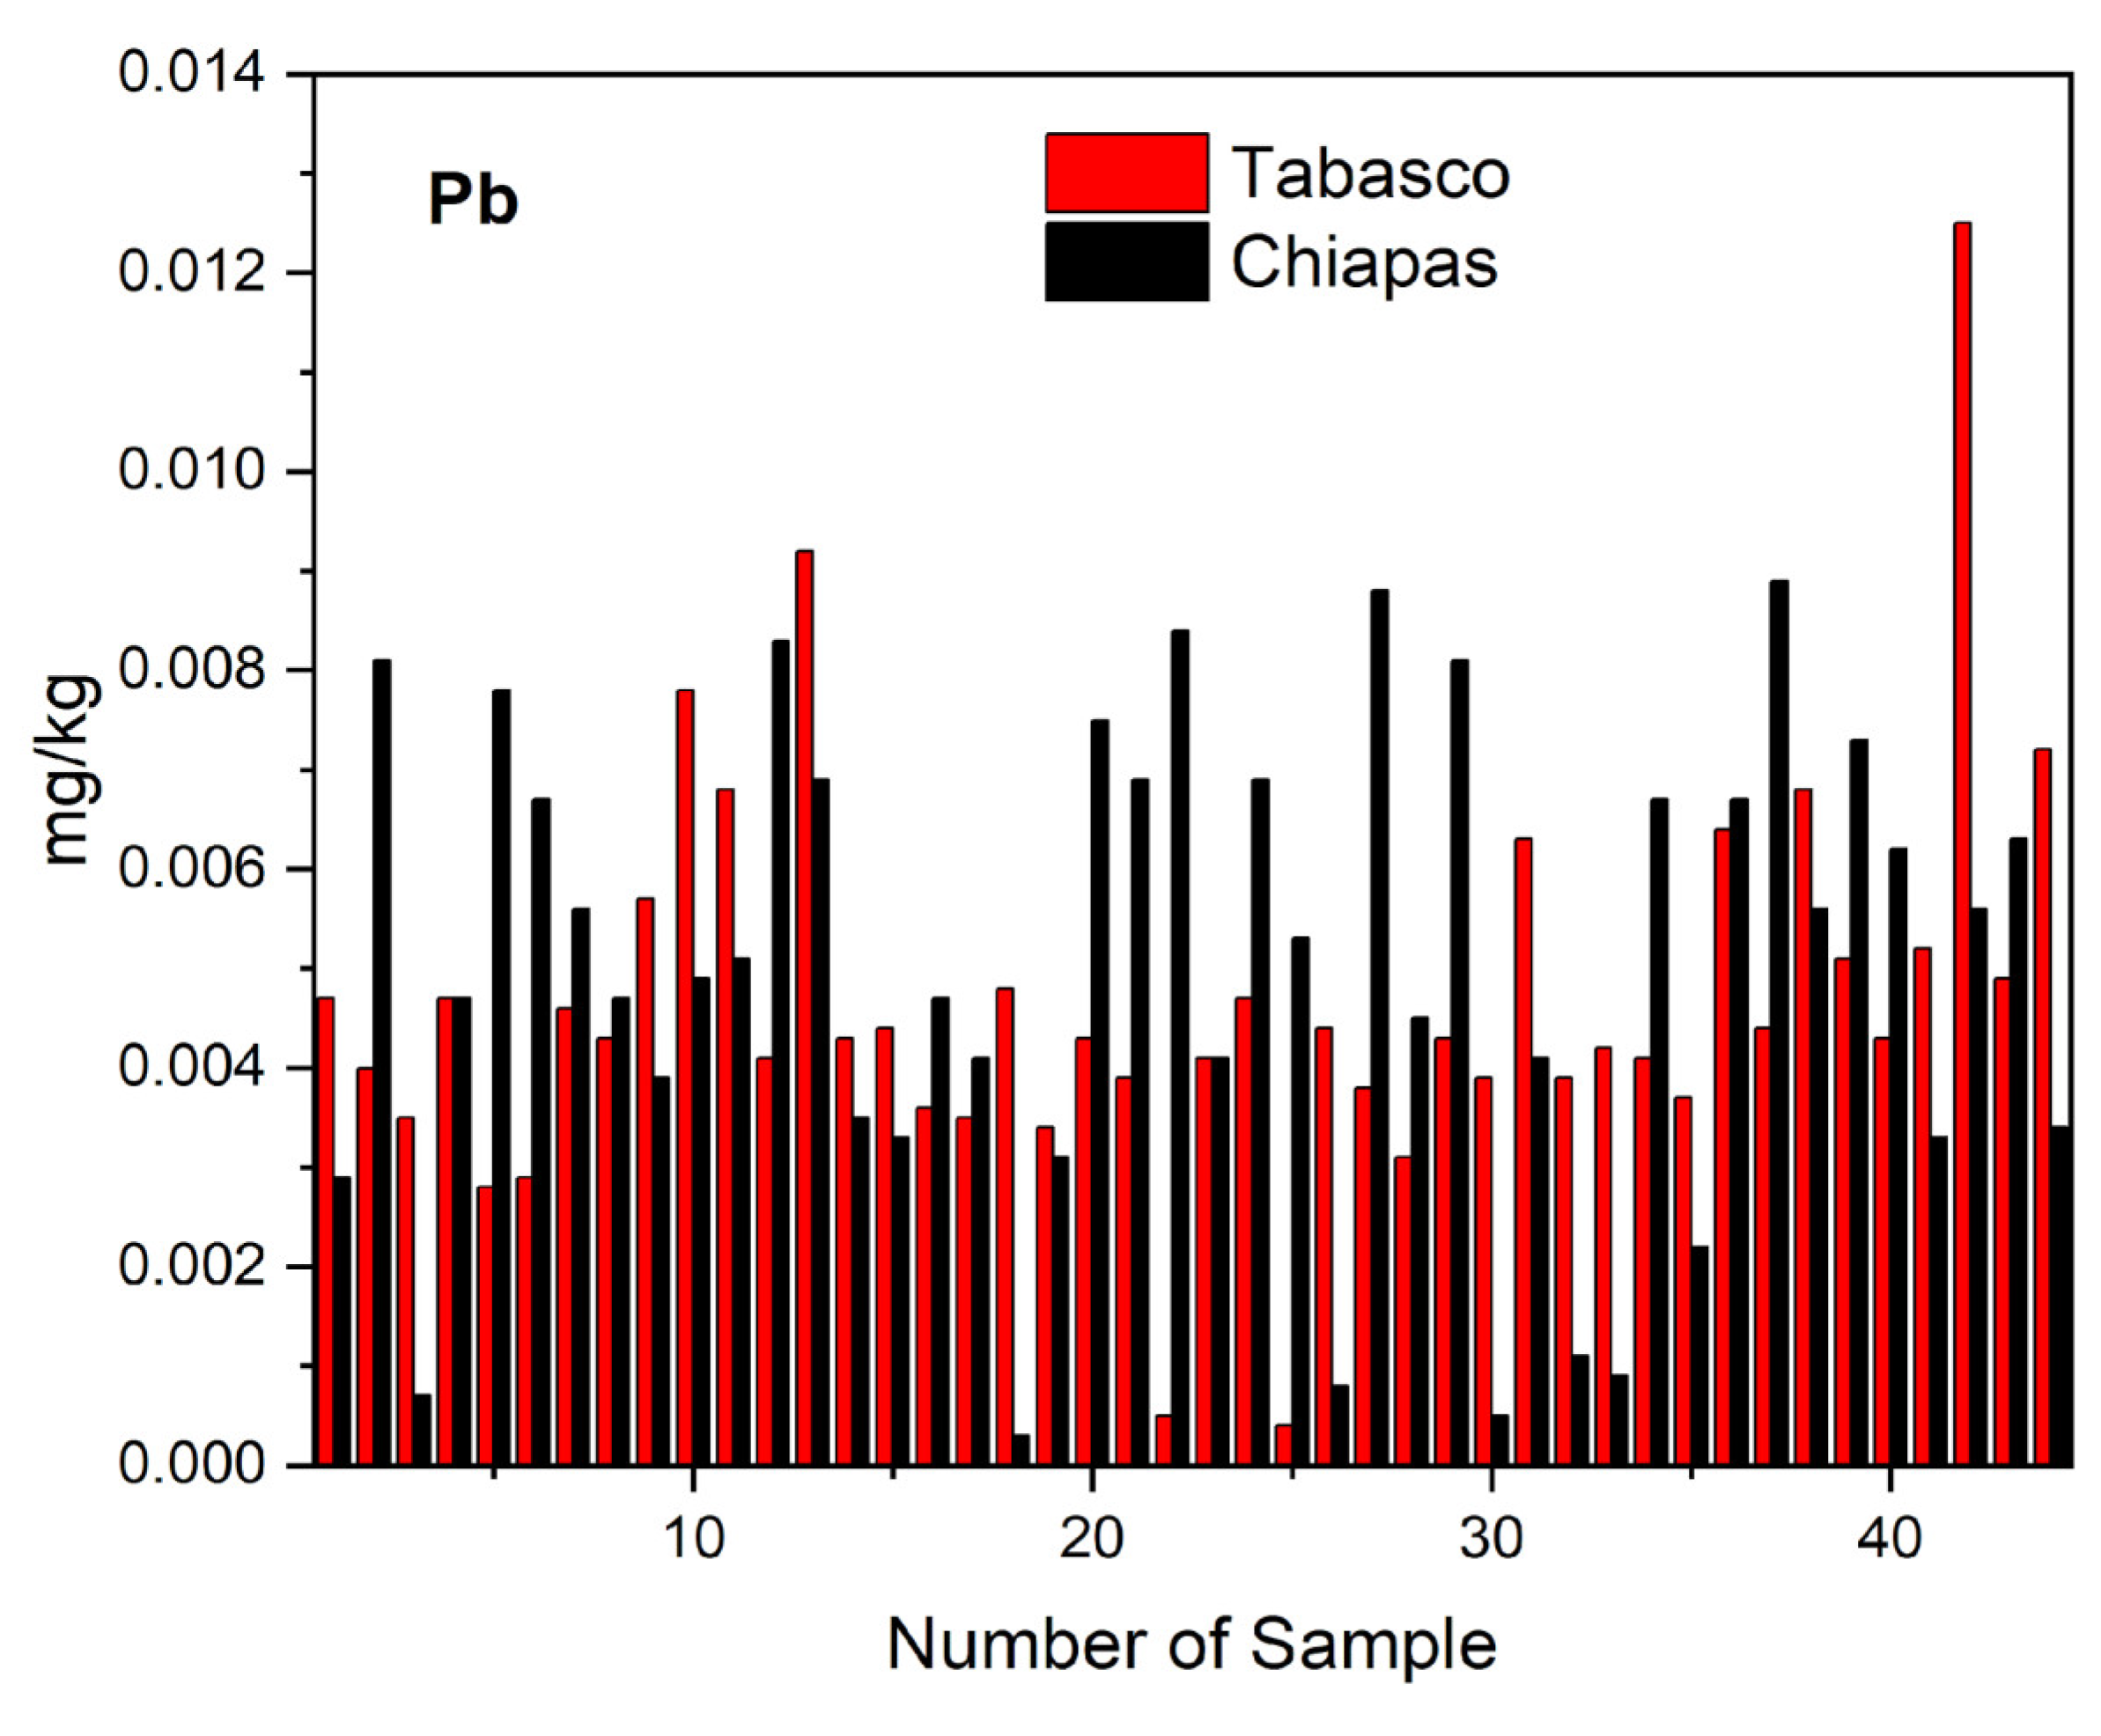
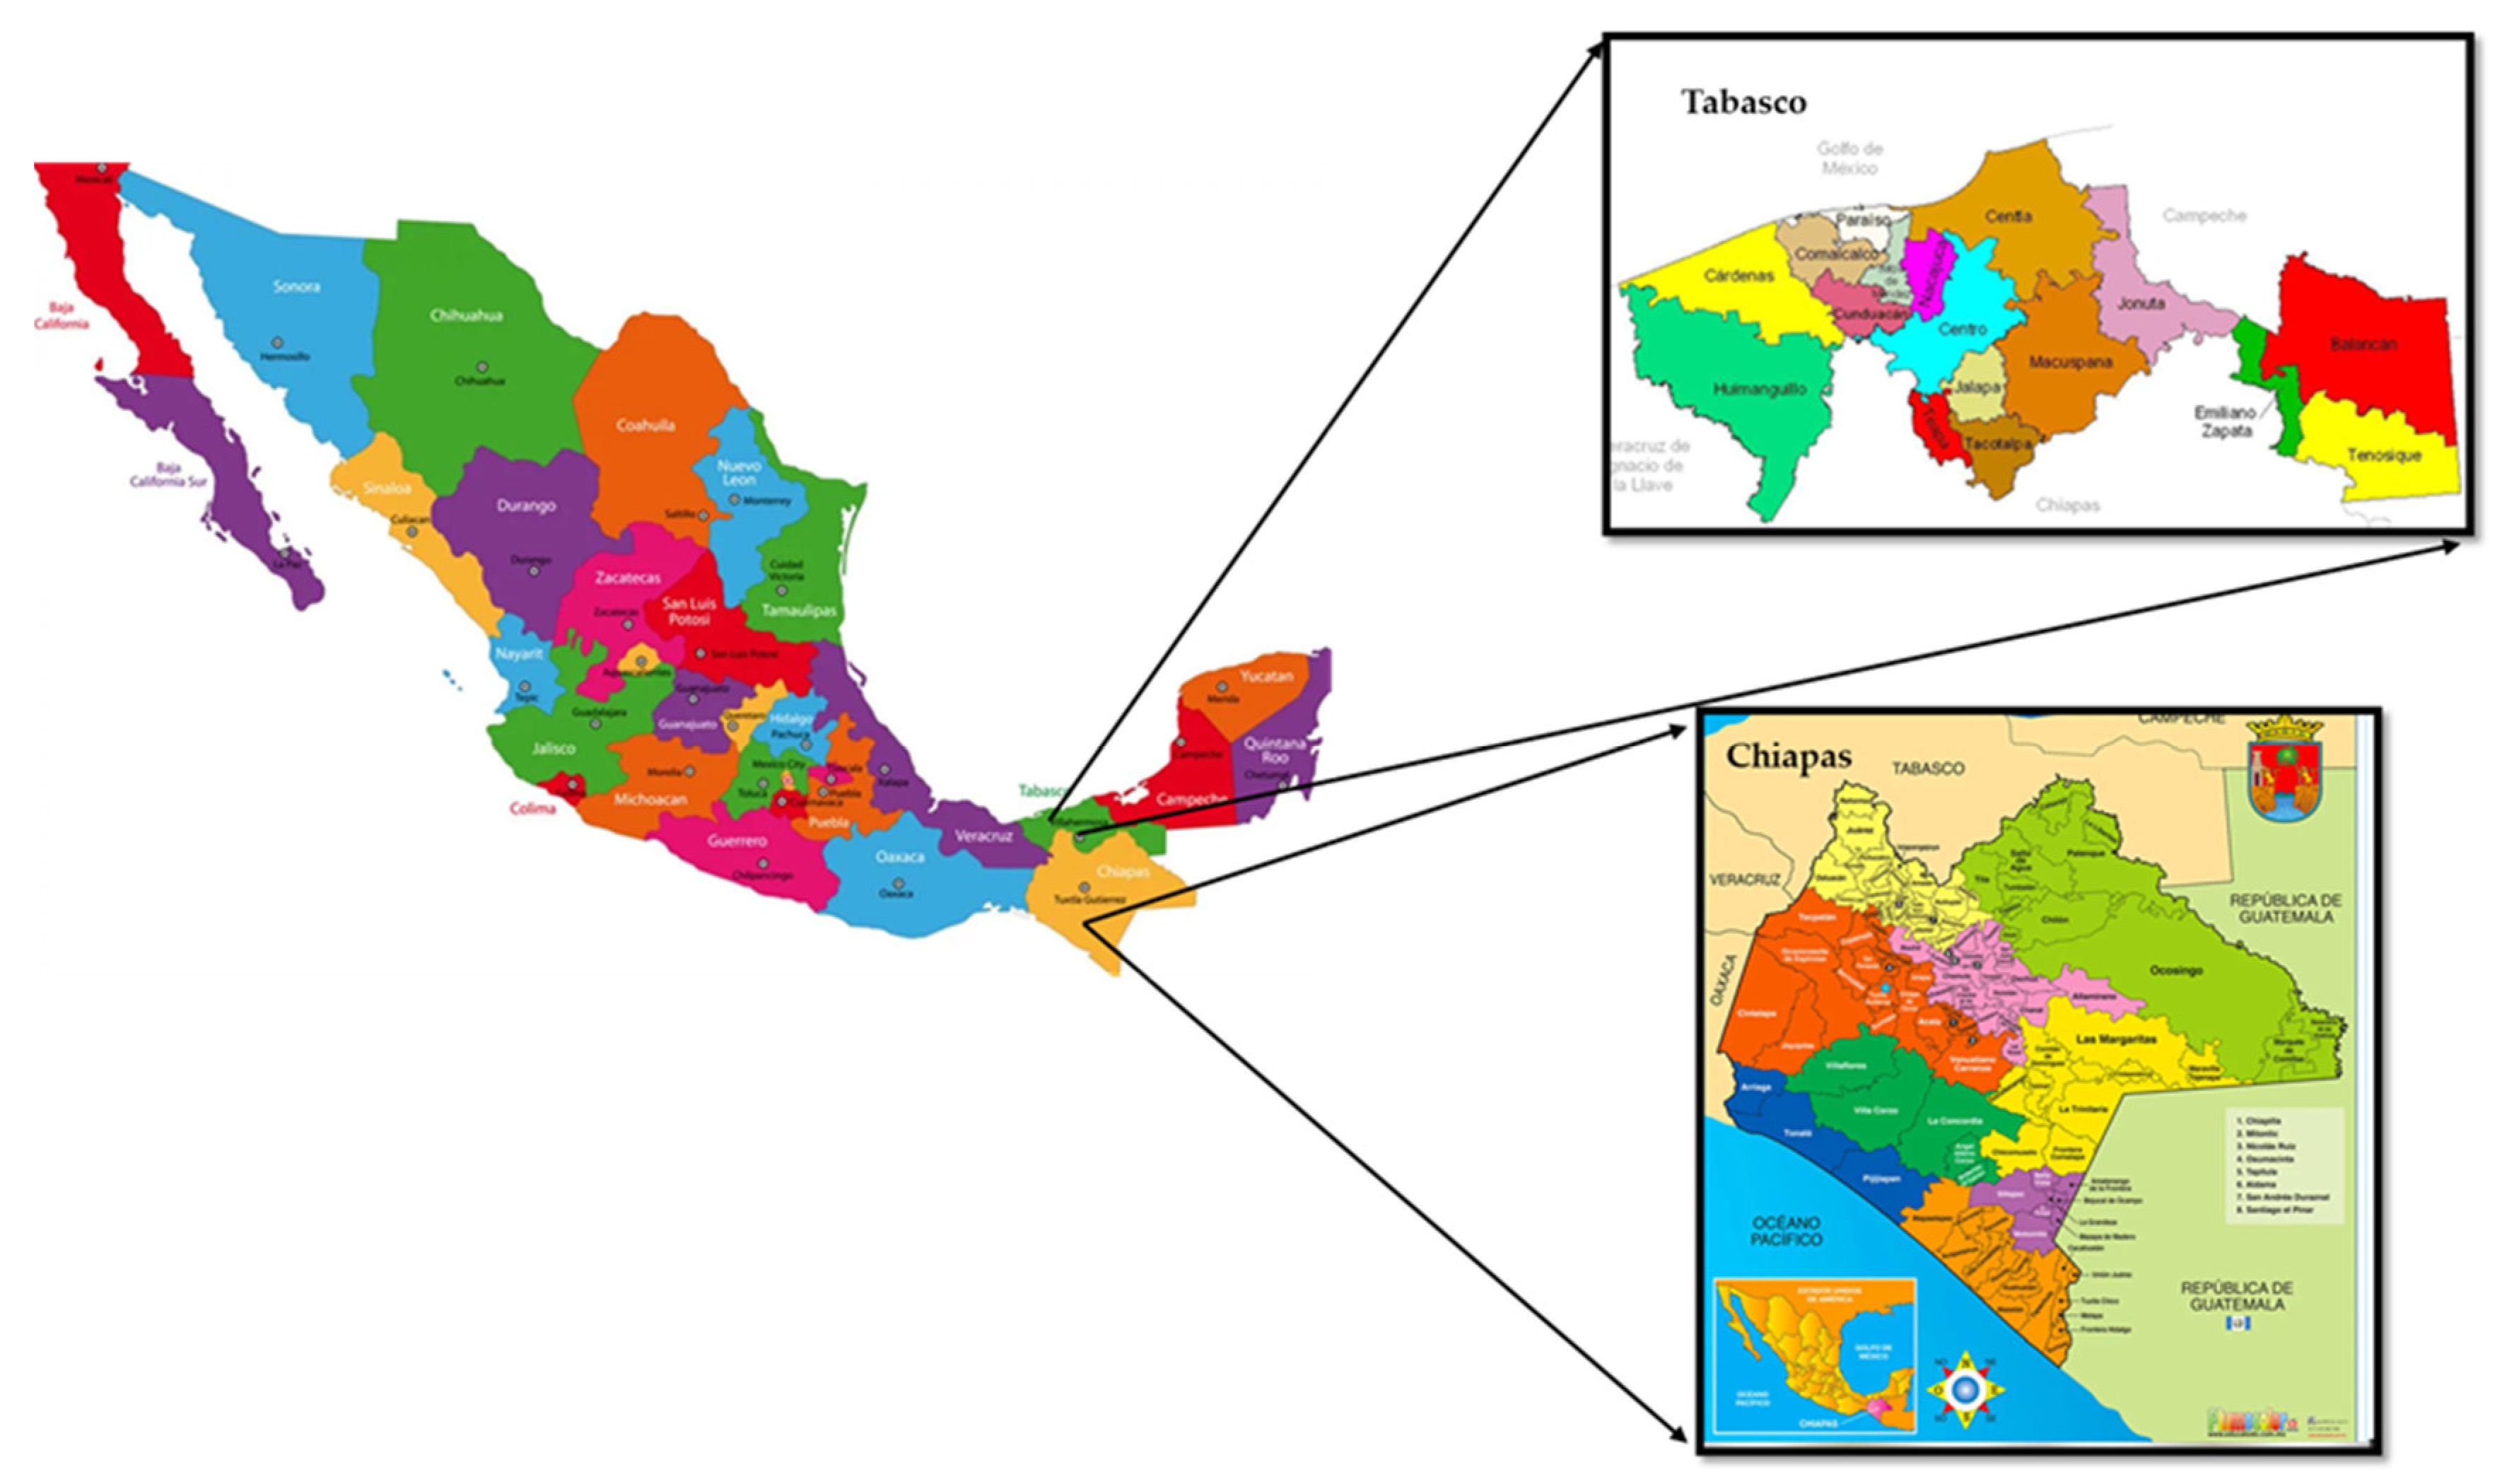
4], respectively. The 44 analyzed samples from Tabasco had an average lead concentration of 0.0041, with a minimum of 0.0002 and a maximum of 0.0125 mg kg
−1. By artisanal cheese variety, the average, minimum, and maximum values of lead concentration in mg kg
−1 were as follows: 0.0056, 0.0004, and 0.0125 for cream or soup and double crema; 0.0045, 0,0028, and 0.0084 for oaxaca; 0.0037, 0.0005, and 0.0068 for fresco; and 0.0041, 0.0031, and 0.0047 for panela. For the 44 samples from Chiapas, we found average, minimum, and maximum values of lead concentration in mg kg
−1 of 0.0051, 0.0003, and 0.0089. For the latter state’s artisanal cheese varieties, the average, minimum, and maximum values of lead concentration in mg kg
−1 were as follows: 0.0062, 0.0029, and 0.0089 for crema; 0.0054, 0.0039, and 0.0088 for cotija; 0.0044, 0.0003, and 0.0083 for oaxaca; and 0.0028, 0.0005, and 0.0078 for panela.
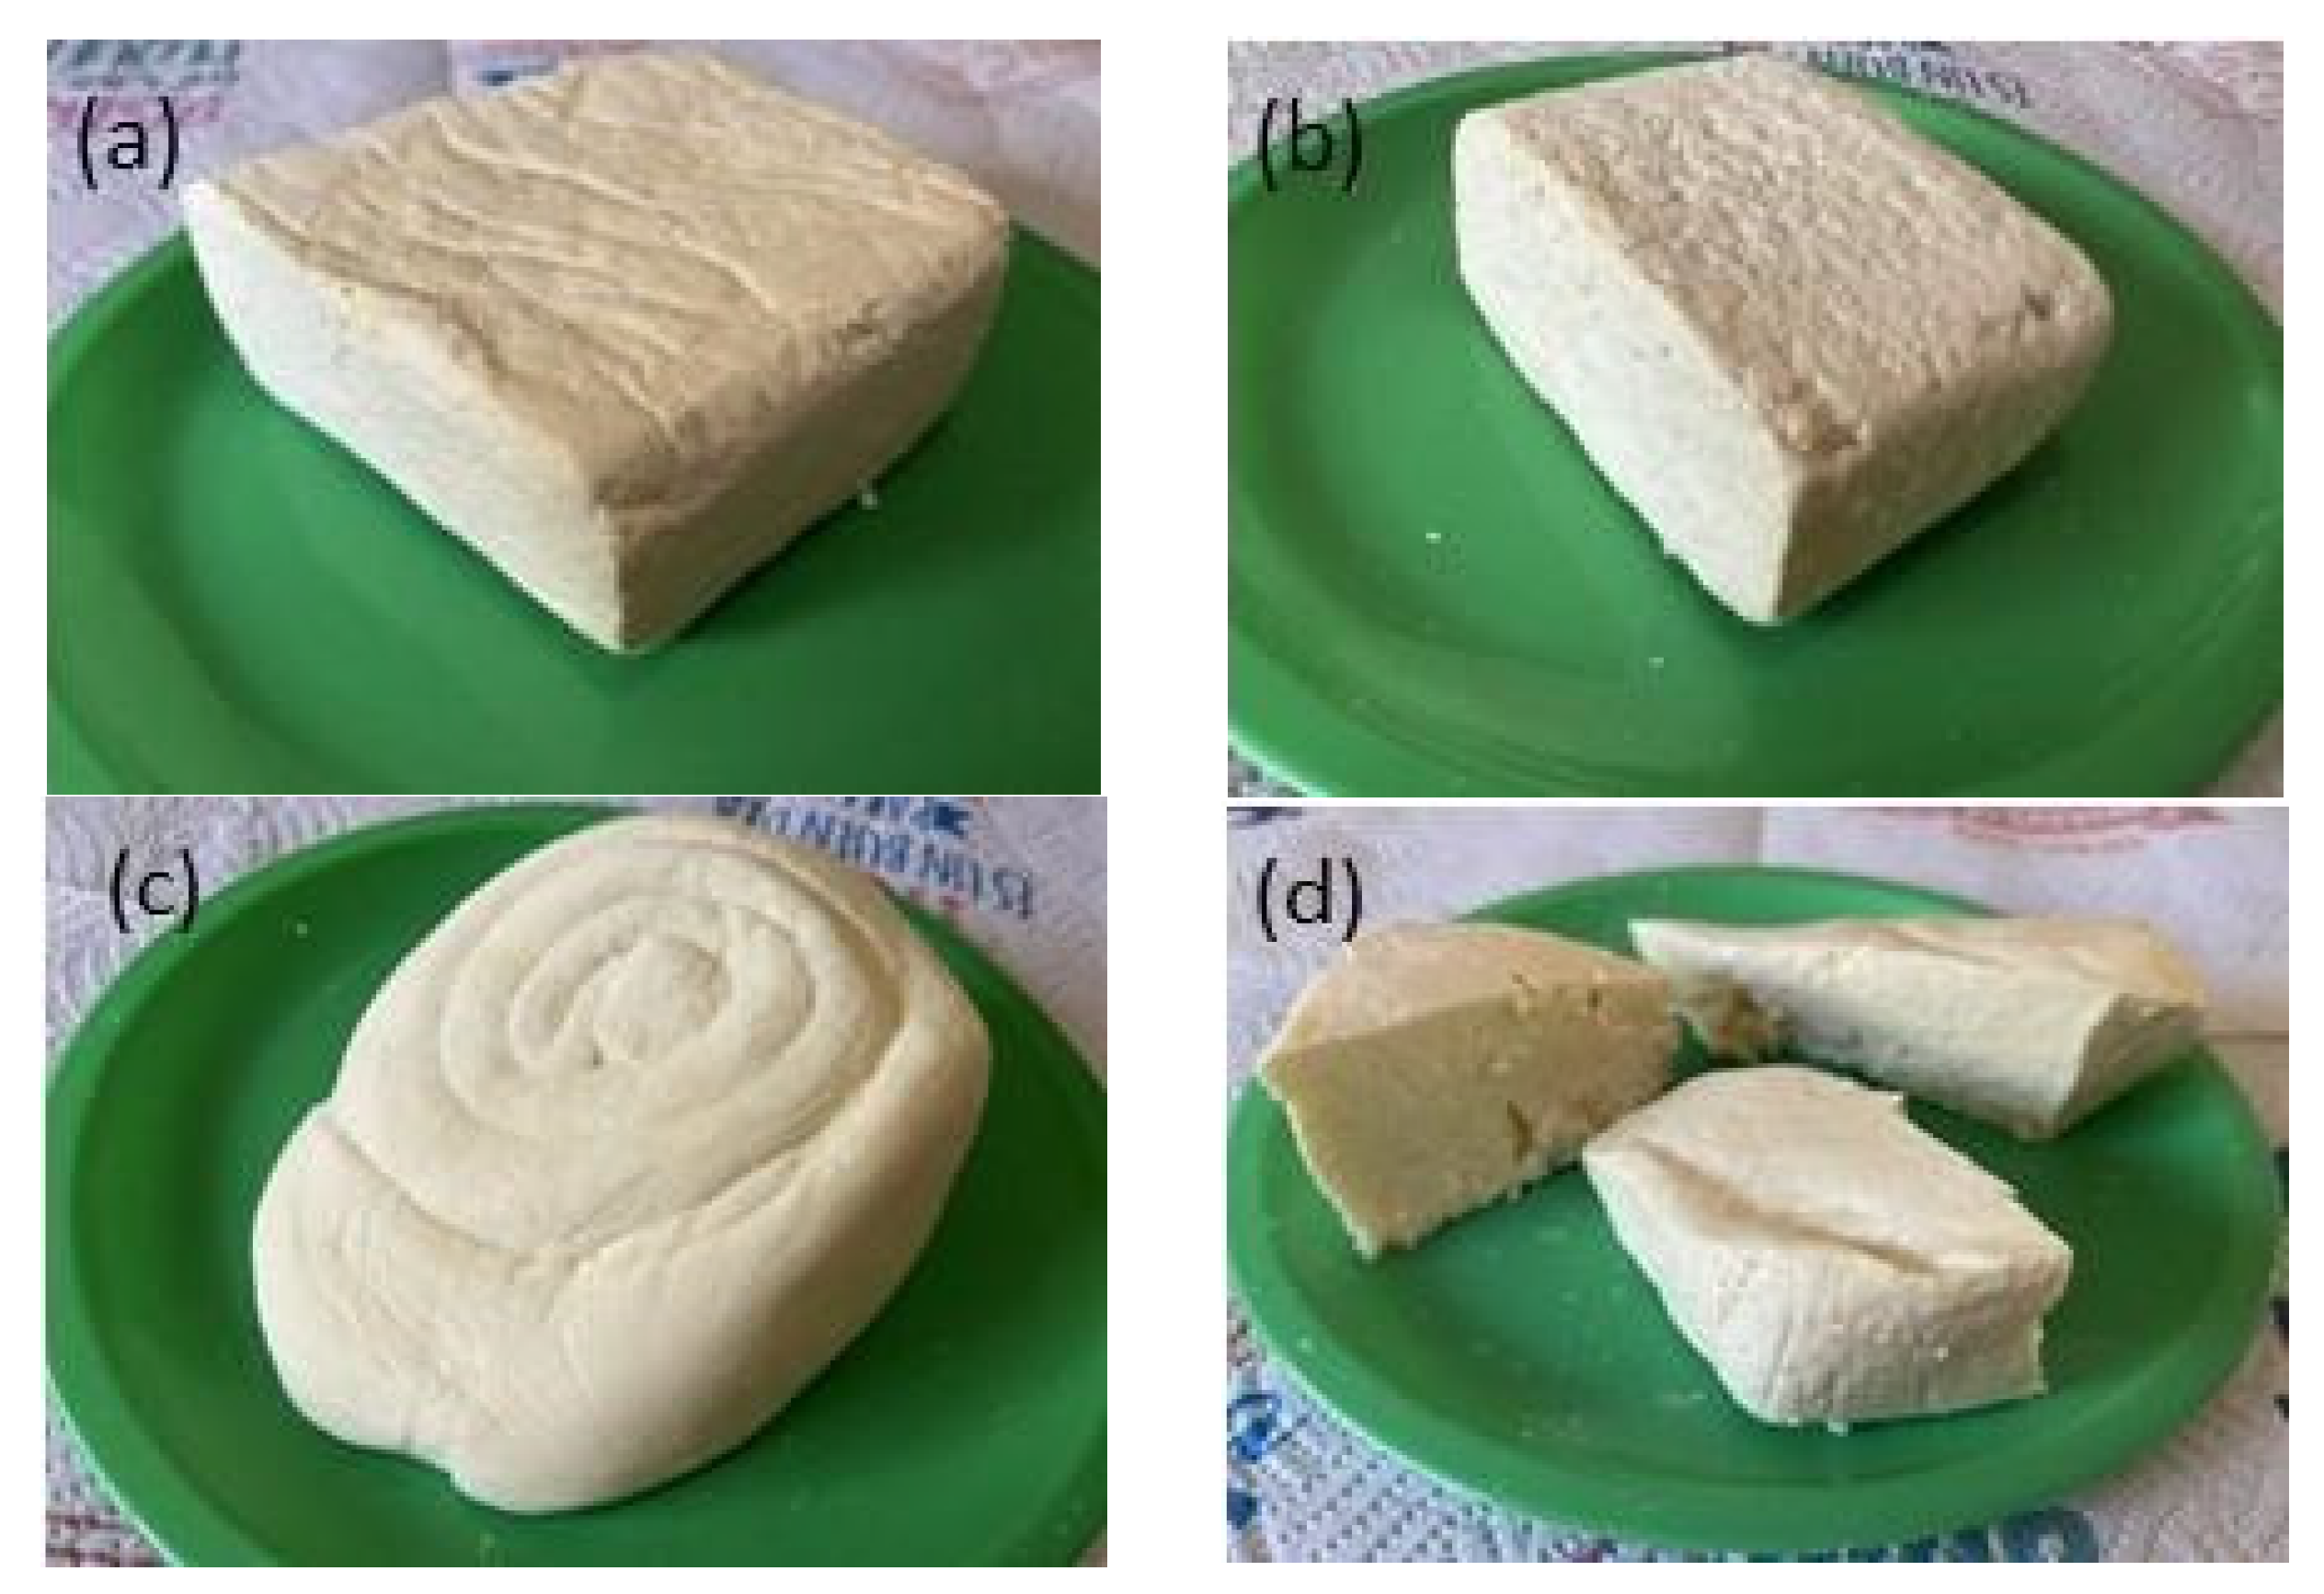
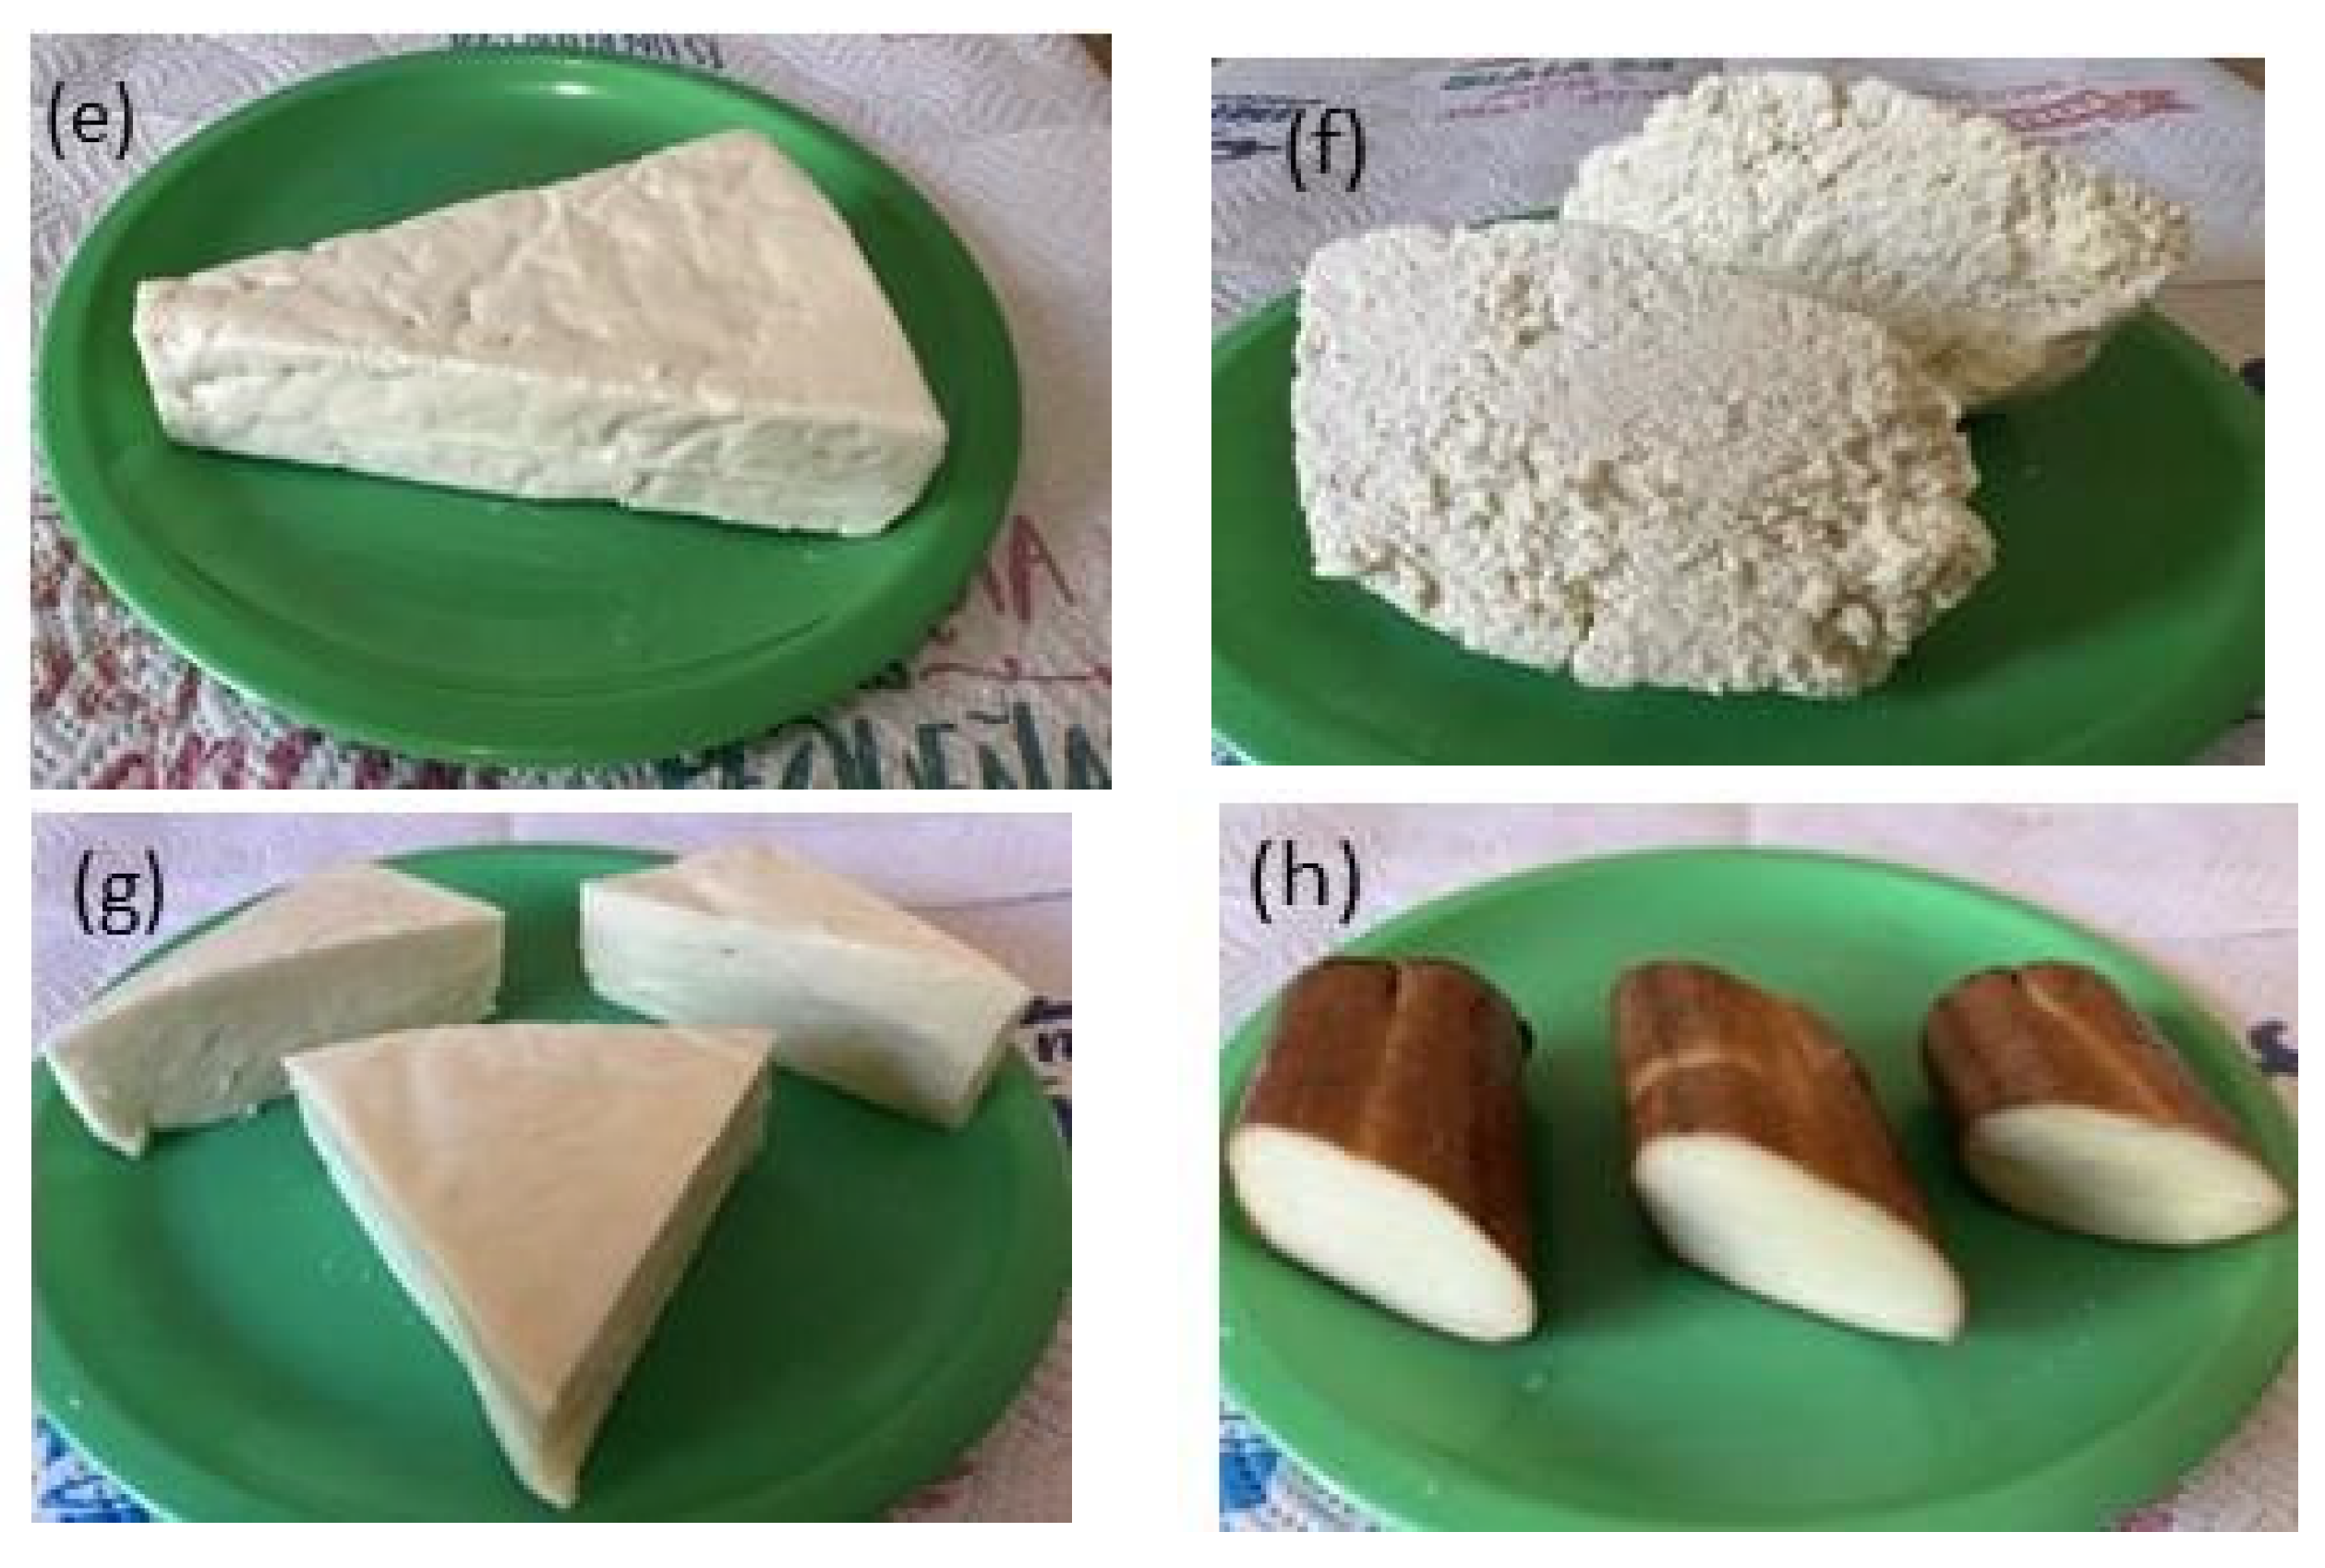
Figure 1 shows the distribution of the lead concentration values that we observed in the samples of artisanal cheese varieties crema, oaxaca, panela, cotija, and fresco we collected in the states of Tabasco and Chiapas. The maximum lead concentration of 0.0125 mg kg
−1 that we observed corresponded to a sample of crema artisanal cheese from the municipality of Huimanguillo, Tabasco could have been due to pollution during the manufacturing process [
16]. In general, the varieties cotija and crema had higher lead concentrations than the varieties oaxaca, fresh, and panela, which could be explained by the former varieties having a less content of water by weight (38.699% and 45.264%, respectively) than the latter (59.546, 60.799, and 61.325%) see
Table 3. In addition, the Tukey analysis showed that there are significant differences in moisture content between cotija and cream cheeses with respect to panela, oaxaca, and fresh cheeses (
Table 4). The results of the statistical analysis of the lead concentrations in the artisanal cheeses from the state of Tabasco and Chiapas gave a value of TC = −0.661 for the Student’s
t-test for paired data, which is within the range of critical value (CV between −2.672 and +2.672), indicating that there are no significant differences in the lead content in the cheese samples, which confirms the results from the Tukey test (
Table 5a), which could mean that in both processes the contamination sources were the same.
In a study of fresco cheese from the Mexican state of Puebla, by Benítez found an average lead concentration of 2.96 mg kg
−1 [
16]. Castro analyzed the lead concentration values in artisanal cheeses made in Santa Ana Xalmimilulco, Puebla, reporting averages of 0.11 ± 0.04 mg kg
−1 for ranchero and 0.05 ± 0.03 mg kg
−1 for Oaxaca cheese varieties, the authors attributed the presence of lead in the cheeses to the alfalfa fed to cattle being irrigation with polluted water from the Atoyac River [
17]. In studies made in Turkey, Yüzbaşi found lead concentrations between 0.0364 and 0.251 mg kg
−1 in the artisanal Kasar cheese samples from Ankara [
18], and Bakircioglu reported lead concentrations ranging from 0.60 ± 0.17 and 0.48 ± 17 mg kg
−1 for cream and white cheese made in Edirne [
19]. Moreno analyzed 57 varieties of cheese from different regions of Spain and found that their lead contents were between 5.0 ± 0.01 and 110.0 ± 8.2 µg kg
−1 [
1]; while in Italy, Lante reported a lead concentration of 0.06 mg kg
−1 in crescenza and squacquerone cheeses [
20].
2.3. Cadmium
The IARC and IPCS [
11,
12] determined that the ingestion of even a small amount of cadmium is highly toxic for humans; therefore, determining its presence in food is essential. The results of our determination of the content of Cd in cheese samples from Tabasco show average concentrations between 0.0023 ± 0.0025 and 0.0056 mg kg
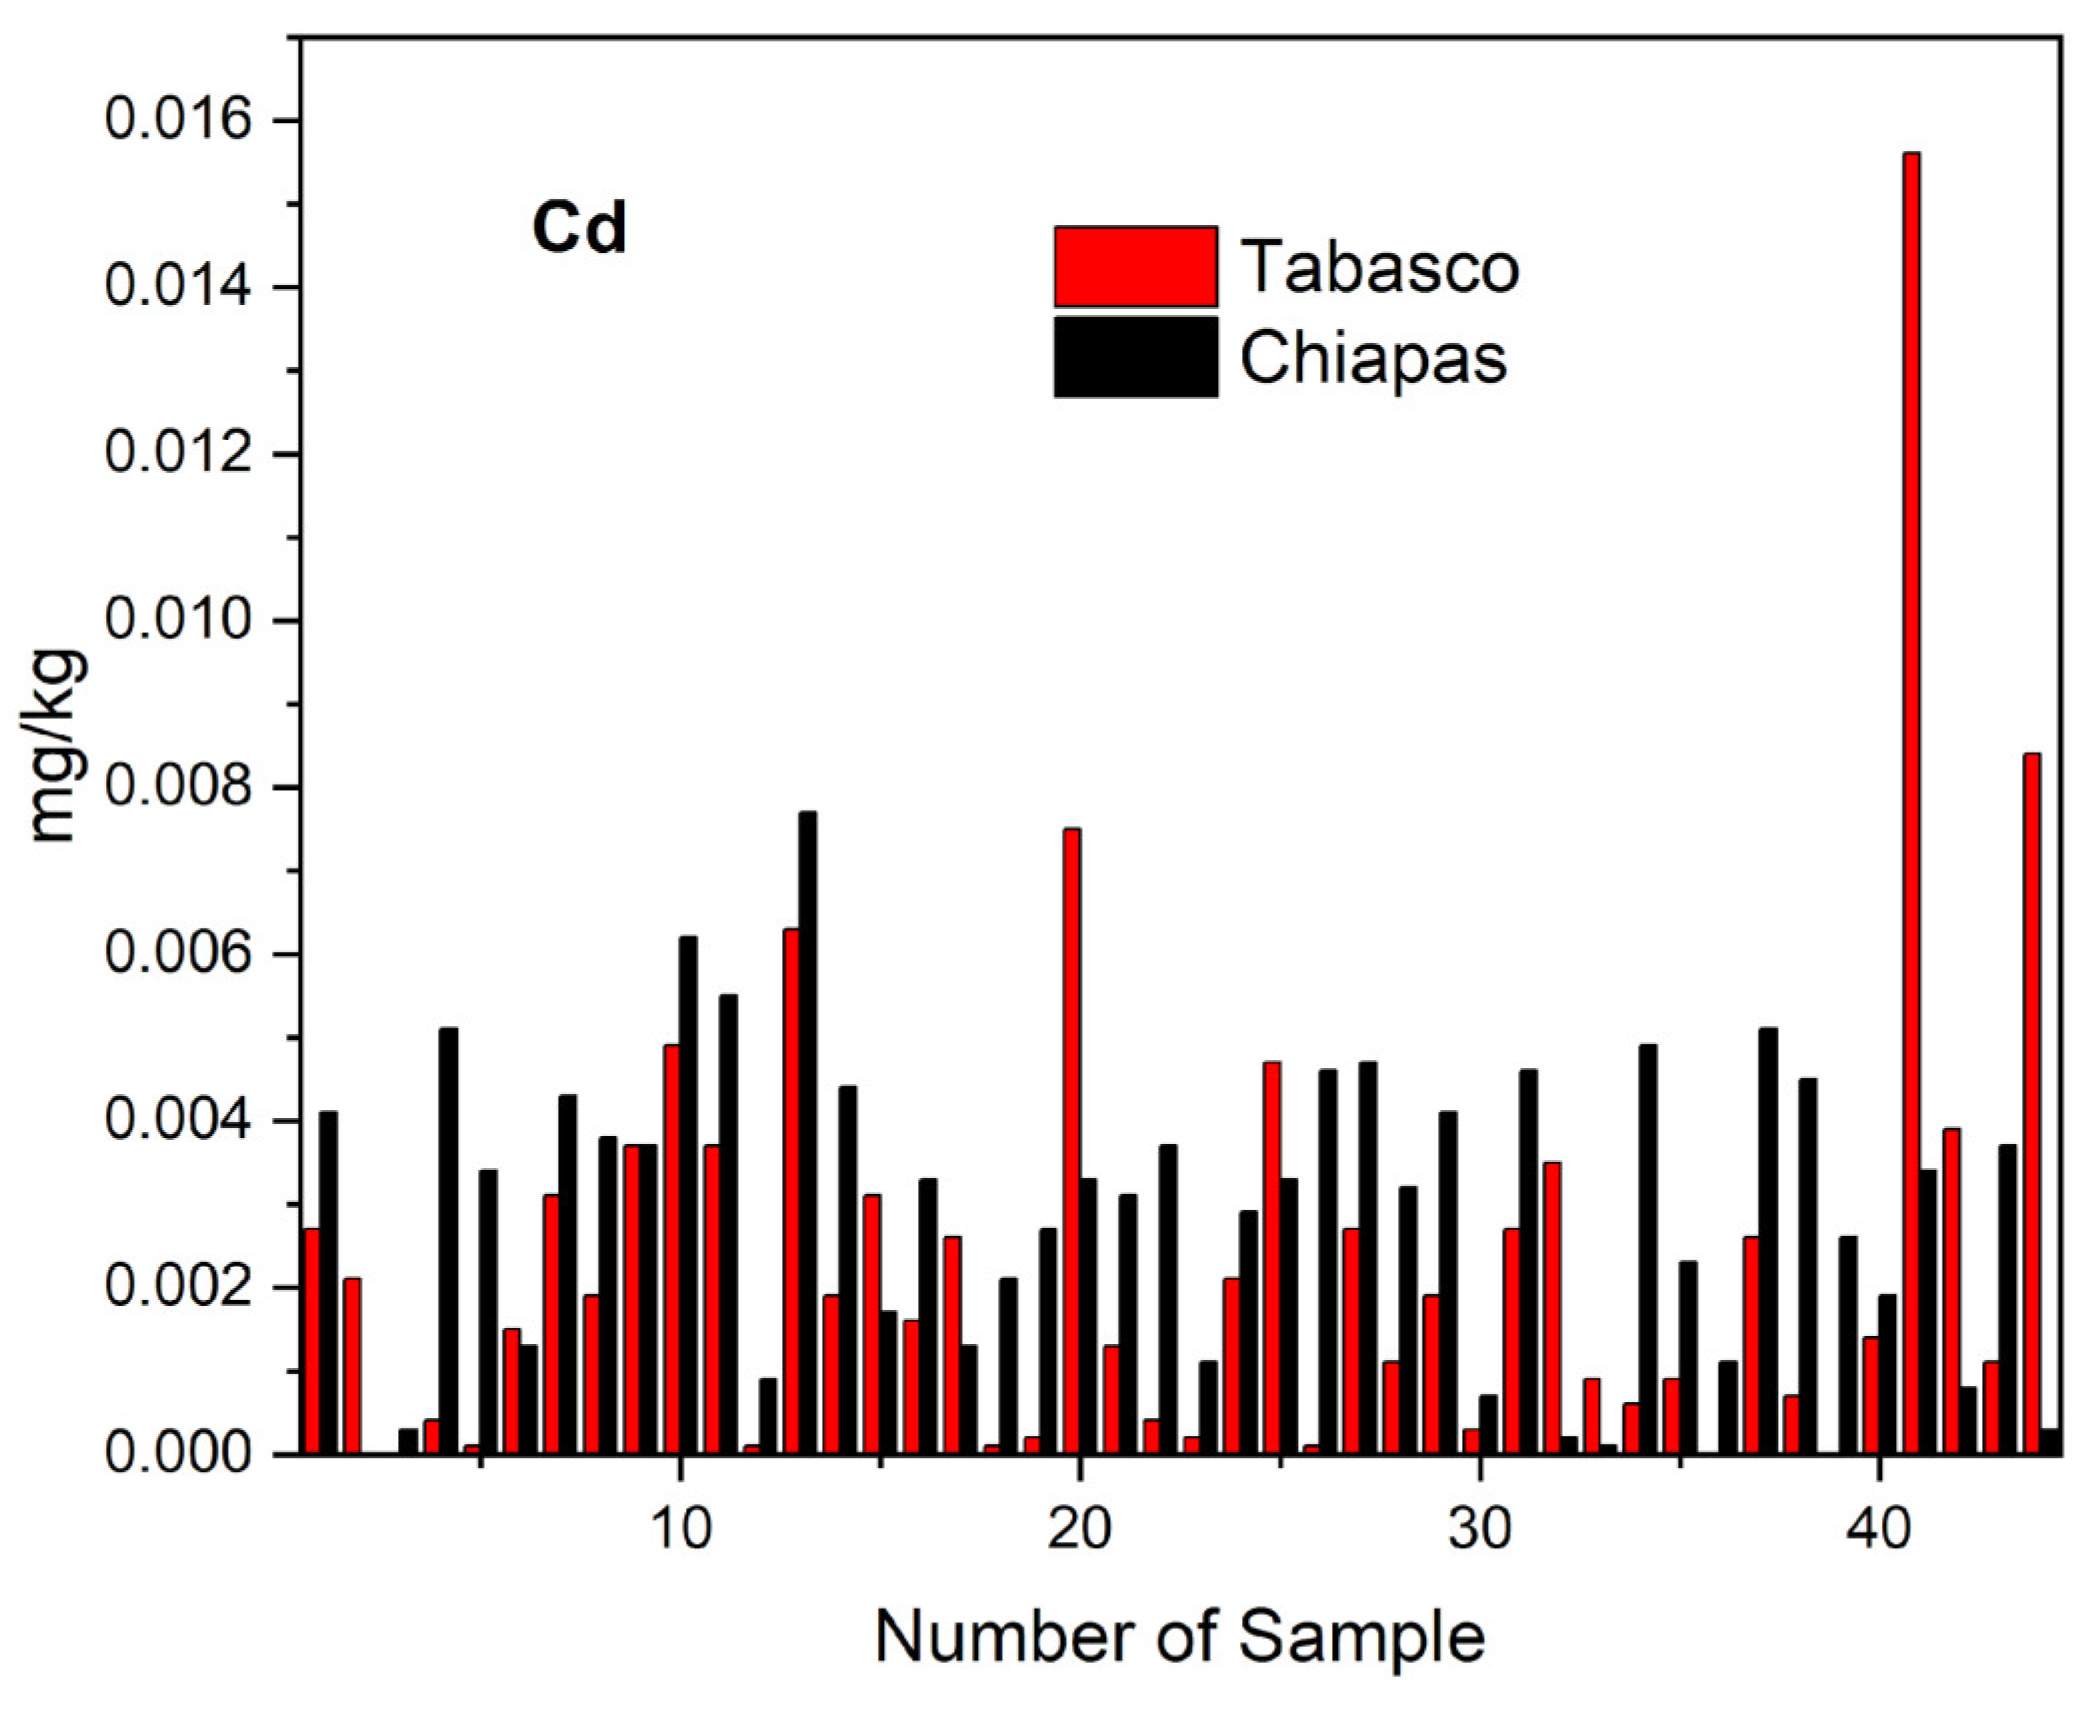
−1. By cheese variety, the average, minimum, and maximum values of cadmium concentration in mg kg
−1 were as follows: 0.0045, 0.0019, and 0.0156 for crema; 0.0009, 0.00, and 0.0031 for oaxaca; 0.0011, 0.0002, and 0.0037 for fresco; and 0.0019, 0.0001, and 0.0075 for panela. For the analyzed cheese samples from Chiapas, we found an average Cd concentration of 0.0023 ± 0.0025 with a minimum of 0.00 and a maximum of 0.0055 mg kg
−1. By cheese variety, the average, minimum, and maximum values of cadmium concentration in mg kg
−1 were as follows: 0.0043, 0.0029, and 0.0077 for crema; 0.0042, 0.0032, and 0.0062 for cotija; 0.0019, 0.00, and 0.0046 for oaxaca; and 0.0014, 0.0002, and 0.0034 for panela.
The distribution of the cadmium concentrations we found in the crema, oaxaca, panela, cotija, and fresco cheese samples from Tabasco and Chiapas shows that the highest Cd concentrations correspond to crema and cotija cheeses, and the lowest Cd concentrations, to the panela, oaxaca, and fresco samples (
Figure 2). The (
Table 3) latter result may have been due to the lower water content of the crema (<45.264% by weight) and cotija samples (<38.699%) relative to that in the panela, oaxaca, and fresco (>59%). The results obtained from the statistical analysis of cadmium concentrations in Tabasco and Chiapas cheeses showed that there are no significant differences between cheese samples since the value of the paired t-Student test (TC = −1.318) is within the range of critical value (VC between −2.672 and +2.672). Furthermore, the results of the Tukey’s test confirmed this result (
Table 5b), which suggests that the possible sources of cadmium pollution were similar in both states. We found that the cadmium concentrations in all the samples we analyzed were under the maximum values established by the Codex Alimentarius 0.05 mg kg
−1 [
5] and the 1.0 mg kg
−1 FAO/WHO [
4].
In a study made in the Mexican state of Puebla, Castro found the presence of cadmium in urine, blood, and milk of Holstein cattle in the Santa Ana Xalmimilulco region in the municipality of Huejotzingo and determined its concentration in milk samples to be 0.54 mg kg
−1, which the authors attributed to the cattle’s ingestion of alfalfa containing heavy metals [
21]. In their study of the heavy metal content in samples of fresco cheeses sold in markets in the city of Puebla, Benítez found heavy metals, including an average Cd concentration of 0.13 mg kg
−1 [
16]. In Egypt, Meshref reported an average cadmium concentration of 0.09 mg kg
−1 in Kareish in the Beni-Suef region [
22]. Elbarbary and Hamouda found 0.24 mg kg
−1 of cadmium in feta cheese samples [
23]. In Turkey, Çetinkaya reported an average cadmium concentration of 0.028 mg kg
−1 in cami bogazi cheese samples from the Trabzon region [
24]. The concentrations of cadmium in cheeses reported in the literature that we found were higher than those we observed in our study.
2.4. Nickel
The United States Department of Health and Human Services (DHHS) determined that metallic nickel and some nickel compounds are carcinogens, and the ingestion of high Ni concentrations can be hazardous to human health [
25,
26]. The FAO and European Commission (EC) have not established the permitted maximum intake limit of nickel for humans [
4,
15]; however, the Integrated Risk Information System of the United States Environmental Protection Agency (US-EPA-IRIS) established a 300 µg/kg limit [
14,
27], and the WHO established a tolerable daily intake of 11 μg kg
−1 of body weight for children and 12 μg kg
−1 of body weight for adults [
28].
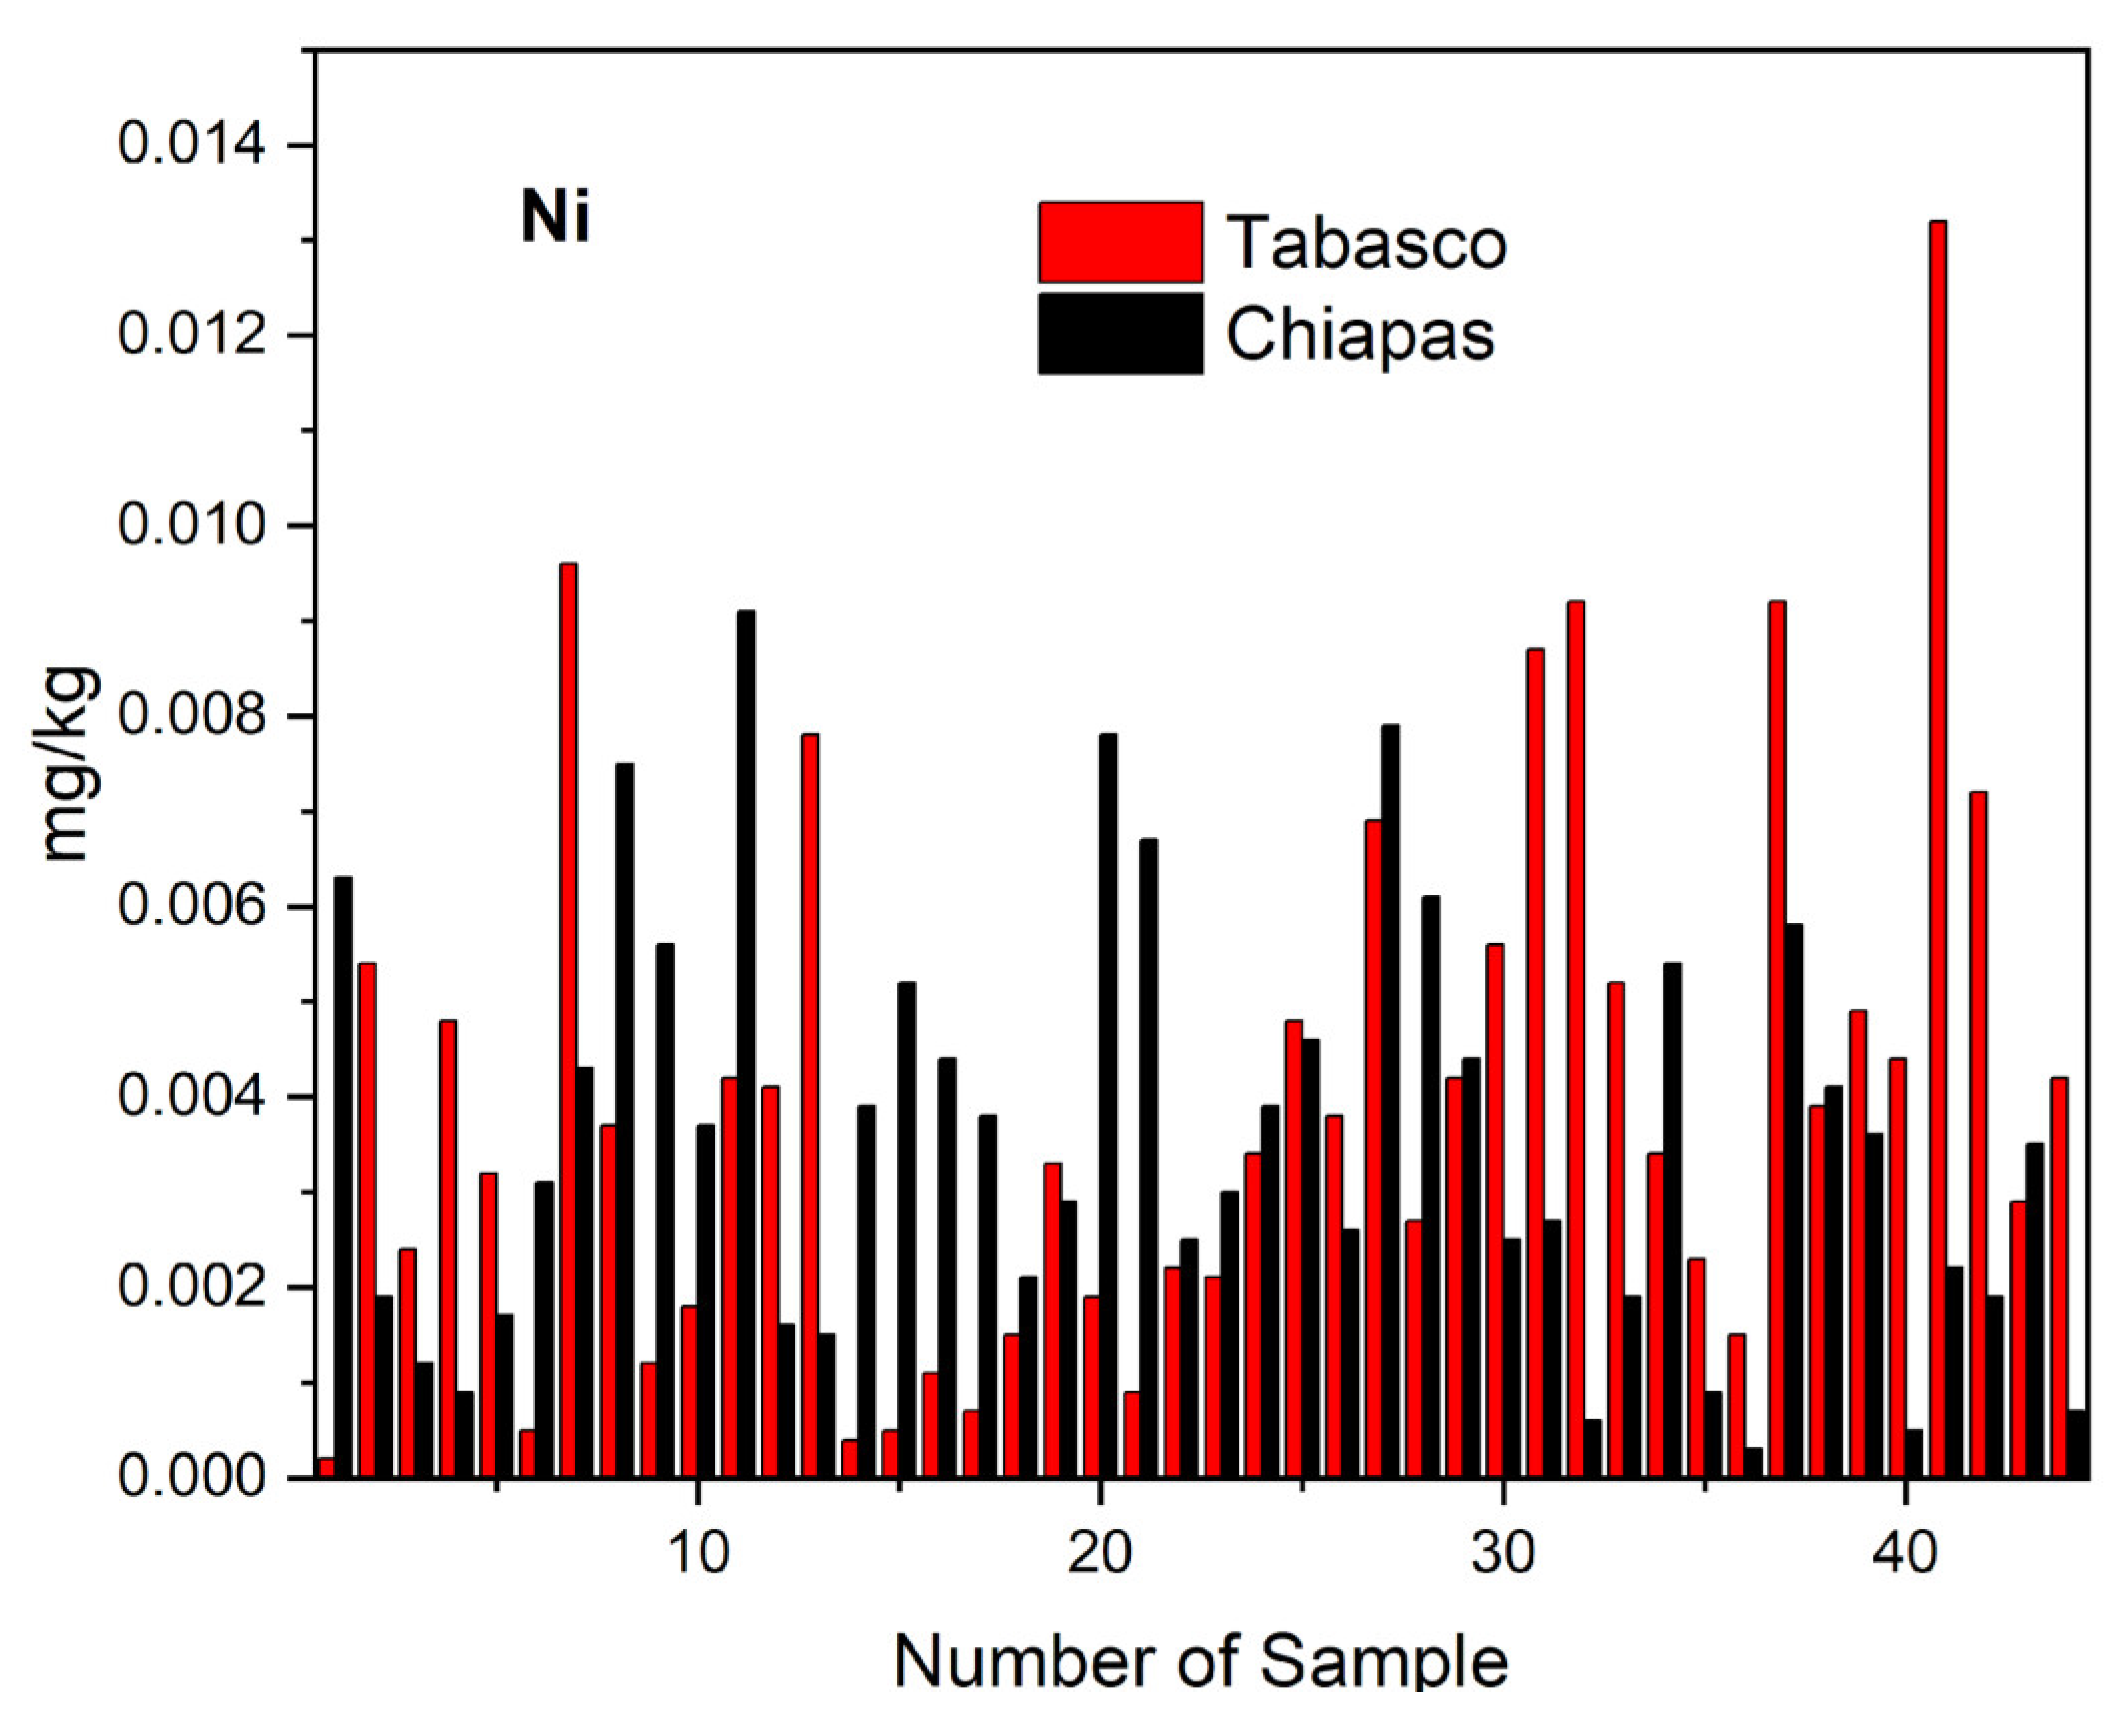
The results of our analysis of artisanal cheese samples from Tabasco showed an average nickel concentration of 0.0039 ± 0.0046 mg kg
−1, a maximum value of 0.0132 mg kg
−1, and a minimum of 0.0002 mg kg
−1. By cheese variety, the average, maximum and minimum values in mg kg
−1 were as follows: 0.0059, 0.0002, and 0.0132 for crema; 0.0029, 0.0005, and 0.0049 for oaxaca; 0.0031, 0.0021, and 0.0042 for fresco; and 0.0029, 0.0004, and 0.0056 for panela. For the cheese samples from Chiapas, we found an average Ni concentration of 0.0031 ± 0.0039 mg kg
−1 with a minimum of 0.0003 mg kg
−1 and a maximum of 0.0091 mg kg
−1. For the same state by variety, we found average, minimum, and maximum Ni concentrations in mg kg
−1 of 0.0050, 0.0015, and 0.0091 for crema; 0.0052, 0.0027, and 0.0079 for cotija; 0.0031, 0.0016, and 0.0052 for oaxaca; and 0.0017, 0.0006, and 0.0031 for panela. The distribution of nickel concentrations in cheese samples we analyzed from Tabasco and Chiapas (
Figure 3) shows that matured cheeses with lower humidity content like crema and cotija have higher concentrations of nickel than the more humidity varieties like oaxaca, panela, and fresco (
Table 3 and
Table 4). The statistical analysis of the nickel concentrations in the samples yielded a value of TC = +0.698, and Tukey’s test indicated no significant differences (
Table 5c), again showing similar contamination sources in both geographic areas.
Our results compare well with those of the analyses of Ni concentrations made by Castro in samples of oaxaca (0.003 mg kg
−1) and ranchero (0.01 mg kg
−1) artisanal cheeses from the Mexican state of Puebla [
17]. However, the values of nickel concentration in artisanal cheeses reported by Nöel for French samples (0.409 mg kg
−1) [
29], and by Olujimi for milk (7.70 mg kg
−1) and cheese (8.33 mg kg
−1) samples from the Nigerian Ogun and Oyo states are much higher than those reported for Mexico [
30]; these authors attributed the contamination with nickel of milk and cheese to oil industry activities and the use of agrochemical inputs.
2.6. Copper
Copper is an essential microelement active in vital functions of the human body; however, the ingestion of high concentrations of copper might cause health issues [
49]. The results of our analyses of cheese samples made in Tabasco and Chiapas showed copper concentrations below the maximum limits established by the FAO/WHO [
4]. The average, minimum, and maximum copper concentrations in mg kg
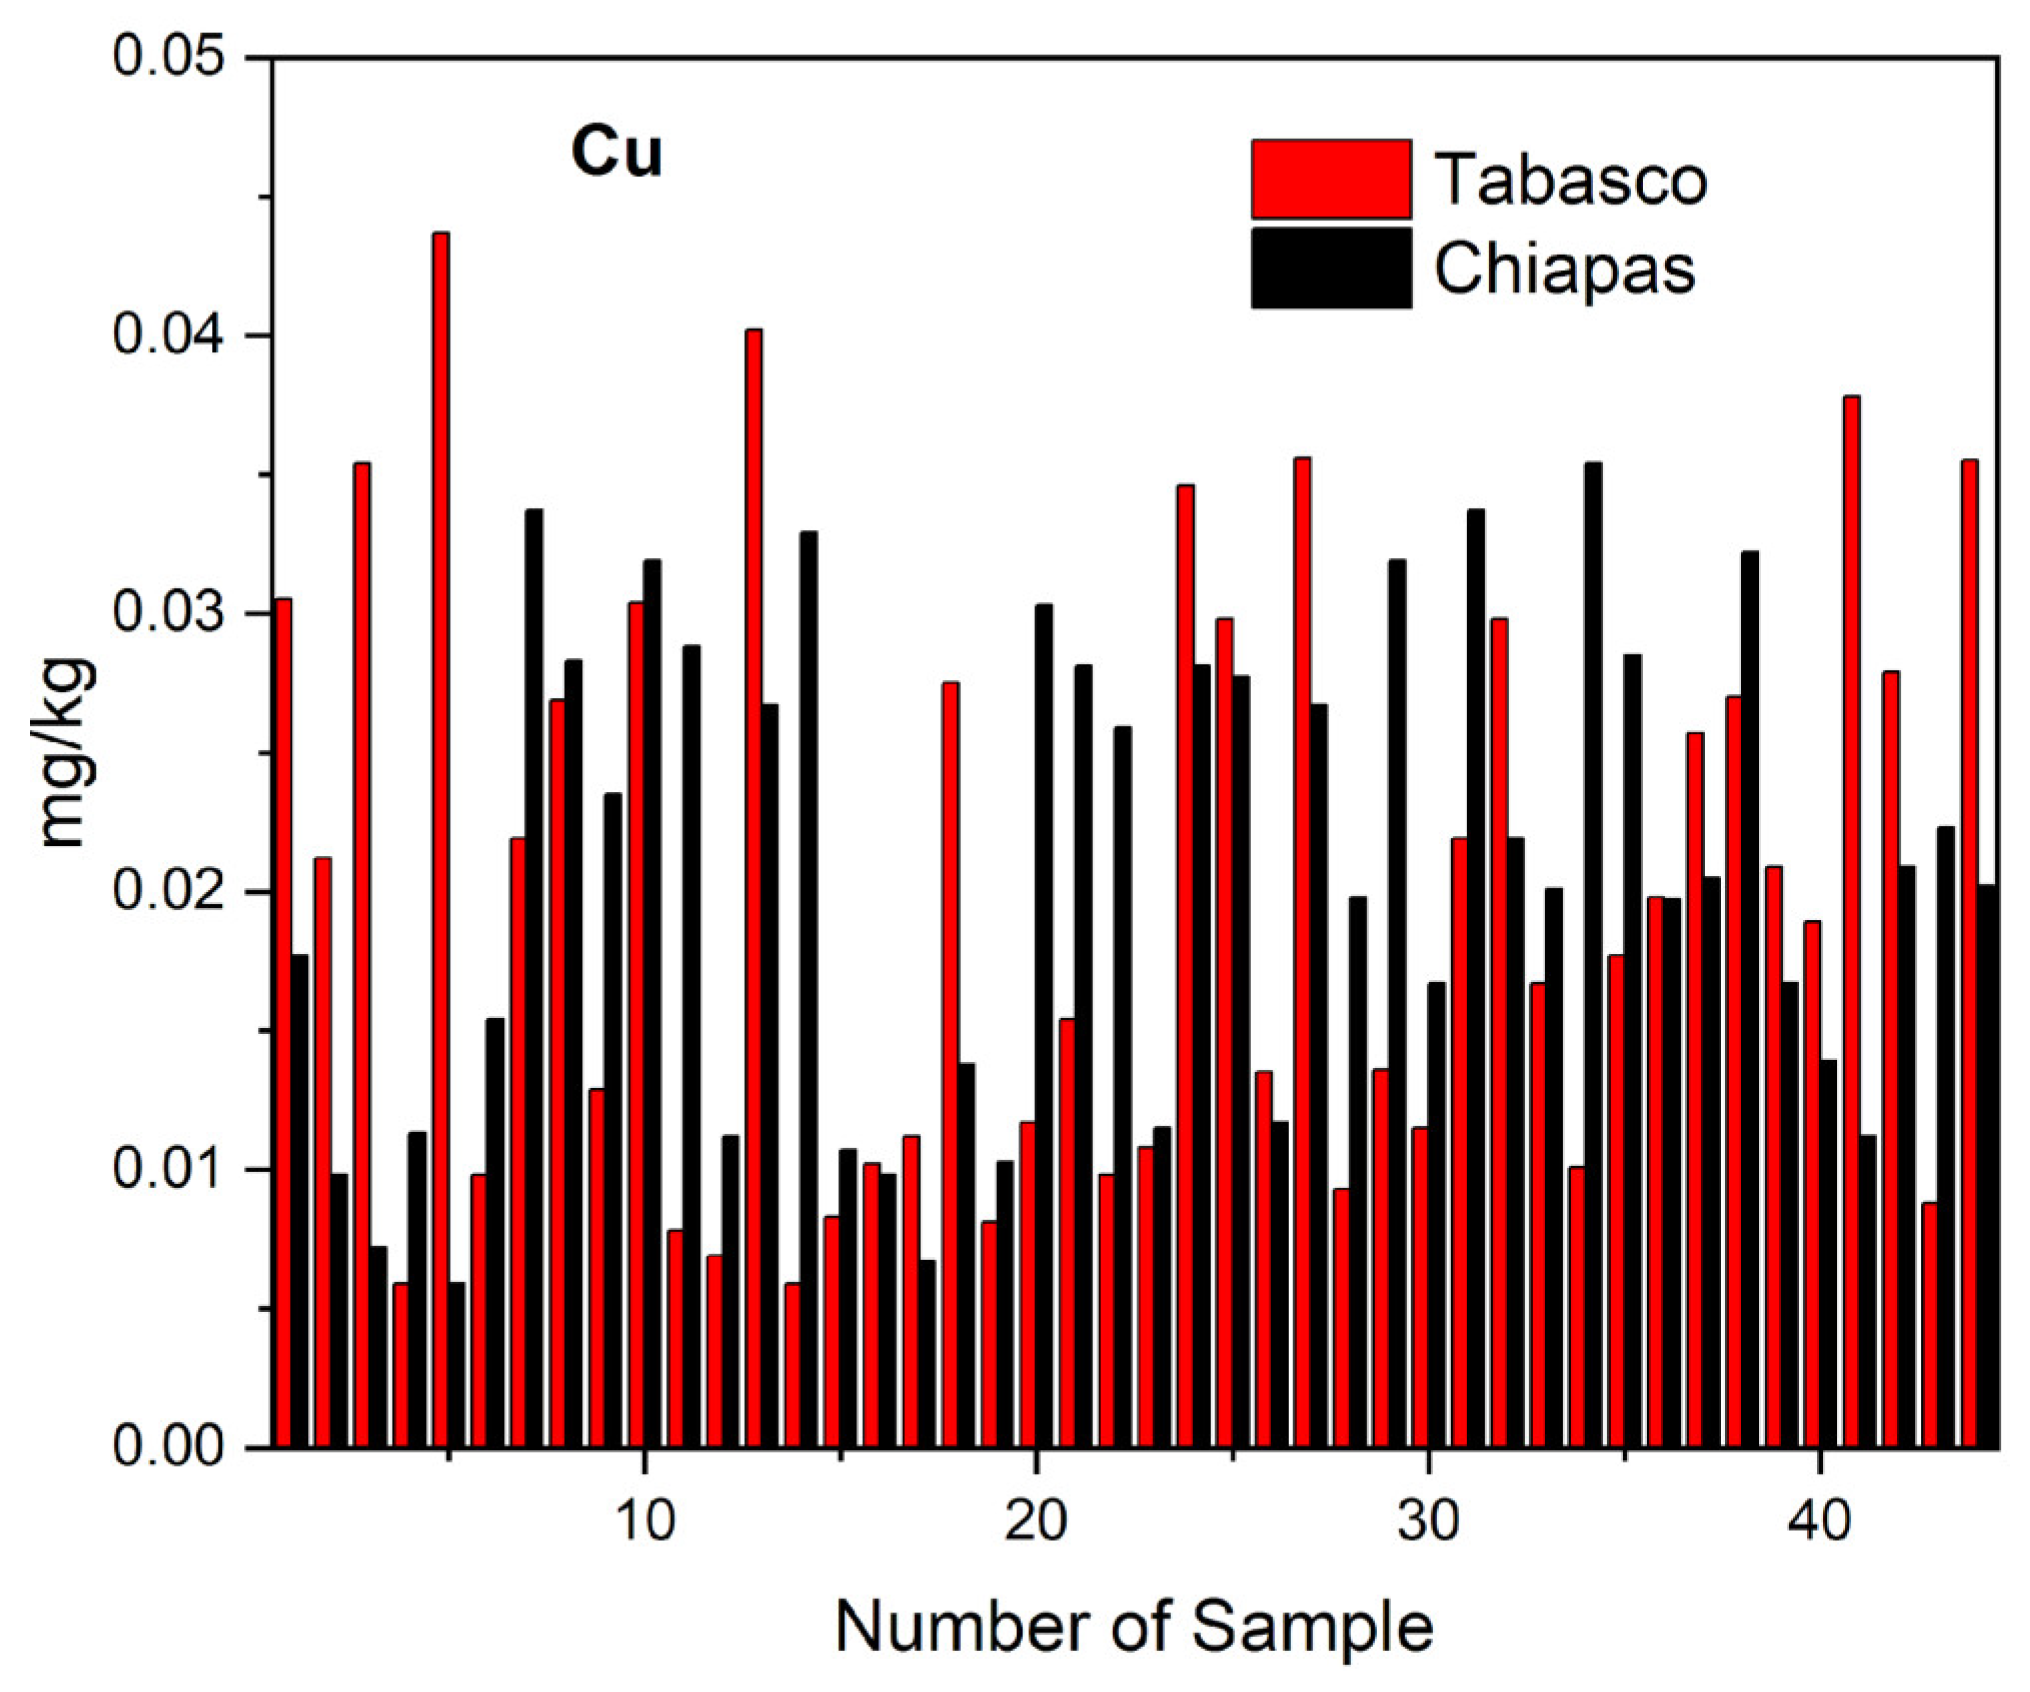
−1 that we observed in cheese samples from Tabasco were 0.0199 ± 0.021, 0.0059, and 0.0437. By cheese variety, the average, minimum, and maximum copper concentrations in mg kg
−1 were 0.0285, 0.0129, and 0.0402 for crema, 0.0233, 0.0059, and 0.0884 for oaxaca, 0.0093, 0.0078, and 0.0108 for fresco, and 0.0148, 0.0059, and 0.0346 for panela. In the cheese samples from Chiapas, the average, minimum, and maximum copper concentrations in mg kg
−1 that we recorded were 0.0202 ± 0.022, 0.0007, and 0.0354. By cheese variety, the average, minimum, and maximum copper concentrations in mg kg
−1 were as follows: 0.0271, 0.0167, and 0.0354 for crema; 0.0141, 0.0067, and 0.0223 for oaxaca; 0.0267, 0.0113, and 0.0337 for cotija; and 0.0165, 0.0059, and 0.0285 for panela. No significant differences in copper concentrations were found between the artisanal cheeses from Tabasco and Chiapas. The paired data test was found to be TC = +0.3578, a value within the CV range (−2.672 to +2.672) that was confirmed by the Tukey’s test (
Table 5d).
The distribution of copper concentrations we observed in the cheese samples from Tabasco and Chiapas shown in
Figure 4 shows a high variation in such concentrations. By cheese variety, our results determined the samples of crema contained copper at concentrations ranging between 0.0402 and 0.0129 mg kg
−1, of oaxaca between 0.0437 and 0.0007 mg kg
−1, of cotija between 0.0337 and 0.0113 mg kg
−1, of frescos between 0.0197 and 0.0078 mg kg
−1, and of panela between 0.0346 and 0.0039 mg kg
−1. We can attribute this variability and the low concentration of copper in the cheese samples from Tabasco and Chiapas to the states’ soil type variation. In both states the soil types include Gleysol, Fluvisol, Histosol, Leptosol-Vertisol, Acrisol, Vertisol, Luvisol, and Ferralsol, whose differences in the values of pH, electric conductivity, cation exchange capacity, and organic matter content are factors determining the amount of extractable concentration of copper in each soil type, in studies carried out by Palma and the National Institute of Statistic and Geography [
52,
53]. Studies carried out by De la Cruz report extractable copper concentrations of 0.99–2.45 mg kg
−1 in Vertisols and 0.98–2.45 mg kg
−1 in Fluvisoles, and Salgado reported extractable copper concentrations in subunits of Acrisols of 0.60 ± 0.30 mg kg
−1 (subunit ACdyhfr) 0.80 ± 0.50 mg kg
−1 (ACfrpl), 0.40 ± 0.30 mg kg
−1 (ACfrum), 1.10 ± 0.20 mg kg
−1 (ACglpl), 0.80 ± 0.50 mg kg
−1 (AChupl), 0.60 ± 0.50 mg kg
−1 (AChuum), 0.80 ± 0.20 mg kg
−1 (ACumgl) and 0.70 ± 0.50 mg kg
−1 (ACumpl) [
35,
36]. The value of copper concentration that we found in the analyzed cheese samples was below the 0.40 mg L
−1 maximum permitted limit in milk and dairy products by the European Commission (EC) [
54]. The copper contained in the artisanal cheese samples from Tabasco and Chiapas may contribute to the recommended daily ingestion of 3 mg for adults FAO/WHO [
4].
Oaxaca and ranchero cheeses made in Santa Ana Xalmimilulco, Puebla, Castro reported a 0.02 mg kg
−1 copper content, and for cheese samples from markets in the city of Puebla [
55]. In Egypt, Meshref reported copper concentrations of between 0.002 and 0.53 mg kg
−1 in samples of Kareish cheese made in the Beni-Suef region [
22]. In Europe, Elbarbary and Hamouda reported copper concentrations of 3.25 ± 1.06 mg kg
−1 for feta cheese [
56], and Reinholds found an average copper concentration of 0.29 mg kg
−1 in cheeses made in the Kvemo Kartli region of Georgia [
14]. Al Sidawi determined an average copper concentration of 1.261 ± 0.739 mg kg
−1 in imeruli cheese and 2.463 ± 2.314 mg kg
−1 in sulguni cheese [
49]. Previous reports of copper content in cheese samples are similar to or higher than those we determined in our analysis of cheese varieties made in the states of Tabasco and Chiapas.
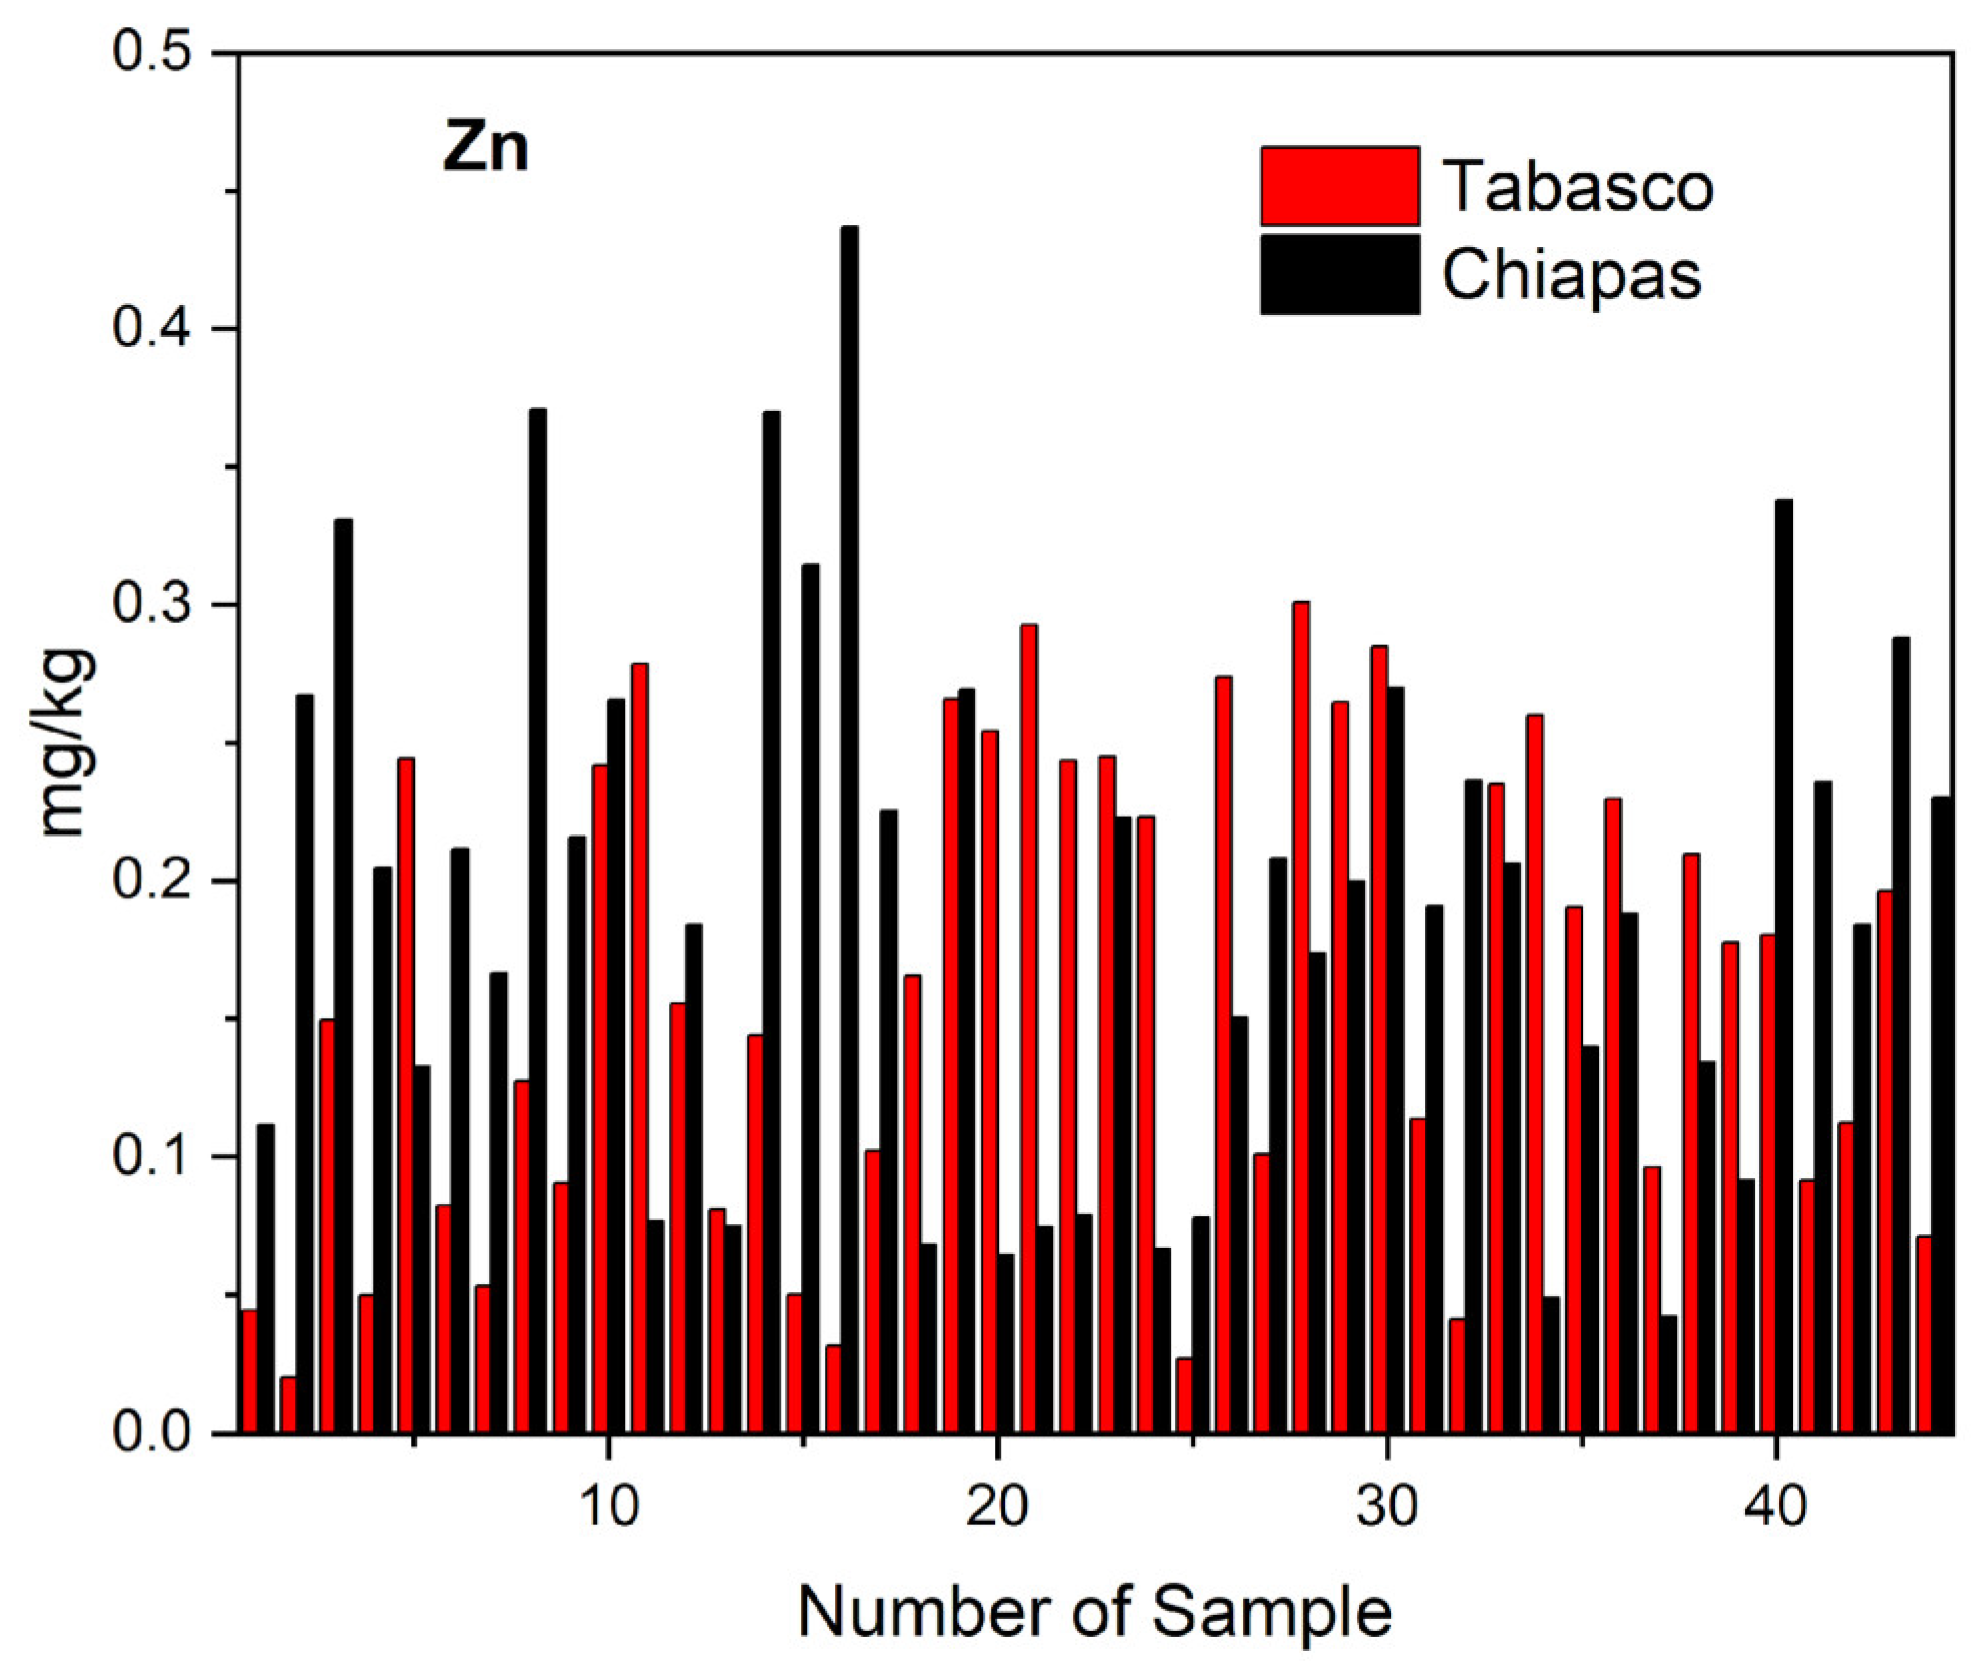
2.7. Zinc
Zinc is another essential element that when ingested at high concentrations might lead to neurological, hematological, immunological, renal, hepatic, cardiovascular, and genotoxic conditions [
23]. The average, minimum, and maximum concentrations of zinc in mg kg
−1 that we determined in the cheese samples from the states of Tabasco were 0.161 ± 0.18, 0.0204, and 0.301 mg kg
−1. By cheese variety, the average, minimum, and maximum zinc concentrations in mg kg
−1 we observed were as follows: 0.0874, 0.0204, and 0.2418 for crema; 0.1579, 0.0317, and 0.2645 for oaxaca; 0.2584, 0.2435, and 0.2785 for fresco; and 0.2437, 0.1436, and 0.2927 for panela. For the samples from Chiapas, the average, minimum, and maximum zinc concentrations in mg kg
−1 that we observed were 0.194 ± 0.21, 0.0421, and 0.437 mg kg
−1. By cheese variety, the average, minimum, and maximum zinc concentrations in mg kg
−1 we recorded were as follows: 0.1008, 0.0421, and 0.3699 for crema; 0.2437, 0.0677, and 0.4369 for oaxaca; 0.2216, 0.1664, and 0.3708 for cotija; and 0.2181, 0.1325, and 0.3308 for panela. It was found that there are no significant differences in the Zn concentrations in the Tabasco and Chiapas cheese samples. In
Table 5e, it is observed that Tukey’s test presents only one grouping (A) and the Student’s
t-test with TC (−1.376) is between the critical values VC (−2.672; +2.672).
As seen in
Figure 5, we found an ample variation in the zinc concentration of the cheese samples that we analyzed, for example, these values (expressed in mg kg
−1) were 0.0204–0.369 for crema, 0.032–0.437 for oaxaca, 0.188–0.278 for cotija, 0.167–0.374 for fresco, and 0.132–0.334 for panela. Such variability in zinc content might have been due to the diversity of soil types in Tabasco and Chiapas, and to the physicochemical variables of these types [
52], which agrees both with the similarities in soil types between both states and with the recognition that the content of zinc in the cheese samples was due to the soil types present in the geographic regions where they were collected, as previously reported in other studies. For example, De la Cruz determined Zn concentrations of 0.68–0.85 mg kg
−1 in Fluvisols, and of 0.66–0.87 mg kg
−1 in Vertisols, and in different Acrisol units [
35], and Salgado reported Zn concentrations in mg kg
−1 of 0.30 ± 0.20 (ACdyhfr), 0.50 ± 0.30 (ACfrpl), 0.40 ± 0.10 (ACfrum), 0.50 ± 0.20 (ACglpl), 0.60 ± 0.50 (AChupl), 0.30 ± 0.20 (AChuum), 0.30 ± 0.20 (ACumgl), and 0.51 ± 0.30 (ACumpl) [
36].
The recommended daily intake of zinc for adult women and men is 8 mg and 11 mg kg
−1, respectively. The range of zinc concentration we found in cheese samples from Tabasco and Chiapas suggests that their consumption might contribute to satisfy the minimum requirement of zinc for humans. Our results agree with those of Castro for cheeses in the Mexican state of Puebla, who reported zinc concentrations of 0.18 ± 0.09 mg kg
−1 for oaxaca and 0.74 ± 0.1 mg kg
−1 for ranchero cheeses [
17]. In work carried out by Ghafari and Sobhanardakani reported 0.198 mg kg
-1 of zinc in the cheeses produced from Hamedan, Iran [
57]. Al Sidawi reported zinc contents of 75.86 ± 52.528 mg kg
−1 in imeruli and 124.8 ± 97.775 mg kg
−1 in sulguni cheeses manufactured in the province Kartli, Georgia [
49]. For blue cheese sold in the European Union, Reinholds reported zinc concentrations between 10.4 and 39.5 mg kg
−1 [
14]. For different cheeses made in Turkey, Mendil and Orak reported 12.0 mg kg
−1 and 15.57 mg kg
−1 of zinc for white cheese [
58,
59]; Çetinkaya and collaborators found an average zinc concentration of 27.52 ± 1.85 mg kg
−1 in cheese samples in the Cami Bogazi region and for white cheeses [
24]. The authors attributed the presence of zinc in cheeses to the use of contaminated machinery and containers during cheese making, and to the transport of zinc through the food web due to the environmental pollution of soil, water, and fodder.
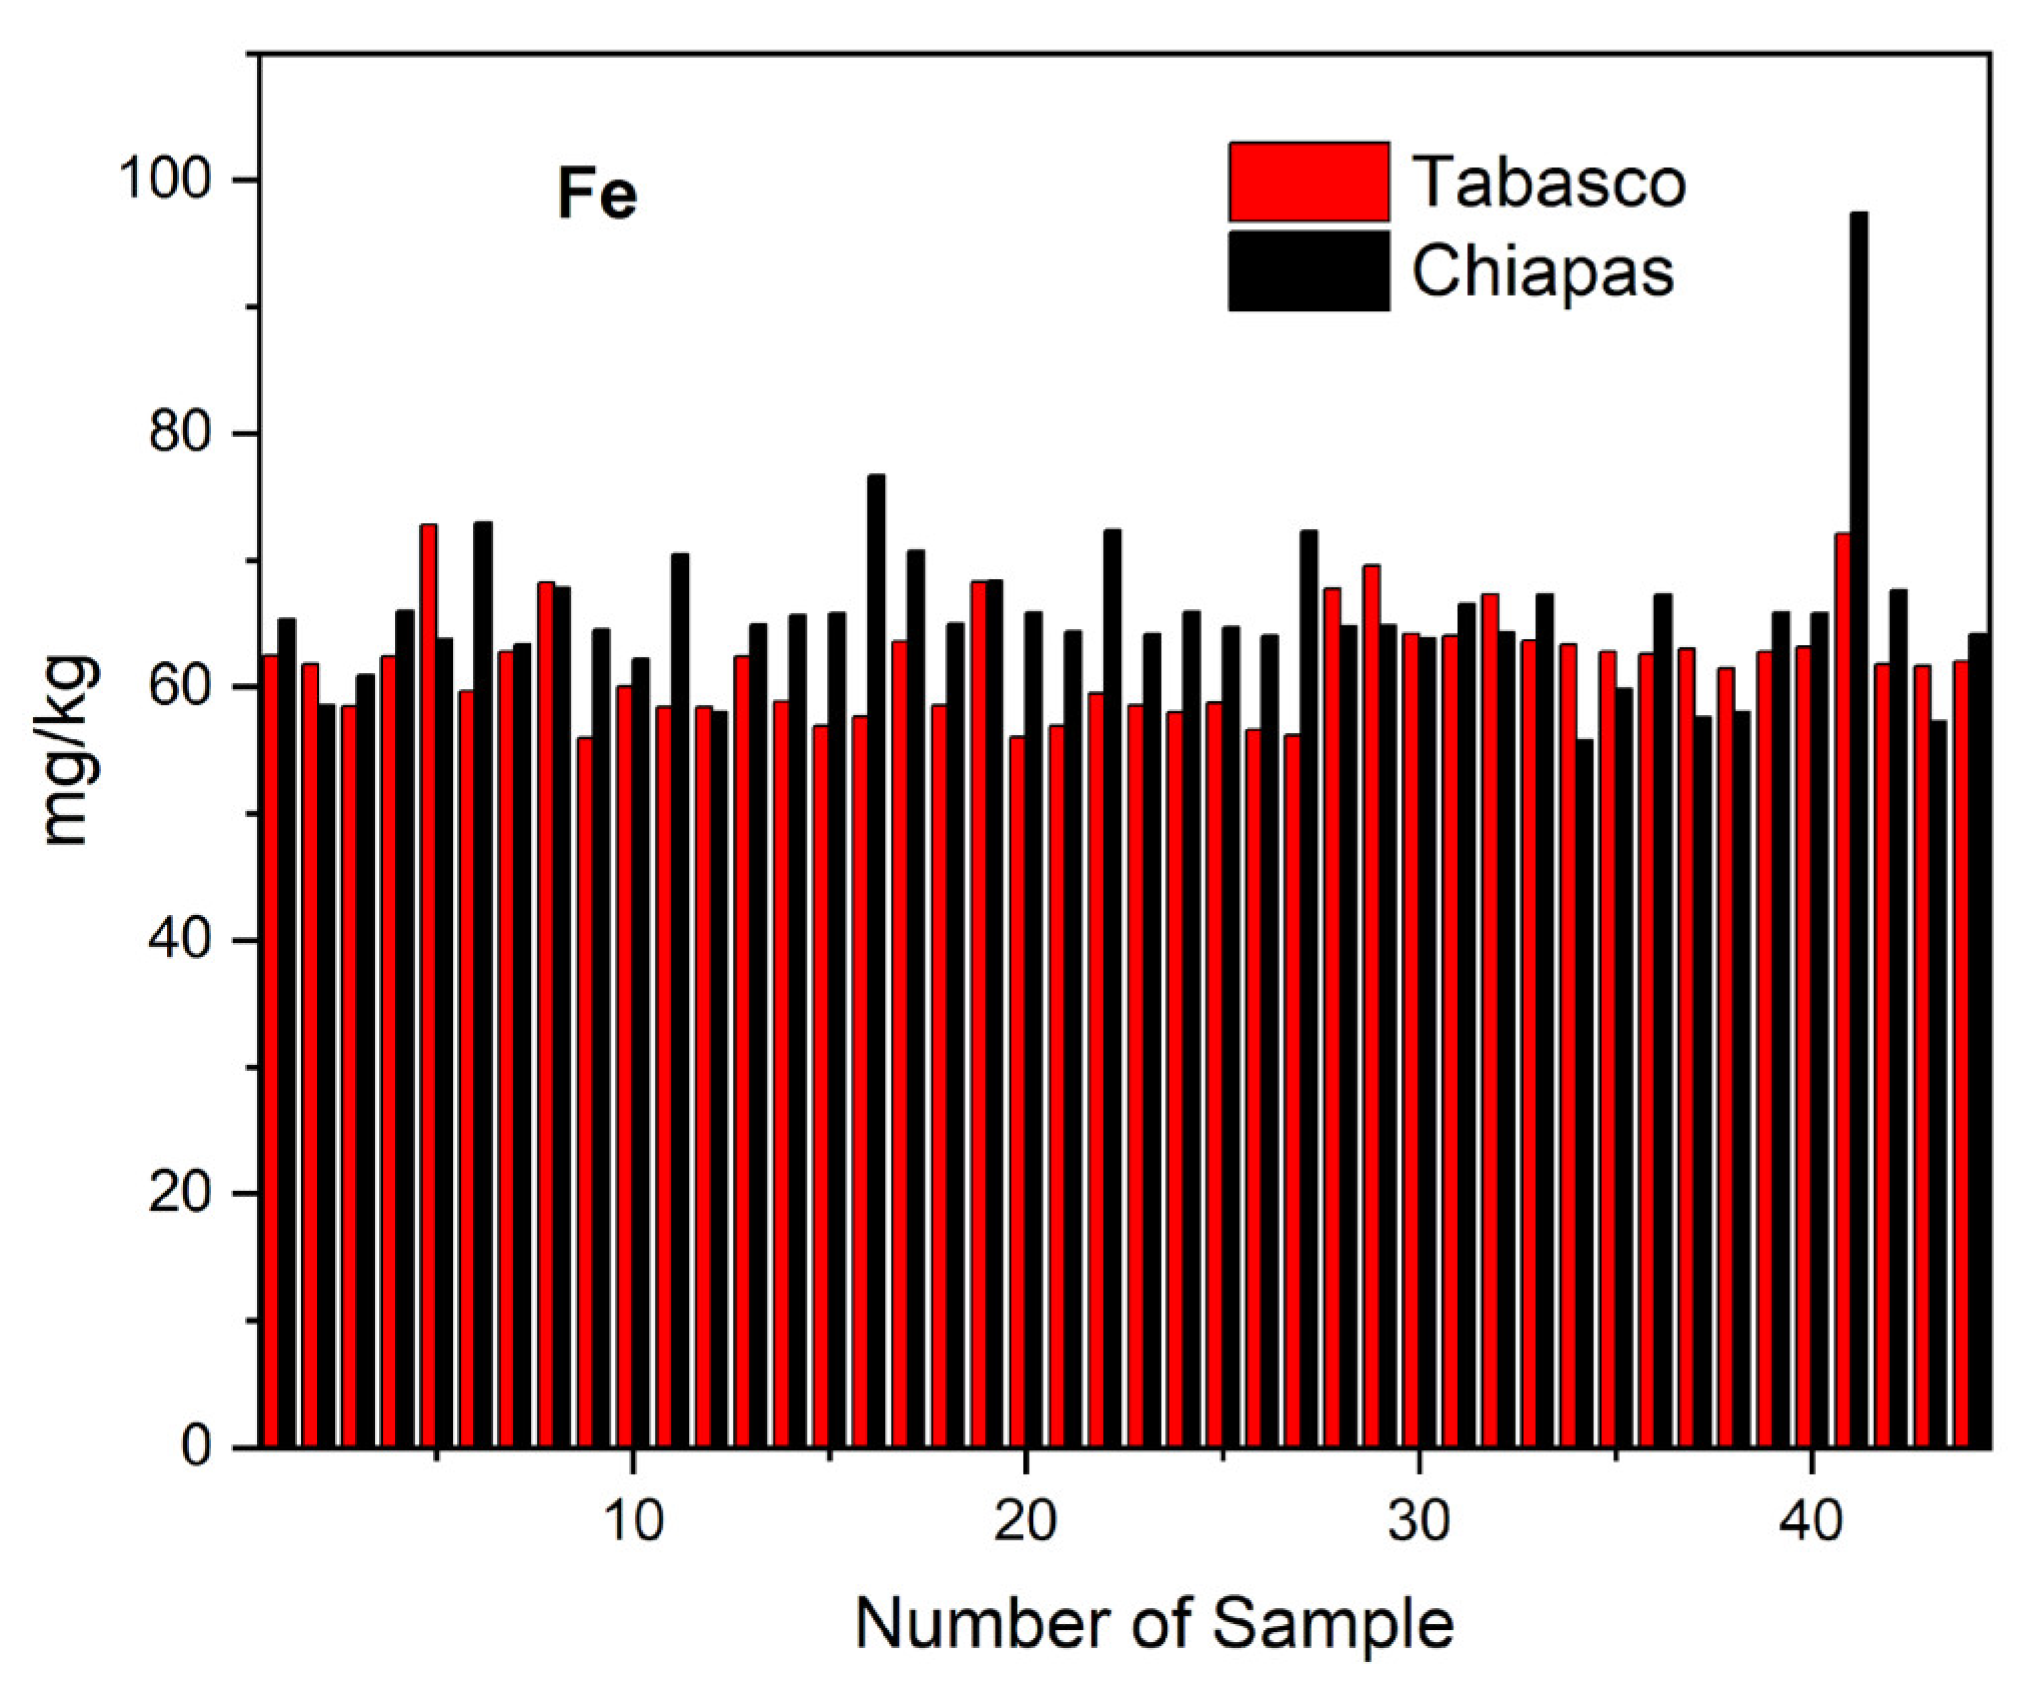
2.8. Iron
Iron is essential for oxygen transportation and storage in the human body, but ingestion of large quantities of iron may lead to blood, heart, kidney, and endocrine system conditions, cellular damage, and mutations [
25,
60].
Figure 6 shows the distribution of Fe in the cheese samples from Tabasco and Chiapas.
The average, minimum, and maximum Fe concentrations in mg kg
−1 that we found in cheese samples from Tabasco were 61.84 ± 4.23, 55.97, and 72.76, whereas for the samples from Chiapas were 62.58, 55.97, and 72.08 for crema, 62.15, 56.92, and 72.76 for oaxaca, 61.61, 58.38, and 68.29 for fresco, and 60.25, 56.07, and 67.77 for panela. For cheese samples from Chiapas, the average, minimum, and maximum Fe concentrations in mg kg
−1 were 65.76 ± 6.61, 55.82, and 97.41, and by cheeses variety were as follows: 64.37, 55.82, and 72.33 for crema; 68.09, 57.96, and 97.41 for oaxaca; 65.91, 62.19, and 72.09 for cotija; and 64.72, 59.86, and 72.94 for panela. The results of the Fe concentrations of Tabasco and Chiapas cheeses showed significant differences since the paired Student’s
t-test gave a value of TC = −3.696, which is outside the range of CV (−2.672 to +2.672). The Tukey’s test showed two groupings (A) and (B), thus confirming the previous results (
Table 5f).
We attributed the presence of Fe in the analyzed cheese samples from Tabasco and Chiapas to soil types in the region, where Ferralsols rich in iron sesquioxides are dominant. For example, the Acrisols—soils which are easily identified by their yellowish to reddish dark color, strong acidity, and a B horizon accumulating alluvial clay—are rich in iron and aluminum sesquioxides. Salgado and Palma analyzed Fe concentrations in subunits of Acrisols finding 67.00 ± 52.00 (ACdyhfr), 76.00 ± 21.00 (Acfrpl), 51.00 ± 16.00 (Acfrum), 115.00 ± 58.00 (Acglpl), 85.00 ± 29.00 (Achupl), 94.00 ± 29.00 (Achuum), 72.00 ± 15.00 (Acumgl), and 64.00 ± 49.00 (Acumpl) mg kg
−1 [
36,
52]. Additionally, De la Cruz found Fe concentrations of 67.6 in Vertisols and 112.2 mg kg
−1 in Fluvisols [
35]. The above-mentioned soil types are rich in organic matter with high concentrations of humic and fulvic acids, which give soil acidic pH values between 4.6 and 5.7, chemical conditions that facilitate the biosorption of iron by grass rhizomes and its accumulation in stalks.
According to our results, the concentrations of iron that we observed in cheese samples from Tabasco and Chiapas are within the parameters for human consumption and may cover a large part of the recommended daily intake of 8 mg for adult males, 18 mg for adult females, 11 mg for young males, 15 mg for young females, and 27 mg for pregnant women. Our results were similar to those of Al Sidawi who analyzed cheese samples from the Kvemo Kartli (Georgia), finding Fe concentrations of 69.09 ± 64.918 mg kg
−1 in imeruli and 101.1 ± 91.166 mg kg
−1 in sulguni cheeses [
49]. Jalili also found Fe concentrations between 67.7 ± 4.5 and 71.3 ± 4.9 mg kg
−1 in iron-fortified feta cheeses [
61]. In contrast, the values for Fe concentration we found exceed the values reported in previous studies made in Turkey by Kirdar in akcaka tik cheeses between 7.49 and 29.05 mg kg
−1 [
62]. While Centinkaya in cami bogazi cheeses from Trabzon (Turkey) reported 0.371 ± 0.177 mg kg
−1 Fe. Meshref found Fe concentrations between 1.763 and 17.739 ppm in kareish cheeses from the Beni-Suef region [
22], and in Europe, Reinholds reported Fe concentrations between 1.57 and 12.4 mg kg
−1 in blue cheeses [
14].
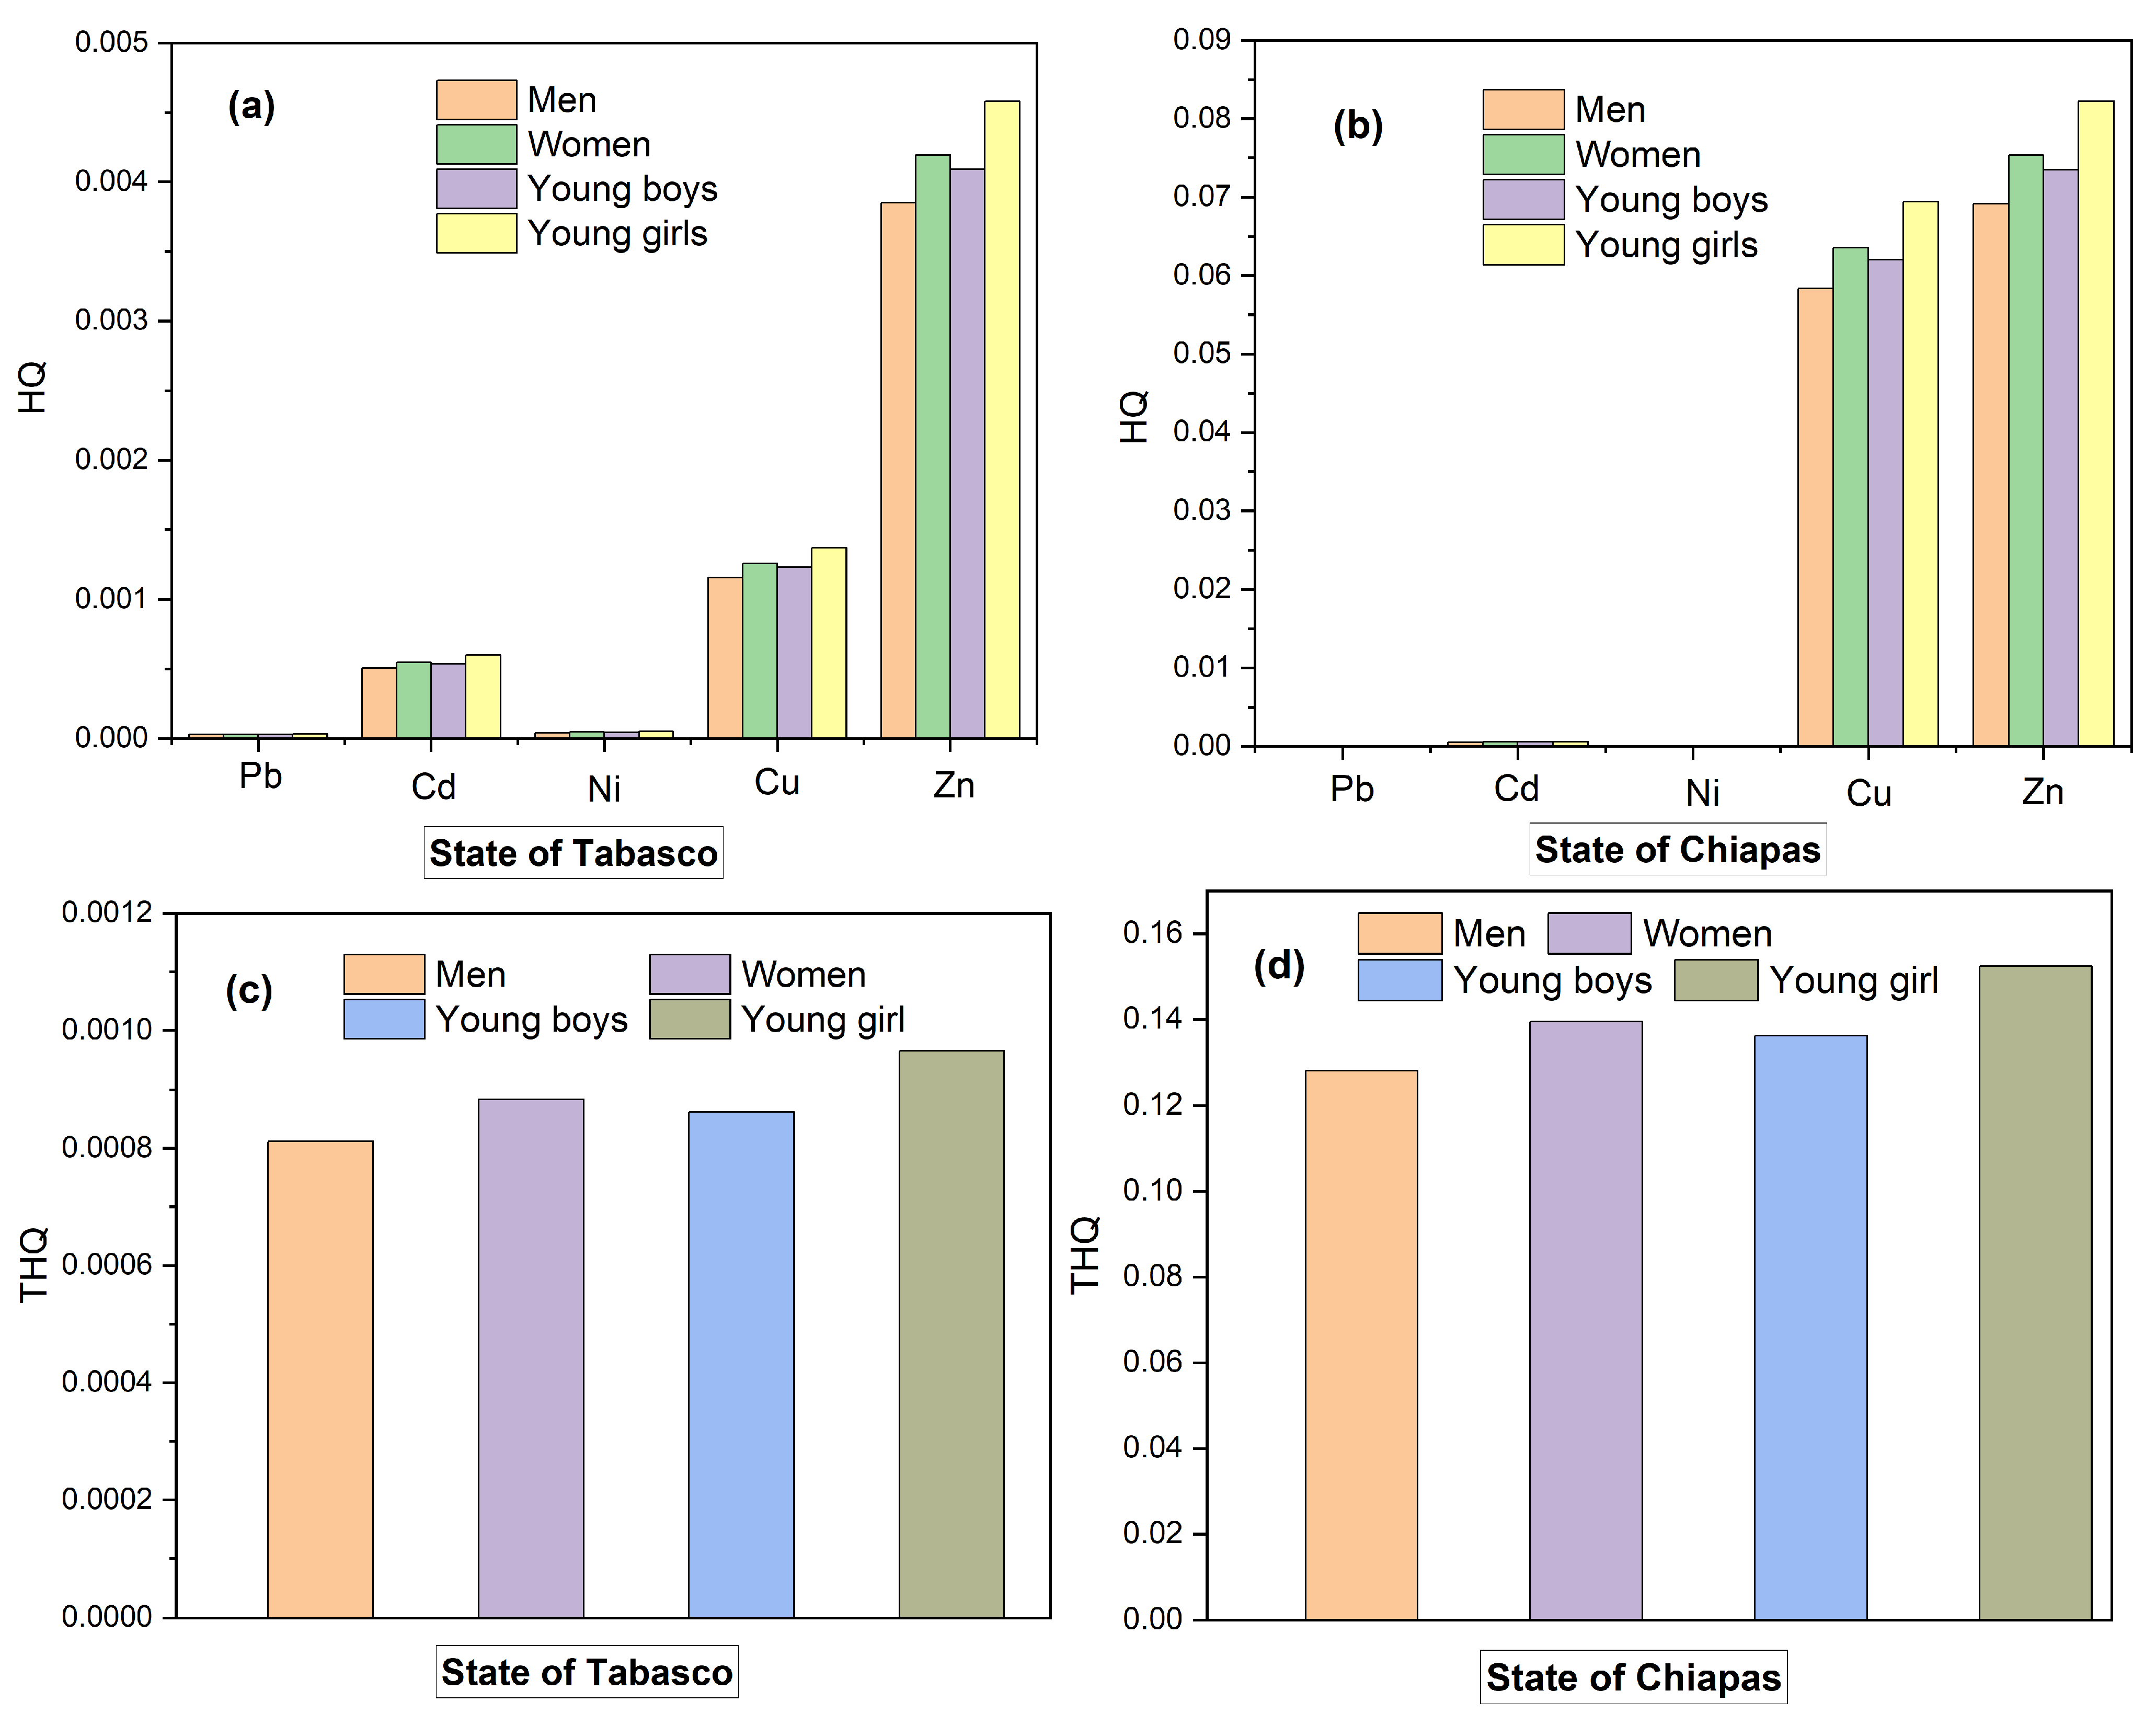
2.9. Risk Analysis
The values of
HQ we estimated for the concentrations of the heavy metals lead, cadmium, nickel, copper, and zinc that we determined in cheese samples from Tabasco are shown in
Figure 7a,b for the samples from Chiapas. Zinc, copper, and cadmium were the metals that contributed the most to the
HQ values of samples from Tabasco in the order young girls > adult woman > young boys > adult man (
Figure 7a), while for cheese samples from Chiapas, zinc and copper were the metals having the highest contribution to the
HQ values in the same order as for Tabasco. However, all the
THQ values that we estimated were lower than one (
Figure 7c,d), meaning that there is no risk of developing medical conditions from intake of heavy metals contained in the cheese varieties we analyzed.
In previous studies, Castro reported values of
THQ below one for arsenic in milk samples from the upper Balsas River region in the state of Puebla [
17,
21]; Reinholds found
THQ between 0.05 and 0.14 for youngsters, and between 0.03 and 0.09 for adults for the intake of blue cheese consumed by the populations from Denmark, France, Italy, Spain, and the UK [
14], and Zafarzadeh reported
THQ values of 1.11, 1.33, and 5.42 for adults and youngsters due to the intake of cadmium-polluted butter from the Gorgan region in Iran [
63], which poses a high health risk for the inhabitants of that geographic area.
Table 6 shows the results of the Tukey tests for CR and CRT considering the variables heavy metals (Pb, Cd, and Ni) and age group (youngsters and adults). The results revealed significant differences in the effect on CR of each metal in the order Cd > Pb > Ni, which means that the ingestion by youngsters and adults of even low concentrations of Cd could represent a high
CR relative to the ingestion of Pb or Ni; however, the
CR will depend on the consumed cheese variety. The significant differences in
CR between age and weight groups (
Table 6a,b) could have been due to adults having slower metabolic rates than youngsters [
21].
Table 6c shows no significant differences in
CRT between adults and youngsters, possibly due to the low contents of Pb, Cd, and Ni of the artisanal cheeses made in Tabasco and Chiapas.
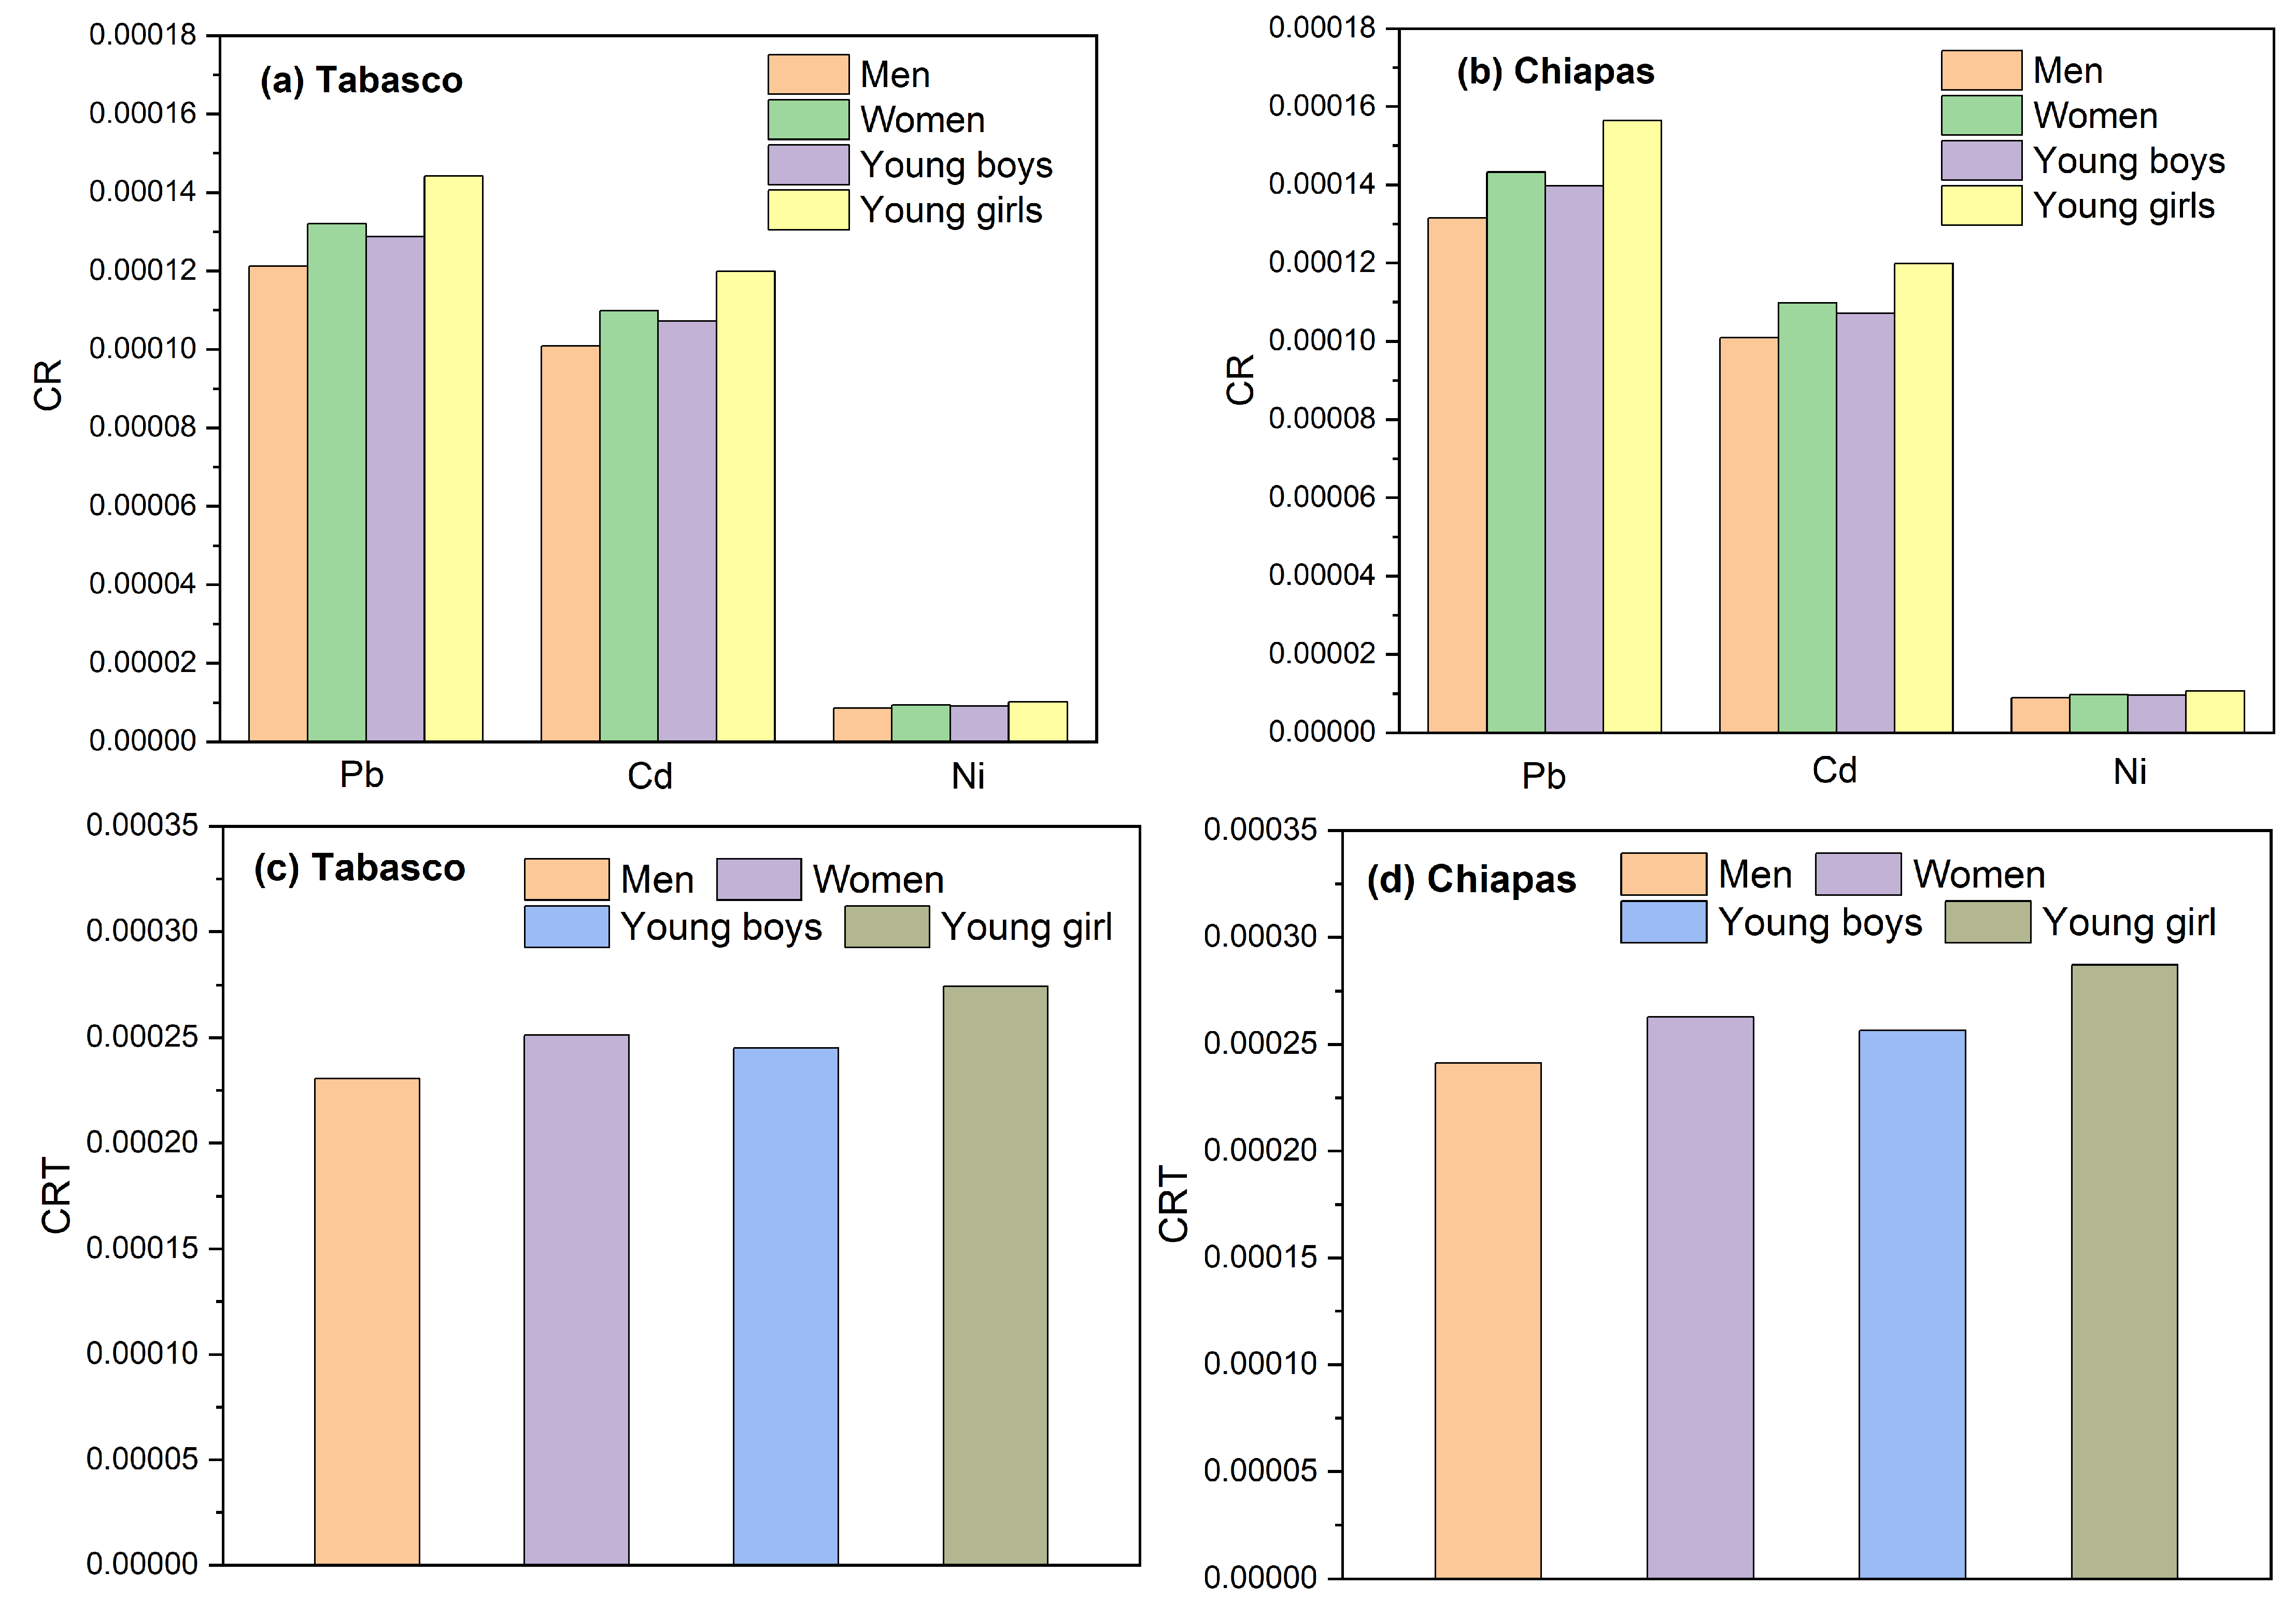
The
CR and
CRT values we estimated for adults and youngsters are shown in
Figure 8a,b. In our study, lead and cadmium were the heavy metals that contributed the most to cancer risk in both states, with a higher value for women than for men. The values of
CRT were in the decreasing order of young girls > adult women > young boys > adult men. In general, as seen in
Figure 8c,d, all the
CRT values we estimated were within the range of 10
−4–10
−6 established by the US-EPA [
8].
Our
CRT estimates were lower than the values of 0.0018–0.014 reported by Castro for children and youngsters in the state of Puebla from the intake of milk containing heavy metals due to contamination of fodder irrigated with the polluted water from the Atoyac, Xochiac, and Xopanac rivers [
21].


 ,
, 


