

Ionophore-Based Polymeric Sensors for Potentiometric Assay of the Anticancer Drug Gemcitabine in Pharmaceutical Formulation: A Comparative Study

 ,
,  , and
, and
Abstract
:1. Introduction
2. Results and Discussion
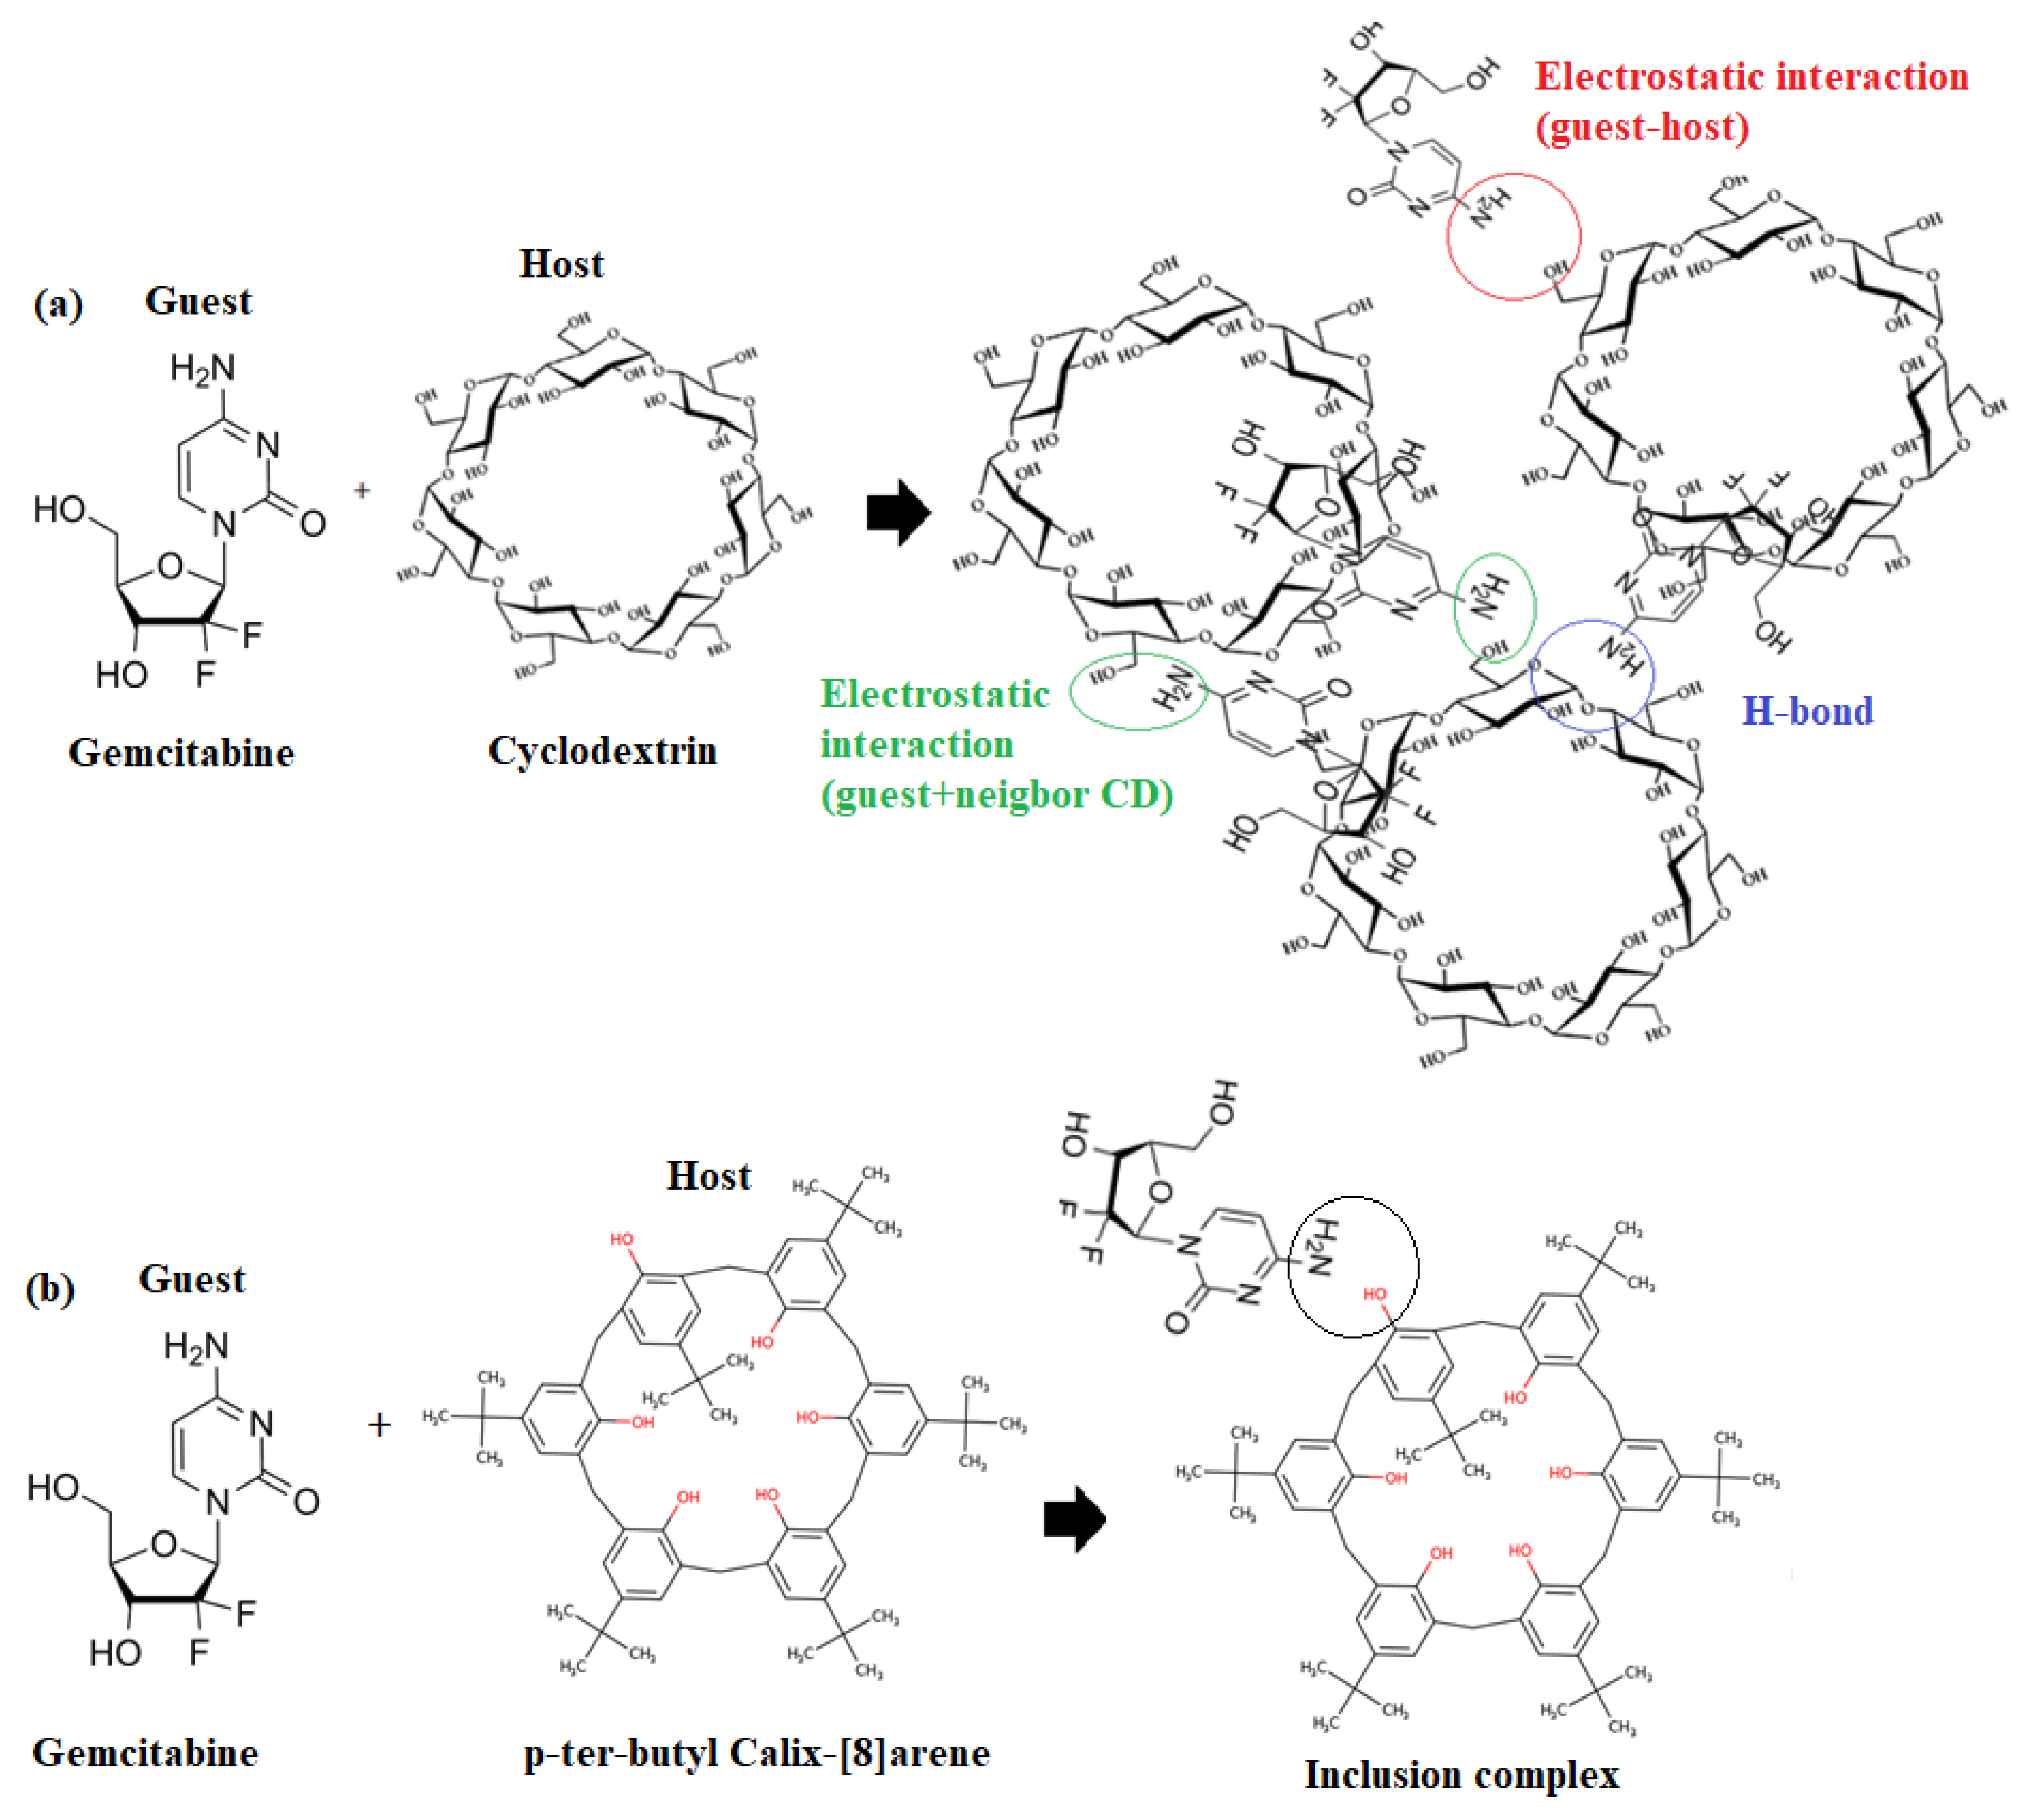
2.1. Mechanism of Sensing Membrane
2.2. Charactrization of Inclusion-Complexes
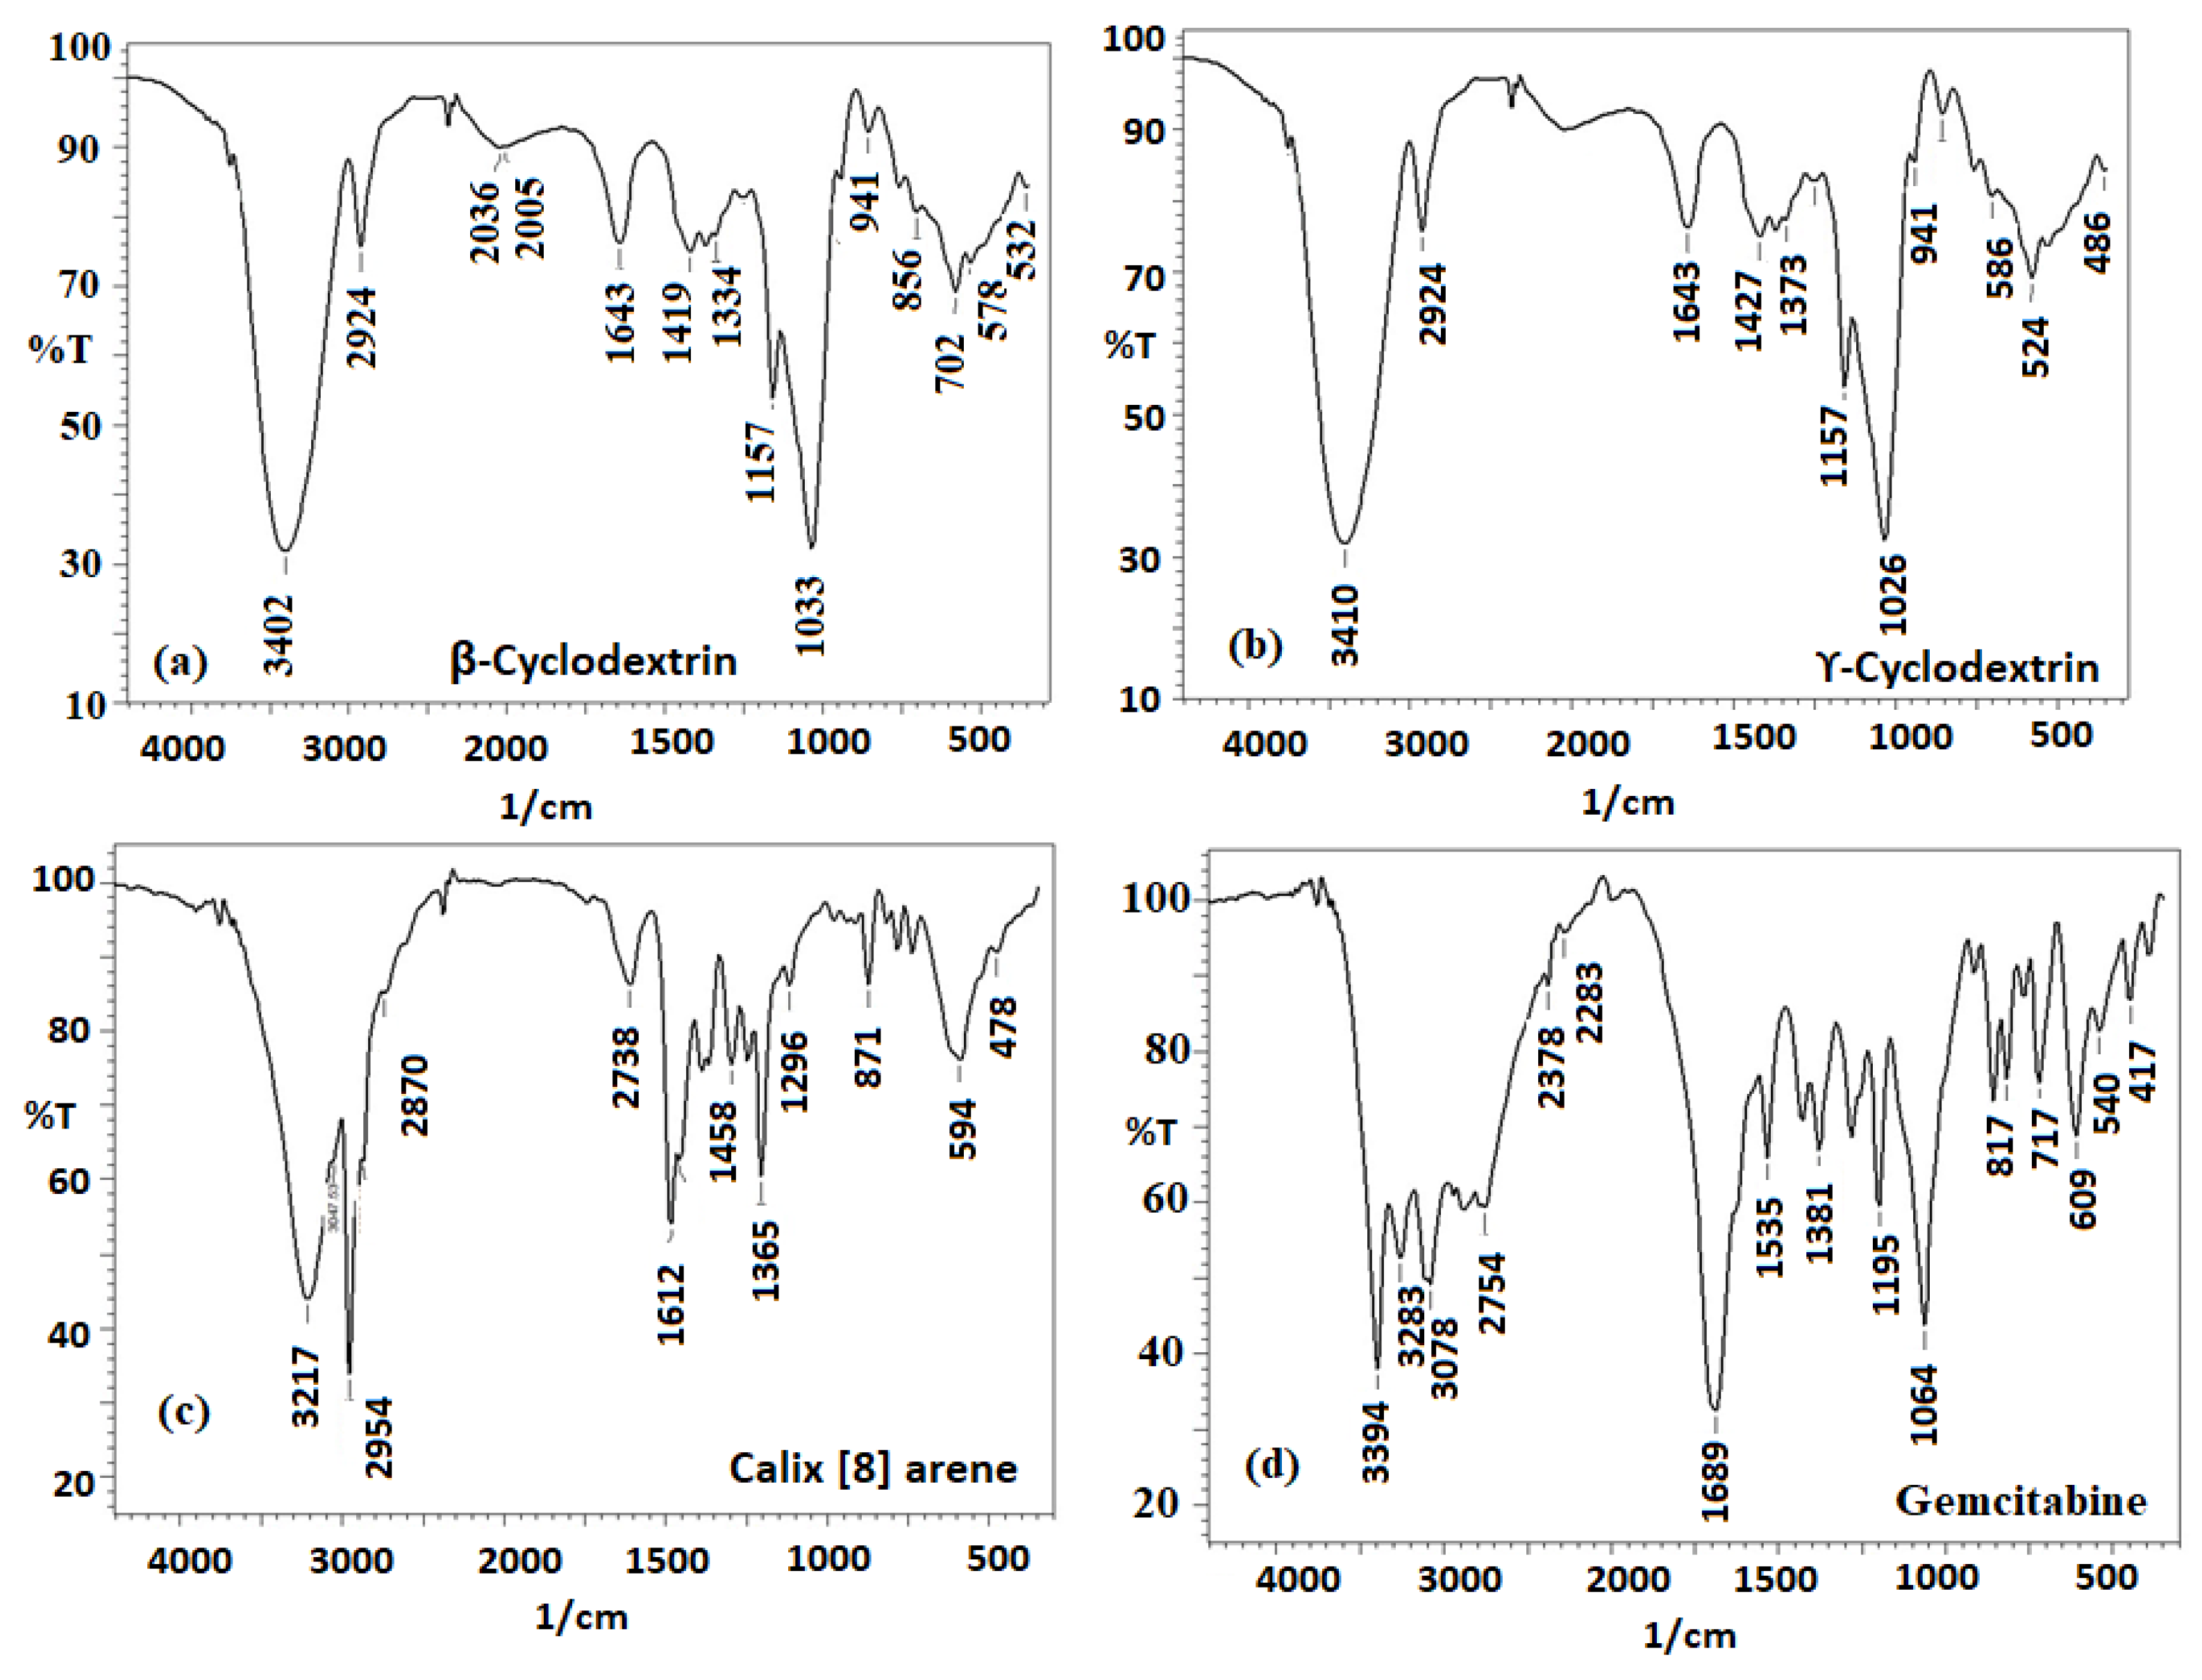
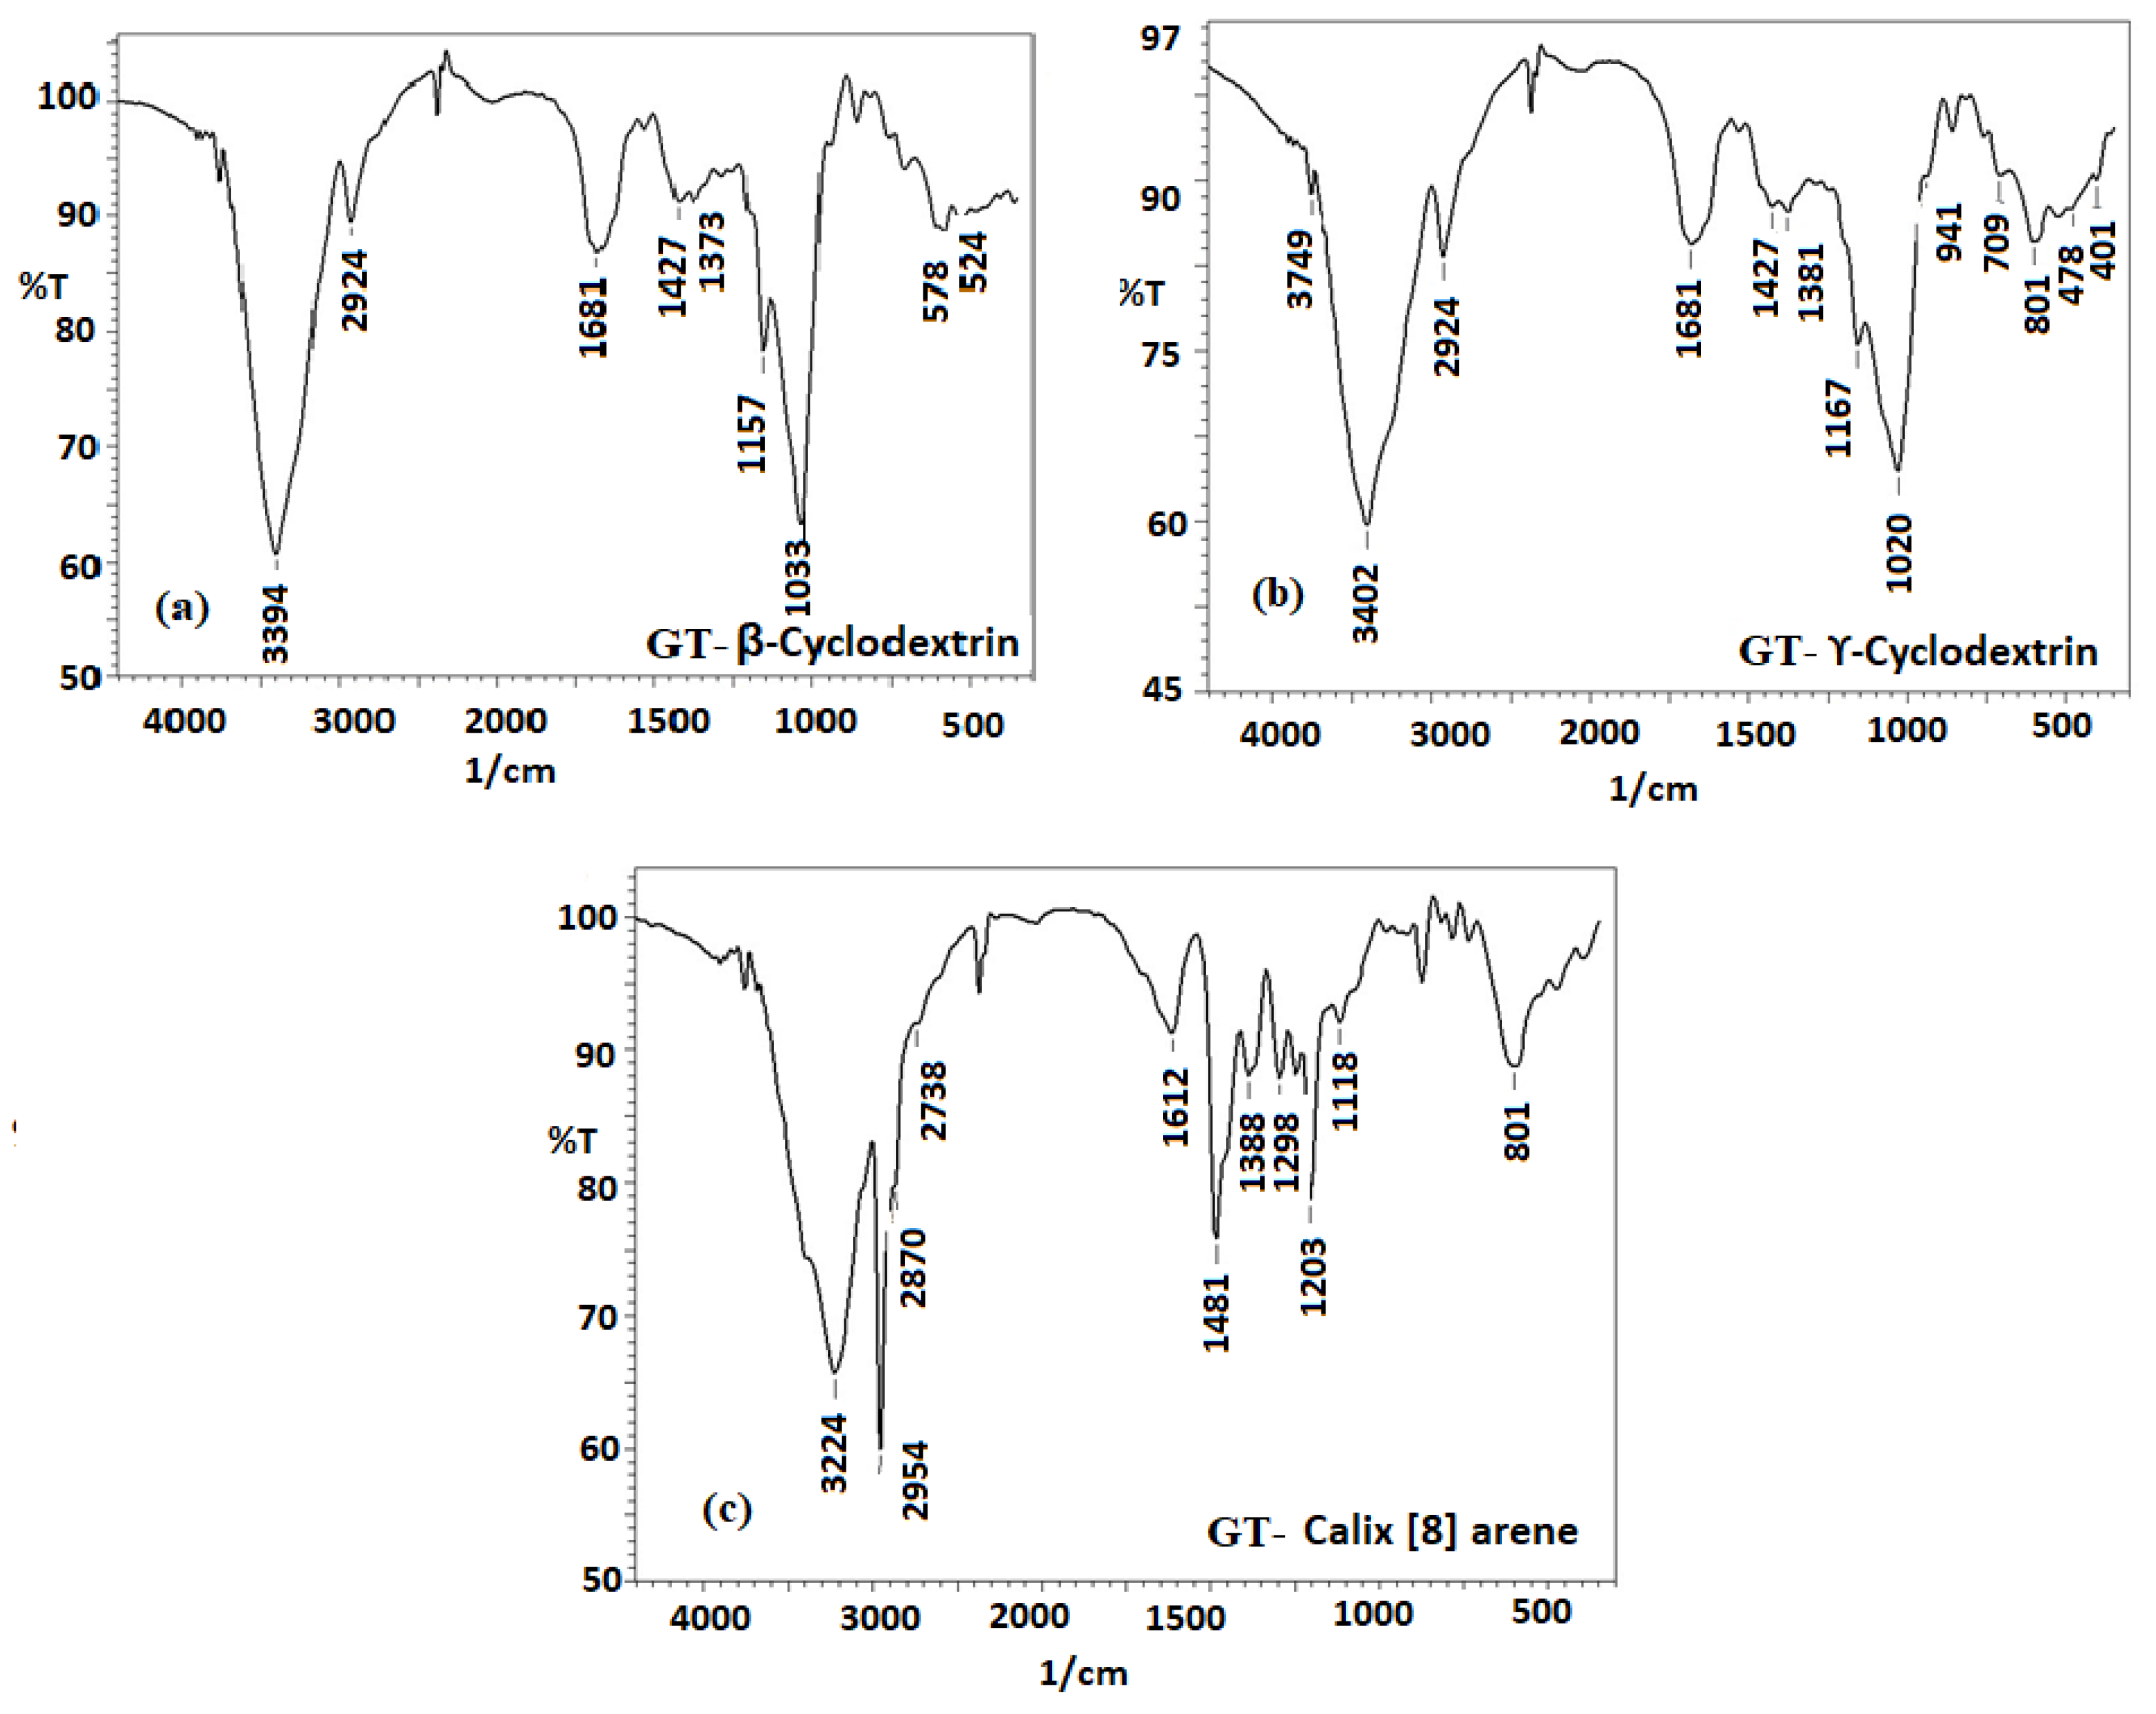
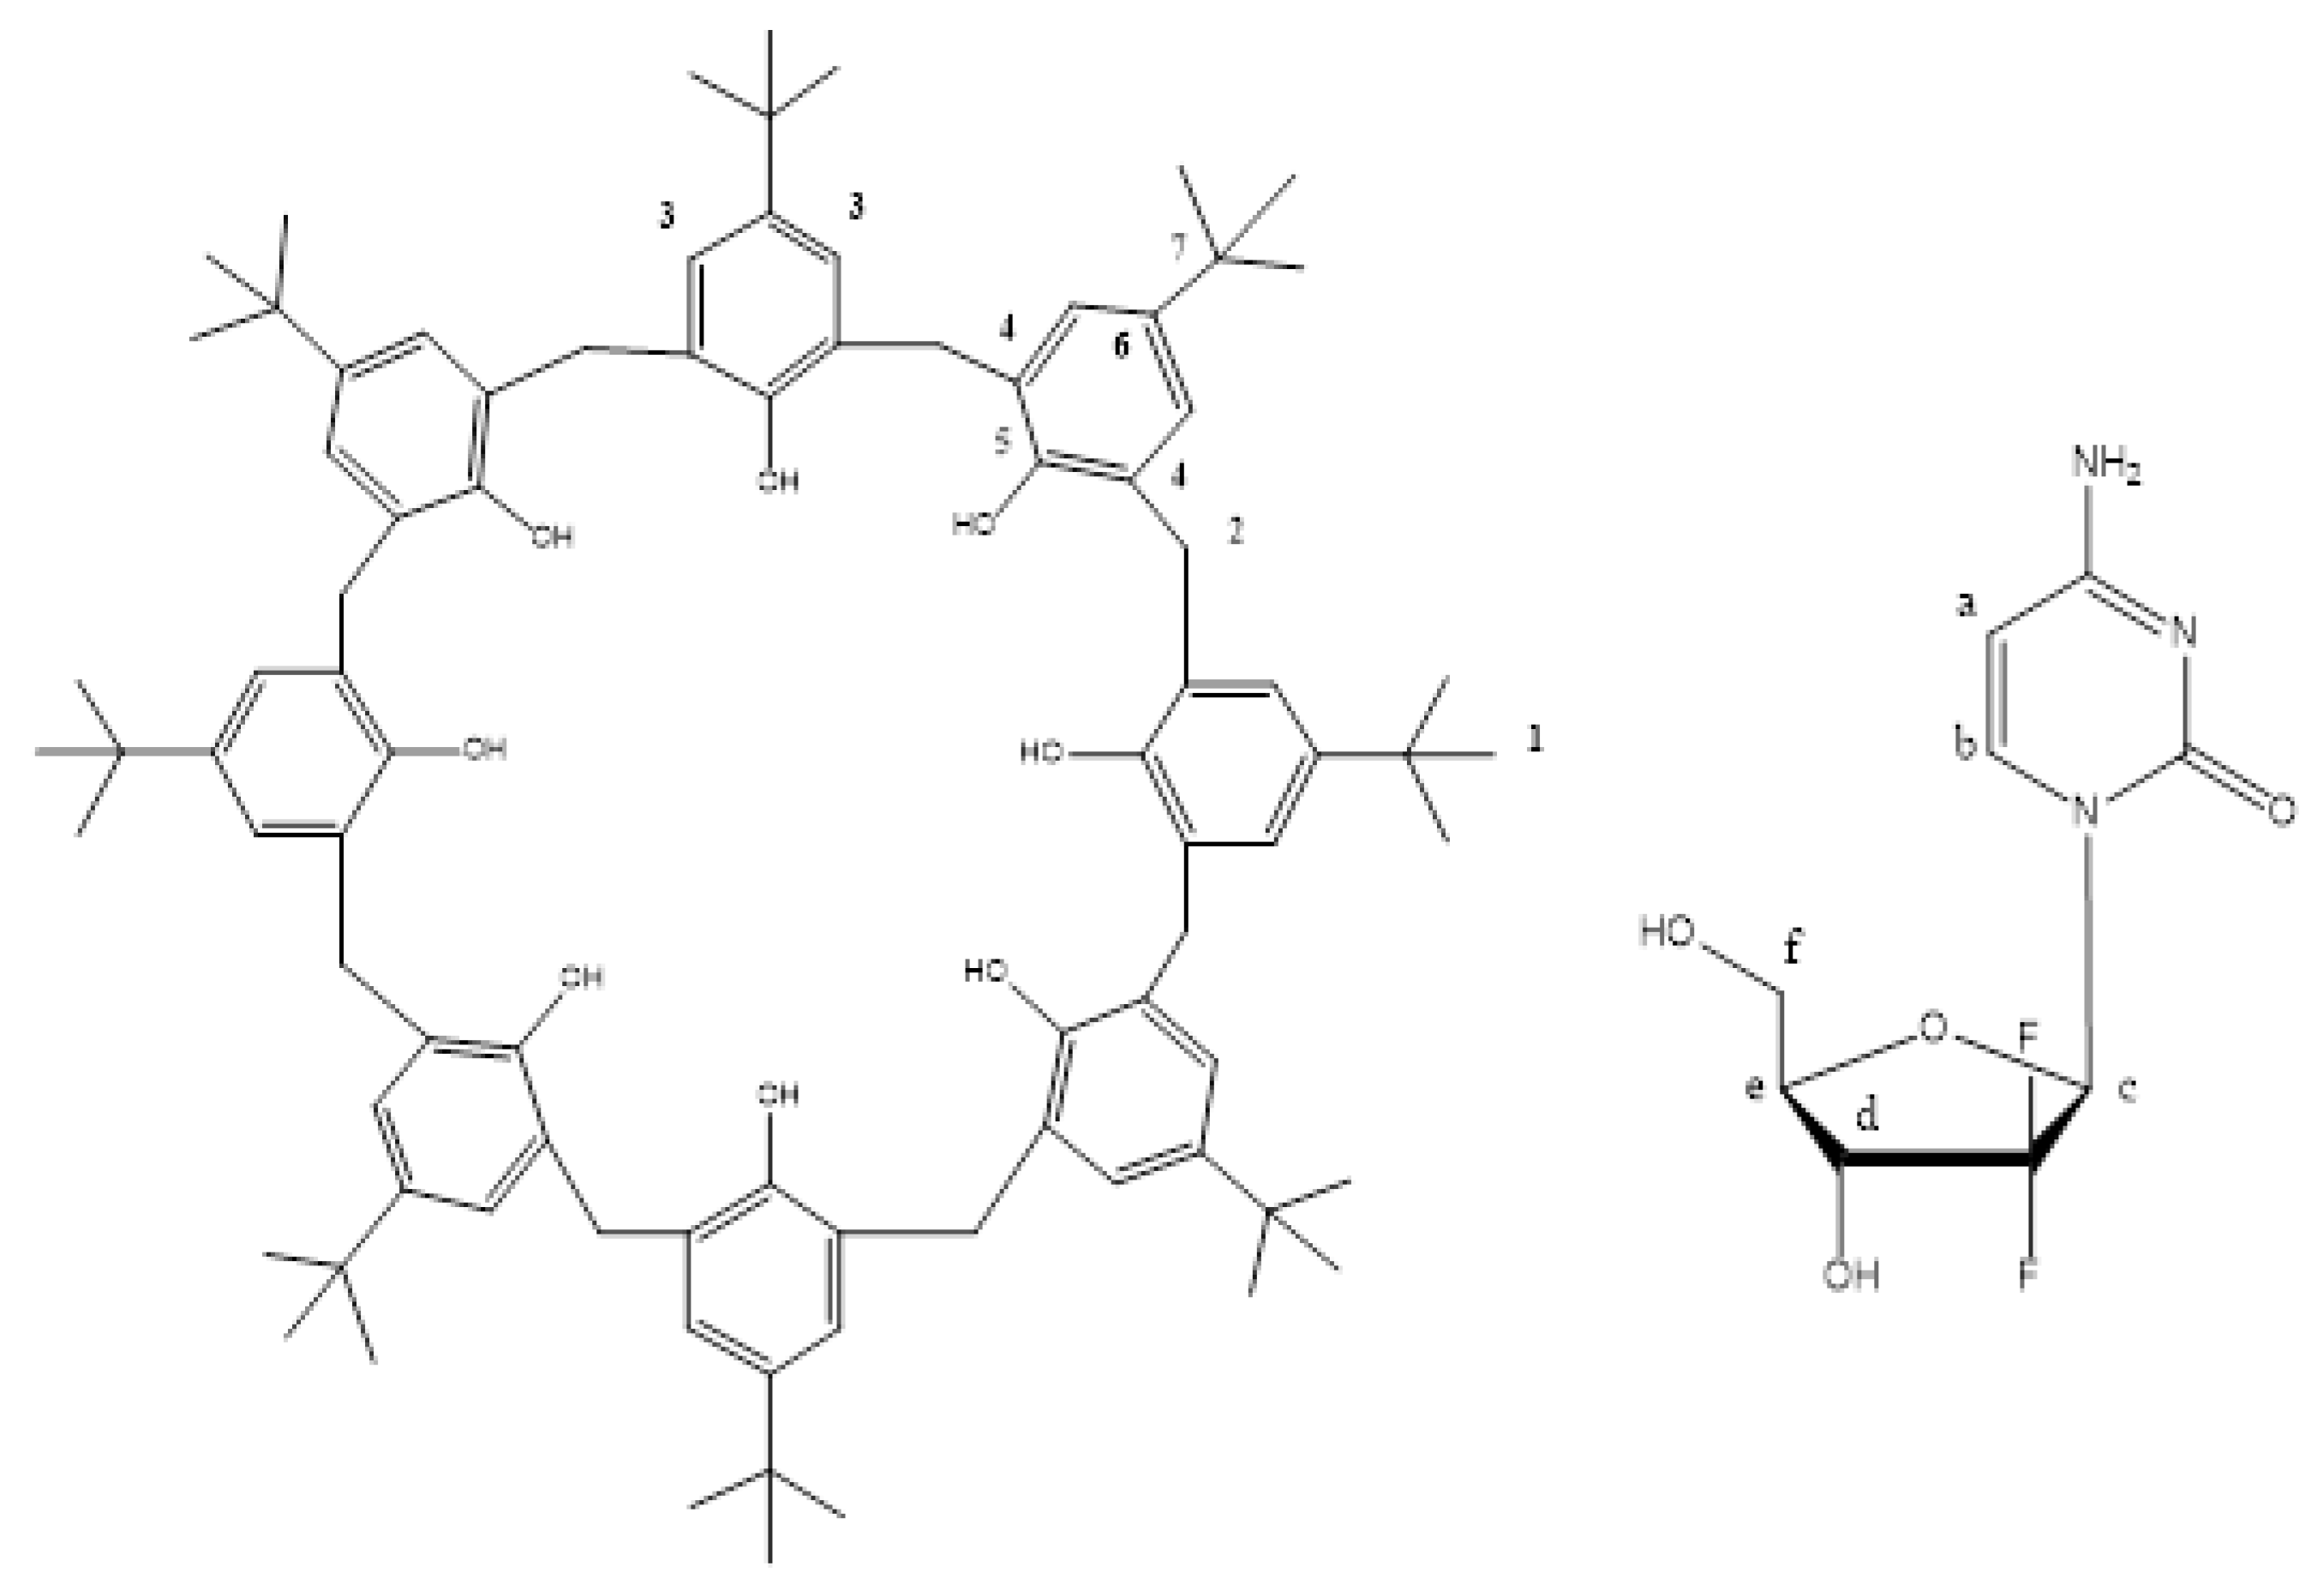
2.2.1. FT-IR Analysis of Inclusion-Complexes
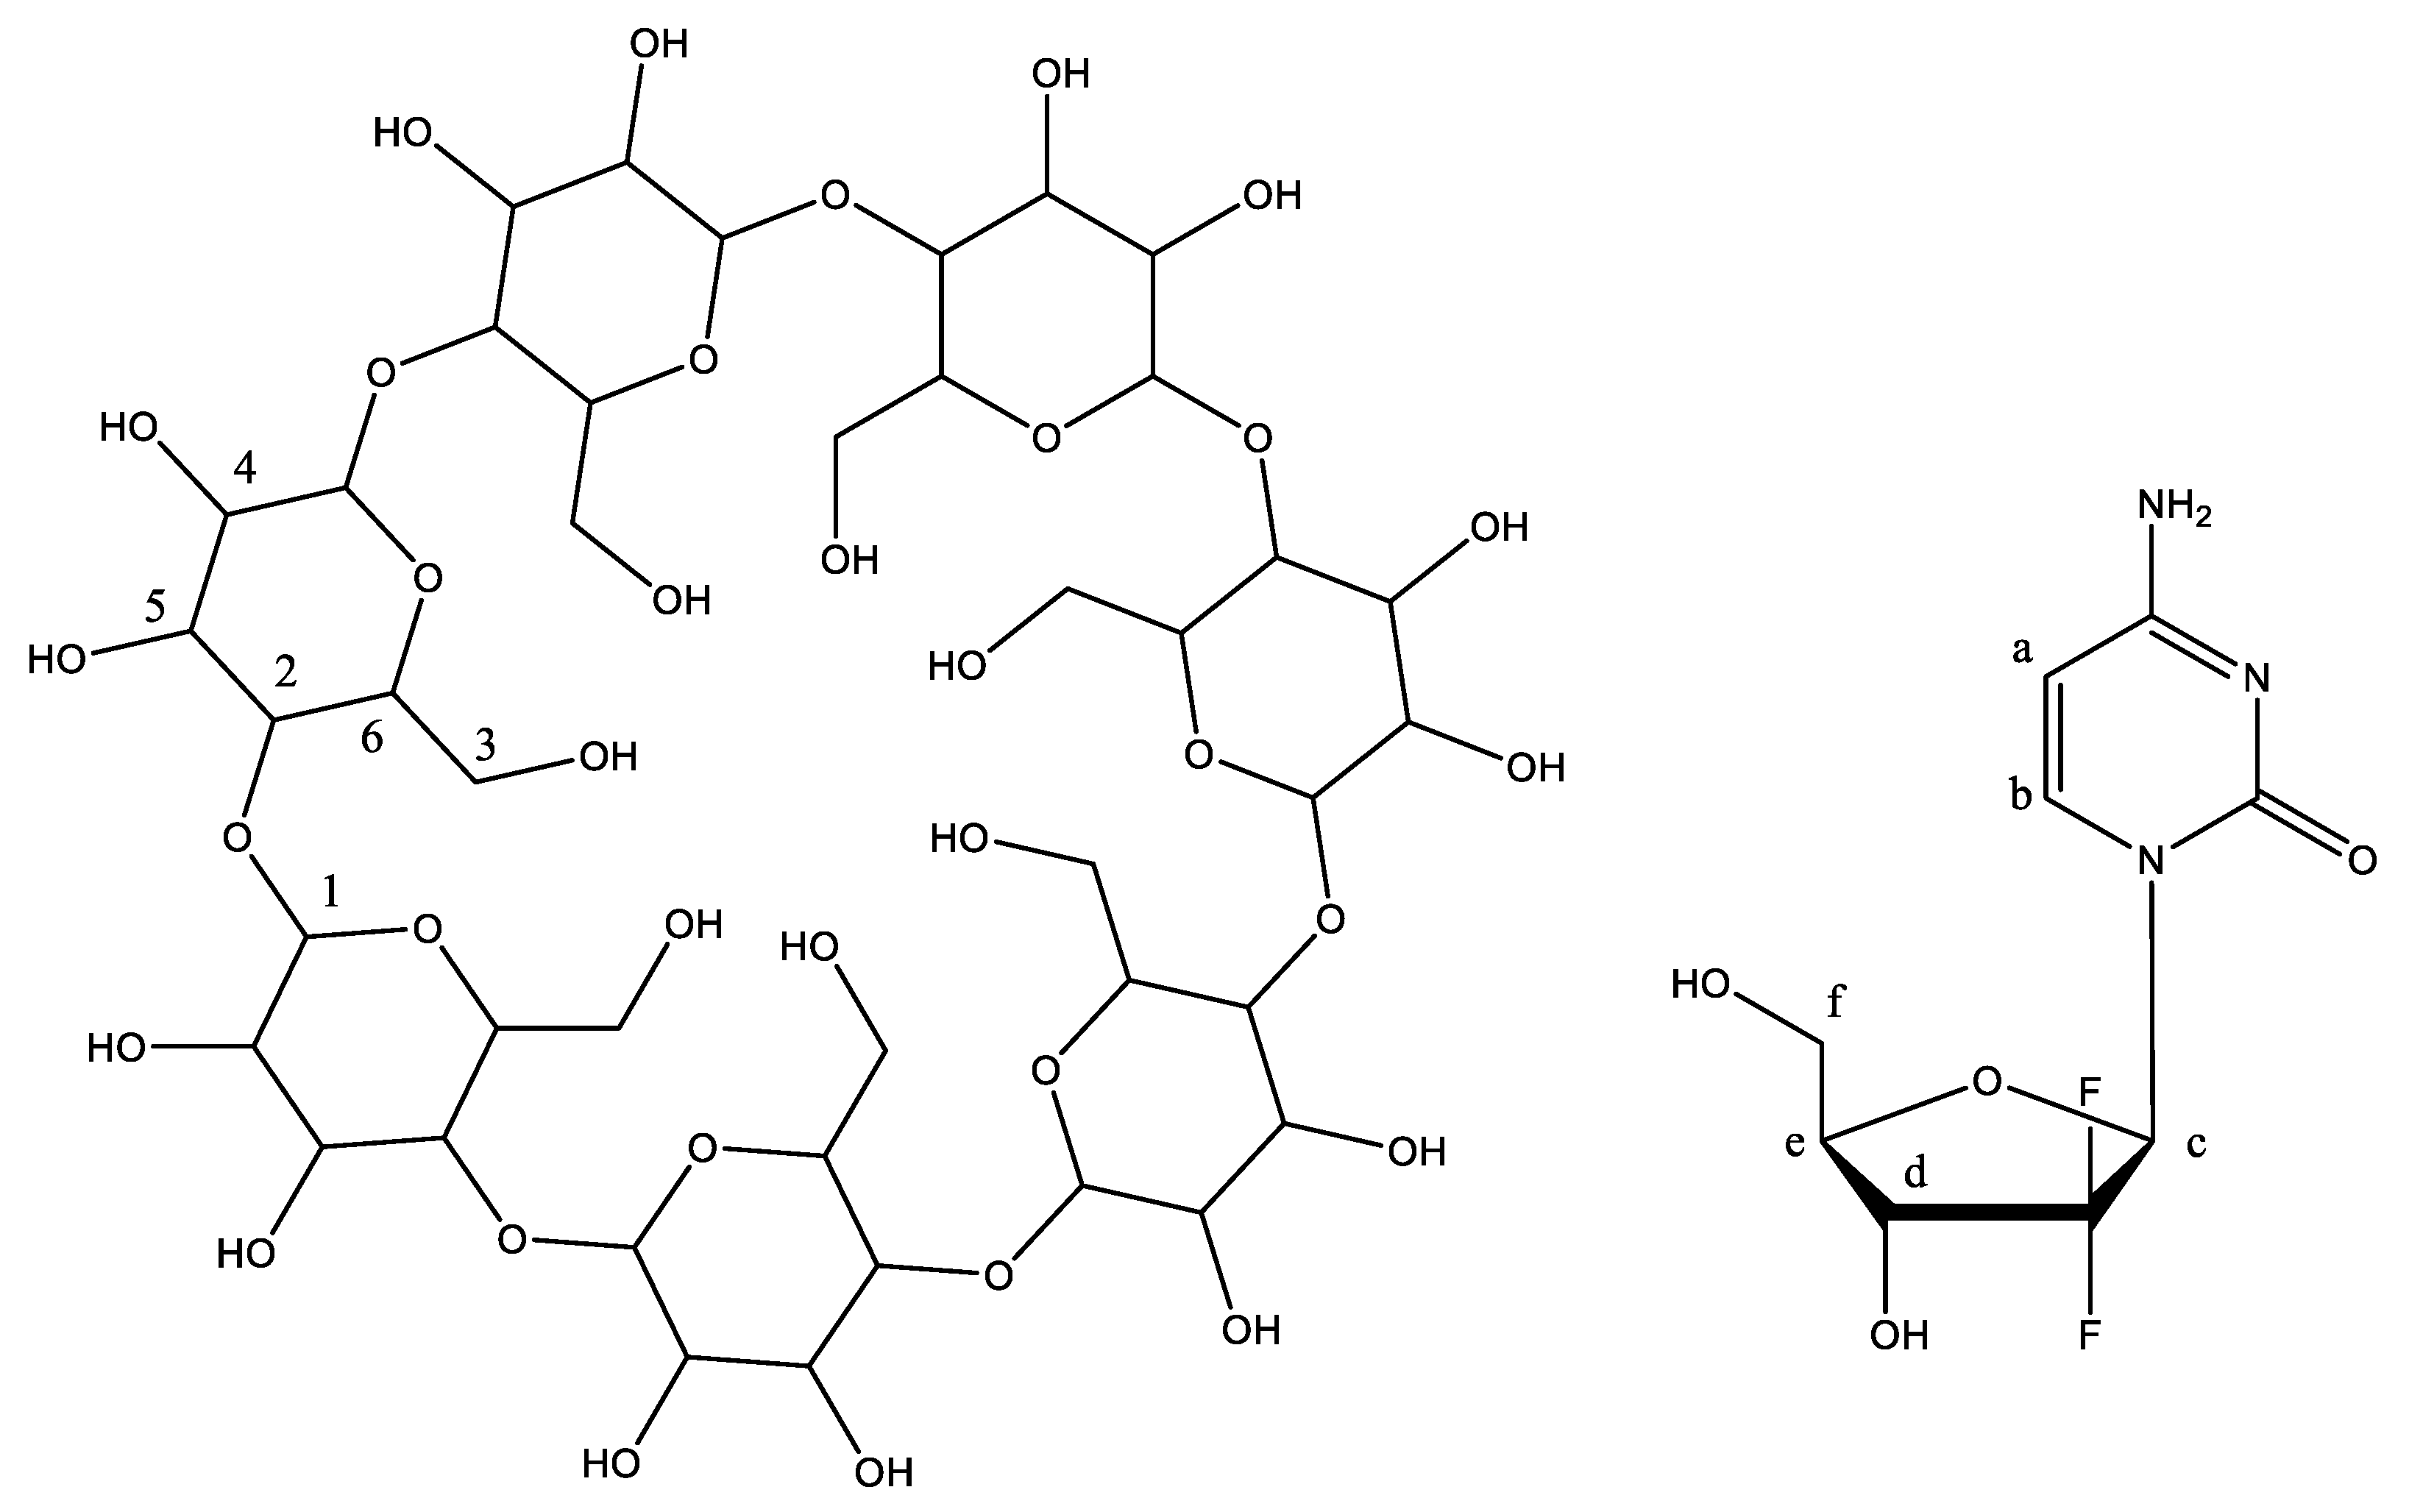
2.2.2. NMR Analysis of Inclusion-Complexes
2.3. Optimization Conditions
2.3.1. Ionic Additive
2.3.2. Effect of Plasticizers
2.3.3. Selectivity
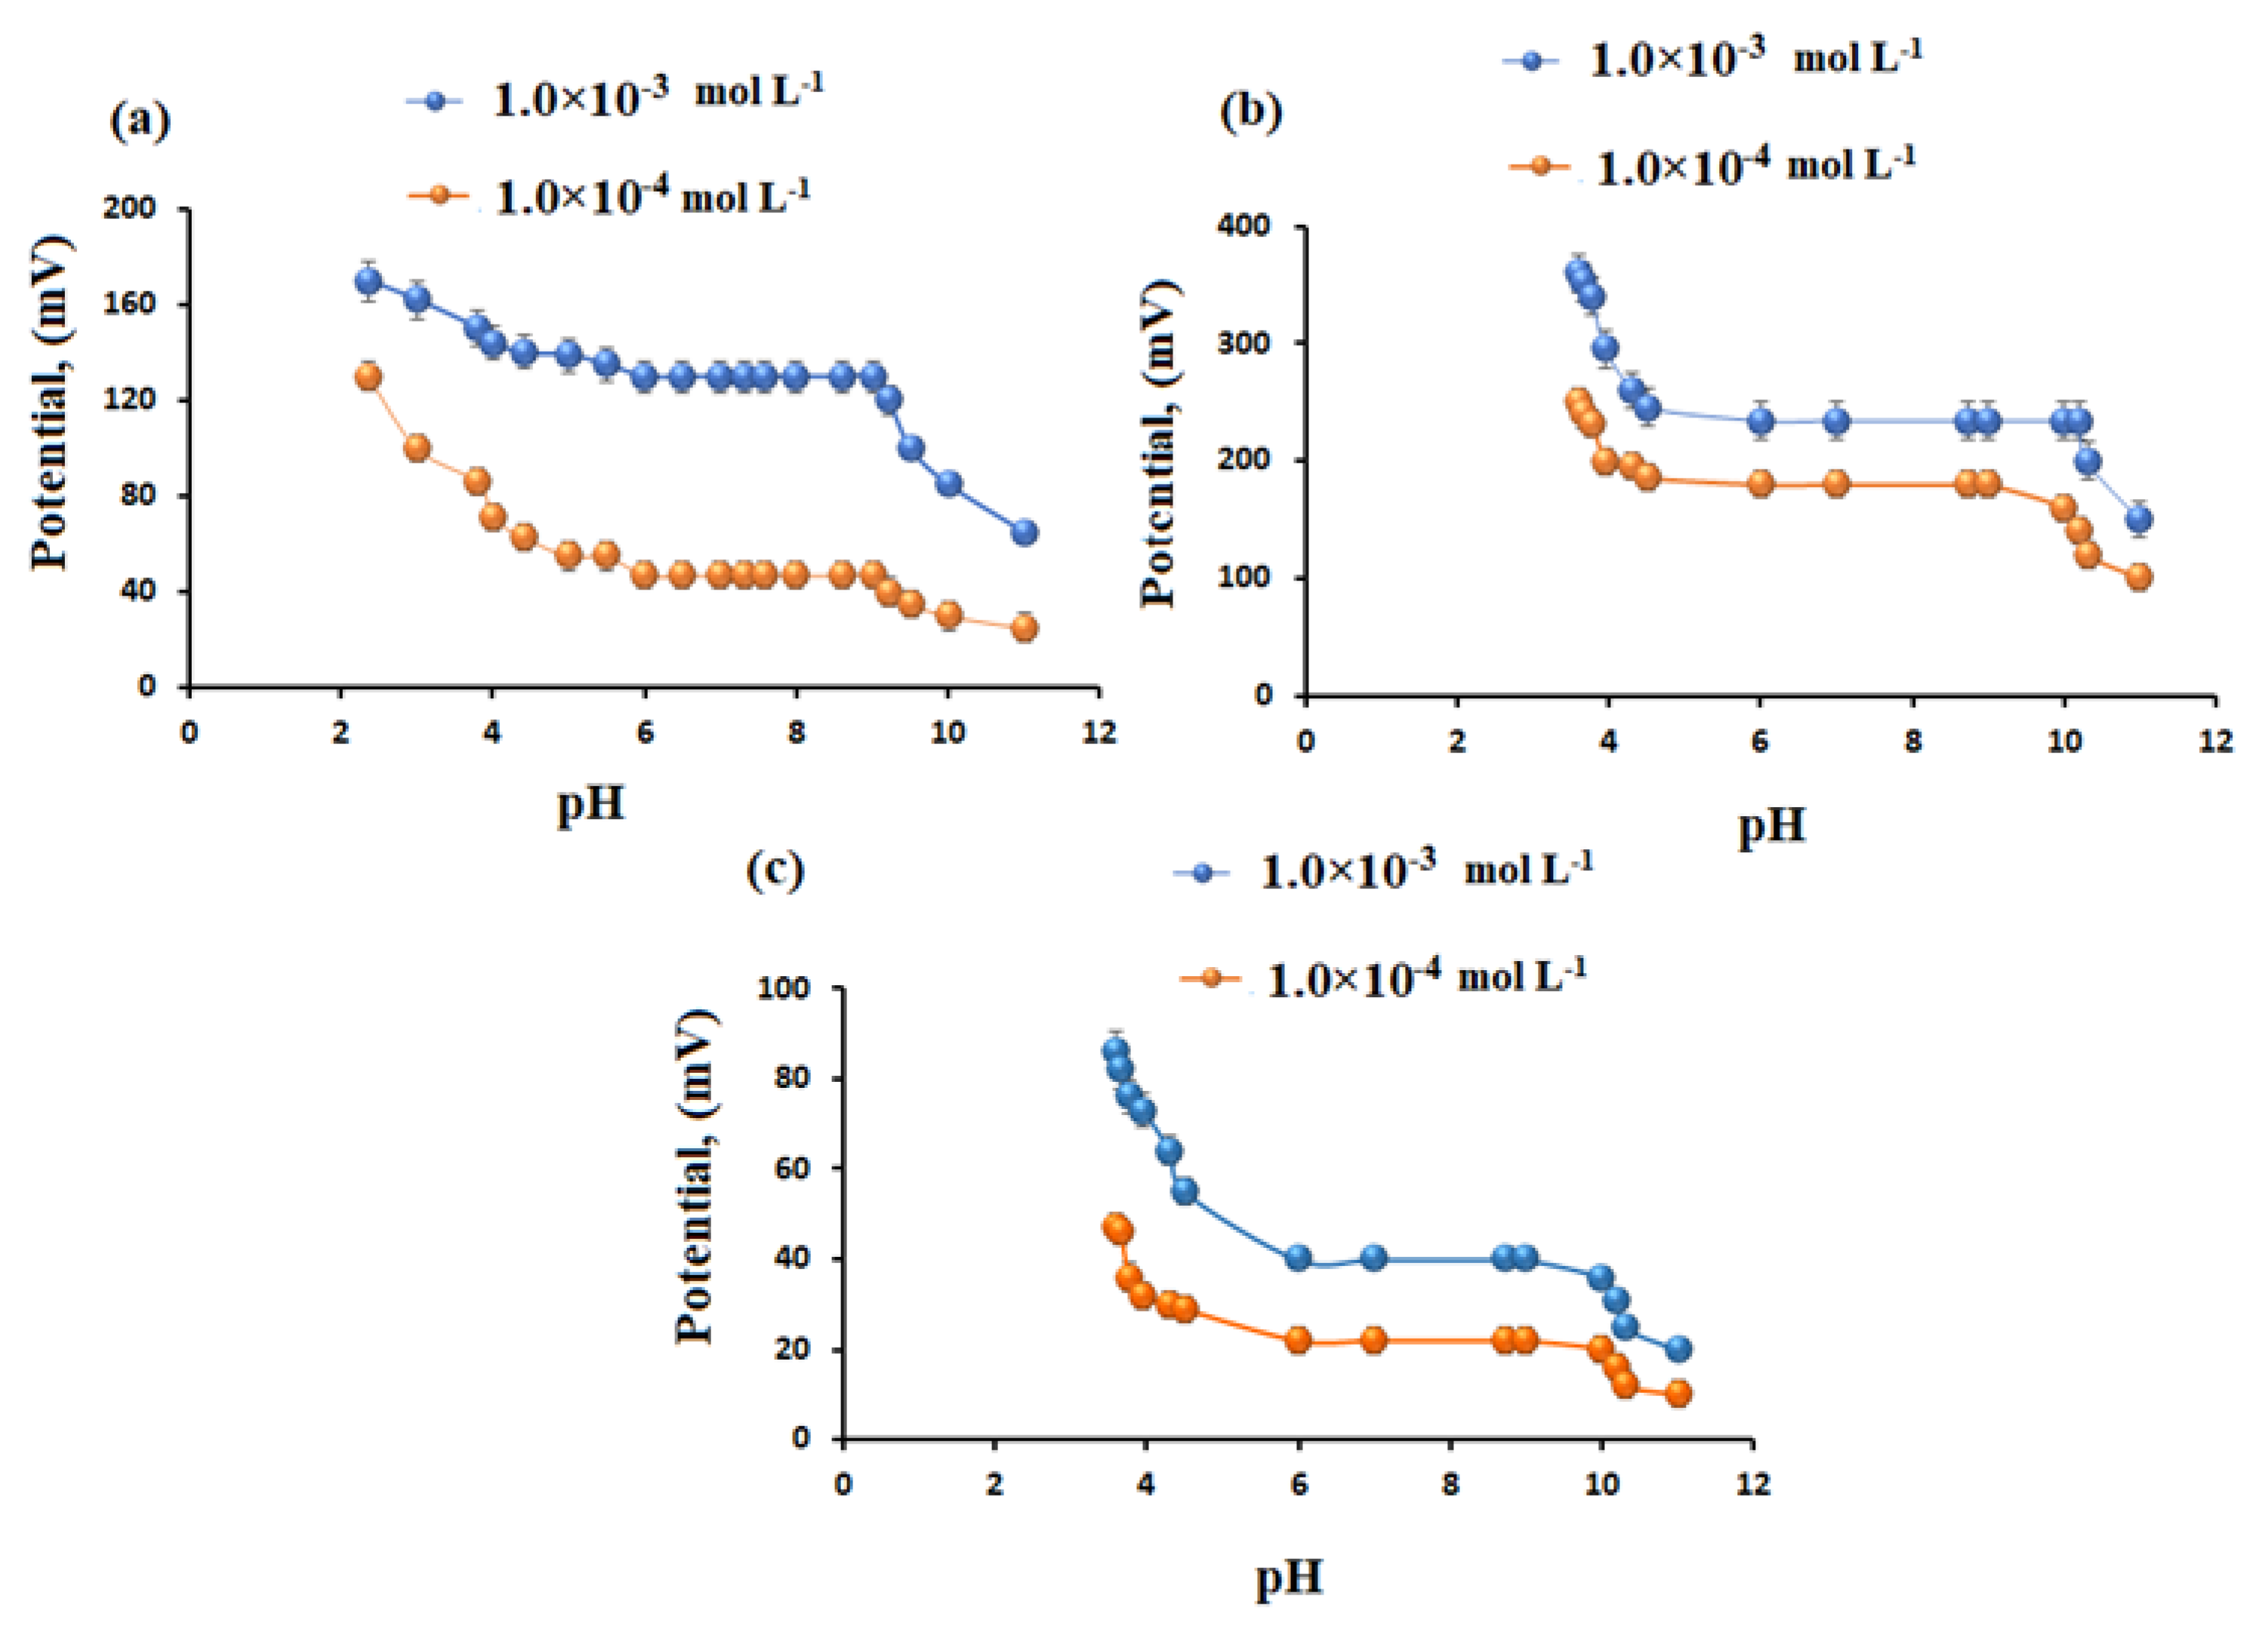
2.3.4. Effect of pH
2.3.5. Response and Soaking Time
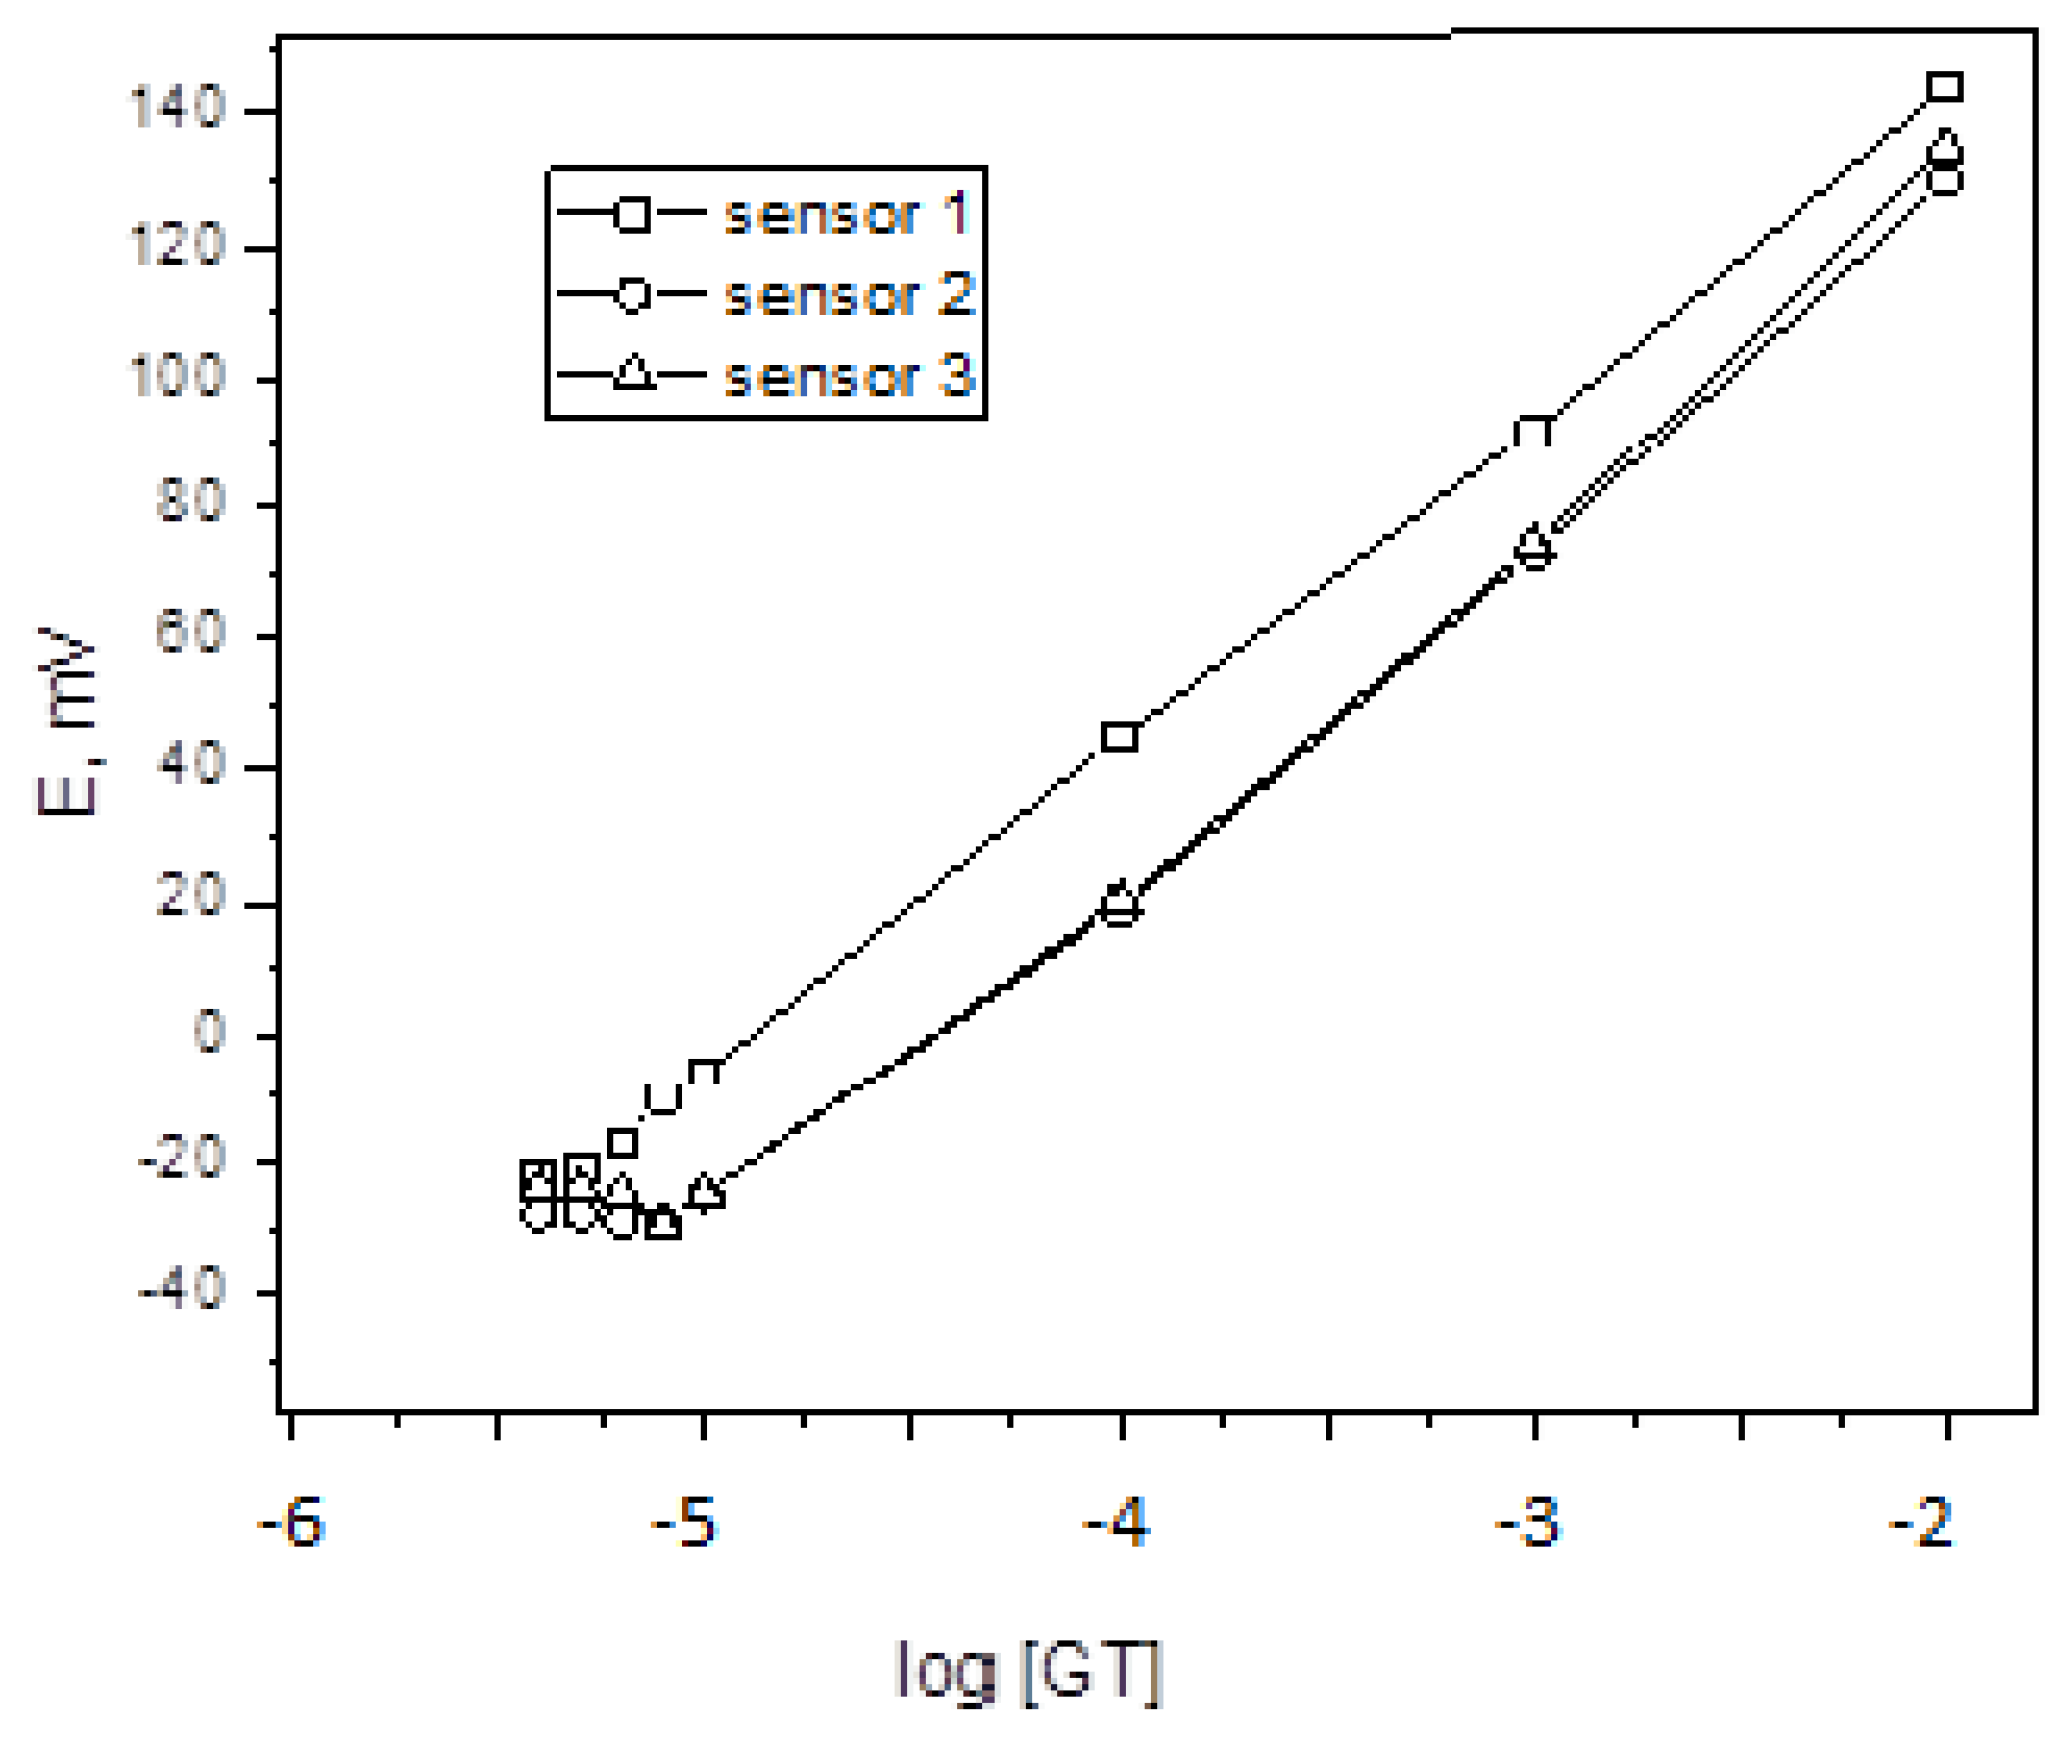
2.4. Validation of the Method
2.5. Application
2.6. Stability and Repeatability
2.7. Comparison of Ionophore-Based PVC Sensors with Reported Potentiometric Method
3. Experimental
3.1. Instruments
3.2. Materials
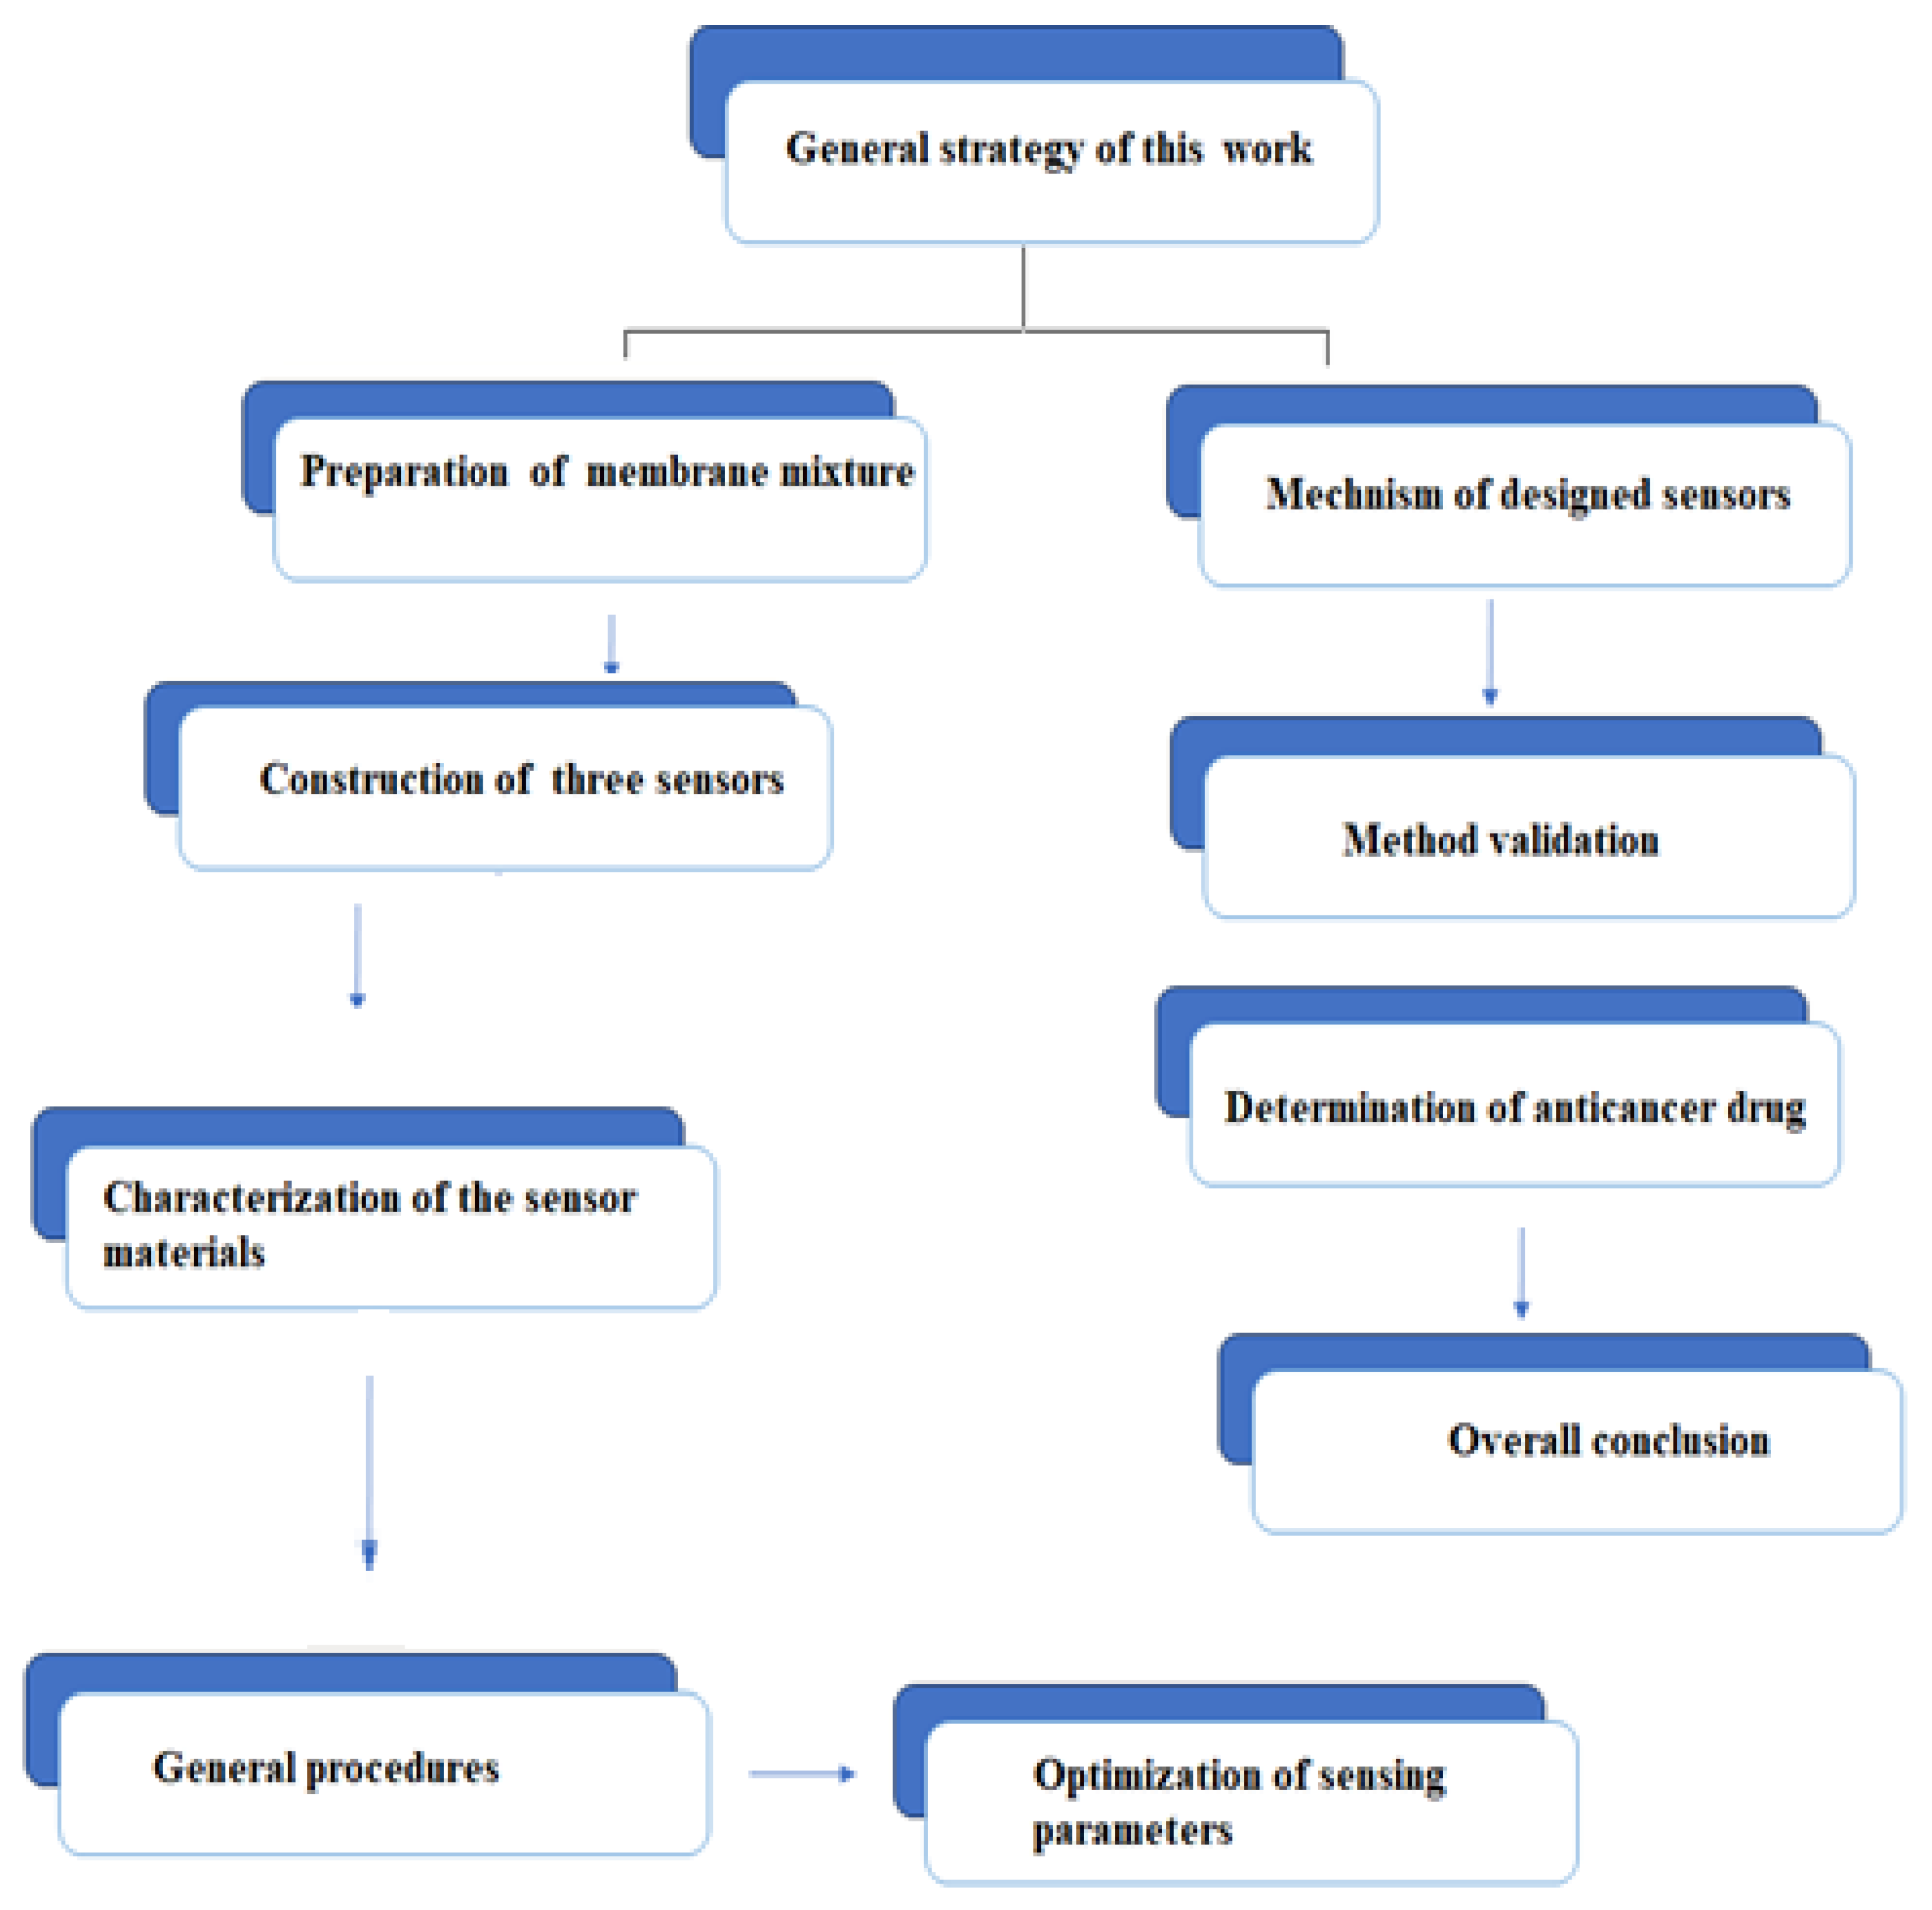
3.3. General Strategy of this Study
3.4. Preparation of GT- β, γ-CD and GT-Calix [8] arene Inclusions
3.5. Preparation of the GT-PVC Sensors
3.6. Characterization of Inclusion-Complexes
3.7. General Procedure and Calibration Graphs
3.8. Effect of ion Additives
3.9. Effect of Immersion Time
3.10. Determination of Gemcitabine in Ampoules
3.11. Validation of the Method
4. Conclusions
Supplementary Materials
Author Contributions
Funding
Institutional Review Board Statement
Informed Consent Statement
Data Availability Statement
Acknowledgments
Conflicts of Interest
Acronyms, Abbreviations, Symbols
References
- Kumar, A.; Vashist, H.; Sharma, R.B.; Deepshikha, G. An Anthology of Cancer. Innov. Int. J. Med. Pharm. Sci. 2018, 3, 7–14. [Google Scholar]
- Wang, E.; Sorolla, M.A.; Gopal Krishnan, P.D.; Sorolla, A. From seabed to bedside: A review on promising marine anticancer compounds. Biomolecules 2020, 10, 248. [Google Scholar] [CrossRef]
- Espinasse, A.; Lembke, H.K.; Cao, A.A.; Carlson, E.E. Modified nucleoside triphosphates in bacterial research for in vitro and live-cell applications. RSC Chem. Biol. 2020, 1, 333–351. [Google Scholar] [CrossRef]
- Shelton, J.; Lu, X.; Hollenbaugh, J.A.; Cho, J.H.; Amblard, F.; Schinazi, R.F. Metabolism, biochemical actions, and chemical synthesis of anticancer nucleosides, nucleotides, and base analogs. Chem. Rev. 2016, 116, 14379–14455. [Google Scholar] [CrossRef]
- Al-Kashef, I.D.; Saadeh, S.M.; Almonem, K.I.; Ghalwa, N.M.; Shawish, H.M. Fabrication and evaluation of potentiometric sensors of an anticancer drug (Gemcitabine). Eur. J. Chem. 2020, 11, 21–29. [Google Scholar] [CrossRef]
- Wang, M.; Hiraki, R.; Nakamura, N.; Hayama, T.; Yasuda, T.; Miyata, Y.; Sakai, H.; Nakashima, M.N.; Nakashima, M.; Ohyama, K. Determination of Gemcitabine in Plasma of Bladder Cancer Patients by Hydrophilic Interaction Chromatography with Ultraviolet Detection. J. Chromatogr. Sci. 2020, 58, 587–590. [Google Scholar] [CrossRef]
- Soni, N.; Soni, N.; Ramteke, P.W.; Pandey, H. A validated RP-HPLC assay method for determination of gemcitabine loaded nanosized solid lipid nanoparticles. J. Drug Deliv. Ther. 2018, 8, 308–313. [Google Scholar] [CrossRef]
- Kirstein, M.N.; Hassan, I.; Guire, D.E.; Weller, D.R.; Dagit, J.W.; Fisher, J.E.; Remmel, R.P. High-performance liquid chromatographic method for the determination of gemcitabine and 2,2-difluorodeoxyuridine in plasma and tissue culture media. J Chromatogr. B 2006, 835, 136–142. [Google Scholar] [CrossRef]
- Losa, R.; Sierra, M.I.; Gion, M.O.; Esteban, E.; Buesa, J.M. Simultaneous determination of gemcitabine di-and triphosphate in human blood mononuclear and cancer cells by RP-HPLC and UV detection. J. Chromatogr. B 2006, 840, 44–49. [Google Scholar] [CrossRef]
- Singh, R.; Shakya, A.K.; Naik, R.; Shalan, N. Stability-indicating HPLC determination of gemcitabine in pharmaceutical formulations. Int. J. Anal. Chem. 2015, 2015, 862592. [Google Scholar] [CrossRef]
- Mishra, S.; Narenderan, S.T.; Babu, B.; Mukherjee, K.; Meyyanathan, S.N. Validated analytical method for the estimation of Gemcitabine from its pharmaceutical formulation by RP-HPLC. Res. J. Pharm. Technol. 2019, 12, 5407–5412. [Google Scholar] [CrossRef]
- Sottani, C.; Turci, R.; Schierl, R.; Gaggeri, R.; Barbieri, A.; Violante, F.S.; Minoia, C. Simultaneous determination of gemcitabine, taxol, cyclophosphamide and ifosfamide in wipe samples by high-performance liquid chromatography/tandem mass spectrometry: Protocol of validation and uncertainty of measurement. Rapid Commun. Mass Spectrom. Rapid Dissem. Up Minute Res. Mass Spectrom. 2007, 21, 1289–1296. [Google Scholar] [CrossRef] [PubMed]
- Marangon, E.; Sala, F.; Caffo, O.; Galligioni, E.; D’Incalci, M.; Zucchetti, M. Simultaneous determination of gemcitabine and its main metabolite, dFdU, in plasma of patients with advanced non-small-cell lung cancer by high-performance liquid chromatography-tandem mass spectrometry. J. Mass Spectrom. 2008, 43, 216–223. [Google Scholar] [CrossRef] [PubMed]
- Kaur, T.; Kaur, S.; Kaur, P. Development and validation of UV-spectrophotometric methods for determination of gemcitabine hydrochloride in bulk and polymeric nanoparticles. Int. J. Appl. Pharm. 2017, 9, 60. [Google Scholar] [CrossRef]
- Menon, S.K.; Mistry, B.R.; Joshi, K.V.; Sutariya, P.G.; Patel, R.V. Analytical detection and method development of anticancer drug Gemcitabine HCl using gold nanoparticles. Spectrochim. Acta Part A Mol. Biomol. Spec. 2012, 94, 235–242. [Google Scholar] [CrossRef]
- Khaira, R.; Sharma, J.; Saini, V. Development and characterization of nanoparticles for the delivery of gemcitabine hydrochloride. Sci. World J. 2014, 2014, 560962. [Google Scholar] [CrossRef]
- Ali, M.S.; Muthukumaran, J.; Jain, M.; Al-Lohedan, H.A.; Farah, M.A.; Alsowilem, O.I. Experimental and computational investigation on the binding of anticancer drug gemcitabine with bovine serum albumin. J. Biomol. Strut. Dynam. 2021, 40, 9144–9157. [Google Scholar] [CrossRef] [PubMed]
- Rus, I.; Pusta, A.; Tertiș, M.; Barbălată, C.; Tomuță, I.; Săndulescu, R.; Cristea, C. Gemcitabine direct electrochemical detection from pharmaceutical formulations using a boron-doped diamond electrode. Pharmaceuticals 2021, 14, 912. [Google Scholar] [CrossRef]
- Hatamluyi, B.; Sadeghzadeh, S.; Sadeghian, R.; Mirimoghaddam, M.M.; Boroushaki, M.T. A signal on-off ratiometric electrochemical sensing platform coupled with a molecularly imprinted polymer and CuCo2O4/NCNTs signal amplification for selective determination of gemcitabine. Sens. Actuators B Chem. 2022, 371, 132552. [Google Scholar] [CrossRef]
- Tandel, R.; Teradal, N.; Satpati, A.; Jaldappagari, S. Fabrication of the electrochemically reduced graphene oxide-bismuth nanoparticles composite and its analytical application for an anticancer drug gemcitabine. Chin. Chem. Lett. 2017, 28, 1429–1437. [Google Scholar] [CrossRef]
- Gupta, K.V.; Nayak, A.; Agarwal, S.; Singhal, B. Recent advances on potentiometric membrane sensors for pharmaceutical analysis. Comb. Chem. High Throughput Screen 2011, 14, 284–302. [Google Scholar] [CrossRef]
- Mikhelson, K.N.; Peshkova, M.A. Advances and trends in ionophore-based chemical sensors. Russ. Chem. Rev. 2015, 84, 555. [Google Scholar] [CrossRef]
- Draz, M.E.; Naguib, I.A.; Saad, A.S. Computational ionophore selection during optimization of a portable calixarene based sensor for direct assay of levamisole residues in livestock products. J. Electroanal. Chem. 2021, 897, 115546. [Google Scholar] [CrossRef]
- Gao, L.; Wang, H.; Zheng, B.; Huang, F. Combating antibiotic resistance: Current strategies for the discovery of novel antibacterial materials based on macrocycle supramolecular chemistry. Giant 2021, 7, 100066. [Google Scholar] [CrossRef]
- Mishra, P.; Sethi, P.; Sharma, N.; Sharma, J. Macrocyclic scaffold: A boon in advancement of sensor technology-review. In Materials Today: Proceedings; Elsevier: Amsterdam, The Netherlands, 2022; Volume 71, pp. 370–373. [Google Scholar] [CrossRef]
- Wright, D.S.; Niu, H.C. Supramolecular chemistry of p-block elements. [CrossRef]
- Zhang, Y.M.; Liu, Y.H.; Liu, Y. Cyclodextrin-based multistimuli-responsive supramolecular assemblies and their biological functions. Adv. Mater. 2020, 32, 1806158. [Google Scholar] [CrossRef] [PubMed]
- Prochowicz, D.; Kornowicz, A.; Lewinnski, J. Interactions of native cyclodextrins with metal ions and inorganic nanoparticles: Fertile landscape for chemistry and materials science. Chem. Rev. 2017, 117, 13461–13501. [Google Scholar] [CrossRef] [PubMed]
- Sousa, T.F.; Amorim, C.G.; Montenegro, M.C.; Araujo, A.N. Cyclodextrin based potentiometric sensor for determination of ibuprofen in pharmaceuticals and waters. Sens. Actuators B Chem. 2013, 176, 660–666. [Google Scholar] [CrossRef]
- Lenik, J.; Lyszczek, R. Functionalized β-cyclodextrin based potentiometric sensor for naproxen determination. Mater. Sci. Eng. C 2016, 61, 149–157. [Google Scholar] [CrossRef]
- Gadhari, N.S.; Gholave, J.V.; Patil, S.S.; Patil, V.R.; Upadhyay, S.S. Enantioselective high performance new solid contact ion- selective electrode potentiometric sensor based on sulphated γ-cyclodextrin carbon nanofiber composite for determination of multichiral drug moxifloxacin. J. Electroanal. Chem. 2021, 882, 114981. [Google Scholar] [CrossRef]
- Ji, X.; Ahmed, M.; Long, L.; Khashab, N.M.; Huang, F.; Sessler, J.L. Adhesive supramolecular polymeric materials constructed from macrocycle-based host–guest interactions. Chem. Soc. Rev. 2019, 48, 2682–2697. [Google Scholar] [CrossRef]
- Ishimatsu, R.; Izadyar, A.; Kabagambe, B.; Kim, Y.; Kim, J.; Amemiya, S. Electrochemical mechanism of ion–ionophore recognition at plasticized polymer membrane/water interfaces. J. Am. Chem. Soc. 2011, 133, 16300–16308. [Google Scholar] [CrossRef]
- Wang, H.; Zheng, X. Theoretical study of macrocyclic host molecules: From supramolecular recognition to self-assembly. Phys. Chem. Chem. Phys. 2022, 24, 19011–19028. [Google Scholar] [CrossRef] [PubMed]
- Farcas, A.; Resmerita, A.M.; Balan-Porcarasu, M.; Cojocaru, C.; Peptu, C.; Sava, I. Inclusion Complexes of 3, 4-Ethylenedioxythiophene with Per-Modified β-and γ-Cyclodextrins. Molecules 2023, 28, 3404. [Google Scholar] [CrossRef] [PubMed]
- Siva, S.; Nayaki, S.K.; Rajendiran, N. 2017. Spectral and molecular modeling investigations of supramolecular complexes of mefenamic acid and aceclofenac with α-and β-cyclodextrin. Spectrochim. Acta Part A Mol. Biomol. Spectrosc. 2017, 174, 349–362. [Google Scholar] [CrossRef]
- Shen, H.; Gu, Z.; Jian, K.; Qi, J. In vitro study on the binding of gemcitabine to bovine serum albumin. J. Pharm. Biomed. Anal. 2013, 75, 86–93. [Google Scholar] [CrossRef]
- Eugster, R.; Gehrig, P.M.; Morf, W.E.; Spichiger, U.E.; Simon, W. Selectivity-modifying influence of anionic sites in neutral-carrier-based membrane electrodes. Anal. Chem. 1991, 20, 2285–2289. Available online: https://pubs.acs.org/doi/pdf/10.1021/ac00020a017 (accessed on 11 November 2023).
- Bakker, E.; Pretsch, E. Modern potentiometry. Angew. Chem. Int. Ed. 2007, 46, 5660–5668. [Google Scholar] [CrossRef]
- Buck, R.P.; Lindner, E. Recommendations for nomenclature of ion selective electrodes (IUPAC Recommendations 1994). Pure Appl. Chem. 1994, 66, 2527–2536. [Google Scholar] [CrossRef]
- Umezawa, Y.; Bühlmann, P.; Umezawa, K.; Tohda, K.; Amemiya, S. Potentiometric selectivity coefficients of ion-selective electrodes. Part I. Inorganic cations (technical report). Pure Appl. Chem. 2000, 10, 1851–2082. [Google Scholar] [CrossRef]
- Jansen, P.J.; Akers, M.J.; Amos, R.M.; Baertschi, S.W.; Cooke, G.G.; Dorman, D.E.; Kemp, C.A.; Maple, S.R.; McCune, K.A. The degradation of the antitumor agent gemcitabine hydrochloride in an acidic aqueous solution at pH 3.2 and identification of degradation products. J. Pharm. Sci. 2000, 89, 885–891. [Google Scholar] [CrossRef] [PubMed]
- Miller, J.N.; Milller, J.C. Miller, Statistics and Chemometrics for Analytical Chemistry; Pearson: London, UK, 2005. [Google Scholar]
- Haiyee, Z.A.; Saim, N.; Said, M.; Illias, R.M.; Mustapha, W.A.W.; Hassan, O. Characterization of cyclodextrin complexes with turmeric oleoresin. Food Chem. 2009, 114, 459–465. [Google Scholar] [CrossRef]
- Alrabiah, H.; Homoda, A.M.; Radowan, A.A.; Ezzeldin, E.; Mostafa, G.A. Polymeric membrane sensors for batch and flow injection potentiometric determination of procainamide. IEEE Sensors J. 2020, 21, 4198–4208. [Google Scholar] [CrossRef]


| 1H | ppm (DMSO) | 13C | ppm (DMSO) | ||||
|---|---|---|---|---|---|---|---|
| δ β-CD | δ Gemcitabine | δ β-CD/Gemcitabine Complex | δ β-CD | δ Gemcitabine | δ β-CD/Gemcitabine Complex | ||
| H1 | 5.7 | 5.65 | C1 | 102.25 | 102.20 | ||
| H2 | 3.33 | 3.32 | C2 | 82.15 | 81.00 | ||
| H3 | 3.53 | 3.79 | C3 | 60.30 | 60.37 | ||
| H4 | 3.59 | 3.91 | C4 | 72.52 | 69.56 | ||
| H5 | 3.60 | 3.46 | C5 | 72.86 | 72.88 | ||
| H6 | 4.53 | 4.84 | C6 | 73.51 | 73.54 | ||
| Ha | 6.09 | 6.15 | Ca | 95.77 | 95.53 | ||
| Hb | 8.89 | 8.08 | Cb | 144.05 | 144.19 | ||
| Hc | 6.24 | 6.41 | Cc | 96.30 | 90.11 | ||
| Hd | 3.80 | 3.60 | Cd | 81.80 | 81.87 | ||
| He | 4.21 | 4.19 | Ce | 83.98 | 84.39 | ||
| Hf | 3.66 | 3.63 | Cf | 59.13 | 59.25 | ||
| 1H | ppm (DMSO) | 13C | ppm (DMSO) | ||||
|---|---|---|---|---|---|---|---|
| δ ϒ-CD | δ Gemcitabine | δ Gemcitabine/ϒ-CD Complex | δ ϒ-CD | δ Gemcitabine | δ Gemcitabine/ϒ-CD Complex | ||
| H1 | 5.73 | 5.70 | C1 | 102.12 | 102.14 | ||
| H2 | 3.31 | 3.31 | C2 | 81.38 | 81.39 | ||
| H3 | 3.52 | 3.81 | C3 | 60.43 | 60.42 | ||
| H4 | 3.67 | 3.62 | C4 | 72.63 | 72.65 | ||
| H5 | 3.65 | 3.60 | C5 | 73.04 | 73.05 | ||
| H6 | 4.40 | 4.89 | C6 | 73.33 | 73.37 | ||
| Ha | 6.09 | 6.18 | Ca | 95.77 | 95.23 | ||
| Hb | 8.89 | 8.09 | Cb | 144.05 | 144.20 | ||
| Hc | 6.24 | 6.34 | Cc | 96.30 | 95.22 | ||
| Hd | 3.80 | 3.92 | Cd | 81.80 | 81.71 | ||
| He | 4.21 | 4.21 | Ce | 83.98 | 83.99 | ||
| Hf | 3.66 | 3.64 | Cf | 59.13 | 59.20 | ||
| 1H | ppm (DMSO) | 13C | ppm (DMSO) | ||||
|---|---|---|---|---|---|---|---|
| δ 4-ter-butylcaix [8] arene | δ Gemcitabine | δ Gemcitabine-4-ter-butylcaix [8] arene Complex | δ 4-ter-butylcaix [8] arene | δ Gemcitabine | δ Gemcitabine-4-ter-butylcaix [8] arene Complex | ||
| H1 | 1.29 | 1.32 | C1 | 31.48 | 31.44 | ||
| H2 | 2.30 | 2.36 | C2 | 30.96 | 30.84 | ||
| H3 | 7.23 | 7.18 | C3 | 125.54 | 125.58 | ||
| C4 | 128.72 | 128.51 | |||||
| C5 | 146.68 | 146..61 | |||||
| C6 | 144.55 | 144.41 | |||||
| C7 | 34.03 | 33.99 | |||||
| Ha | 6.09 | 6.23 | Ca | 95.77 | 95.20 | ||
| Hb | 8.89 | 8.53 | Cb | 144.05 | 144.11 | ||
| Hc | 6.24 | 6.30 | Cc | 96.30 | 93.00 | ||
| Hd | 3.80 | 3.82 | Cd | 81.80 | 81.88 | ||
| He | 4.21 | 4.16 | Ce | 83.98 | 83.89 | ||
| Hf | 3.66 | 3.60 | Cf | 59.13 | 59.24 | ||
| Plasticizer | DOP | DBS | o-NPOE |
|---|---|---|---|
| Sensor 1 | 4-tert-butylcalix [8] arene | ||
| Slope, mV/decade | 50 | 49 | 51 |
| Response time, sec | 25 | 30 | 25 |
| Calibration range, mol L−1 | 6.0 × 10⁻⁶–1.0 × 10⁻² | 9.0 × 10⁻⁵–1.0 × 10⁻² | 6.0 × 10⁻⁶–1.0 × 10⁻² |
| Sensor 2 | β-cyclodextrin | ||
| Slope, mV/decade | 55 | 51 | 56 |
| Response time, sec | 20 | 25 | 20 |
| Calibration range, mol L−1 | 9.0 × 10⁻⁶–1.0 × 10⁻² | 1.0 × 10⁻⁵–1.0 × 10⁻² | 9.0 × 10⁻⁶–1.0 × 10⁻² |
| Sensor 3 | γ-cyclodextrin | ||
| Slope, mV/decade | 55 | 53 | 55 |
| Response time, sec | 25 | 30 | 20 |
| Calibration range, mol L−1 | 6.0 × 10⁻⁶–1.0 × 10⁻² | 1.0 × 10⁻⁵–1.0 × 10⁻² | 8.0 × 10⁻⁶–1.0 × 10⁻² |
| Interferent | Sensor 1 | Sensor 2 | Sensor 3 |
|---|---|---|---|
| Na+ | 1.1 × 10⁻³ | 1.5 × 10⁻³ | 1.2 × 10⁻³ |
| K+ | 1.2 × 10⁻² | 1.2 × 10⁻³ | 1.3 × 10⁻³ |
| Ca2+ | 1.1 × 10⁻² | 1.3 × 10⁻³ | 1.2 × 10⁻³ |
| Fe2+ | 1.2 × 10⁻² | 1.4 × 10⁻³ | 1.7 × 10⁻³ |
| Magnesium Stearate | 1.2 × 10⁻³ | 1.2 × 10⁻³ | 1.2 × 10⁻³ |
| Acetate | 1.3 × 10⁻³ | 1.1 × 10⁻³ | 1.3 × 10⁻³ |
| Phosphate | 1.3 × 10⁻³ | 1.3 × 10⁻³ | 1.2 × 10⁻³ |
| Benzoate | 1.3 × 10⁻³ | 1.2 × 10⁻³ | 1.3 × 10⁻³ |
| Caffeine | 1.1 × 10⁻³ | 1.3 × 10⁻³ | 1.2 × 10⁻⁴ |
| Citrate | 1.2 × 10⁻³ | 1.5 × 10⁻³ | 1.2 × 10⁻³ |
| Glucose * | 1.4 × 10⁻³ | 1.5 × 10⁻³ | 1.7 × 10⁻³ |
| Lactose monohydrate * | 1.4 × 10⁻³ | 1.5 × 10⁻³ | 1.6 × 10⁻³ |
| Starch * | 1.1 × 10⁻³ | 1.4 × 10⁻³ | 1.7 × 10⁻³ |
| Microcrystalline cellulose * | 1.4 × 10⁻³ | 1.3 × 10⁻³ | 1.6 × 10⁻³ |
| Parameter | Sensor 1 Calixarene | Sensor 2 β-CD | Sensor 3 γ-CD |
|---|---|---|---|
| Slope, (mV decade−1) | 52.0 ± 0.6 | 56.0 ± 0.3 | 55.0 ± 0.8 |
| Intercept, mV | 179.0 ± 0.5 | 299.0 ± 0.5 | 239.0 ± 0.5 |
| Correlation Coefficient, (r2) | 0.998 | 0.999 | 0.998 |
| Calibration, range mol L−1 | 6.0 × 10⁻⁶–1 × 10⁻² | 9.0 × 10⁻⁶–1.0 × 10⁻² | 8.0 × 10⁻⁶–1 × 10⁻² |
| LOQ, mol L−1 | 6.0 × 10⁻⁶ | 9.0 × 10⁻⁶ | 8.0 × 10⁻⁶ |
| LOD, mol L−1 | 2.5 × 10⁻⁶ | 2.2 × 10⁻⁶ | 2.7 × 10⁻⁶ |
| Response time of 1.0 × 10⁻³ mol L−1, s | 25 ± 0.5 | 25 ± 0.5 | 25 ± 0.5 |
| Working pH range | 6–9 | 6–9 | 6–9 |
| Concentration (µg mL−1) | Within-Day | ||
|---|---|---|---|
| Sensor 1 | Sensor 2 | Sensor 3 | |
| Recovery, % ± RSD, % | Recovery, % ± RSD, % | Recovery, % ± RSD, % | |
| 2.36 | 97.5 ± 2.7 | 97.5 ± 2.8 | 97.5 ± 2.8 |
| 2.63 | 97.5 ± 2.7 | 97.5 ± 2.8 | 97.5 ± 2.8 |
| 13.15 | 98.0 ± 2.7 | 97.5 ± 2.7 | 97.5 ± 2.6 |
| 26.3 | 98.5 ± 2.0 | 98.0 ± 1.9 | 98.0 ± 1.9 |
| 131.6 | 99.0 ± 1.8 | 98.0 ± 1.8 | 98.0 ± 1.8 |
| 263.2 | 99.0 ± 1.8 | 99.0 ± 1.8 | 99.0 ± 1.7 |
| Different days | |||
| 2.36 | 97.5 ± 2.9 | 97.5 ± 2.8 | 97.5 ± 2.9 |
| 2.63 | 97.5 ± 2.7 | 97.5 ± 2.8 | 97.5 ± 2.8 |
| 13.15 | 97.6 ± 2.8 | 97.5 ± 2.7 | 97.5 ± 2.6 |
| 26.3 | 98.0 ± 2.6 | 97.5 ± 2.5 | 97.5 ± 2.5 |
| 131.6 | 98.5 ± 2.3 | 98.0 ± 2.5 | 98.0 ± 2.2 |
| 263.2 | 98.5 ± 2.3 | 98.0 ± 2.3 | 98.0 ± 2.2 |
| Tested Concentration (µg mL−1) | Sensor 1 | Sensor 2 | Sensor 3 |
|---|---|---|---|
| Recovery ± RSD | Recovery ± RSD | Recovery ± RSD | |
| 2.36 | 97.5 ± 2.8 | 97.0 ± 2.8 | 97.5 ± 2.7 |
| 2.63 | 97.5 ± 2.6 | 97.5 ± 2.5 | 97.5 ± 2.5 |
| 13.15 | 98.0 ± 2.4 | 98.0 ± 2.4 | 98.0 ± 2.3 |
| 26.3 | 98.5 ± 2.1 | 98.5 ± 2.0 | 98.5 ± 2.0 |
| 131.6 | 99.5 ± 2.0 | 98.5 ± 2.0 | 98.5 ± 2.0 |
| 263.2 | 99.0 ± 1.8 | 99.0 ± 2.0 | 99.0 ± 1.8 |
| Preparation | Sensor 1 R% ± RSD% | Sensor 2 R% ± RSD% | Sensor 3 R% ± RSD% | Reported Method [5] R% ± RSD% |
|---|---|---|---|---|
| 1000 mg | 97.5 ± 2.5 | 98.5 ± 2.1 | 98.0 ± 2.9 | 98.5 ± 2.8 |
| t-test | 0.17 | 0.11 | 0.13 | |
| F test | 1.6 | 1.2 | 1.15 |
| Potentiometric Method | Sensing Material | Linear Range of Detection | LOD | Ref. |
|---|---|---|---|---|
| Carbon paste, coated wire and PVC sensors | Sodium tetraphenyl borate | 1.0 × 10⁻⁵–1.0 × 10⁻² M | 6.50 × 10⁻⁵ M 7.20 × 10⁻⁵ M 4.60 × 10⁻⁵ M | [5] |
| Ionophore-based PVC | 4-tert-butylcalix-[8]-arene (sensor 1), β-cyclodextrin (sensor 2), and γ-cyclodextrin (sensor 3) | 6.0 × 10⁻⁶–1 × 10⁻² M 9.0 × 10⁻⁶–1 × 10⁻² M 8.0 × 10⁻⁶–1 × 10⁻² M | 2.5 × 10⁻⁶ M 2.2 × 10⁻⁶ M 2.7 × 10⁻⁶ M | Present study |
Disclaimer/Publisher’s Note: The statements, opinions and data contained in all publications are solely those of the individual author(s) and contributor(s) and not of MDPI and/or the editor(s). MDPI and/or the editor(s) disclaim responsibility for any injury to people or property resulting from any ideas, methods, instructions or products referred to in the content. |
© 2023 by the authors. Licensee MDPI, Basel, Switzerland. This article is an open access article distributed under the terms and conditions of the Creative Commons Attribution (CC BY) license (https://creativecommons.org/licenses/by/4.0/).
Share and Cite
Mostafa, G.A.E.; El-Tohamy, M.F.; Ali, E.A.; Al-Salahi, R.; Attwa, M.W.; AlRabiah, H. Ionophore-Based Polymeric Sensors for Potentiometric Assay of the Anticancer Drug Gemcitabine in Pharmaceutical Formulation: A Comparative Study. Molecules 2023, 28, 7552. https://doi.org/10.3390/molecules28227552
Mostafa GAE, El-Tohamy MF, Ali EA, Al-Salahi R, Attwa MW, AlRabiah H. Ionophore-Based Polymeric Sensors for Potentiometric Assay of the Anticancer Drug Gemcitabine in Pharmaceutical Formulation: A Comparative Study. Molecules. 2023; 28(22):7552. https://doi.org/10.3390/molecules28227552
Chicago/Turabian StyleMostafa, Gamal A. E., Maha F. El-Tohamy, Essam A. Ali, Rashad Al-Salahi, Mohamed W. Attwa, and Haitham AlRabiah. 2023. "Ionophore-Based Polymeric Sensors for Potentiometric Assay of the Anticancer Drug Gemcitabine in Pharmaceutical Formulation: A Comparative Study" Molecules 28, no. 22: 7552. https://doi.org/10.3390/molecules28227552