

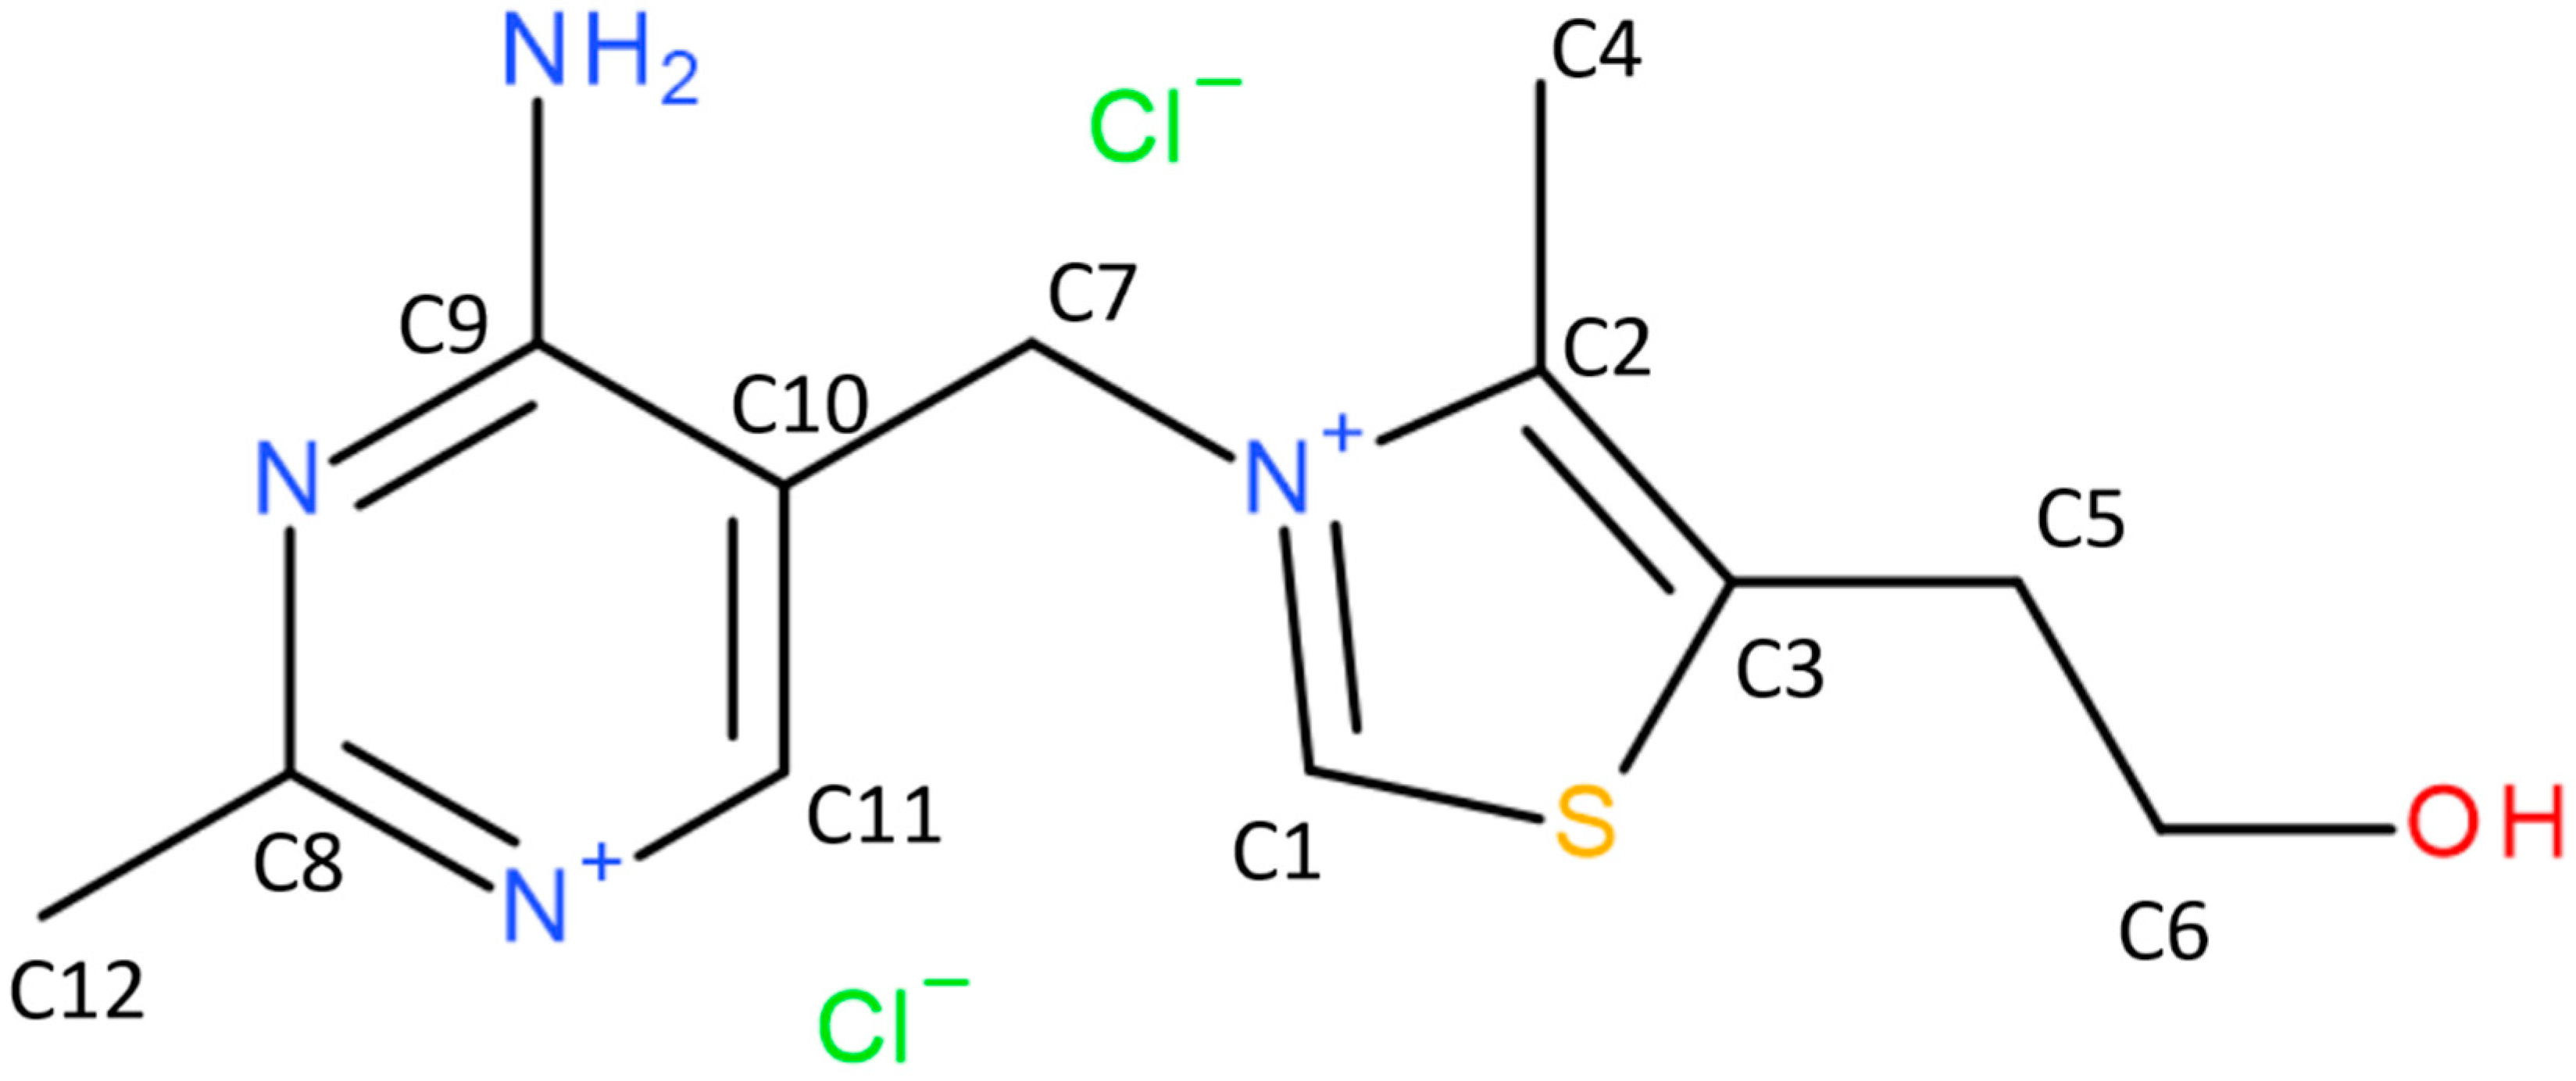
Density Functional Theory and Density Functional Tight Binding Studies of Thiamine Hydrochloride Hydrates


Abstract
:1. Introduction
2. Results and Discussion
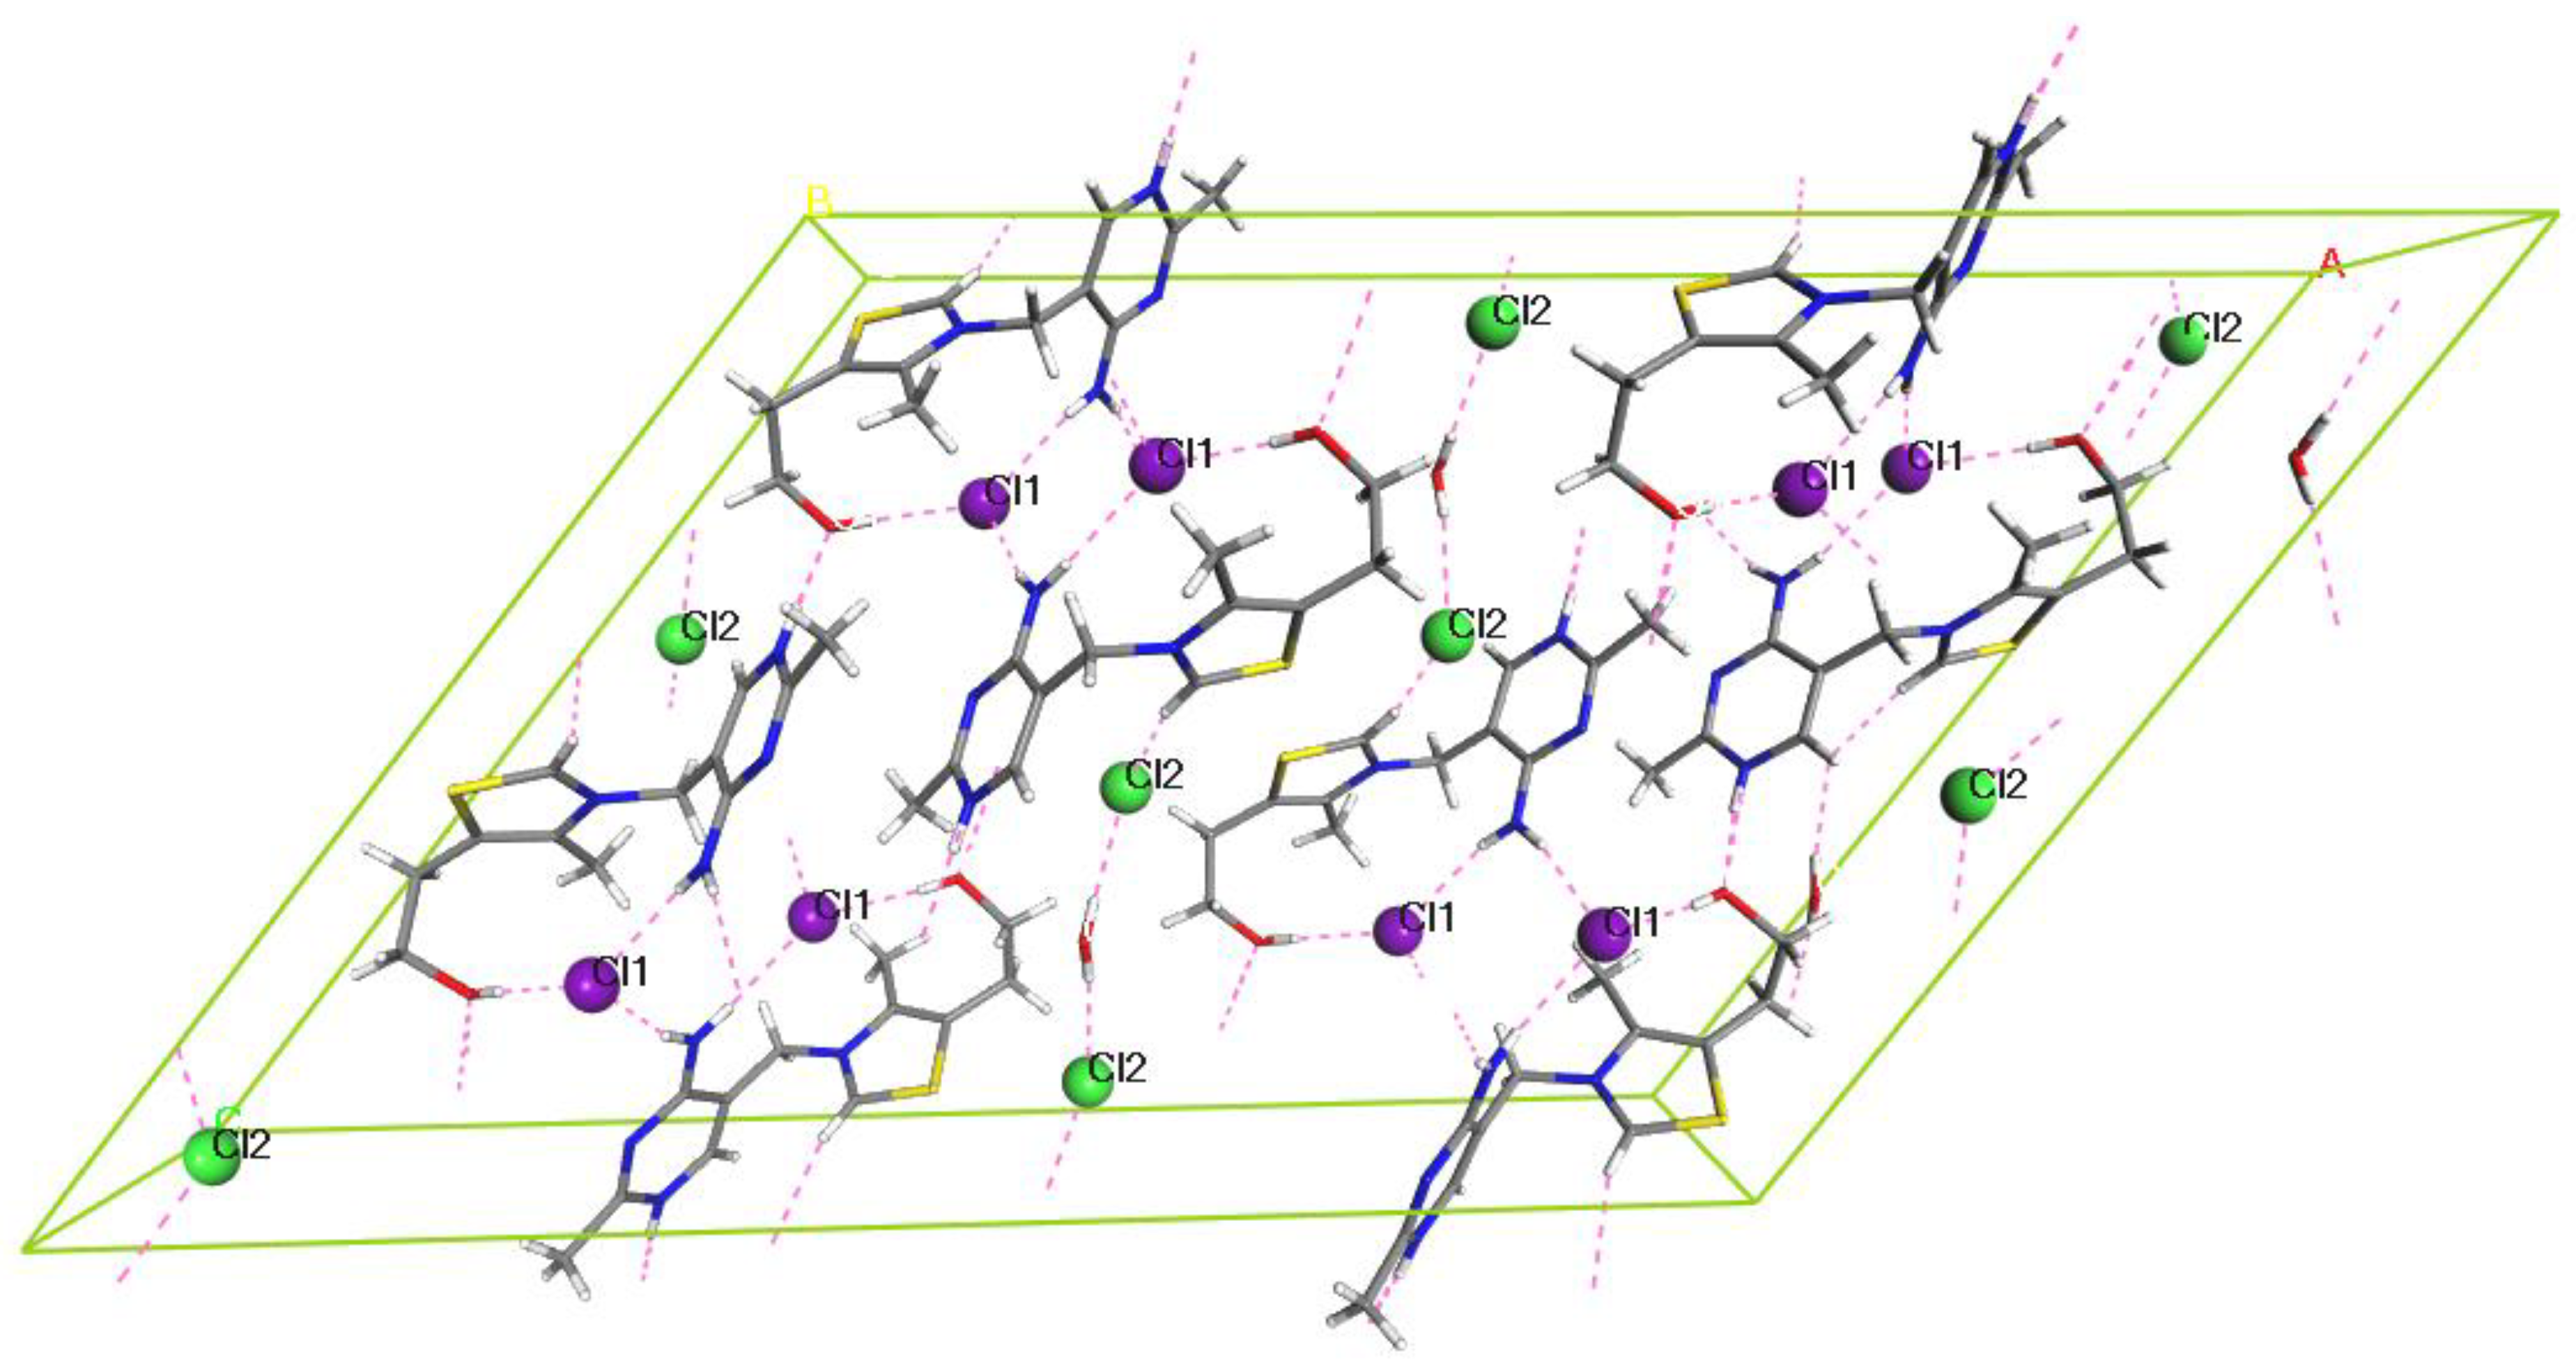
2.1. Crystal Structure Analysis
2.2. Crystal Structure Preparation
2.2.1. NSH
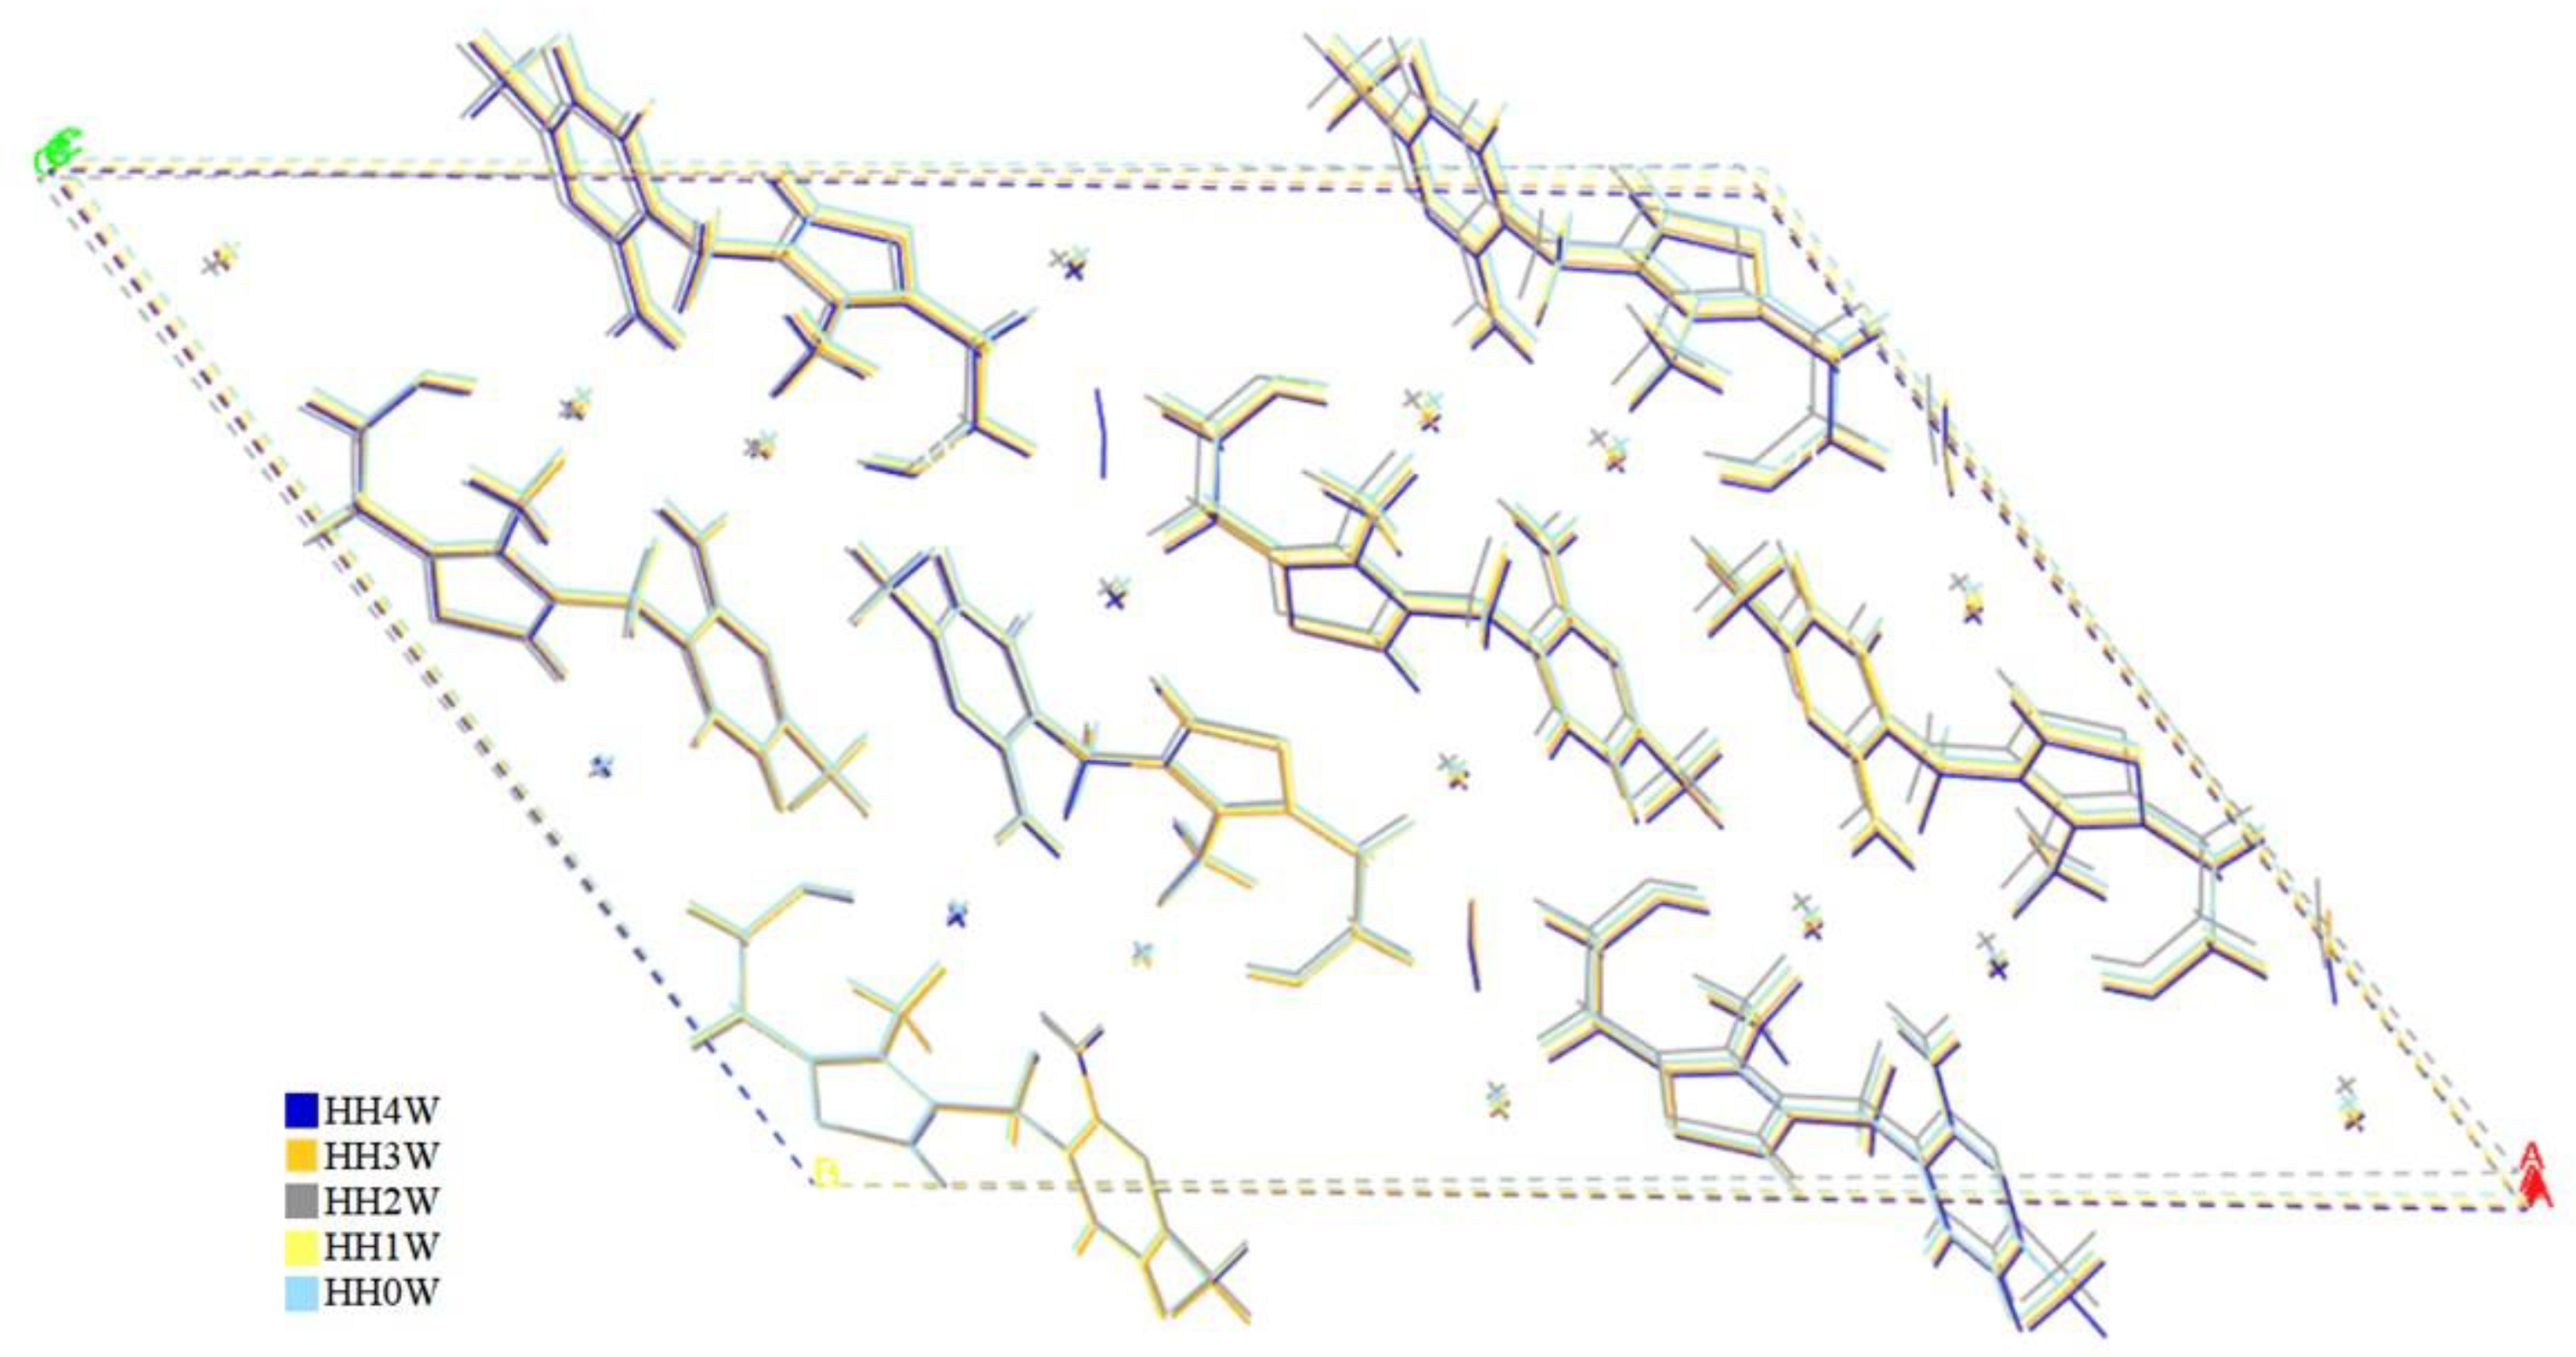
2.2.2. HH
2.3. Crystal Structure Optimization
2.4. Energetic Considerations
2.5. NMR Calculations
2.5.1. NMR Calculations of NSH
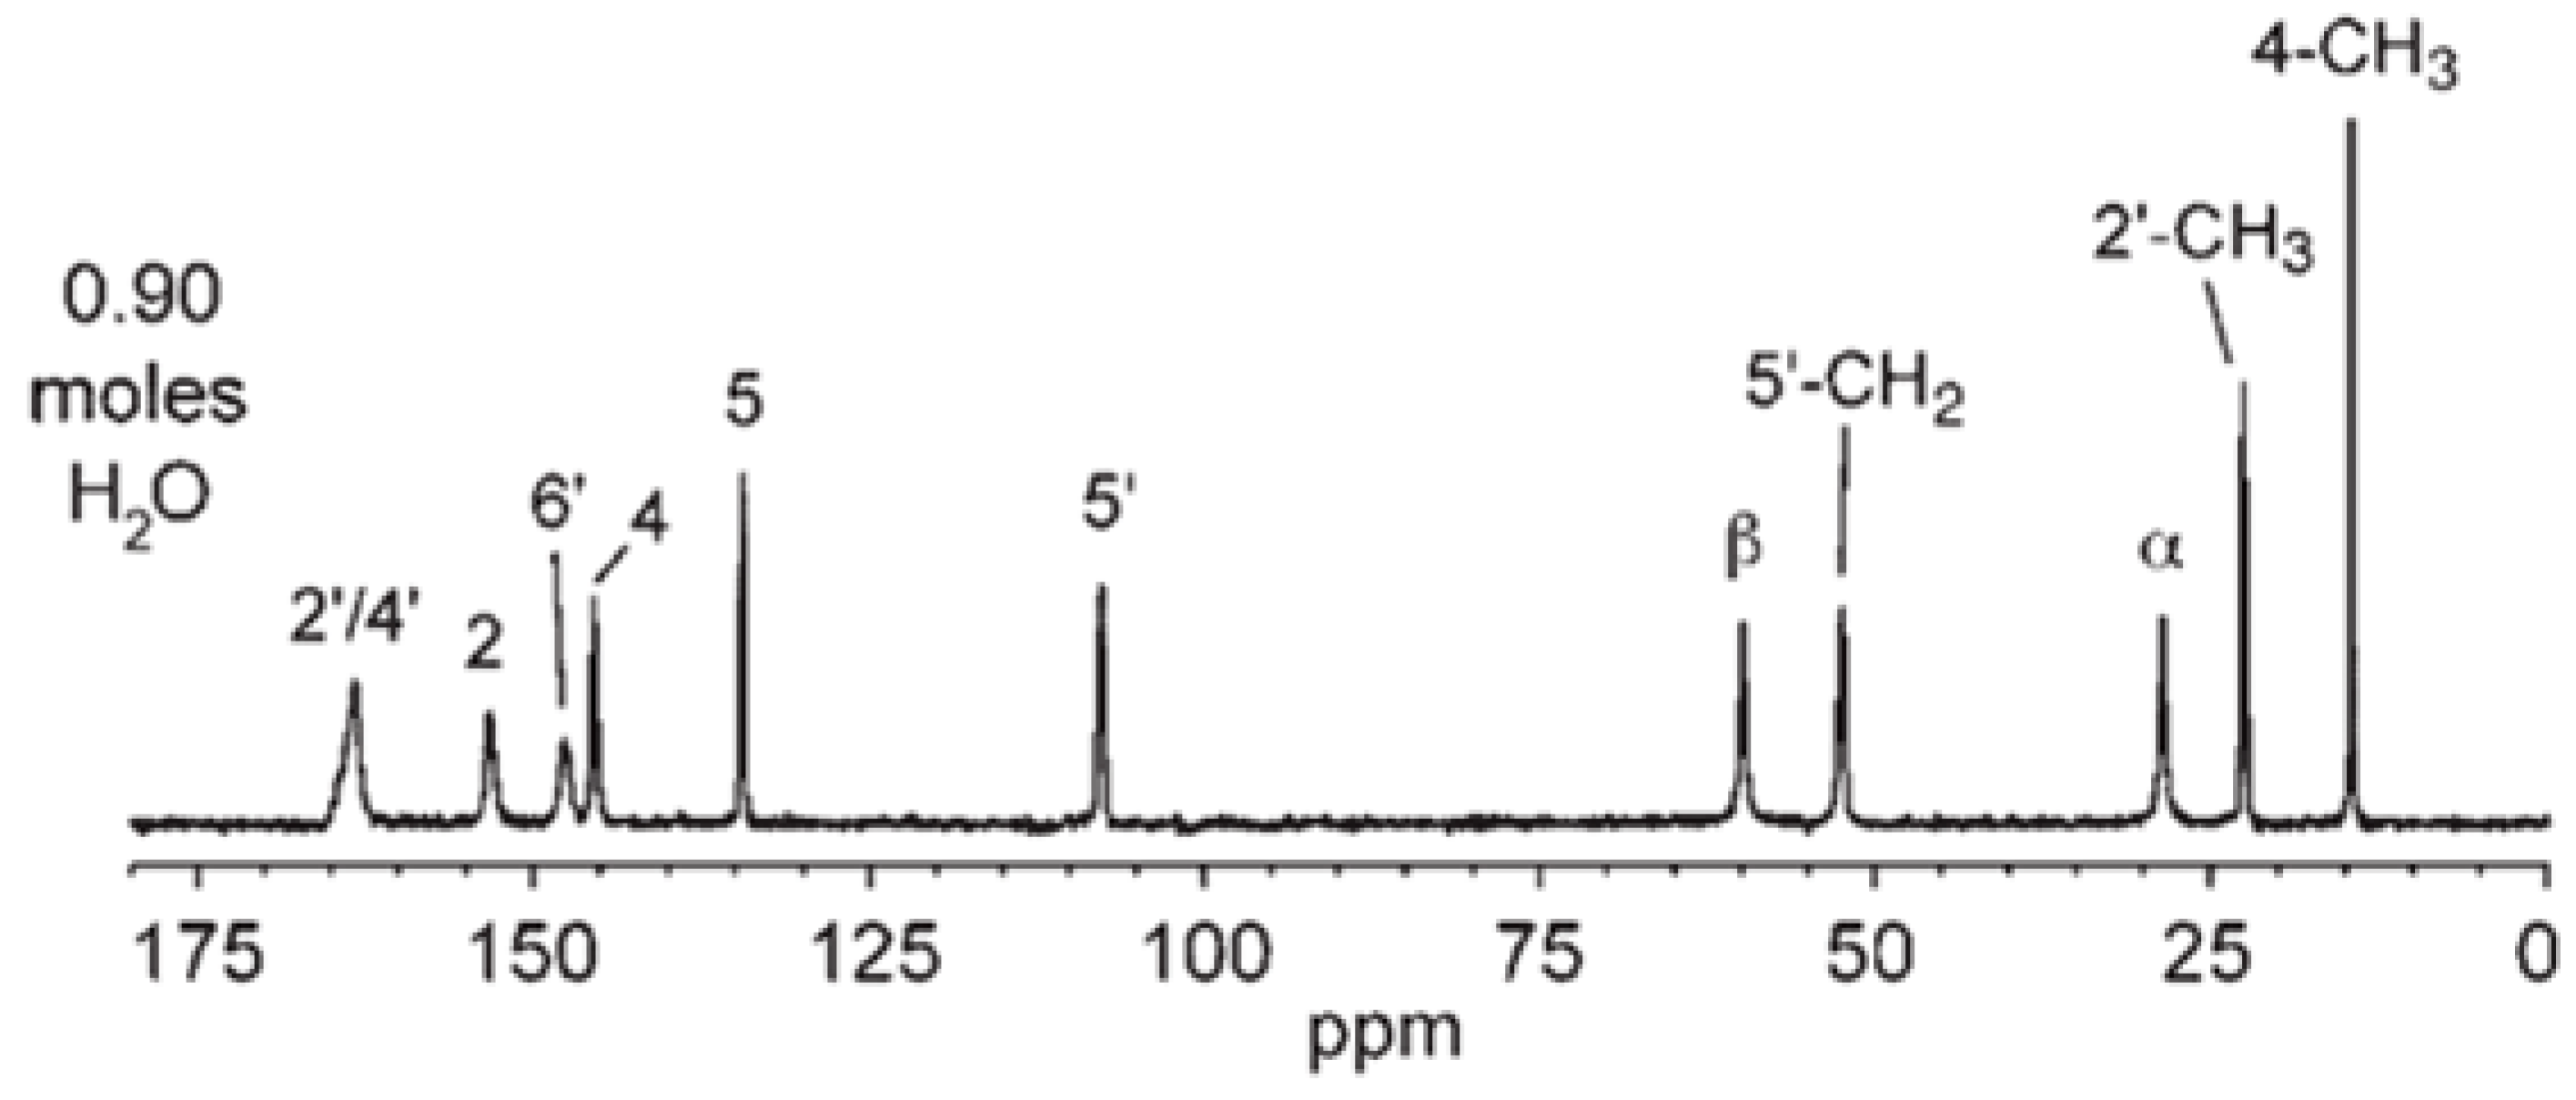
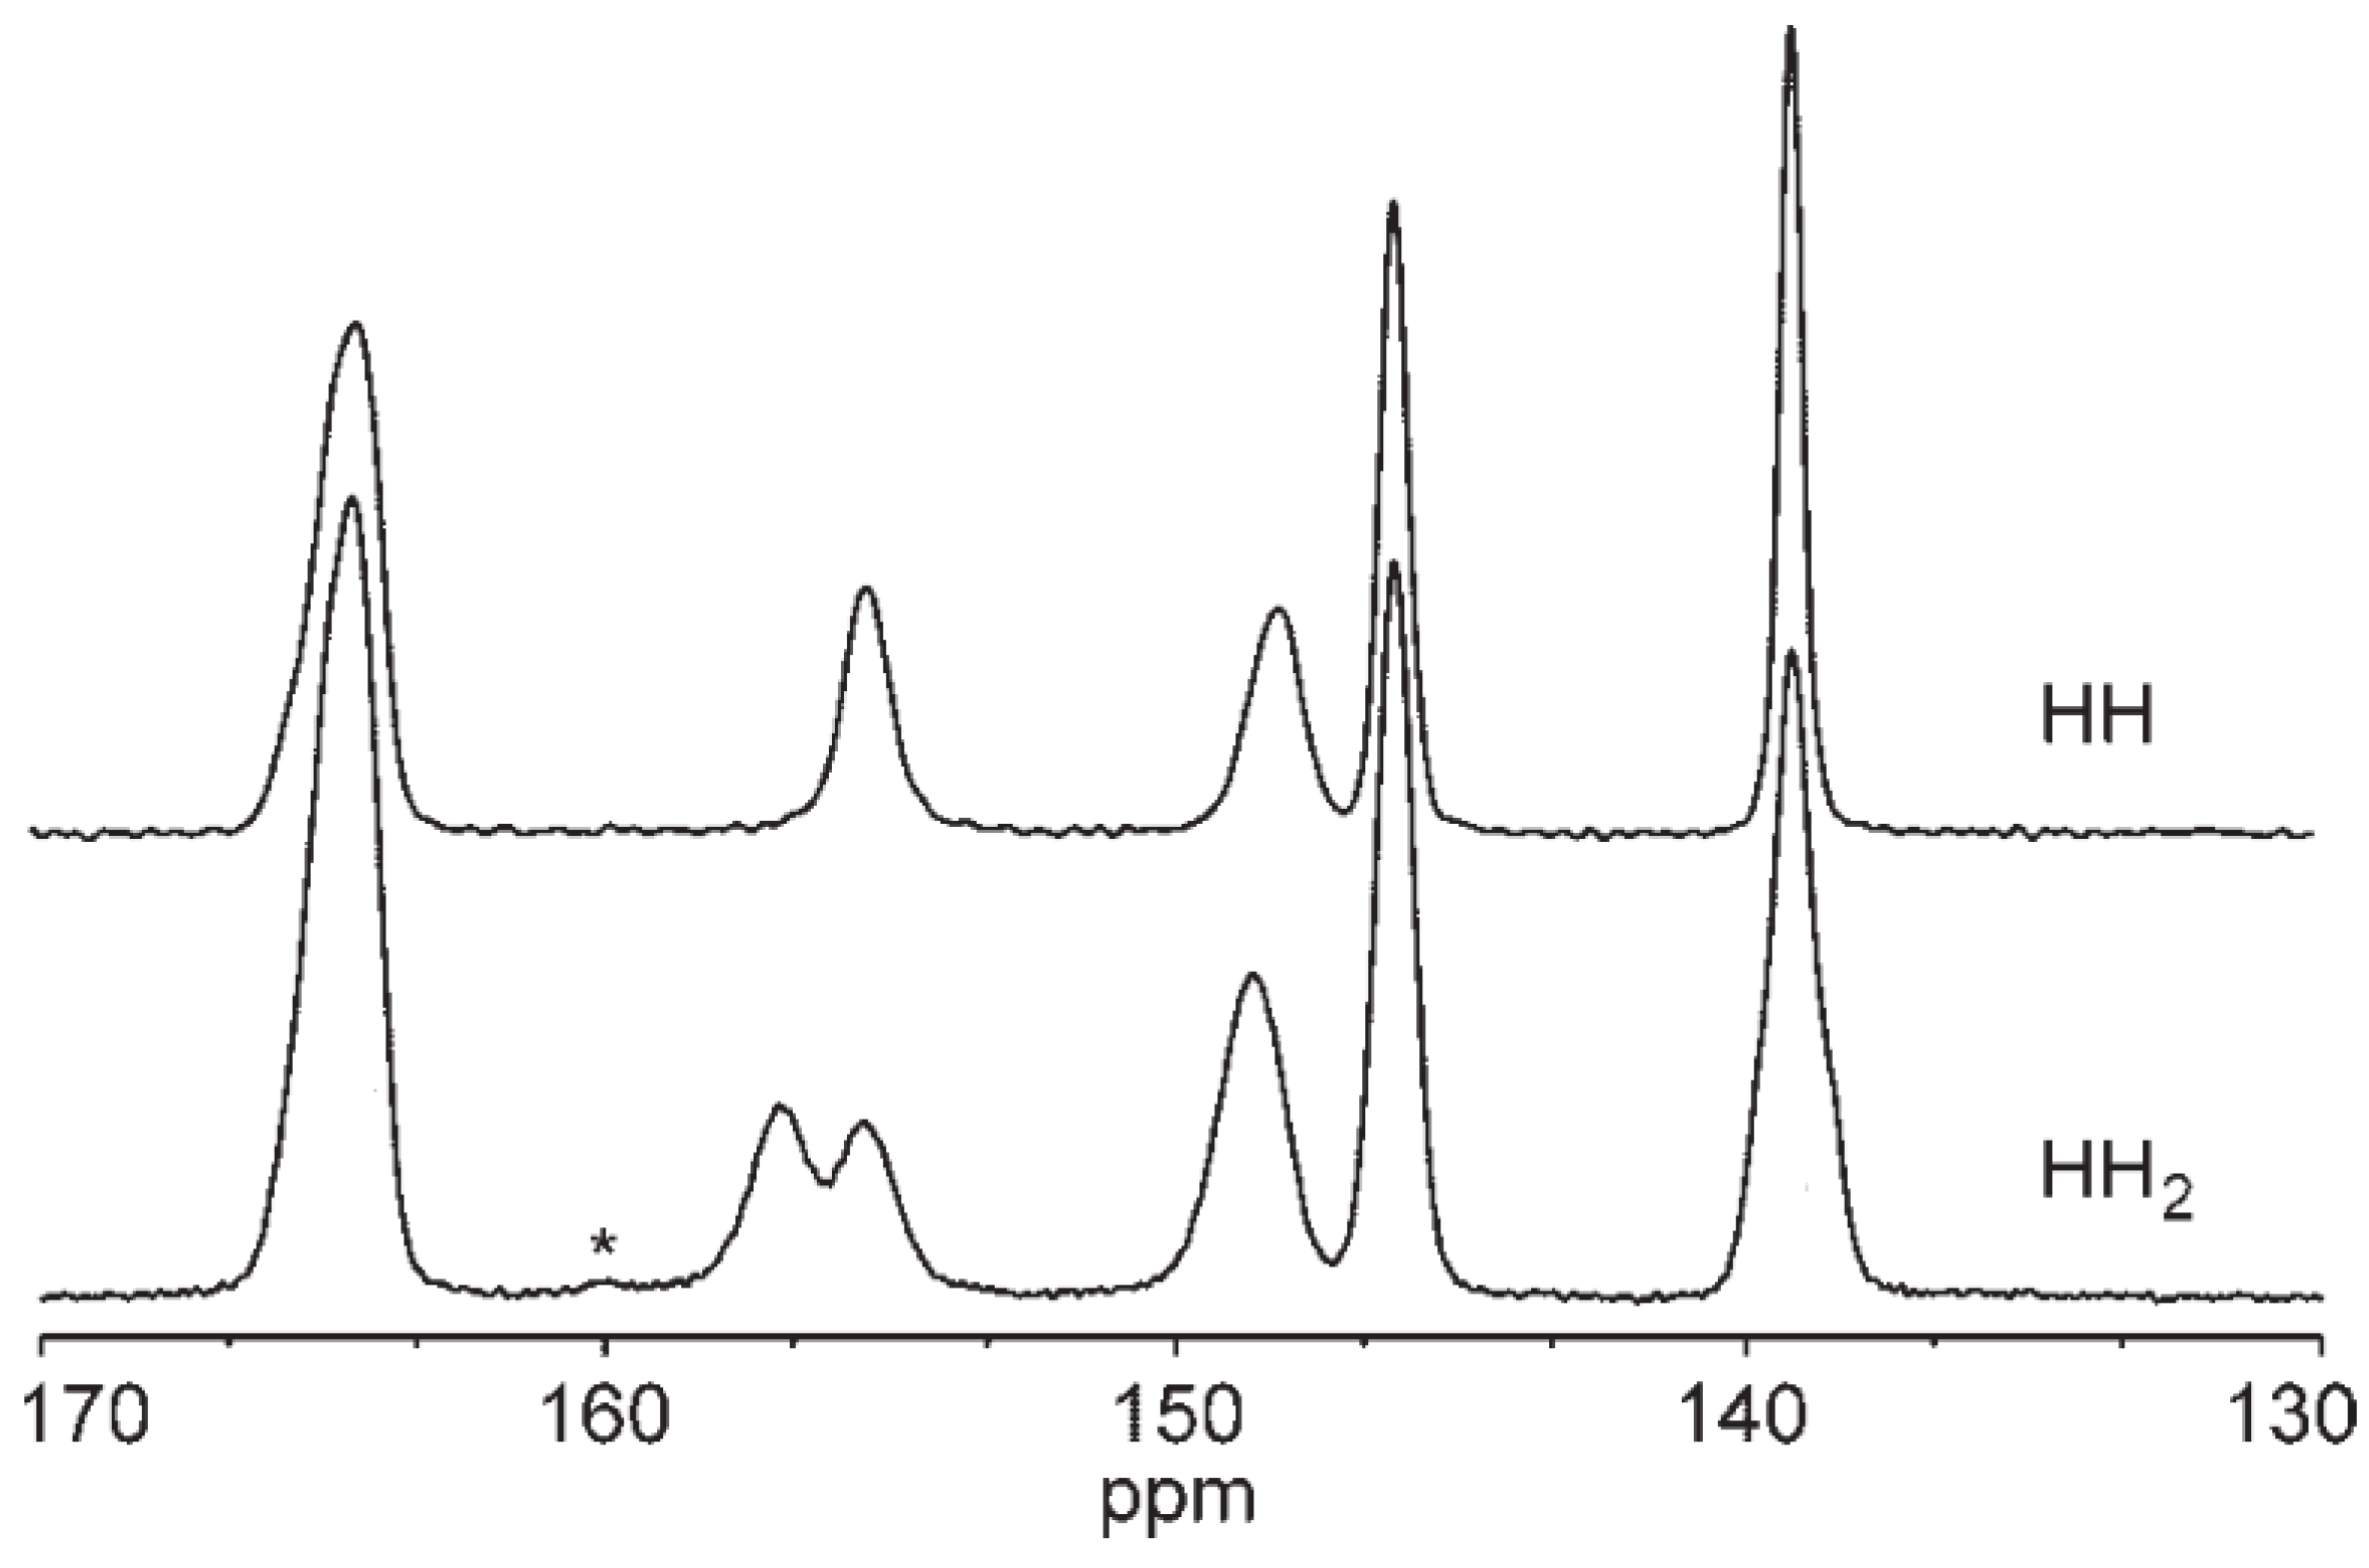
2.5.2. NMR Calculations of HH
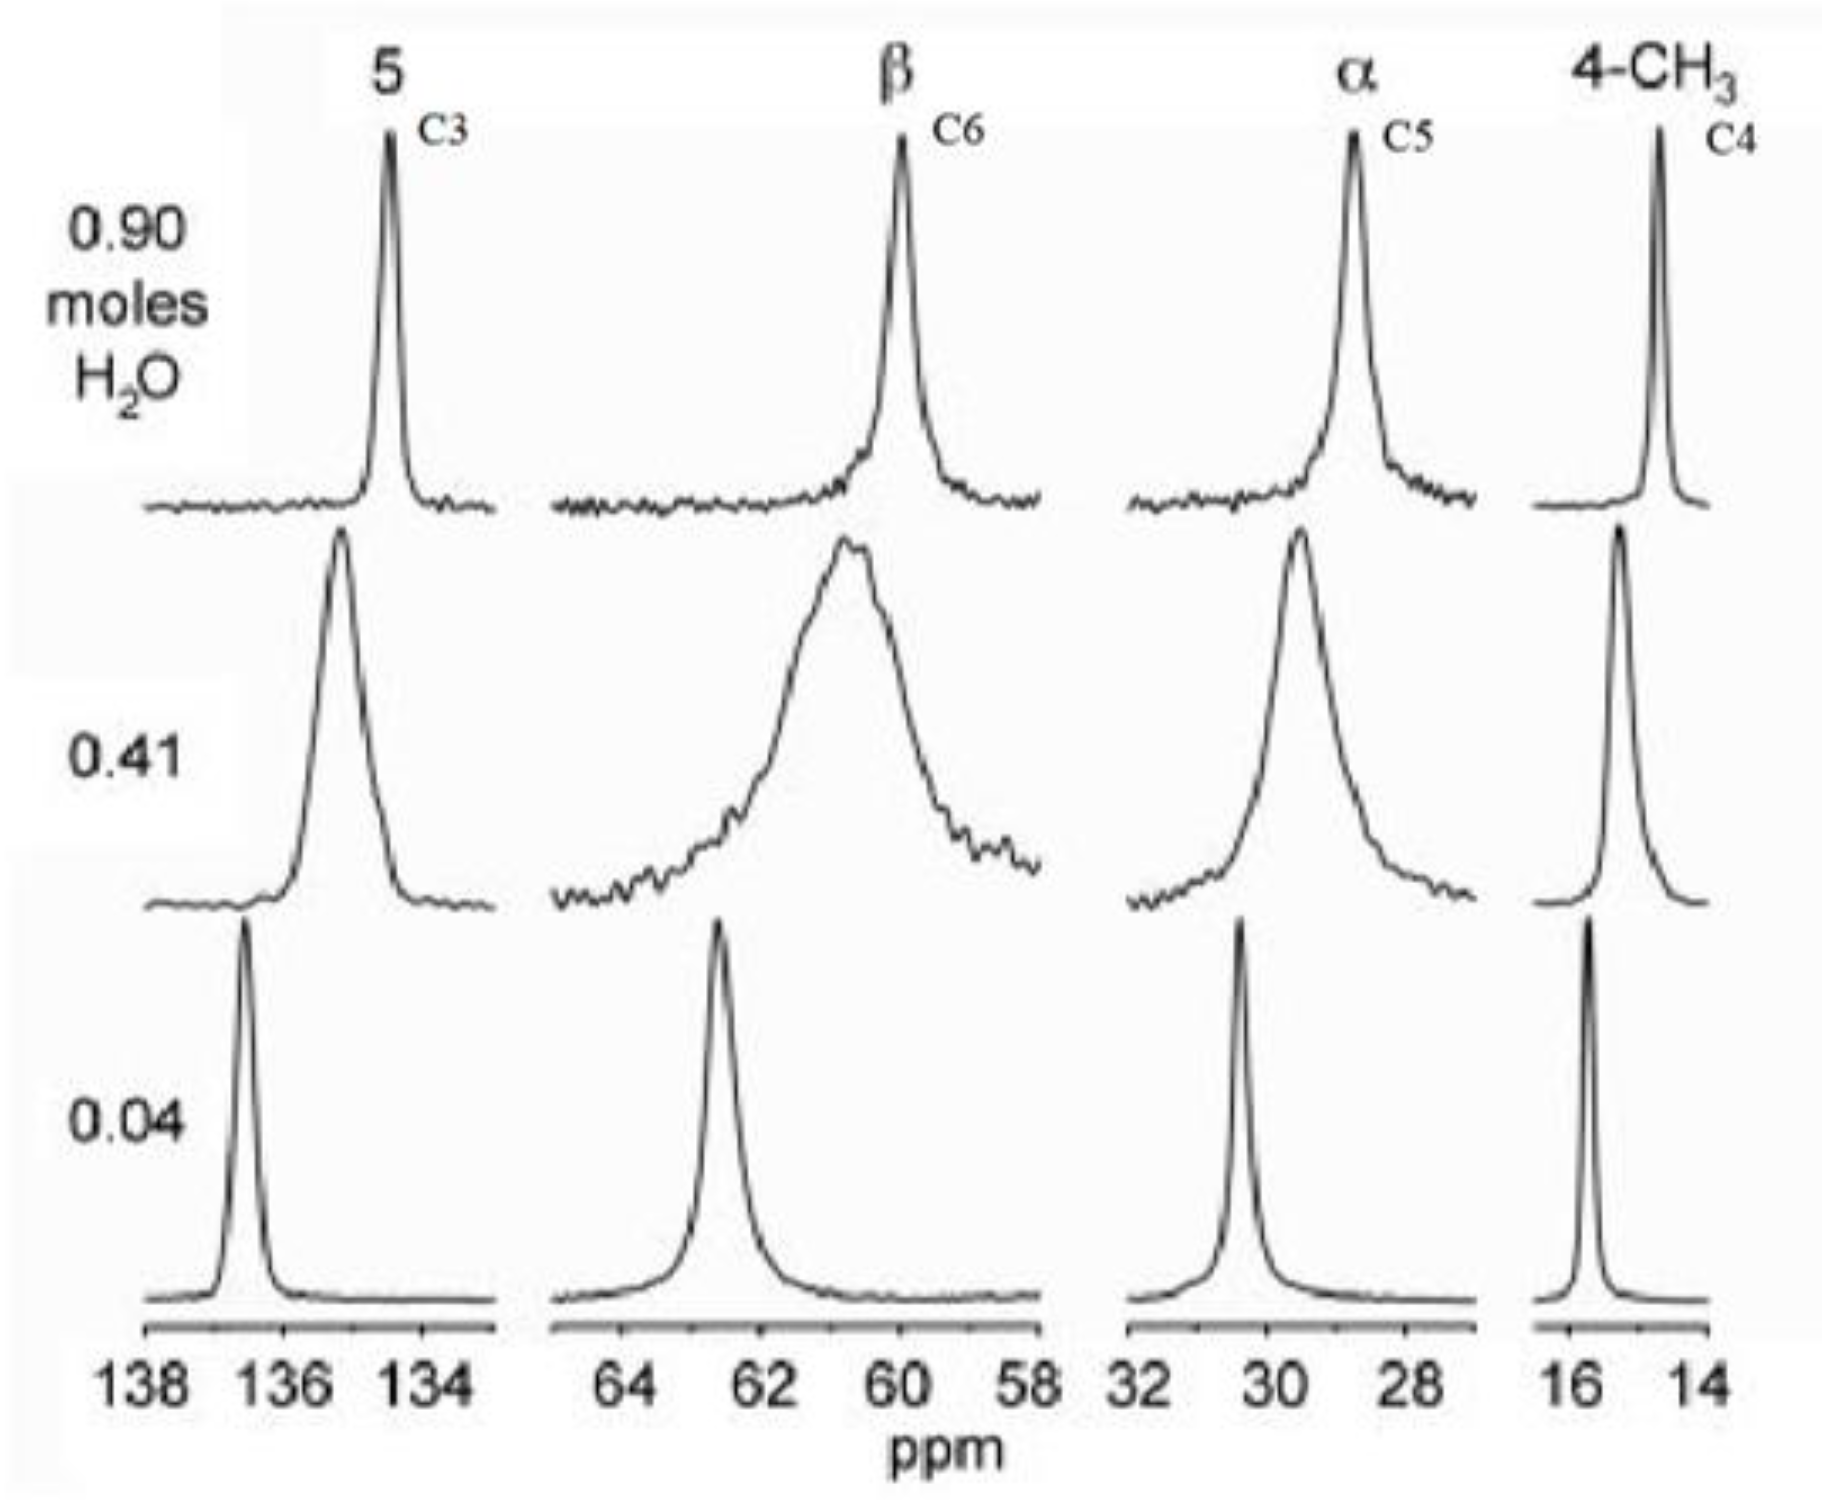
2.6. Molecular Dynamics Simulations
3. Materials and Methods
3.1. Periodic DFT Calculations
3.1.1. Geometry Optimization
3.1.2. NMR Parameters Calculations
3.2. Periodic DFTB Calculations
3.2.1. Geometry Optimization
3.2.2. Molecular Dynamics Simulations
4. Conclusions
Supplementary Materials
Author Contributions
Funding
Institutional Review Board Statement
Informed Consent Statement
Data Availability Statement
Conflicts of Interest
References
- Brog, J.-P.; Chanez, C.-L.; Crochet, A.; Fromm, K.M. Polymorphism, What It Is and How to Identify It: A Systematic Review. RSC Adv. 2013, 3, 16905. [Google Scholar] [CrossRef]
- Braga, D.; Casali, L.; Grepioni, F. The Relevance of Crystal Forms in the Pharmaceutical Field: Sword of Damocles or Innovation Tools? Int. J. Mol. Sci. 2022, 23, 9013. [Google Scholar] [CrossRef]
- Karagianni, A.; Malamatari, M.; Kachrimanis, K. Pharmaceutical Cocrystals: New Solid Phase Modification Approaches for the Formulation of APIs. Pharmaceutics 2018, 10, 18. [Google Scholar] [CrossRef]
- Chistyakov, D.; Sergeev, G. The Polymorphism of Drugs: New Approaches to the Synthesis of Nanostructured Polymorphs. Pharmaceutics 2020, 12, 34. [Google Scholar] [CrossRef] [PubMed]
- Jurczak, E.; Mazurek, A.H.; Szeleszczuk, Ł.; Pisklak, D.M.; Zielińska-Pisklak, M. Pharmaceutical Hydrates Analysis—Overview of Methods and Recent Advances. Pharmaceutics 2020, 12, 959. [Google Scholar] [CrossRef]
- Liu, H.-B.; Chen, Y.; Zhang, X.-C. Characterization of Anhydrous and Hydrated Pharmaceutical Materials with THz Time-Domain Spectroscopy. J. Pharm. Sci. 2007, 96, 927–934. [Google Scholar] [CrossRef] [PubMed]
- Tian, F.; Qu, H.; Louhi-Kultanen, M.; Rantanen, J. Insight into Crystallization Mechanisms of Polymorphic Hydrate Systems. Chem. Eng. Technol. 2010, 33, 833–838. [Google Scholar] [CrossRef]
- Seddon, K.R. Pseudopolymorph: A Polemic. Cryst. Growth Des. 2004, 4, 1087. [Google Scholar] [CrossRef]
- Bernstein, J. ...And Another Comment on Pseudopolymorphism. Cryst. Growth Des. 2005, 5, 1661–1662. [Google Scholar] [CrossRef]
- Li, S.; Wang, T.; Huang, X.; Zhou, L.; Chen, M.; Liu, W.; Zhang, X.; Dong, Y.; Hao, H. The Role of Water in the Formation of Crystal Structures: A Case Study of Valnemulin Hydrochloride. CrystEngComm 2021, 23, 47–55. [Google Scholar] [CrossRef]
- Takahashi, M.; Uekusa, H. Dehydration and Rehydration Mechanisms of Pharmaceutical Crystals: Classification of Hydrates by Activation Energy. J. Pharm. Sci. 2022, 111, 618–627. [Google Scholar] [CrossRef]
- Sathisaran, I.; Dalvi, S. Engineering Cocrystals of Poorly Water-Soluble Drugs to Enhance Dissolution in Aqueous Medium. Pharmaceutics 2018, 10, 108. [Google Scholar] [CrossRef]
- Tian, F.; Qu, H.; Zimmermann, A.; Munk, T.; Jørgensen, A.C.; Rantanen, J. Factors Affecting Crystallization of Hydrates. J. Pharm. Pharmacol. 2010, 62, 1534–1546. [Google Scholar] [CrossRef] [PubMed]
- Chakravarty, P.; Suryanarayanan, R. Characterization and Structure Analysis of Thiamine Hydrochloride Methanol Solvate. Cryst. Growth Des. 2010, 10, 4414–4420. [Google Scholar] [CrossRef]
- Larsen, A.S.; Rantanen, J.; Johansson, K.E. Computational Dehydration of Crystalline Hydrates Using Molecular Dynamics Simulations. J. Pharm. Sci. 2017, 106, 348–355. [Google Scholar] [CrossRef] [PubMed]
- Mazurek, A.H.; Szeleszczuk, Ł.; Pisklak, D.M. Periodic DFT Calculations—Review of Applications in the Pharmaceutical Sciences. Pharmaceutics 2020, 12, 415. [Google Scholar] [CrossRef] [PubMed]
- Szeleszczuk, Ł.; Pisklak, D.M.; Zielińska-Pisklak, M. Does the Choice of the Crystal Structure Influence the Results of the Periodic DFT Calculations? A Case of Glycine Alpha Polymorph GIPAW NMR Parameters Computations. J. Comput. Chem. 2018, 39, 853–861. [Google Scholar] [CrossRef]
- Czernek, J.; Pawlak, T.; Potrzebowski, M.J.; Brus, J. The Comparison of Approaches to the Solid-State NMR-Based Structural Refinement of Vitamin B1 Hydrochloride and of Its Monohydrate. Chem. Phys. Lett. 2013, 555, 135–140. [Google Scholar] [CrossRef]
- Lonsdale, D. A Review of the Biochemistry, Metabolism and Clinical Benefits of Thiamin(e) and Its Derivatives. Evid.-Based Complement. Altern. Med. 2006, 3, 49–59. [Google Scholar] [CrossRef] [PubMed]
- Schnellbaecher, A.; Binder, D.; Bellmaine, S.; Zimmer, A. Vitamins in Cell Culture Media: Stability and Stabilization Strategies. Biotechnol. Bioeng. 2019, 116, 1537–1555. [Google Scholar] [CrossRef]
- Isenberg-Grzeda, E.; Rahane, S.; DeRosa, A.P.; Ellis, J.; Nicolson, S.E. Wernicke-Korsakoff Syndrome in Patients with Cancer: A Systematic Review. Lancet Oncol. 2016, 17, e142–e148. [Google Scholar] [CrossRef] [PubMed]
- Aleshin, V.A.; Mkrtchyan, G.V.; Bunik, V.I. Mechanisms of Non-Coenzyme Action of Thiamine: Protein Targets and Medical Significance. Biochemistry 2019, 84, 829–850. [Google Scholar] [CrossRef] [PubMed]
- EEML—World Health Organization Model List of Essential Medicines—22nd List. Available online: https://list.essentialmeds.org/ (accessed on 23 May 2023).
- Chakravarty, P.; Suryanarayanan, R.; Govindarajan, R. Phase Transformation in Thiamine Hydrochloride Tablets: Influence on Tablet Microstructure, Physical Properties, and Performance. J. Pharm. Sci. 2012, 101, 1410–1422. [Google Scholar] [CrossRef] [PubMed]
- Chakravarty, P.; Govindarajan, R.; Suryanarayanan, R. Investigation of Solution and Vapor Phase Mediated Phase Transformation in Thiamine Hydrochloride. J. Pharm. Sci. 2010, 99, 3941–3952. [Google Scholar] [CrossRef]
- Zhang, G.G.Z.; Law, D.; Schmitt, E.A.; Qiu, Y. Phase Transformation Considerations during Process Development and Manufacture of Solid Oral Dosage Forms. Adv. Drug Deliv. Rev. 2004, 56, 371–390. [Google Scholar] [CrossRef]
- Chakravarty, P.; Berendt, R.T.; Munson, E.J.; Young, V.G.; Govindarajan, R.; Suryanarayanan, R. Insights into the Dehydration Behavior of Thiamine Hydrochloride (Vitamin B1) Hydrates: Part II. J. Pharm. Sci. 2010, 99, 1882–1895. [Google Scholar] [CrossRef]
- Chakravarty, P.; Berendt, R.T.; Munson, E.J.; Young, V.G.; Govindarajan, R.; Suryanarayanan, R. Insights into the Dehydration Behavior of Thiamine Hydrochloride (Vitamin B1) Hydrates: Part I. J. Pharm. Sci. 2010, 99, 816–827. [Google Scholar] [CrossRef]
- Te, R.L.; Griesser, U.J.; Morris, K.R.; Byrn, S.R.; Stowell, J.G. X-ray Diffraction and Solid-State NMR Investigation of the Single-Crystal to Single-Crystal Dehydration of Thiamine Hydrochloride Monohydrate. Cryst. Growth Des. 2003, 3, 997–1004. [Google Scholar] [CrossRef]
- Castillo-Quevedo, C.; Buelna-Garcia, C.E.; Paredes-Sotelo, E.; Robles-Chaparro, E.; Zamora-Gonzalez, E.; Martin-del-Campo-Solis, M.F.; Quiroz-Castillo, J.M.; del-Castillo-Castro, T.; Martínez-Guajardo, G.; de-Leon-Flores, A.; et al. Effects of Temperature on Enantiomerization Energy and Distribution of Isomers in the Chiral Cu13 Cluster. Molecules 2021, 26, 5710. [Google Scholar] [CrossRef]
- Li, Z.H.; Truhlar, D.G. Nanothermodynamics of Metal Nanoparticles. Chem. Sci. 2014, 5, 2605–2624. [Google Scholar] [CrossRef]
- Buelna-García, C.E.; Robles-Chaparro, E.; Parra-Arellano, T.; Quiroz-Castillo, J.M.; del-Castillo-Castro, T.; Martínez-Guajardo, G.; Castillo-Quevedo, C.; de-León-Flores, A.; Anzueto-Sánchez, G.; Martin-del-Campo-Solis, M.F.; et al. Theoretical Prediction of Structures, Vibrational Circular Dichroism, and Infrared Spectra of Chiral Be4B8 Cluster at Different Temperatures. Molecules 2021, 26, 3953. [Google Scholar] [CrossRef]
- Salomon, G.; Tarrat, N.; Schön, J.C.; Rapacioli, M. Low-Energy Transformation Pathways between Naphthalene Isomers. Molecules 2023, 28, 5778. [Google Scholar] [CrossRef]
- Szeleszczuk, Ł.; Mazurek, A.H.; Milcarz, K.; Napiórkowska, E.; Pisklak, D.M. Can We Predict the Isosymmetric Phase Transition? Application of DFT Calculations to Study the Pressure Induced Transformation of Chlorothiazide. Int. J. Mol. Sci. 2021, 22, 10100. [Google Scholar] [CrossRef] [PubMed]
- Mazurek, A.; Szeleszczuk, Ł.; Pisklak, D.M. Can We Predict the Pressure Induced Phase Transition of Urea? Application of Quantum Molecular Dynamics. Molecules 2020, 25, 1584. [Google Scholar] [CrossRef]
- Clark, S.J.; Segall, M.D.; Pickard, C.J.; Hasnip, P.J.; Probert, M.I.J.; Refson, K.; Payne, M.C. First Principles Methods Using CASTEP. Z. Kristallogr. Cryst. Mater. 2005, 220, 567–570. [Google Scholar] [CrossRef]
- Model the Biosphere|BIOVIA—Dassault Systèmes. Available online: https://www.3ds.com/products-services/biovia/ (accessed on 1 October 2023).
- Koelling, D.D.; Harmon, B.N. A Technique for Relativistic Spin-Polarised Calculations. J. Phys. C Solid State Phys. 1977, 10, 3107–3114. [Google Scholar] [CrossRef]
- Perdew, J.P.; Burke, K.; Ernzerhof, M. Generalized Gradient Approximation Made Simple. Phys. Rev. Lett. 1996, 77, 3865–3868. [Google Scholar] [CrossRef] [PubMed]
- Tkatchenko, A.; Scheffler, M. Accurate Molecular Van Der Waals Interactions from Ground-State Electron Density and Free-Atom Reference Data. Phys. Rev. Lett. 2009, 102, 073005. [Google Scholar] [CrossRef] [PubMed]
- Packwood, D.; Kermode, J.; Mones, L.; Bernstein, N.; Woolley, J.; Gould, N.; Ortner, C.; Csányi, G. A Universal Preconditioner for Simulating Condensed Phase Materials. J. Chem. Phys. 2016, 144, 164109. [Google Scholar] [CrossRef]
- Pack, J.D.; Monkhorst, H.J. “Special Points for Brillouin-Zone Integrations”—A Reply. Phys. Rev. B 1977, 16, 1748–1749. [Google Scholar] [CrossRef]
- Pickard, C.J.; Mauri, F. All-Electron Magnetic Response with Pseudopotentials: NMR Chemical Shifts. Phys. Rev. B 2001, 63, 245101. [Google Scholar] [CrossRef]
- Bremen Center for Computational Materials Science—Universität Bremen. Available online: https://www.uni-bremen.de/bccms (accessed on 23 May 2023).


| CCDC Refcode | Space Group | Z | T [K] | a [Å] | b [Å] | c [Å] | α [°] | β [°] | γ [°] | V [Å3] | Structure Description | Structure Code in This Work | Ref. |
|---|---|---|---|---|---|---|---|---|---|---|---|---|---|
| THIAMC12 | P21/n | 4 | 296 | 6.993 | 20.663 | 11.77 | 90 | 98.699 | 90 | 1681 | Thiamine hydrochloride monohydrate | EXP II MH4W | [29] |
| THIAMC14 | P21/n | 4 | 173 | 6.965 | 20.501 | 11.67 | 90 | 98.406 | 90 | 1648 | Thiamine hydrochloride monohydrate | EXP I MH4W | [27] |
| UNEXOA | P21/n | 4 | 263 | 7.099 | 19.808 | 11.638 | 90 | 101.529 | 90 | 1604 | Thiamine hydrochloride anhydrous | EXP II MH0W | [29] |
| WUWJAA | C2/c | 8 | 173 | 29.921 | 6.138 | 22.041 | 90 | 128.684 | 90 | 3160 | Thiamine hydrochloride hemihydrate | EXP I HH4W | [27] |
| Code | Water Molecules Removed | Water Molecules Left | Water: THCL Stoichiometry |
|---|---|---|---|
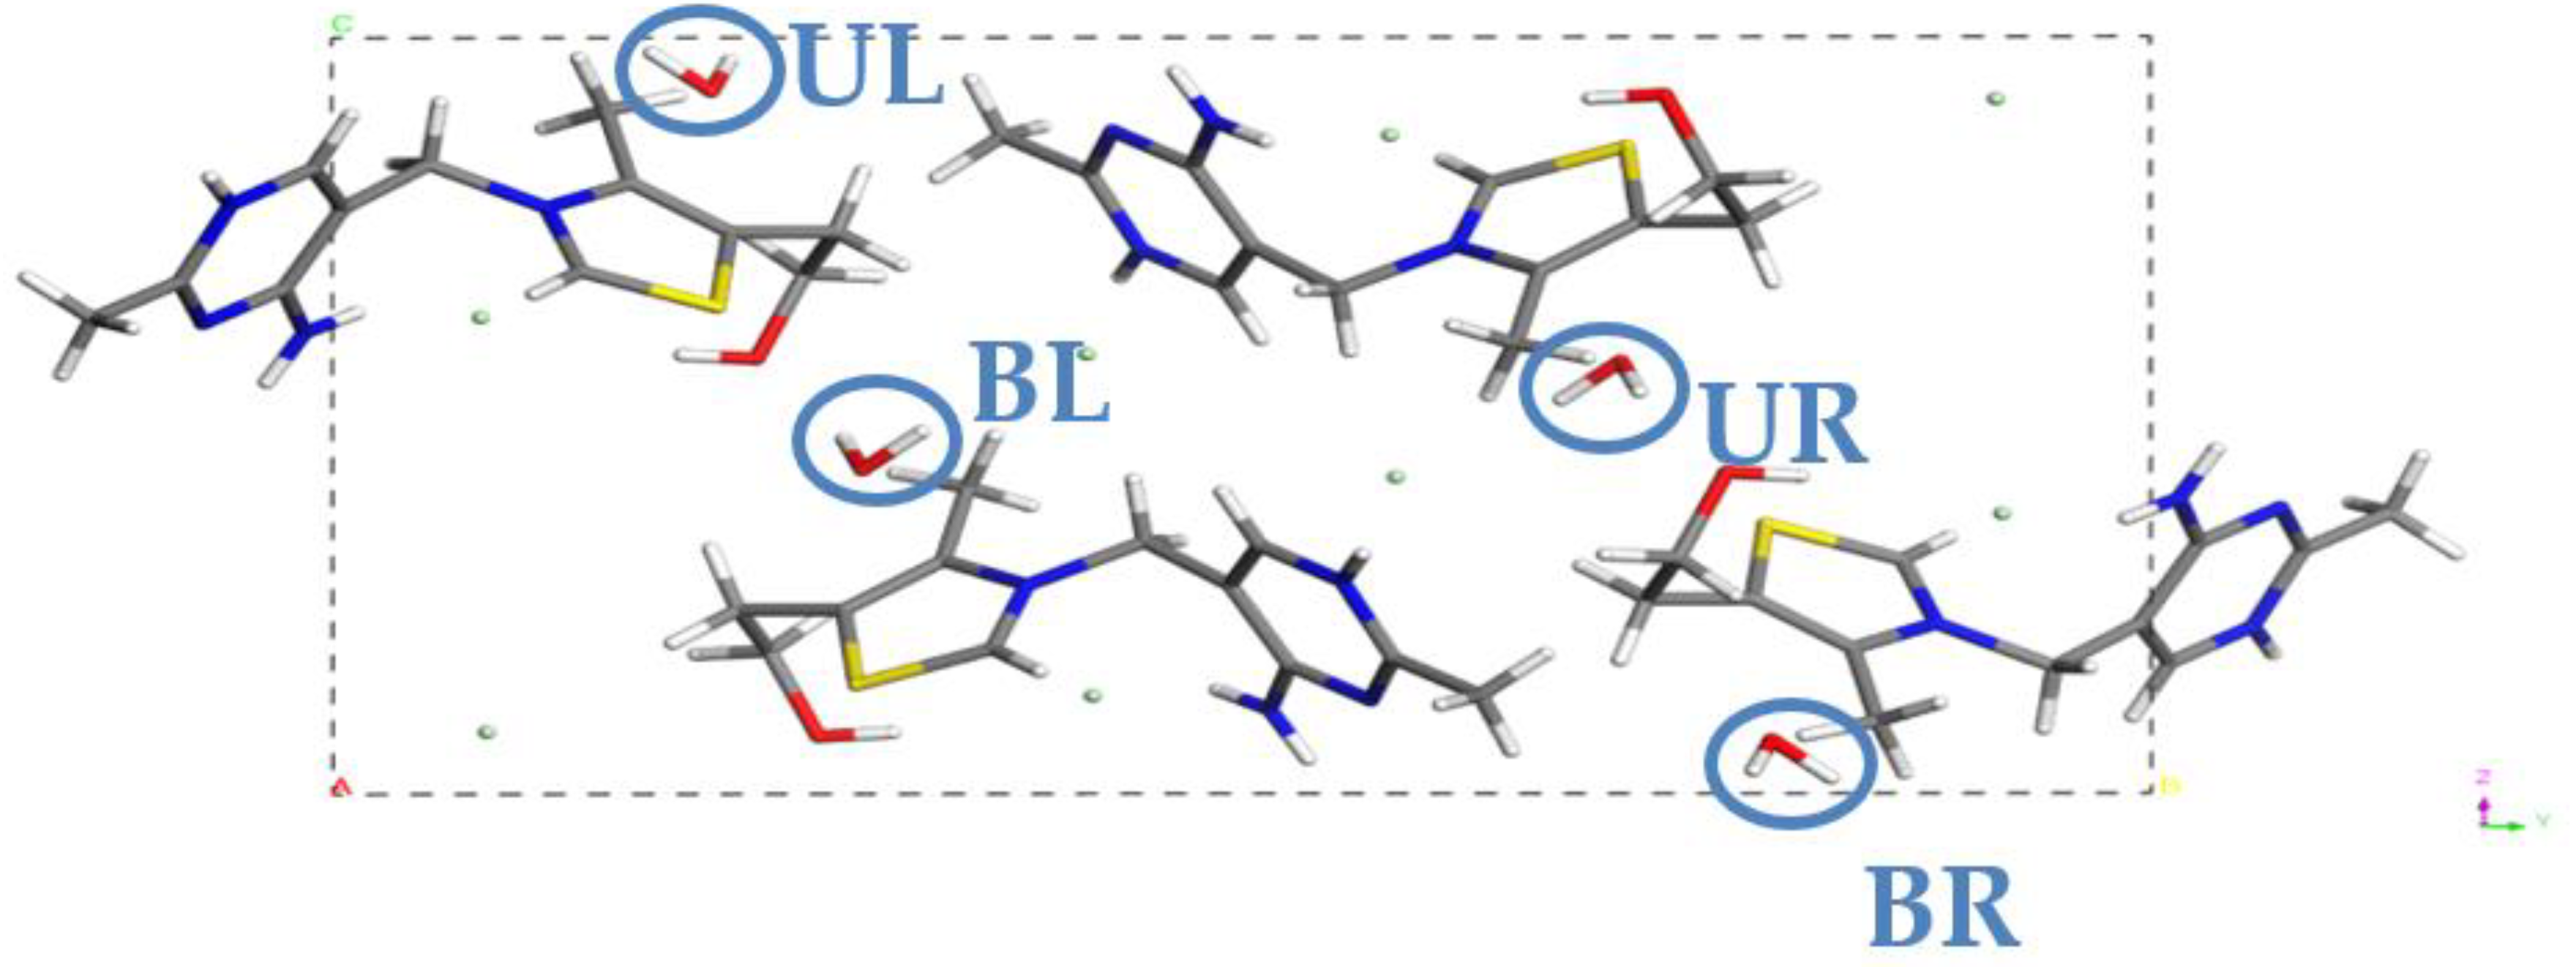
| MH4W | none | UL, BL, UR, BR | 1 |
| MH3W | UL | BL, UR, RR | 0.75 |
| MH2W BLUR | UL, BR | BL, UR | 0.5 |
| MH2W ULBL | UR, BR | UL, BL | 0.5 |
| MH2W ULUR | BL, BR | UL, UR | 0.5 |
| MH1W | BL, UR, RR | UL | 0.25 |
| MH0W | UL, BL, UR, BR | none | 0 |
| Code | Water Molecules Removed | Water Molecules Left | Water: THCL Stoichiometry |
|---|---|---|---|
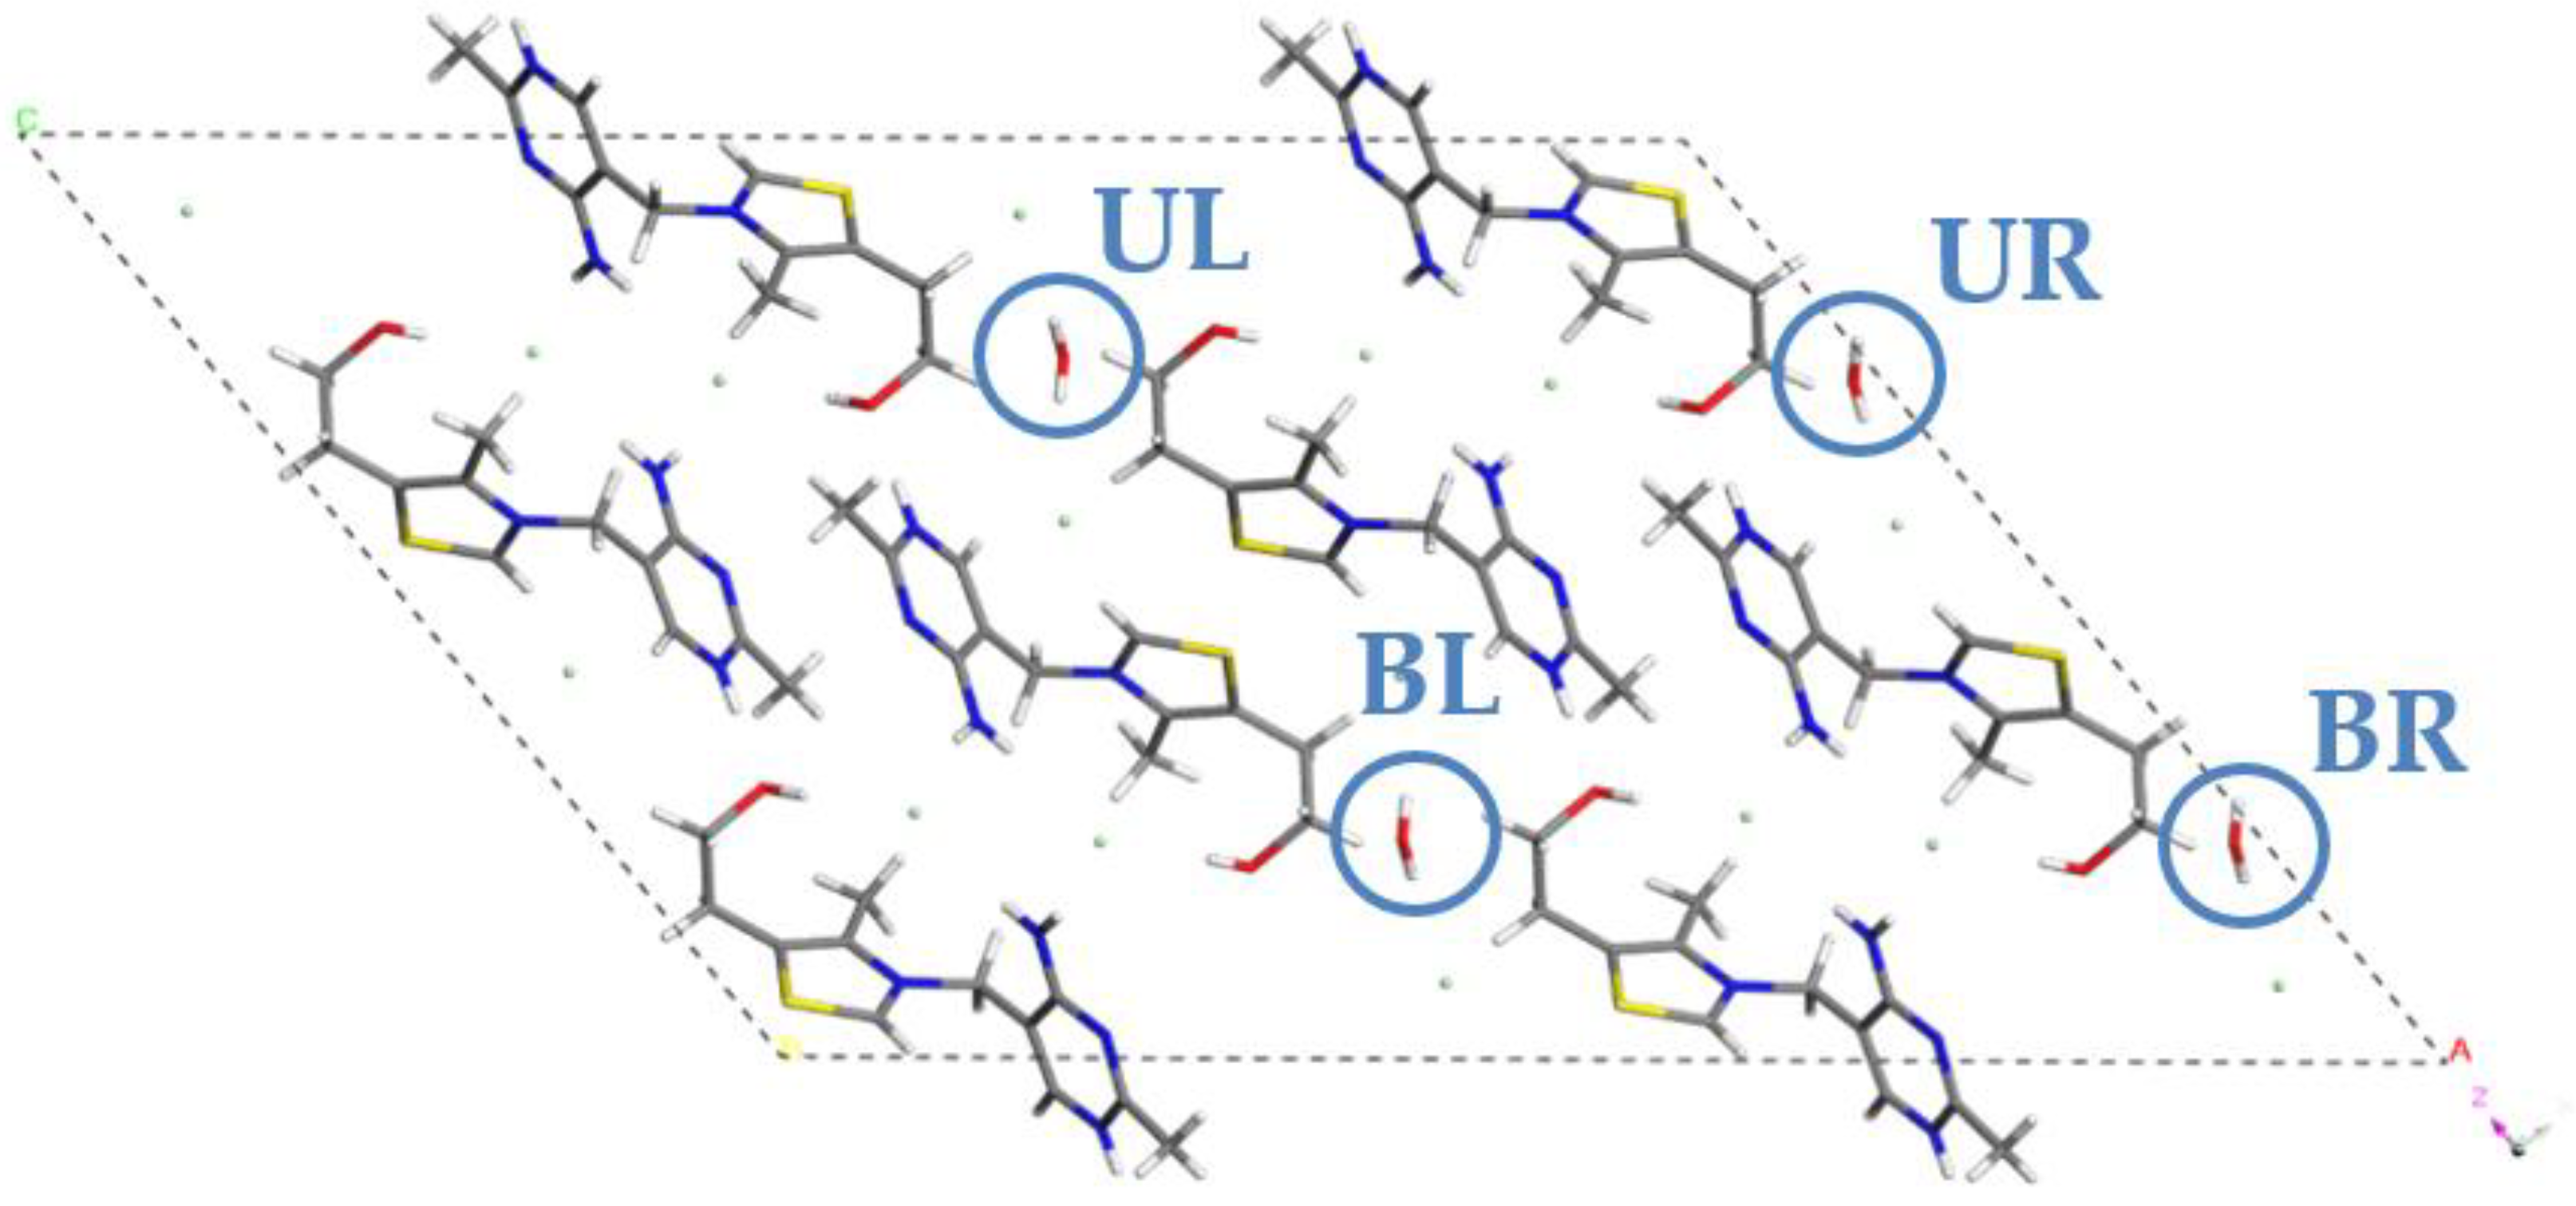
| HH4W | none | UL, BL, UR, BR | 0.5 |
| HH3W | UL | BL, UR, RR | 0.375 |
| HH2W BLUR | UL, BR | BL, UR | 0.25 |
| HH2W ULBL | UR, BR | UL, BL | 0.25 |
| HH2W ULUR | BL, BR | UL, UR | 0.25 |
| HH1W | BL, UR, RR | UL | 0.125 |
| HH0W | UL, BL, UR, BR | none | 0 |
| Code | Energy [kcal/mol] | Relative Energy [kcal/mol] | a [Å] | b [Å] | c [Å] | α [°] | β [°] | γ [°] | V [Å3] |
|---|---|---|---|---|---|---|---|---|---|
| MH4W | −499,908.604 | −43,190.805 | 7.022 | 20.598 | 11.500 | 89.998 | 98.368 | 90.012 | 1645.507 |
| MH3W | −489,110.139 | −32,392.340 | 7.031 | 20.478 | 11.477 | 90.031 | 99.148 | 90.647 | 1631.380 |
| MH2W BLUR | −478,312.186 | −21,594.387 | 7.034 | 20.365 | 11.462 | 89.858 | 100.184 | 91.472 | 1615.564 |
| MH2W ULBL | −478,312.416 | −21,594.617 | 7.021 | 20.364 | 11.449 | 90.003 | 99.778 | 90.006 | 1613.213 |
| MH2W ULUR | −478,311.772 | −21,593.973 | 7.031 | 20.337 | 11.424 | 90.004 | 99.974 | 89.984 | 1608.722 |
| MH1W | −467,514.597 | −10,796.798 | 7.030 | 20.225 | 11.423 | 89.945 | 100.793 | 90.740 | 1595.441 |
| MH0W | −456,717.799 | 0 | 7.022 | 20.064 | 11.482 | 90.004 | 101.714 | 90.002 | 1584.016 |
| EXPII MH4W | - | 6.993 | 20.663 | 11.770 | 90.000 | 98.699 | 90.000 | 1681.047 | |
| EXPII MH0W | - | 7.099 | 19.808 | 11.638 | 90.000 | 101.529 | 90.000 | 1603.545 | |
| EXPI MH4W | - | 6.965 | 20.501 | 11.670 | 90.000 | 98.406 | 90.000 | 1648.428 |
| Code | Energy [kcal/mol] | Relative Energy [kcal/mol] | a [Å] | b [Å] | c [Å] | α [°] | β [°] | γ [°] | V [Å3] |
|---|---|---|---|---|---|---|---|---|---|
| HH4W | −956,630.306 | −43,198.085 | 29.798 | 6.083 | 22.141 | 90.089 | 127.855 | 89.930 | 3168.616 |
| HH3W | −945,830.348 | −32,398.127 | 29.761 | 6.046 | 22.150 | 90.030 | 127.541 | 89.978 | 3160.184 |
| HH2W BLUR | −935,030.608 | −21,598.387 | 29.734 | 6.009 | 22.160 | 90.005 | 127.260 | 89.995 | 3151.170 |
| HH2W ULBL | −935,030.916 | −21,598.695 | 29.726 | 6.003 | 22.162 | 90.105 | 127.230 | 89.915 | 3148.795 |
| HH2W ULUR | −935,030.539 | −21,598.318 | 29.730 | 6.012 | 22.161 | 89.996 | 127.289 | 90.001 | 3151.079 |
| HH1W | −924,231.287 | −10,799.066 | 29.686 | 5.966 | 22.167 | 89.961 | 126.924 | 90.031 | 3138.81 |
| HH0W | −913,432.221 | 0 | 29.618 | 5.922 | 22.164 | 90.000 | 126.522 | 90.000 | 3124.258 |
| EXP HH4W | - | 29.921 | 6.138 | 22.041 | 90.000 | 128.684 | 90.000 | 3160.049 |
| Code | Energy [kcal/mol] | Code | Energy [kcal/mol] | Δ(HH-MH) [kcal/mol] |
|---|---|---|---|---|
| THCL: water ratio 2:1 | ||||
| HH4W | −478,315.153 | MH2W BLUR | −478,312.186 | −2.967 |
| MH2W ULBL | −478,312.416 | −2.737 | ||
| MH2W ULUR | −478,311.772 | −3.381 | ||
| THCL: water ratio 4:1 | ||||
| HH2W BLUR | −467,515.304 | MH1W | −467,514.597 | −0.707 |
| HH2W ULBL | −467,515.458 | −0.861 | ||
| HH2W ULUR | −467,515.270 | −0.672 | ||
| Anhydrous structures | ||||
| HH0W | −456,716.111 | MH0W | −456,717.799 | 1.688 |
| Step | Number of Water Molecules | HH [kcal/mol] | MH [kcal/mol] | Δ(HH-MH) [kcal/mol] |
|---|---|---|---|---|
| 1 | 4 W → 3 W | 18.848 | 17.356 | 1.492 |
| 2 | 3 W → 2 W | 18.322 | 16.613 | 1.709 |
| 3 | 2 W → 1 W | 18.520 | 16.709 | 1.811 |
| 4 | 1 W → 0 W | 17.956 | 15.688 | 2.268 |
| Structure Code | C8 | C9 | C1 | C11 | C2 | C3 | ||||||||||||||||||||||||
|---|---|---|---|---|---|---|---|---|---|---|---|---|---|---|---|---|---|---|---|---|---|---|---|---|---|---|---|---|---|---|
| SD | 1 [ppm] | 2 [ppm] | 3 [ppm] | 4 [ppm] | SD | 1 [ppm] | 2 [ppm] | 3 [ppm] | 4 [ppm] | SD | 1 [ppm] | 2 [ppm] | 3 [ppm] | 4 [ppm] | SD | 1 [ppm] | 2 [ppm] | 3 [ppm] | 4 [ppm] | SD | 1 [ppm] | 2 [ppm] | 3 [ppm] | 4 [ppm] | SD | 1 [ppm] | 2 [ppm] | 3 [ppm] | 4 [ppm] | |
| MH4W | 0.01 | 163.92 | 163.95 | 163.94 | 163.95 | 0.02 | 160.45 | 160.43 | 160.46 | 160.41 | 0.01 | 149.78 | 149.79 | 149.76 | 149.78 | 0.01 | 148.00 | 148.00 | 148.02 | 148.00 | 0.02 | 147.21 | 147.19 | 147.22 | 147.18 | 0.02 | 140.73 | 140.77 | 140.74 | 140.79 |
| MH3W | 0.83 | 162.54 | 163.93 | 163.91 | 164.87 | 0.12 | 160.57 | 160.42 | 160.50 | 160.26 | 0.43 | 149.40 | 148.45 | 149.23 | 149.56 | 0.23 | 147.99 | 148.35 | 148.30 | 147.79 | 0.79 | 147.23 | 148.65 | 146.52 | 147.02 | 1.24 | 140.93 | 139.83 | 143.26 | 141.22 |
| MH2W BLUR | 1.28 | 162.52 | 165.07 | 162.54 | 165.09 | 0.22 | 160.75 | 160.30 | 160.74 | 160.30 | 0.35 | 149.05 | 148.33 | 149.04 | 148.36 | 0.12 | 148.26 | 148.02 | 148.25 | 148.02 | 0.95 | 146.61 | 148.52 | 146.59 | 148.49 | 1.75 | 143.61 | 140.10 | 143.60 | 140.11 |
| MH2W ULBL | 0.27 | 163.94 | 163.40 | 163.40 | 163.94 | 0.02 | 160.51 | 160.47 | 160.47 | 160.51 | 0.56 | 148.35 | 149.46 | 149.47 | 148.33 | 0.27 | 148.44 | 147.91 | 147.90 | 148.45 | 0.32 | 147.70 | 147.09 | 147.05 | 147.72 | 0.53 | 142.59 | 141.44 | 141.52 | 142.50 |
| MH2W ULUR | 1.21 | 164.89 | 164.88 | 162.46 | 162.46 | 0.14 | 160.31 | 160.32 | 160.59 | 160.59 | 0.59 | 149.11 | 149.15 | 147.93 | 147.96 | 0.10 | 147.96 | 147.97 | 148.18 | 148.16 | 1.16 | 146.38 | 146.33 | 148.68 | 148.67 | 1.96 | 143.77 | 143.78 | 139.87 | 139.84 |
| MH1W | 0.96 | 162.39 | 163.48 | 163.49 | 165.07 | 0.17 | 160.78 | 160.45 | 160.59 | 160.31 | 0.41 | 147.95 | 148.15 | 149.04 | 148.28 | 0.10 | 148.33 | 148.07 | 148.10 | 148.11 | 0.75 | 147.72 | 148.54 | 146.43 | 147.71 | 1.49 | 142.84 | 140.04 | 144.15 | 142.71 |
| MH0W | 0.01 | 162.68 | 162.68 | 162.69 | 162.67 | 0.01 | 160.96 | 160.94 | 160.95 | 160.95 | 0.01 | 148.41 | 148.41 | 148.38 | 148.42 | 0.00 | 148.27 | 148.27 | 148.28 | 148.27 | 0.01 | 148.29 | 148.28 | 148.28 | 148.27 | 0.01 | 143.28 | 143.27 | 143.26 | 143.28 |
| EXPII MH4W | 0.00 | 163.50 | 163.50 | 163.50 | 163.50 | 0.00 | 163.50 | 163.50 | 163.50 | 163.50 | 0.00 | 153.20 | 153.20 | 153.20 | 153.20 | 0.00 | 147.70 | 147.70 | 147.70 | 147.70 | 0.00 | 145.50 | 145.50 | 145.50 | 145.50 | 0.00 | 134.50 | 134.50 | 134.50 | 134.50 |
| EXPII MH0W | 0.00 | 163.20 | 163.20 | 163.20 | 163.20 | 0.00 | 163.20 | 163.20 | 163.20 | 163.20 | 0.00 | 153.10 | 153.10 | 153.10 | 153.10 | 0.00 | 148.00 | 148.00 | 148.00 | 148.00 | 0.00 | 145.50 | 145.50 | 145.50 | 145.50 | 0.00 | 136.40 | 136.40 | 136.40 | 136.40 |
| EXPI 0.90H2O | 0.00 | 163.20 | 163.20 | 163.20 | 163.20 | 0.00 | 163.20 | 163.20 | 163.20 | 163.20 | 0.00 | 153.10 | 153.10 | 153.10 | 153.10 | 0.00 | 147.70 | 147.70 | 147.70 | 147.70 | 0.00 | 145.20 | 145.20 | 145.20 | 145.20 | 0.00 | 134.50 | 134.50 | 134.50 | 134.50 |
| EXPI 0.41H2O | 0.00 | 163.00 | 163.00 | 163.00 | 163.00 | 0.00 | 163.00 | 163.00 | 163.00 | 163.00 | 0.00 | 153.00 | 153.00 | 153.00 | 153.00 | 0.00 | 147.70 | 147.70 | 147.70 | 147.70 | 0.00 | 145.20 | 145.20 | 145.20 | 145.20 | 0.00 | 135.20 | 135.20 | 135.20 | 135.20 |
| EXPI 0.04H2O | 0.00 | 163.00 | 163.00 | 163.00 | 163.00 | 0.00 | 163.00 | 163.00 | 163.00 | 163.00 | 0.00 | 153.00 | 153.00 | 153.00 | 153.00 | 0.00 | 147.70 | 147.70 | 147.70 | 147.70 | 0.00 | 145.20 | 145.20 | 145.20 | 145.20 | 0.00 | 136.50 | 136.50 | 136.50 | 136.50 |
| MH0W-MH4W | −1.24 | −1.27 | −1.25 | −1.28 | 0.51 | 0.51 | 0.49 | 0.54 | −1.37 | −1.38 | −1.38 | −1.36 | 0.27 | 0.27 | 0.26 | 0.27 | 1.08 | 1.09 | 1.06 | 1.09 | 2.55 | 2.50 | 2.52 | 2.49 | ||||||
| EXPII MH0W-EXPII MH4W | −0.30 | −0.30 | −0.30 | −0.30 | −0.30 | −0.30 | −0.30 | −0.30 | −0.10 | −0.10 | −0.10 | −0.10 | 0.30 | 0.30 | 0.30 | 0.30 | 0.00 | 0.00 | 0.00 | 0.00 | 1.90 | 1.90 | 1.90 | 1.90 | ||||||
| Structure Code | C10 | C6 | C7 | C5 | C12 | C4 | ||||||||||||||||||||||||
| SD | 1 [ppm] | 2 [ppm] | 3 [ppm] | 4 [ppm] | SD | 1 [ppm] | 2 [ppm] | 3 [ppm] | 4 [ppm] | SD | 1 [ppm] | 2 [ppm] | 3 [ppm] | 4 [ppm] | SD | 1 [ppm] | 2 [ppm] | 3 [ppm] | 4 [ppm] | SD | 1 [ppm] | 2 [ppm] | 3 [ppm] | 4 [ppm] | SD | 1 [ppm] | 2 [ppm] | 3 [ppm] | 4 [ppm] | |
| MH4W | 0.01 | 109.25 | 109.27 | 109.25 | 109.26 | 0.00 | 62.26 | 62.26 | 62.26 | 62.25 | 0.01 | 51.47 | 51.50 | 51.48 | 51.47 | 0.01 | 26.58 | 26.60 | 26.59 | 26.58 | 0.02 | 19.42 | 19.47 | 19.45 | 19.45 | 0.01 | 12.47 | 12.47 | 12.45 | 12.48 |
| MH3W | 0.45 | 109.96 | 108.94 | 108.83 | 109.07 | 0.21 | 62.27 | 62.13 | 61.8 | 62.35 | 0.44 | 51.22 | 52.23 | 52.11 | 51.40 | 0.33 | 26.62 | 27.43 | 27.26 | 26.79 | 0.49 | 20.50 | 19.57 | 19.16 | 19.57 | 0.62 | 12.12 | 13.60 | 12.33 | 12.08 |
| MH2W BLUR | 0.51 | 109.68 | 108.65 | 109.66 | 108.64 | 0.31 | 61.76 | 62.37 | 61.75 | 62.37 | 0.15 | 51.98 | 52.27 | 51.99 | 52.28 | 0.22 | 27.32 | 27.74 | 27.31 | 27.78 | 0.19 | 20.25 | 19.83 | 20.18 | 19.83 | 0.67 | 12.00 | 13.40 | 12.03 | 13.32 |
| MH2W ULBL | 0.59 | 108.68 | 109.86 | 109.85 | 108.68 | 0.29 | 61.85 | 62.44 | 62.43 | 61.87 | 0.80 | 52.91 | 51.30 | 51.30 | 52.87 | 0.47 | 27.88 | 26.94 | 26.95 | 27.87 | 0.55 | 19.43 | 20.52 | 20.53 | 19.43 | 0.95 | 13.69 | 11.84 | 11.81 | 13.74 |
| MH2W ULUR | 0.61 | 108.55 | 108.54 | 109.77 | 109.75 | 0.21 | 61.83 | 61.82 | 62.23 | 62.25 | 0.02 | 51.99 | 51.98 | 52.03 | 52.00 | 0.05 | 27.30 | 27.34 | 27.42 | 27.42 | 0.67 | 19.46 | 19.42 | 20.79 | 20.75 | 0.65 | 12.10 | 12.10 | 13.40 | 13.41 |
| MH1W | 0.50 | 109.40 | 109.32 | 109.30 | 108.20 | 0.23 | 61.79 | 62.41 | 61.91 | 62.01 | 0.37 | 52.78 | 52.10 | 51.96 | 52.75 | 0.22 | 27.88 | 27.90 | 27.44 | 28.03 | 0.43 | 20.52 | 20.75 | 20.39 | 19.60 | 0.76 | 13.42 | 13.06 | 11.73 | 13.72 |
| MH0W | 0.01 | 108.47 | 108.45 | 108.47 | 108.46 | 0.01 | 64.09 | 64.1 | 64.09 | 64.11 | 0.00 | 52.86 | 52.86 | 52.86 | 52.86 | 0.01 | 27.96 | 27.95 | 27.95 | 27.97 | 0.01 | 21.03 | 21.04 | 21.04 | 21.02 | 0.02 | 13.20 | 13.24 | 13.21 | 13.23 |
| EXPII MH4W | 0.00 | 107.70 | 107.70 | 107.70 | 107.70 | 0.00 | 59.90 | 59.90 | 59.90 | 59.90 | 0.00 | 52.40 | 52.40 | 52.40 | 52.40 | 0.00 | 28.30 | 28.30 | 28.30 | 28.30 | 0.00 | 22.60 | 22.60 | 22.60 | 22.60 | 0.00 | 14.60 | 14.60 | 14.60 | 14.60 |
| EXPII MH0W | 0.00 | 107.10 | 107.10 | 107.10 | 107.10 | 0.00 | 62.40 | 62.40 | 62.40 | 62.40 | 0.00 | 52.60 | 52.60 | 52.60 | 52.60 | 0.00 | 30.10 | 30.10 | 30.10 | 30.10 | 0.00 | 23.10 | 23.10 | 23.10 | 23.10 | 0.00 | 15.60 | 15.60 | 15.60 | 15.60 |
| EXPI 0.90H2O | 0.00 | 107.80 | 107.80 | 107.80 | 107.80 | 0.00 | 60.00 | 60.00 | 60.00 | 60.00 | 0.00 | 52.50 | 52.50 | 52.50 | 52.50 | 0.00 | 28.70 | 28.70 | 28.70 | 28.70 | 0.00 | 22.50 | 22.50 | 22.50 | 22.50 | 0.00 | 14.70 | 14.70 | 14.70 | 14.70 |
| EXPI 0.41H2O | 0.00 | 107.50 | 107.50 | 107.50 | 107.50 | 0.00 | 60.80 | 60.80 | 60.80 | 60.80 | 0.00 | 52.60 | 52.60 | 52.60 | 52.60 | 0.00 | 29.50 | 29.50 | 29.50 | 29.50 | 0.00 | 22.60 | 22.60 | 22.60 | 22.60 | 0.00 | 15.30 | 15.30 | 15.30 | 15.30 |
| EXPI 0.04H2O | 0.00 | 107.00 | 107.00 | 107.00 | 107.00 | 0.00 | 62.60 | 62.60 | 62.60 | 62.60 | 0.00 | 52.70 | 52.70 | 52.70 | 52.70 | 0.00 | 30.40 | 30.40 | 30.40 | 30.40 | 0.00 | 23.00 | 23.00 | 23.00 | 23.00 | 0.00 | 15.70 | 15.70 | 15.70 | 15.70 |
| MH0W-MH4W | −0.78 | −0.82 | −0.78 | −0.80 | 1.83 | 1.84 | 1.83 | 1.86 | 1.39 | 1.36 | 1.38 | 1.39 | 1.38 | 1.35 | 1.36 | 1.39 | 1.61 | 1.57 | 1.59 | 1.57 | 0.73 | 0.77 | 0.76 | 0.75 | ||||||
| EXPII MH0W-EXPII MH4W | −0.60 | −0.60 | −0.60 | −0.60 | 2.50 | 2.50 | 2.50 | 2.50 | 0.20 | 0.20 | 0.20 | 0.20 | 1.80 | 1.80 | 1.80 | 1.80 | 0.50 | 0.50 | 0.50 | 0.50 | 1.00 | 1.00 | 1.00 | 1.00 | ||||||
| Structure Code | C8 | C9 | C1 | ||||||||||||||||||||||||
|---|---|---|---|---|---|---|---|---|---|---|---|---|---|---|---|---|---|---|---|---|---|---|---|---|---|---|---|
| SD | 1 [ppm] | 2 [ppm] | 3 [ppm] | 4 [ppm] | 5 [ppm] | 6 [ppm] | 7 [ppm] | 8 [ppm] | SD | 1 [ppm] | 2 [ppm] | 3 [ppm] | 4 [ppm] | 5 [ppm] | 6 [ppm] | 7 [ppm] | 8 [ppm] | SD | 1 [ppm] | 2 [ppm] | 3 [ppm] | 4 [ppm] | 5 [ppm] | 6 [ppm] | 7 [ppm] | 8 [ppm] | |
| HH4W | 0.04 | 164.49 | 164.39 | 164.42 | 164.50 | 164.45 | 164.44 | 164.41 | 164.47 | 0.03 | 164.73 | 164.65 | 164.66 | 164.72 | 164.69 | 164.66 | 164.71 | 164.73 | 0.06 | 155.6 | 155.57 | 155.73 | 155.72 | 155.65 | 155.67 | 155.72 | 155.6 |
| HH3W | 0.17 | 164.66 | 164.49 | 164.64 | 164.57 | 164.31 | 164.24 | 164.29 | 164.26 | 0.05 | 164.74 | 164.71 | 164.71 | 164.75 | 164.71 | 164.59 | 164.72 | 164.74 | 0.44 | 155.81 | 155.63 | 155.85 | 155.73 | 155.75 | 156.77 | 155.73 | 156.81 |
| HH2W ULBL | 0.07 | 164.37 | 164.44 | 164.30 | 164.48 | 164.35 | 164.40 | 164.29 | 164.46 | 0.09 | 164.59 | 164.67 | 164.54 | 164.76 | 164.56 | 164.66 | 164.53 | 164.59 | 0.45 | 156.66 | 155.75 | 156.77 | 155.88 | 156.67 | 155.76 | 156.76 | 156.66 |
| HH2W BLUR | 0.04 | 164.43 | 164.30 | 164.41 | 164.36 | 164.35 | 164.41 | 164.36 | 164.43 | 0.04 | 164.65 | 164.69 | 164.61 | 164.71 | 164.71 | 164.6 | 164.7 | 164.65 | 0.52 | 156.81 | 155.77 | 156.86 | 155.81 | 155.8 | 156.86 | 155.78 | 156.81 |
| HH2W ULUR | 0.30 | 164.12 | 163.97 | 164.00 | 164.09 | 164.62 | 164.64 | 164.64 | 164.63 | 0.06 | 164.62 | 164.54 | 164.54 | 164.63 | 164.69 | 164.64 | 164.64 | 164.62 | 0.46 | 156.76 | 156.67 | 156.71 | 156.7 | 155.82 | 155.75 | 155.75 | 156.76 |
| HH1W | 0.16 | 164.23 | 164.05 | 164.15 | 164.11 | 164.45 | 164.45 | 164.43 | 164.43 | 0.07 | 164.58 | 164.49 | 164.52 | 164.51 | 164.68 | 164.47 | 164.63 | 164.58 | 0.42 | 156.81 | 156.72 | 156.74 | 156.7 | 155.87 | 156.84 | 155.75 | 156.81 |
| HH0W | 0.01 | 164.29 | 164.31 | 164.30 | 164.30 | 164.30 | 164.28 | 164.30 | 164.29 | 0.01 | 164.52 | 164.52 | 164.52 | 164.51 | 164.51 | 164.51 | 164.51 | 164.52 | 0.02 | 156.79 | 156.81 | 156.75 | 156.81 | 156.78 | 156.8 | 156.77 | 156.79 |
| EXP HH4W | 0.00 | 164.50 | 164.50 | 164.50 | 164.50 | 164.50 | 164.50 | 164.50 | 164.50 | 0.00 | 164.50 | 164.50 | 164.50 | 164.50 | 164.50 | 164.50 | 164.50 | 164.50 | 0.00 | 155.50 | 155.50 | 155.50 | 155.50 | 155.50 | 155.50 | 155.50 | 155.50 |
| HH0W-HH4W | −0.20 | −0.08 | −0.12 | −0.20 | −0.15 | −0.16 | −0.11 | −0.18 | −0.21 | −0.13 | −0.14 | −0.21 | −0.18 | −0.15 | −0.20 | −0.24 | 1.19 | 1.24 | 1.02 | 1.09 | 1.13 | 1.13 | 1.05 | 1.07 | |||
| Structure Code | C11 | C2 | C3 | ||||||||||||||||||||||||
| SD | 1 [ppm] | 2 [ppm] | 3 [ppm] | 4 [ppm] | 5 [ppm] | 6 [ppm] | 7 [ppm] | 8 [ppm] | SD | 1 [ppm] | 2 [ppm] | 3 [ppm] | 4 [ppm] | 5 [ppm] | 6 [ppm] | 7 [ppm] | 8 [ppm] | SD | 1 [ppm] | 2 [ppm] | 3 [ppm] | 4 [ppm] | 5 [ppm] | 6 [ppm] | 7 [ppm] | 8 [ppm] | |
| HH4W | 0.02 | 148.87 | 148.85 | 148.88 | 148.92 | 148.90 | 148.87 | 148.89 | 148.91 | 0.06 | 147.45 | 147.37 | 147.35 | 147.43 | 147.33 | 147.33 | 147.47 | 147.48 | 0.25 | 140.16 | 140.62 | 140.56 | 140.12 | 140.62 | 140.62 | 140.06 | 140.16 |
| HH3W | 0.18 | 149.04 | 149.17 | 149.04 | 149.21 | 148.93 | 148.68 | 148.91 | 148.72 | 0.10 | 147.37 | 147.53 | 147.28 | 147.48 | 147.44 | 147.24 | 147.51 | 147.34 | 0.37 | 140.43 | 139.68 | 140.73 | 139.68 | 140.6 | 140.51 | 140.19 | 140.43 |
| HH2W ULBL | 0.02 | 149.05 | 149.04 | 149.05 | 149.08 | 149.04 | 149.05 | 149.03 | 149.08 | 0.03 | 147.34 | 147.36 | 147.39 | 147.40 | 147.38 | 147.32 | 147.38 | 147.42 | 0.50 | 139.67 | 140.83 | 139.6 | 140.36 | 139.66 | 140.81 | 139.63 | 139.67 |
| HH2W BLUR | 0.19 | 148.84 | 149.23 | 148.87 | 149.23 | 149.24 | 148.83 | 149.21 | 148.87 | 0.19 | 147.23 | 147.58 | 147.13 | 147.56 | 147.55 | 147.18 | 147.60 | 147.24 | 0.48 | 140.42 | 139.64 | 140.75 | 139.62 | 139.66 | 140.71 | 139.59 | 140.42 |
| HH2W ULUR | 0.29 | 148.74 | 148.68 | 148.72 | 148.69 | 149.31 | 149.26 | 149.28 | 149.30 | 0.06 | 147.31 | 147.27 | 147.26 | 147.32 | 147.40 | 147.40 | 147.43 | 147.38 | 0.33 | 140.13 | 140.6 | 140.55 | 140.16 | 139.81 | 139.77 | 139.79 | 140.13 |
| HH1W | 0.18 | 148.86 | 149.04 | 148.83 | 149.07 | 149.36 | 149.18 | 149.32 | 149.22 | 0.10 | 147.26 | 147.43 | 147.19 | 147.42 | 147.47 | 147.28 | 147.49 | 147.32 | 0.38 | 140.32 | 139.56 | 140.72 | 139.6 | 139.79 | 139.72 | 139.8 | 140.32 |
| HH0W | 0.01 | 149.29 | 149.31 | 149.32 | 149.30 | 149.29 | 149.30 | 149.30 | 149.31 | 0.01 | 147.38 | 147.39 | 147.41 | 147.39 | 147.39 | 147.39 | 147.40 | 147.41 | 0.01 | 139.81 | 139.77 | 139.8 | 139.79 | 139.81 | 139.8 | 139.81 | 139.81 |
| EXP HH4W | 0.00 | 148.00 | 148.00 | 148.00 | 148.00 | 148.00 | 148.00 | 148.00 | 148.00 | 0.00 | 146.00 | 146.00 | 146.00 | 146.00 | 146.00 | 146.00 | 146.00 | 146.00 | 0.00 | 140.00 | 140.00 | 140.00 | 140.00 | 140.00 | 140.00 | 140.00 | 140.00 |
| HH0W-HH4W | 0.42 | 0.46 | 0.44 | 0.38 | 0.39 | 0.43 | 0.41 | 0.40 | −0.07 | 0.02 | 0.06 | −0.04 | 0.06 | 0.06 | −0.07 | −0.07 | −0.35 | −0.85 | −0.76 | −0.33 | −0.81 | −0.82 | −0.25 | −0.28 | |||
| Structure Code | C10 | C6 | C7 | ||||||||||||||||||||||||
| SD | 1 [ppm] | 2 [ppm] | 3 [ppm] | 4 [ppm] | 5 [ppm] | 6 [ppm] | 7 [ppm] | 8 [ppm] | SD | 1 [ppm] | 2 [ppm] | 3 [ppm] | 4 [ppm] | 5 [ppm] | 6 [ppm] | 7 [ppm] | 8 [ppm] | SD | 1 [ppm] | 2 [ppm] | 3 [ppm] | 4 [ppm] | 5 [ppm] | 6 [ppm] | 7 [ppm] | 8 [ppm] | |
| HH4W | 0.03 | 108.17 | 108.20 | 108.15 | 108.09 | 108.14 | 108.16 | 108.18 | 108.14 | 0.21 | 67.67 | 68.07 | 68.05 | 67.66 | 68.07 | 68.10 | 67.65 | 67.63 | 0.03 | 50.24 | 50.31 | 50.31 | 50.22 | 50.26 | 50.28 | 50.29 | 50.28 |
| HH3W | 0.22 | 108.15 | 108.16 | 108.12 | 108.09 | 108.24 | 108.68 | 108.29 | 108.67 | 0.22 | 67.82 | 67.48 | 68.15 | 67.54 | 68.00 | 67.97 | 67.64 | 67.75 | 0.06 | 50.11 | 50.17 | 50.17 | 50.15 | 50.25 | 50.07 | 50.26 | 50.13 |
| HH2W ULBL | 0.18 | 108.52 | 108.22 | 108.55 | 108.17 | 108.51 | 108.20 | 108.57 | 108.13 | 0.30 | 67.39 | 68.10 | 67.33 | 67.69 | 67.40 | 68.10 | 67.33 | 67.69 | 0.06 | 49.98 | 50.13 | 50.04 | 50.07 | 49.96 | 50.11 | 50.00 | 50.07 |
| HH2W BLUR | 0.23 | 108.61 | 108.18 | 108.62 | 108.13 | 108.14 | 108.65 | 108.21 | 108.63 | 0.25 | 67.73 | 67.42 | 68.04 | 67.45 | 67.49 | 68.01 | 67.39 | 67.78 | 0.09 | 49.95 | 50.16 | 49.98 | 50.11 | 50.11 | 49.96 | 50.14 | 49.96 |
| HH2W ULUR | 0.34 | 108.67 | 108.71 | 108.69 | 108.67 | 107.98 | 108.02 | 108.01 | 107.99 | 0.16 | 67.55 | 67.89 | 67.90 | 67.51 | 67.59 | 67.47 | 67.48 | 67.56 | 0.04 | 50.03 | 50.06 | 50.08 | 50.00 | 49.99 | 49.98 | 49.98 | 49.99 |
| HH1W | 0.22 | 108.59 | 108.58 | 108.59 | 108.54 | 108.04 | 108.39 | 108.05 | 108.40 | 0.20 | 67.58 | 67.24 | 67.92 | 67.27 | 67.48 | 67.39 | 67.40 | 67.43 | 0.04 | 49.87 | 49.93 | 49.88 | 49.91 | 49.94 | 49.82 | 49.94 | 49.83 |
| HH0W | 0.01 | 108.47 | 108.48 | 108.47 | 108.47 | 108.48 | 108.49 | 108.48 | 108.49 | 0.01 | 67.35 | 67.35 | 67.34 | 67.36 | 67.35 | 67.35 | 67.32 | 67.36 | 0.01 | 49.82 | 49.83 | 49.82 | 49.81 | 49.81 | 49.83 | 49.81 | 49.82 |
| EXP HH4W | 0.00 | 107.00 | 107.00 | 107.00 | 107.00 | 107.00 | 107.00 | 107.00 | 107.00 | 0.00 | 65.50 | 65.50 | 65.50 | 65.50 | 65.50 | 65.50 | 65.50 | 65.50 | 0.00 | 52.00 | 52.00 | 52.00 | 52.00 | 52.00 | 52.00 | 52.00 | 52.00 |
| HH0W-HH4W | 0.30 | 0.28 | 0.32 | 0.38 | 0.34 | 0.33 | 0.30 | 0.35 | −0.32 | −0.72 | −0.71 | −0.30 | −0.72 | −0.75 | −0.33 | −0.27 | −0.42 | −0.48 | −0.49 | −0.41 | −0.45 | −0.45 | −0.48 | −0.46 | |||
| Structure Code | C5 | C12 | C4 | ||||||||||||||||||||||||
| SD | 1 [ppm] | 2 [ppm] | 3 [ppm] | 4 [ppm] | 5 [ppm] | 6 [ppm] | 7 [ppm] | 8 [ppm] | SD | 1 [ppm] | 2 [ppm] | 3 [ppm] | 4 [ppm] | 5 [ppm] | 6 [ppm] | 7 [ppm] | 8 [ppm] | SD | 1 [ppm] | 2 [ppm] | 3 [ppm] | 4 [ppm] | 5 [ppm] | 6 [ppm] | 7 [ppm] | 8 [ppm] | |
| HH4W | 0.14 | 30.22 | 29.96 | 29.96 | 30.22 | 29.93 | 29.94 | 30.23 | 30.21 | 0.05 | 24.43 | 24.44 | 24.52 | 24.53 | 24.49 | 24.42 | 24.49 | 24.43 | 0.11 | 15.66 | 15.52 | 15.56 | 15.71 | 15.59 | 15.41 | 15.62 | 15.78 |
| HH3W | 0.35 | 30.37 | 29.43 | 30.10 | 29.43 | 30.05 | 30.04 | 30.28 | 30.30 | 0.09 | 24.56 | 24.33 | 24.6 | 24.4 | 24.38 | 24.47 | 24.35 | 24.56 | 0.10 | 15.69 | 15.89 | 15.59 | 15.86 | 15.72 | 15.60 | 15.81 | 15.75 |
| HH2W ULBL | 0.40 | 29.50 | 30.10 | 29.53 | 30.44 | 29.52 | 30.10 | 29.53 | 30.45 | 0.06 | 24.28 | 24.34 | 24.29 | 24.45 | 24.29 | 24.32 | 24.32 | 24.28 | 0.13 | 15.96 | 15.62 | 15.91 | 15.90 | 15.93 | 15.63 | 15.91 | 15.89 |
| HH2W BLUR | 0.39 | 30.37 | 29.49 | 30.12 | 29.47 | 29.50 | 30.10 | 29.49 | 30.39 | 0.16 | 24.54 | 24.16 | 24.48 | 24.23 | 24.2 | 24.51 | 24.19 | 24.54 | 0.15 | 15.79 | 15.95 | 15.60 | 15.99 | 15.93 | 15.60 | 15.95 | 15.71 |
| HH2W ULUR | 0.37 | 30.36 | 29.99 | 29.98 | 30.35 | 29.47 | 29.49 | 29.50 | 29.44 | 0.06 | 24.27 | 24.23 | 24.24 | 24.26 | 24.38 | 24.34 | 24.33 | 24.27 | 0.07 | 15.82 | 15.68 | 15.67 | 15.85 | 15.83 | 15.78 | 15.76 | 15.89 |
| HH1W | 0.32 | 30.49 | 29.57 | 30.09 | 29.59 | 29.58 | 29.62 | 29.57 | 29.60 | 0.09 | 24.33 | 24.11 | 24.3 | 24.1 | 24.24 | 24.31 | 24.17 | 24.33 | 0.08 | 15.82 | 15.97 | 15.70 | 15.94 | 15.91 | 15.80 | 15.91 | 15.84 |
| HH0W | 0.01 | 29.72 | 29.75 | 29.73 | 29.76 | 29.73 | 29.75 | 29.74 | 29.76 | 0.01 | 24.23 | 24.26 | 24.23 | 24.24 | 24.26 | 24.25 | 24.26 | 24.23 | 0.01 | 16.00 | 15.98 | 16.01 | 15.98 | 15.98 | 15.97 | 15.98 | 15.98 |
| EXP HH4W | 0.00 | 31.00 | 31.00 | 31.00 | 31.00 | 31.00 | 31.00 | 31.00 | 31.00 | 0.00 | 24.00 | 24.00 | 24.00 | 24.00 | 24.00 | 24.00 | 24.00 | 24.00 | 0.00 | 18.50 | 18.50 | 18.50 | 18.50 | 18.50 | 18.50 | 18.50 | 18.50 |
| HH0W-HH4W | −0.50 | −0.21 | −0.23 | −0.46 | −0.20 | −0.19 | −0.49 | −0.45 | −0.20 | −0.18 | −0.29 | −0.29 | −0.23 | −0.17 | −0.23 | −0.31 | 0.34 | 0.46 | 0.45 | 0.27 | 0.39 | 0.56 | 0.36 | 0.20 | |||
| Code | Energy [kcal/mol] | a [Å] | b [Å] | c [Å] | α [°] | β [°] | γ [°] | V [Å3] |
|---|---|---|---|---|---|---|---|---|
| MH4W | −133,137.10 | 7.014 | 20.831 | 11.139 | 90.000 | 99.644 | 90.000 | 1604.557 |
| MH3W | −130,565.98 | 6.965 | 20.809 | 11.192 | 89.843 | 100.177 | 90.944 | 1596.371 |
| MH2W BLUR | −127,995.21 | 6.905 | 20.796 | 11.272 | 90.07 | 101.034 | 91.423 | 1588.170 |
| MH2W ULBL | −127,995.75 | 6.927 | 20.773 | 11.198 | 90.000 | 100.536 | 90.000 | 1584.090 |
| MH2W ULUR | −127,994.89 | 6.967 | 20.497 | 11.294 | 90.000 | 100.753 | 90.000 | 1584.492 |
| MH1W | −125,424.93 | 6.941 | 20.388 | 11.321 | 90.296 | 101.284 | 90.072 | 1571.063 |
| MH0W | −122,856.04 | 6.934 | 20.078 | 11.402 | 90.000 | 101.664 | 90.000 | 1554.529 |
| EXPII MH4W | - | 6.993 | 20.663 | 11.770 | 90.000 | 98.699 | 90.000 | 1681.047 |
| EXPII MH0W | - | 7.099 | 19.808 | 11.638 | 90.000 | 101.529 | 90.000 | 1603.545 |
| EXPI MH4W | - | 6.965 | 20.501 | 11.670 | 90.000 | 98.406 | 90.000 | 1648.428 |
| EXPI MH0W | - | nd | 19.790 | 11.600 | nd | nd | nd | nd |
| Code | Energy [kcal/mol] | a [Å] | b [Å] | c [Å] | α [°] | β [°] | γ [°] | V [Å3] |
|---|---|---|---|---|---|---|---|---|
| HH4W | −256,549.75 | 30.445 | 6.159 | 22.190 | 89.688 | 131.558 | 90.379 | 3113.379 |
| HH3W | −255,972.96 | 29.973 | 6.117 | 22.231 | 90.169 | 129.505 | 89.842 | 3144.949 |
| HH2W BLUR | −253,402.52 | 30.116 | 6.037 | 22.244 | 90.091 | 128.996 | 89.916 | 3143.336 |
| HH2W ULBL | −250,832.71 | 30.111 | 5.980 | 22.222 | 90.000 | 128.342 | 90.000 | 3138.280 |
| HH2W ULUR | −250,833.16 | 30.167 | 5.951 | 22.231 | 90.182 | 128.230 | 89.853 | 3135.101 |
| HH1W | −250,832.65 | 30.163 | 5.962 | 22.235 | 90.000 | 128.343 | 90.000 | 3136.250 |
| HH0W | −256,549.75 | 30.445 | 6.159 | 22.190 | 89.688 | 131.558 | 90.379 | 3113.379 |
| EXP HH4W | - | 29.921 | 6.138 | 22.041 | 90.000 | 128.684 | 90.000 | 3160.049 |
Disclaimer/Publisher’s Note: The statements, opinions and data contained in all publications are solely those of the individual author(s) and contributor(s) and not of MDPI and/or the editor(s). MDPI and/or the editor(s) disclaim responsibility for any injury to people or property resulting from any ideas, methods, instructions or products referred to in the content. |
© 2023 by the authors. Licensee MDPI, Basel, Switzerland. This article is an open access article distributed under the terms and conditions of the Creative Commons Attribution (CC BY) license (https://creativecommons.org/licenses/by/4.0/).
Share and Cite
Napiórkowska, E.; Szeleszczuk, Ł.; Milcarz, K.; Pisklak, D.M. Density Functional Theory and Density Functional Tight Binding Studies of Thiamine Hydrochloride Hydrates. Molecules 2023, 28, 7497. https://doi.org/10.3390/molecules28227497
Napiórkowska E, Szeleszczuk Ł, Milcarz K, Pisklak DM. Density Functional Theory and Density Functional Tight Binding Studies of Thiamine Hydrochloride Hydrates. Molecules. 2023; 28(22):7497. https://doi.org/10.3390/molecules28227497
Chicago/Turabian StyleNapiórkowska, Ewa, Łukasz Szeleszczuk, Katarzyna Milcarz, and Dariusz Maciej Pisklak. 2023. "Density Functional Theory and Density Functional Tight Binding Studies of Thiamine Hydrochloride Hydrates" Molecules 28, no. 22: 7497. https://doi.org/10.3390/molecules28227497