
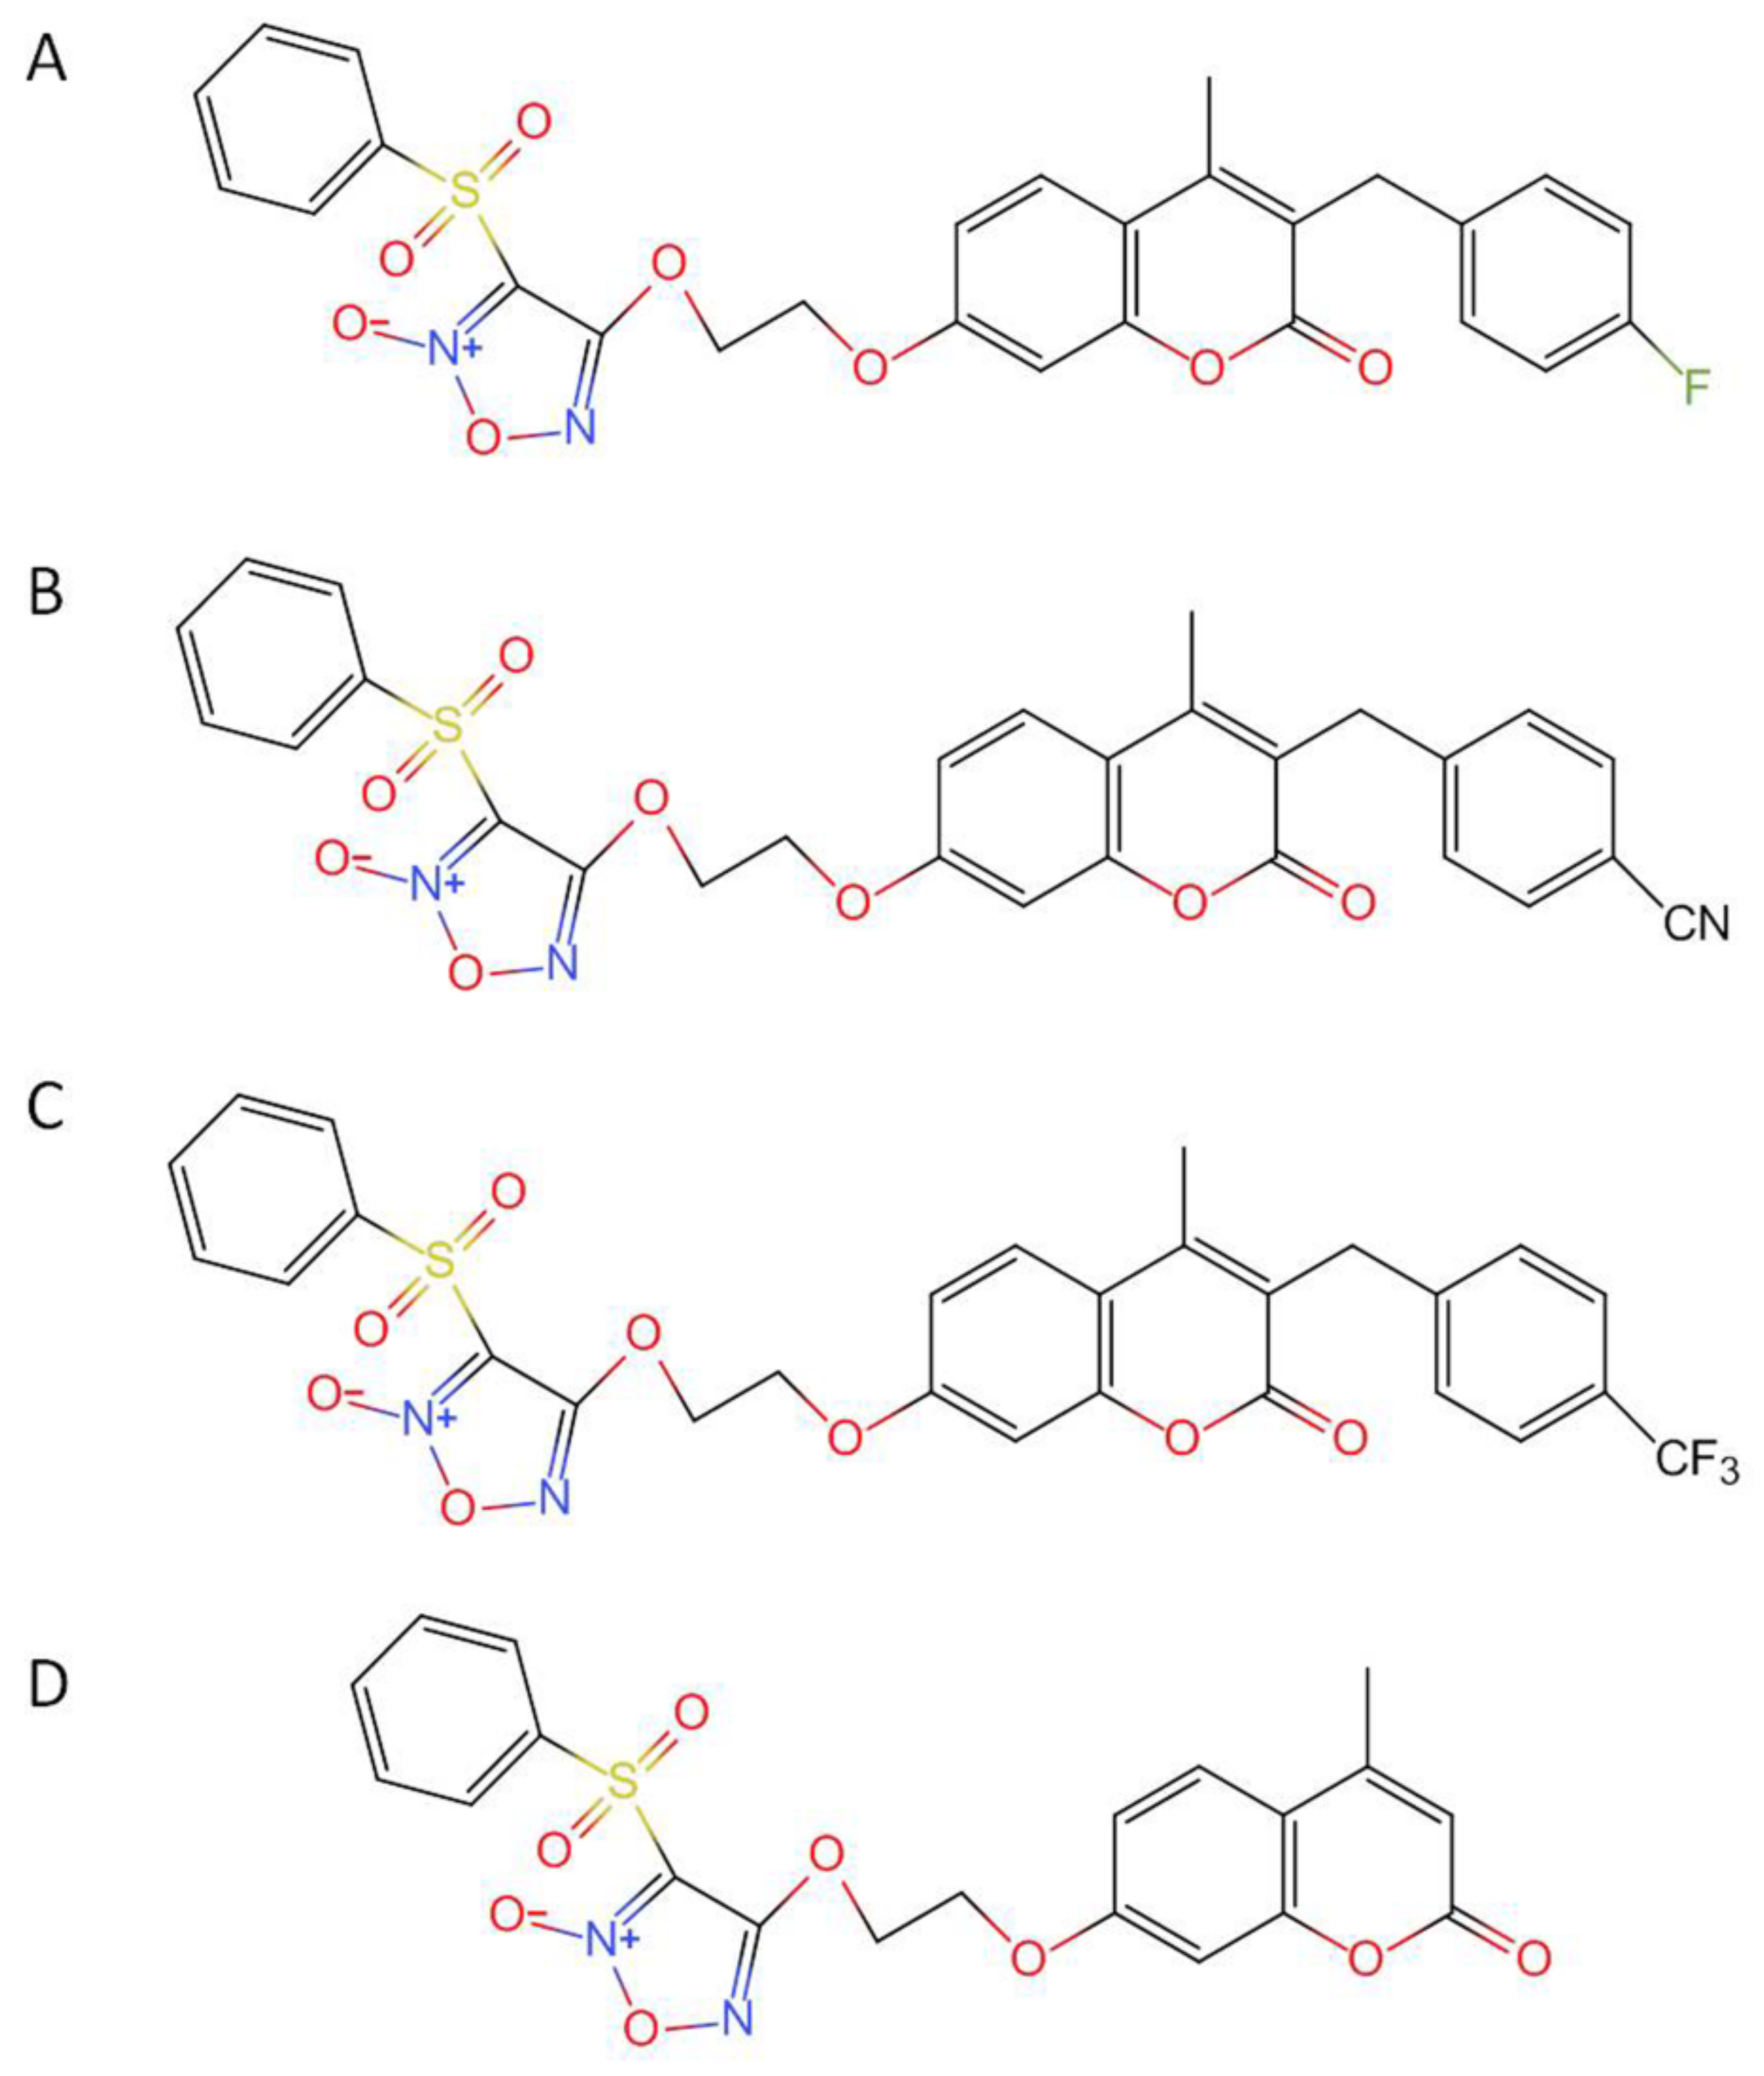
Pharmacokinetics of Novel Furoxan/Coumarin Hybrids in Rats Using LC-MS/MS Method and Physiologically Based Pharmacokinetic Model

 , , , , and
Abstract
: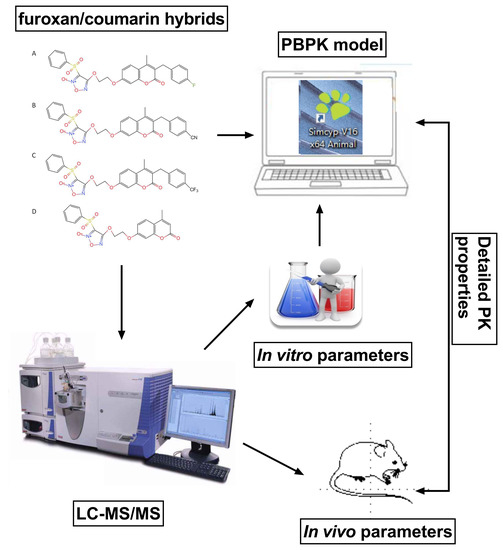
1. Introduction
2. Results
2.1. LC-MS/MS Method Validation
2.2. Free Drug Fraction of Candidates
2.3. Blood-to-Plasma Concentration Ratio of Candidates
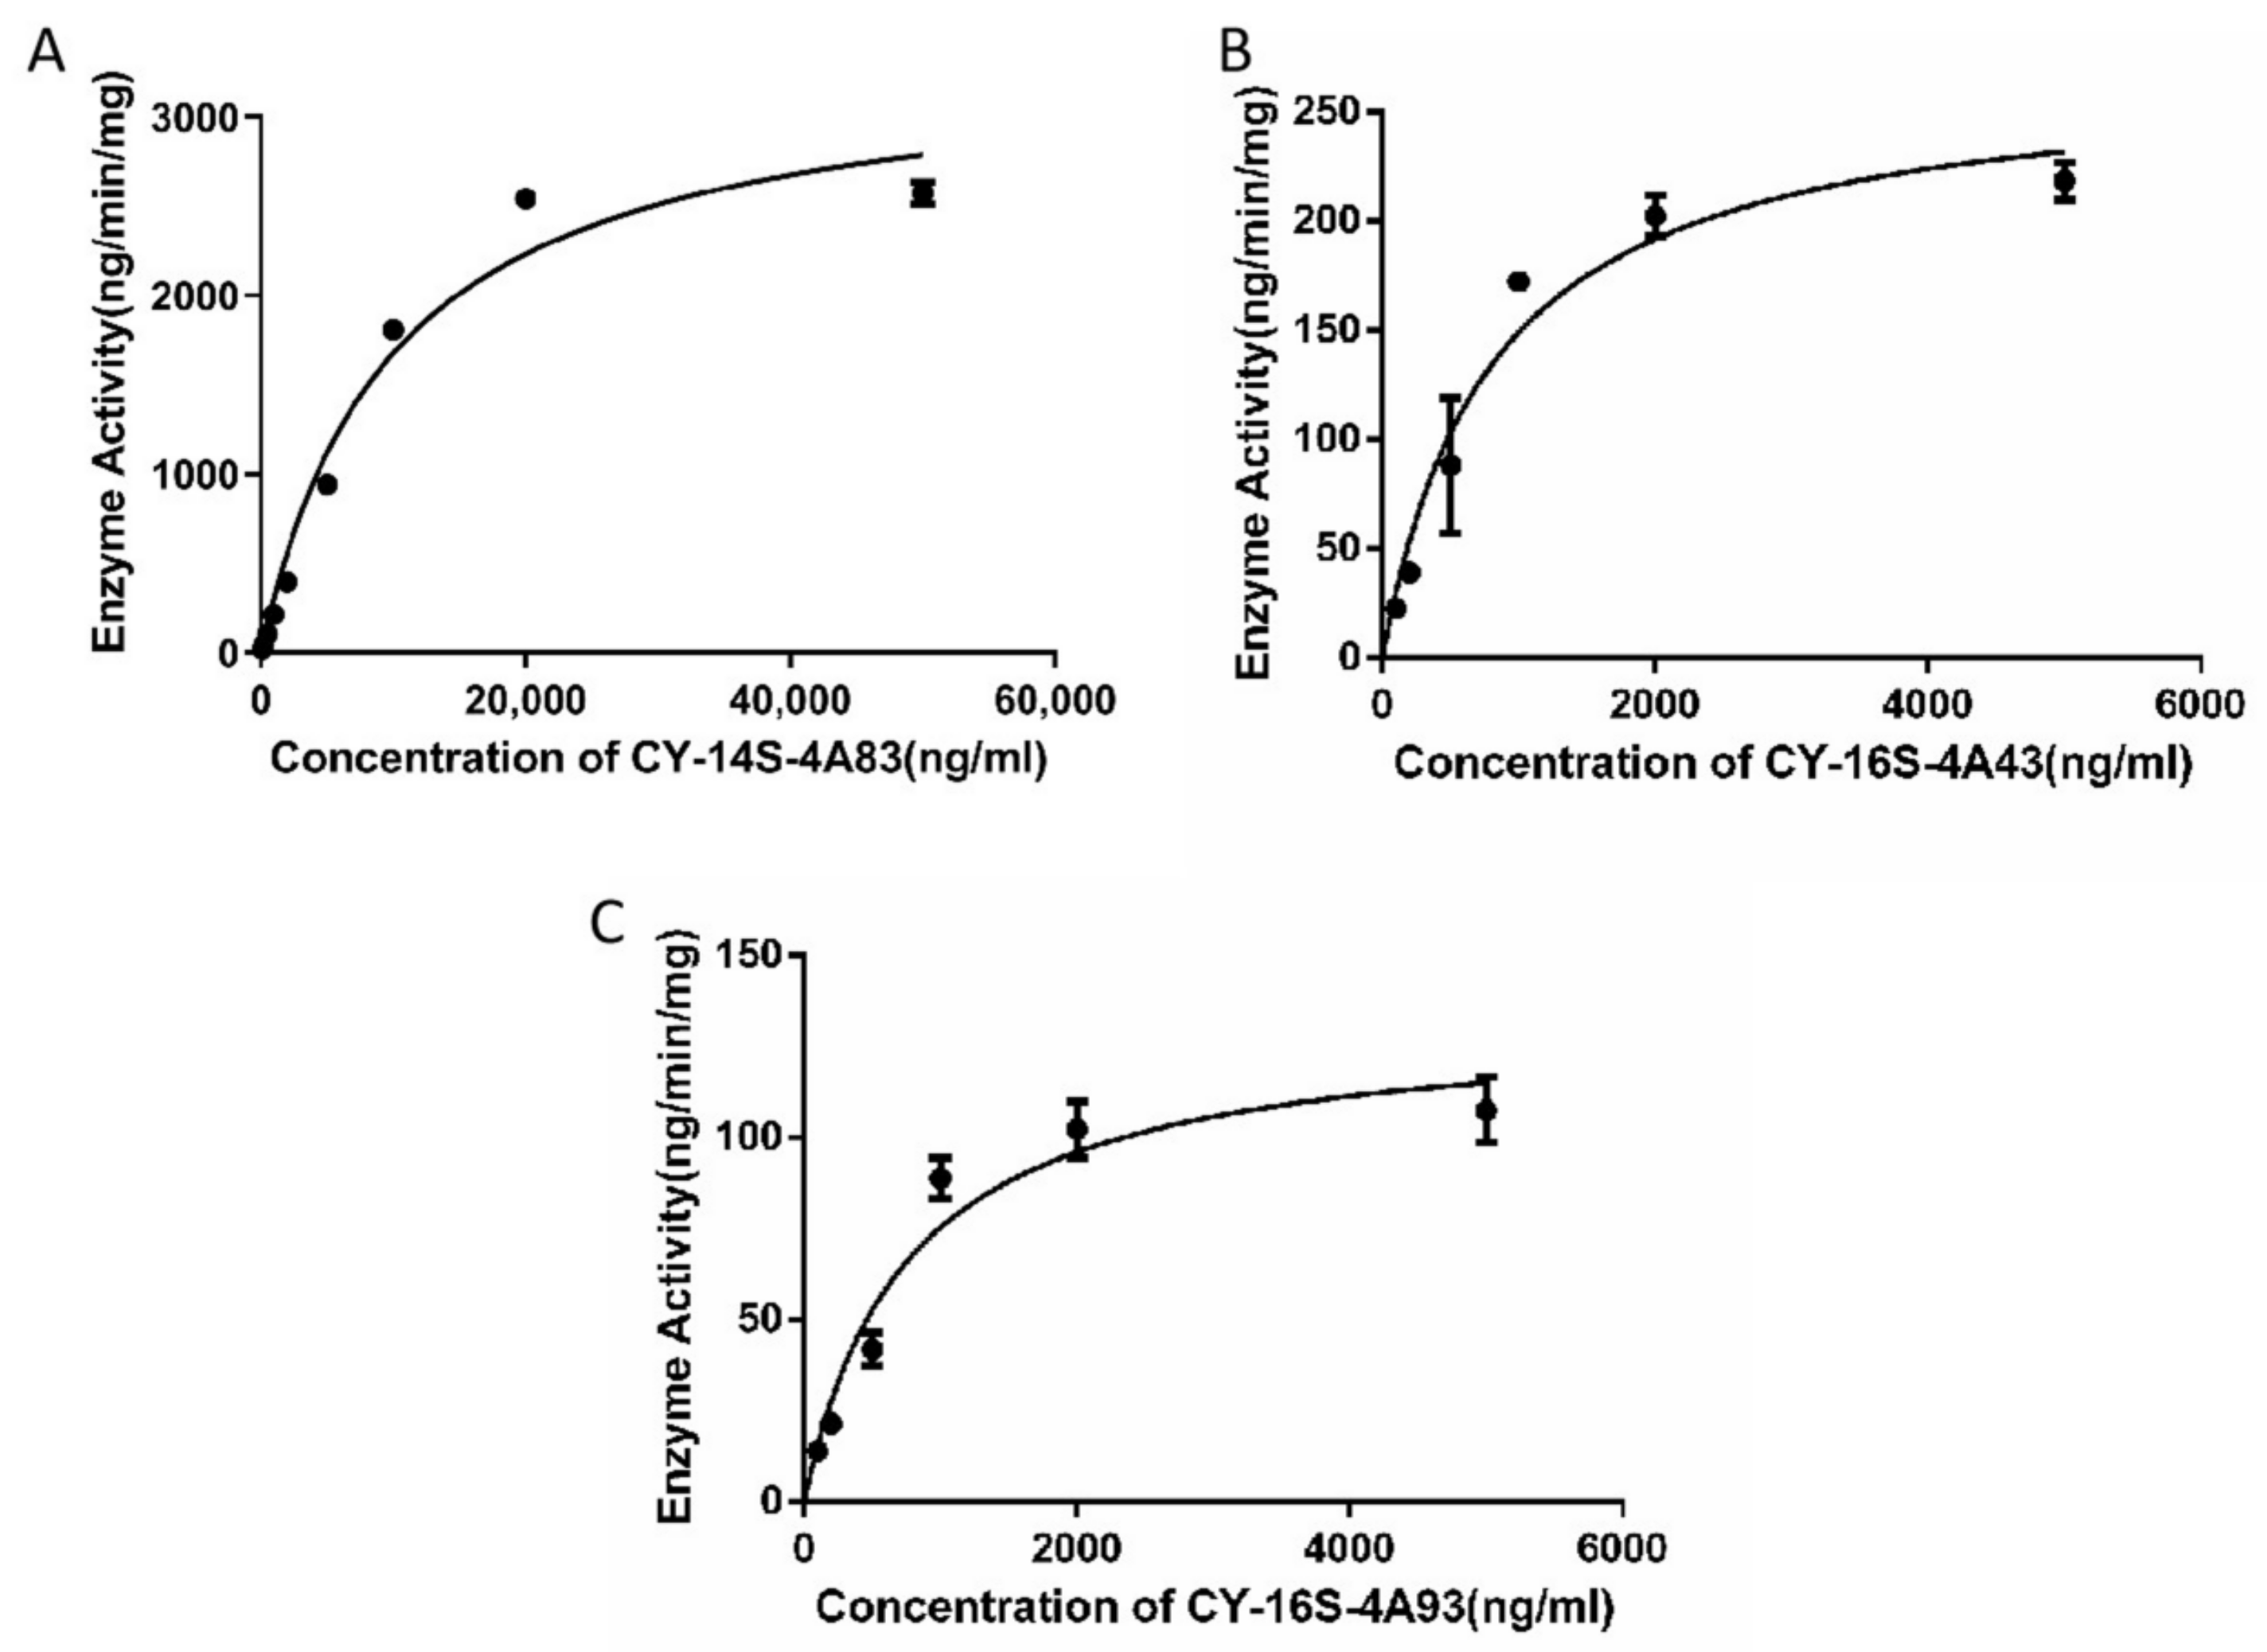
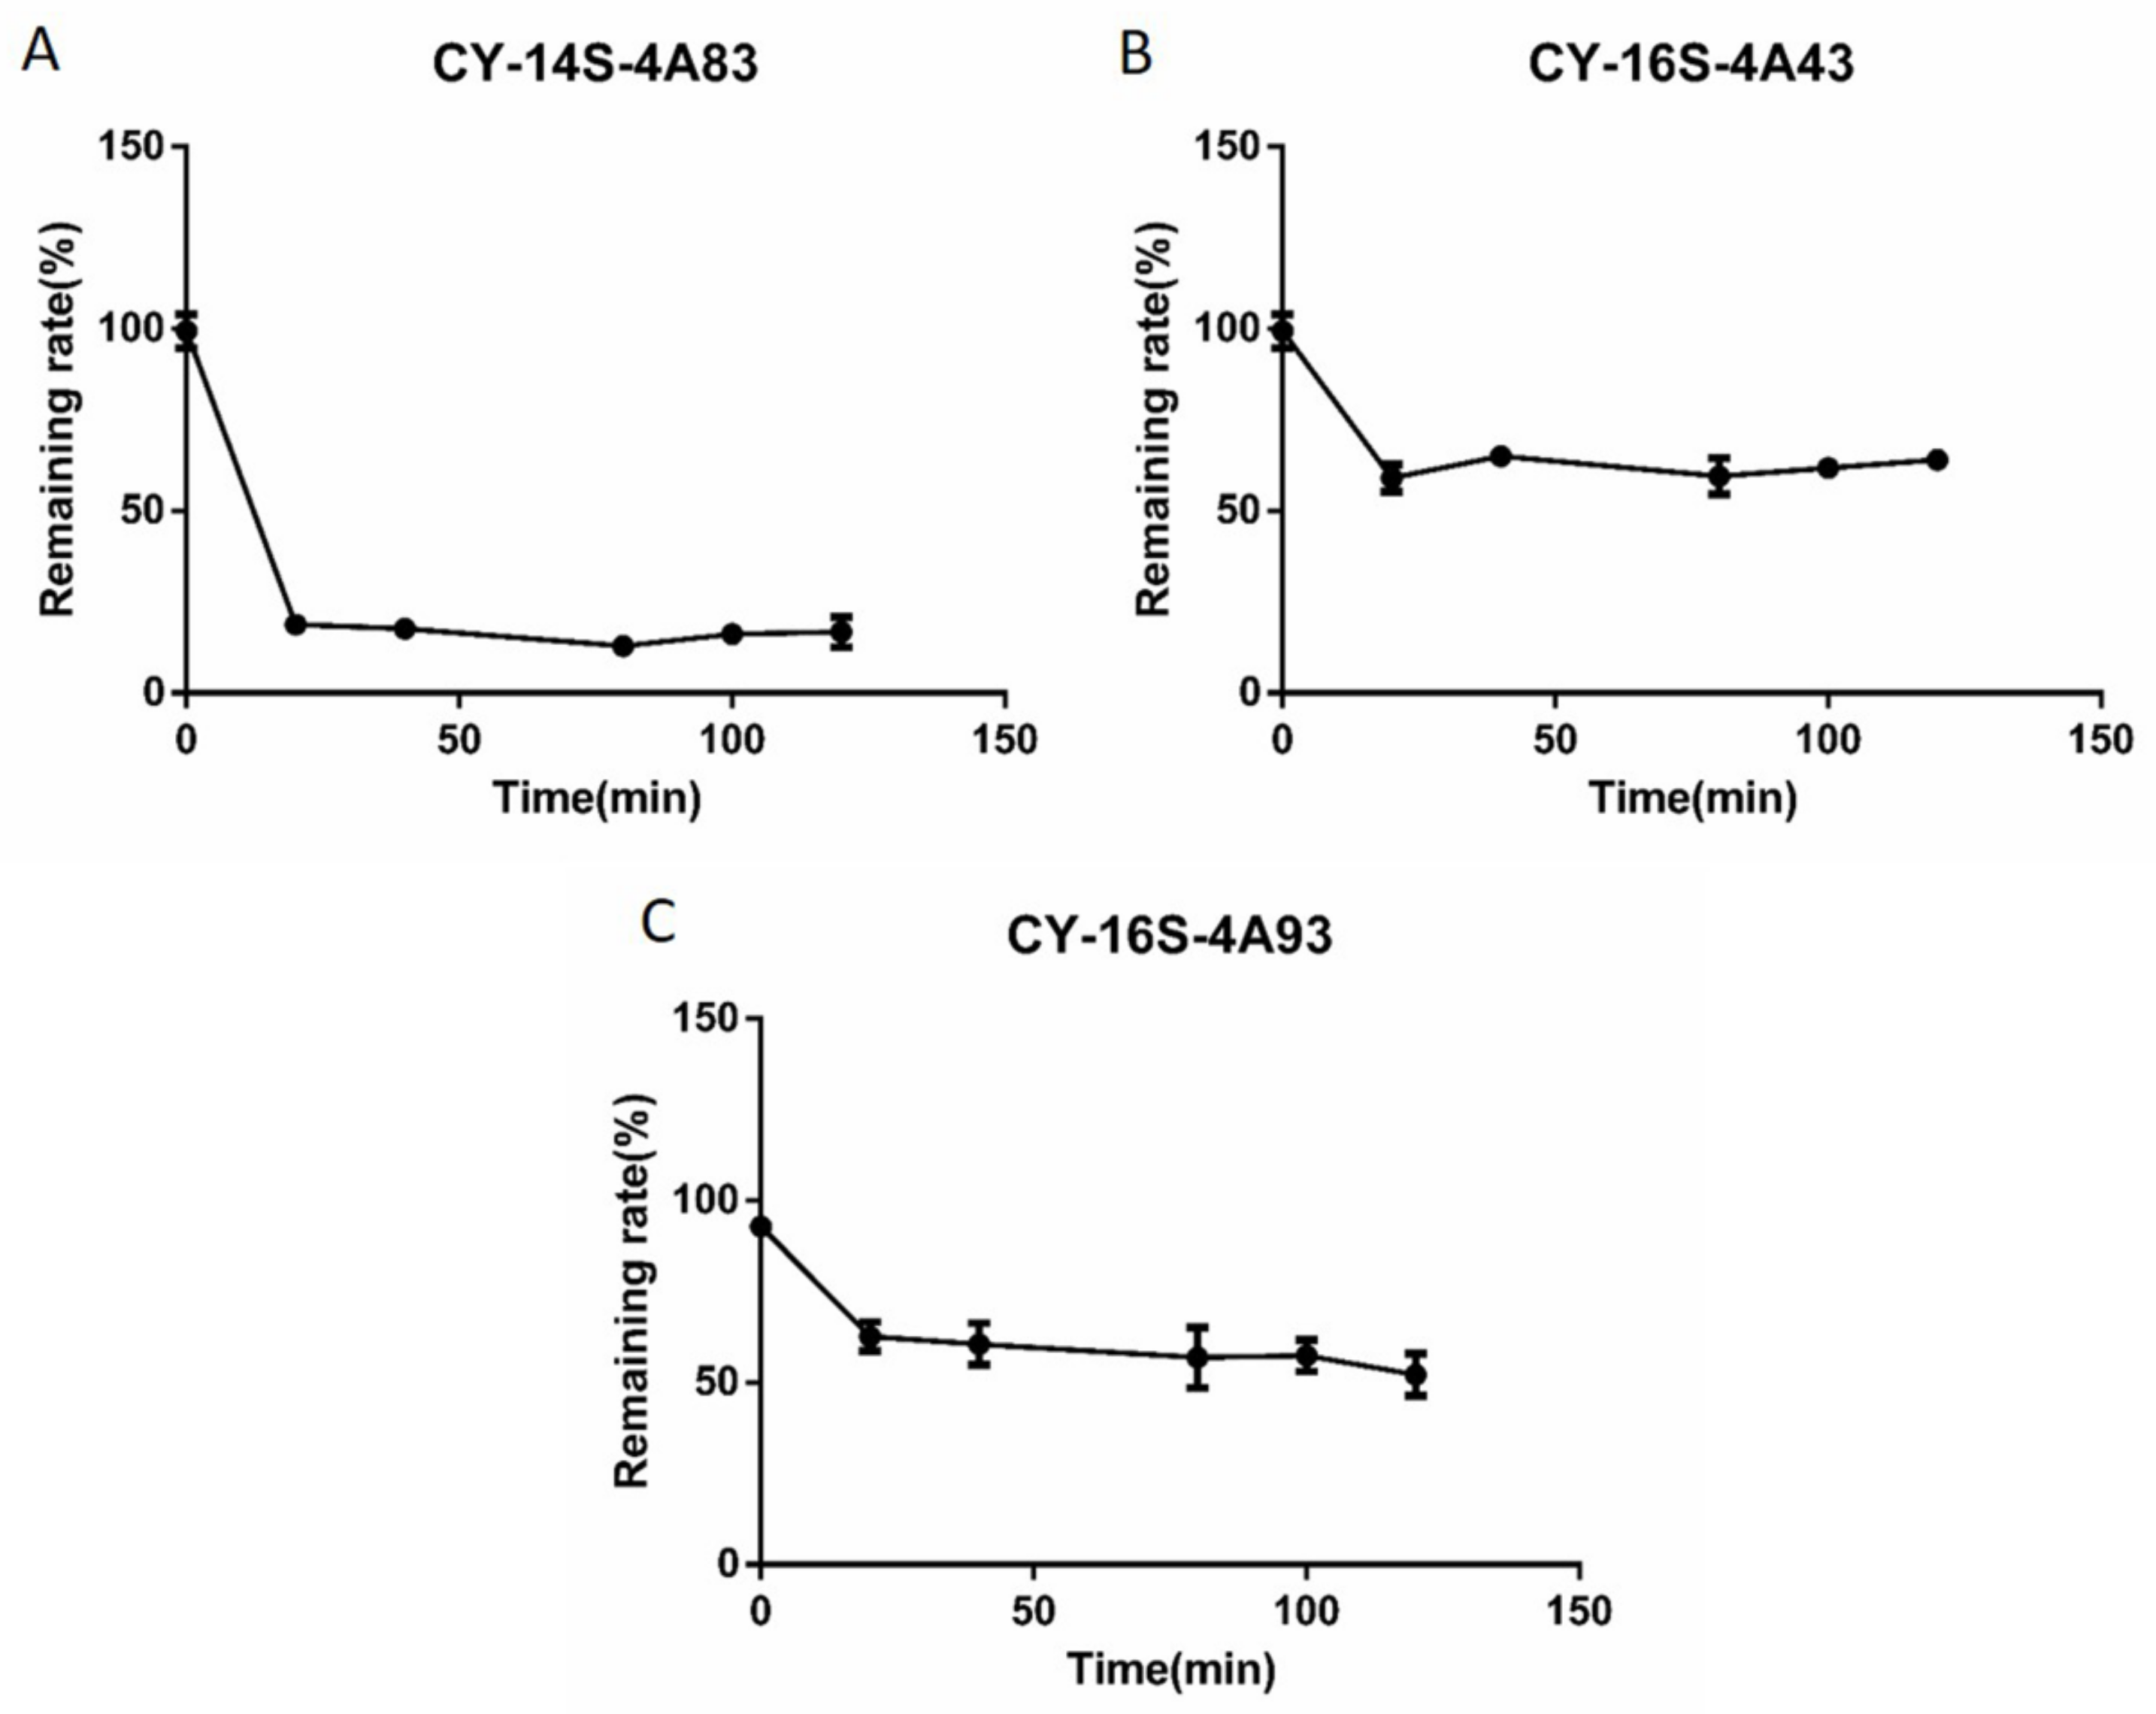
2.4. In Vitro Intrinsic Clearance of Candidates
2.5. Pharmacokinetics of Candidates
2.6. PBPK Modeling of Candidates
3. Discussion
4. Materials and Methods
4.1. Chemicals and Reagents
4.2. Animals
4.3. Free Drug Fraction Determinations
4.4. Blood-to-Plasma Concentration Ratio Determinations
4.5. In Vitro Intrinsic Clearance (CLint) Determinations
4.6. Pharmacokinetic Study
4.7. LC-MS/MS Analysis Method
4.8. PBPK Modeling
4.9. Data Analysis
5. Conclusions
Author Contributions
Funding
Institutional Review Board Statement
Data Availability Statement
Acknowledgments
Conflicts of Interest
Sample Availability
References
- Santarpia, L.; Lippman, S.M.; El-Naggar, A.K. Targeting the MAPK–RAS–RAF signaling pathway in cancer therapy. Expert Opin. Ther. Targets 2012, 16, 103–119. [Google Scholar] [CrossRef] [PubMed] [Green Version]
- Vara, J.Á.F.; Casado, E.; de Castro, J.; Cejas, P.; Belda-Iniesta, C.; González-Barón, M. PI3K/Akt signalling pathway and cancer. Cancer Treat. Rev. 2004, 30, 193–204. [Google Scholar] [CrossRef] [PubMed]
- Carlino, M.S.; Todd, J.R.; Gowrishankar, K.; Mijatov, B.; Pupo, G.M.; Fung, C.; Snoyman, S.; Hersey, P.; Long, G.V.; Kefford, R.F.; et al. Differential activity of MEK and ERK inhibitors in BRAF inhibitor resistant melanoma. Mol. Oncol. 2014, 8, 544–554. [Google Scholar] [CrossRef] [PubMed]
- Bekaii-Saab, T.; Phelps, M.A.; Li, X.; Saji, M.; Goff, L.; Kauh, J.S.; O’Neil, B.H.; Balsom, S.; Balint, C.; Liersemann, R.; et al. Multi-institutional phase II study of selumetinib in patients with metastatic biliary cancers. J. Clin. Oncol. 2011, 29, 2357–2363. [Google Scholar] [CrossRef] [PubMed] [Green Version]
- Neuzillet, C.; Tijeras-Raballand, A.; de Mestier, L.; Cros, J.; Faivre, S.; Raymond, E. MEK in cancer and cancer therapy. Pharmacol. Ther. 2014, 141, 160–171. [Google Scholar] [CrossRef]
- Mabuchi, S.; Kuroda, H.; Takahashi, R.; Sasano, T. The PI3K/AKT/mTOR pathway as a therapeutic target in ovarian cancer. Gynecol. Oncol. 2015, 137, 173–179. [Google Scholar] [CrossRef]
- Zeiser, R.; Andrlová, H.; Meiss, F. Trametinib (GSK1120212). In Small Molecules in Oncology; Recent results in cancer research Series; Springer: Berlin/Heidelberg, Germany, 2018; Volume 211, pp. 91–100. [Google Scholar]
- Lian, T.; Li, C.; Wang, H. Trametinib in the treatment of multiple malignancies harboring MEK1 mutations. Cancer Treat. Rev. 2019, 81, 101907. [Google Scholar] [CrossRef]
- Fu, S.; Hennessy, B.T.; Ng, C.S.; Ju, Z.; Coombes, K.R.; Wolf, J.K.; Sood, A.K.; Levenback, C.F.; Coleman, R.L.; Kavanagh, J.J.; et al. Perifosine plus docetaxel in patients with platinum and taxane resistant or refractory high-grade epithelial ovarian cancer. Gynecol. Oncol. 2012, 126, 47–53. [Google Scholar] [CrossRef] [Green Version]
- Chilin, A.; Battistutta, R.; Bortolato, A.; Cozza, G.; Zanatta, S.; Poletto, G.; Mazzorana, M.; Zagotto, G.; Uriarte, E.; Guiotto, A.; et al. Coumarin as attractive casein kinase 2 (CK2) inhibitor scaffold: An integrate approach to elucidate the putative binding motif and explain structure-activity relationships. J. Med. Chem. 2008, 51, 752–759. [Google Scholar] [CrossRef]
- Chao, W.; Fengrong, X.; Yan, N.; Yun, W.; Jing, S.; Yihong, P.; Lei, L.; Ping, X. Synthesis and Biological Evaluations of 3-Benzothiazol-2-yl Coumarin Derivatives as MEK1 Inhibitors. Lett. Drug Des. Discov. 2013, 10, 727–732. [Google Scholar]
- Goel, A.; Prasad, A.K.; Parmar, V.S.; Ghosh, B.; Saini, N. 7,8-Dihydroxy-4-methylcoumarin induces apoptosis of human lung adenocarcinoma cells by ROS-independent mitochondrial pathway through partial inhibition of ERK/MAPK signaling. FEBS Lett. 2007, 581, 2447–2454. [Google Scholar] [CrossRef]
- Wen, Q.; Luo, K.; Huang, H.; Liao, W.; Yang, H. Xanthoxyletin Inhibits Proliferation of Human Oral Squamous Carcinoma Cells and Induces Apoptosis, Autophagy, and Cell Cycle Arrest by Modulation of the MEK/ERK Signaling Pathway. Med. Sci. Monit. 2019, 25, 8025–8033. [Google Scholar] [CrossRef]
- Aguirre, G.; Boiani, M.; Cerecetto, H.; Fernández, M.; González, M.; León, E.; Pintos, C.; Raymondo, S.; Arredondo, C.; Pacheco, J.P.; et al. Furoxan derivatives as cytotoxic agents: Preliminary in vivo antitumoral activity studies. Die Pharmazie 2006, 61, 54–59. [Google Scholar]
- Li, H.; Wang, K.; Wan, Q.; Chen, Y. Design, synthesis and anti-tumor evaluation of novel steroidal glycoconjugate with furoxan derivatives. Steroids 2019, 141, 81–95. [Google Scholar] [CrossRef]
- Polak, J.M. Book Review: Nitric Oxide in Health and Disease, J. Lincoln, C.H.V. Hoyle and G. Burnstock, Cambridge University Press, Cambridge, 1997. J. Pathol. 1998, 185, 226. [Google Scholar] [CrossRef]
- Amedea, B.S.; Nelson, D. Nanoparticulated Nitric Oxide Donors and their Biomedical Applications. Mini-Rev. Med. Chem. 2017, 17, 216–223. [Google Scholar]
- Star, R.A. Nitric Oxide. Am. J. Med. Sci. 1993, 306, 348–358. [Google Scholar] [CrossRef]
- Alimoradi, H.; Greish, K.; Gamble, A.B.; Giles, G.I. Controlled Delivery of Nitric Oxide for Cancer Therapy. Pharm. Nanotechnol. 2019, 7, 279–303. [Google Scholar] [CrossRef]
- Bonavida, B.; Baritaki, S.; Huerta-Yepez, S.; Vega, M.I.; Chatterjee, D.; Yeung, K. Novel therapeutic applications of nitric oxide donors in cancer: Roles in chemo- and immunosensitization to apoptosis and inhibition of metastases. Nitric Oxide 2008, 19, 152–157. [Google Scholar] [CrossRef]
- Sugita, H.; Kaneki, M.; Furuhashi, S.; Hirota, M.; Takamori, H.; Baba, H. Nitric oxide inhibits the proliferation and invasion of pancreatic cancer cells through degradation of insulin receptor substrate-1 protein. Mol. Cancer Res. 2010, 8, 1152–1163. [Google Scholar] [CrossRef] [Green Version]
- Furuhashi, S.; Sugita, H.; Takamori, H.; Horino, K.; Nakahara, O.; Okabe, H.; Miyake, K.; Tanaka, H.; Beppu, T.; Baba, H. NO donor and MEK inhibitor synergistically inhibit proliferation and invasion of cancer cells. Int. J. Oncol. 2012, 40, 807–815. [Google Scholar] [PubMed] [Green Version]
- Liu, M.M.; Chen, X.Y.; Huang, Y.Q.; Feng, P.; Guo, Y.L.; Yang, G.; Chen, Y. Hybrids of phenylsulfonylfuroxan and coumarin as potent antitumor agents. J. Med. Chem. 2014, 57, 9343–9356. [Google Scholar] [CrossRef] [PubMed]
- Guo, Y.; Wang, Y.; Li, H.; Wang, K.; Wan, Q.; Li, J.; Zhou, Y.; Chen, Y. Novel Nitric Oxide Donors of Phenylsulfonylfuroxan and 3-Benzyl Coumarin Derivatives as Potent Antitumor Agents. ACS Med. Chem. Lett. 2018, 9, 502–506. [Google Scholar] [CrossRef]
- Cascone, S.; Lamberti, G.; Marra, F.; Titomanlio, G.; d’Amore, M.; Barba, A.A. Gastrointestinal behavior and ADME phenomena: I. In vitro simulation. J. Drug Deliv. Sci. Technol. 2016, 35, 272–283. [Google Scholar] [CrossRef]
- Pelkonen, O.; Turpeinen, M. In vitro-in vivo extrapolation of hepatic clearance: Biological tools, scaling factors, model assumptions and correct concentrations. Xenobiotica 2007, 37, 1066–1089. [Google Scholar] [CrossRef] [PubMed]
- Wachsmuth, L.; Mensen, A.; Barca, C.; Wiart, M.; Tristão-Pereira, C.; Busato, A.; Waiczies, S.; Himmelreich, U.; Millward, J.M.; Reimann, H.M.; et al. Contribution of preclinical MRI to responsible animal research: Living up to the 3R principle. Magn. Reson. Mater. Phys. Biol. Med. 2021, 34, 469–474. [Google Scholar] [CrossRef]
- Vitale, A.; Manciocco, A.; Alleva, E. The 3R principle and the use of non-human primates in the study of neurodegenerative diseases: The case of Parkinson’s disease. Neurosci. Biobehav. Rev. 2009, 33, 33–47. [Google Scholar] [CrossRef]
- Yuan, Y.; Chang, S.; Zhang, Z.; Li, Z.; Li, S.; Xie, P.; Yau, W.-P.; Lin, H.; Cai, W.; Zhang, Y.; et al. A novel strategy for prediction of human plasma protein binding using machine learning techniques. Chemom. Intell. Lab. Syst. 2020, 199, 103962. [Google Scholar] [CrossRef]
- Peyret, T.; Krishnan, K. QSARs for PBPK modelling of environmental contaminants. SAR QSAR Environ. Res. 2011, 22, 122–169. [Google Scholar] [CrossRef]
- Nair, P.C.; McKinnon, R.A.; Miners, J.O. A Fragment-Based Approach for the Computational Prediction of the Nonspecific Binding of Drugs to Hepatic Microsomes. Drug Metab. Dispos. 2016, 44, 1794–1798. [Google Scholar] [CrossRef]
- Merrill, E.A.; Clewell, R.A.; Gearhart, J.M.; Robinson, P.J.; Sterner, T.R.; Yu, K.O.; Mattie, D.R.; Fisher, J.W. PBPK predictions of perchlorate distribution and its effect on thyroid uptake of radioiodide in the male rat. Toxicol. Sci. 2003, 73, 256–269. [Google Scholar] [CrossRef] [Green Version]
- Bessems, J.G.; Loizou, G.; Krishnan, K.; Clewell, H.J., 3rd; Bernasconi, C.; Bois, F.; Coecke, S.; Collnot, E.M.; Diembeck, W.; Farcal, L.R.; et al. PBTK modelling platforms and parameter estimation tools to enable animal-free risk assessment: Recommendations from a joint EPAA--EURL ECVAM ADME workshop. Regul. Toxicol. Pharmacol. 2014, 68, 119–139. [Google Scholar] [CrossRef]
- Yoon, M.; Kedderis, G.L.; Yan, G.Z.; Clewell, H.J. Use of in vitro data in developing a physiologically based pharmacokinetic model: Carbaryl as a case study. Toxicology 2015, 332, 52–66. [Google Scholar] [CrossRef]
- Jones, H.M.; Parrott, N.; Jorga, K.; Lavé, T. A novel strategy for physiologically based predictions of human pharmacokinetics. Clin. Pharmacokinet. 2006, 45, 511–542. [Google Scholar] [CrossRef]
- De Buck, S.S.; Sinha, V.K.; Fenu, L.A.; Nijsen, M.J.; Mackie, C.E.; Gilissen, R.A. Prediction of human pharmacokinetics using physiologically based modeling: A retrospective analysis of 26 clinically tested drugs. Drug Metab. Dispos. 2007, 35, 1766–1780. [Google Scholar] [CrossRef]
- Li, S.; Yu, Y.; Bian, X.; Yao, L.; Li, M.; Lou, Y.R.; Yuan, J.; Lin, H.S.; Liu, L.; Han, B.; et al. Prediction of oral hepatotoxic dose of natural products derived from traditional Chinese medicines based on SVM classifier and PBPK modeling. Arch. Toxicol. 2021, 95, 1683–1701. [Google Scholar] [CrossRef]
- Chen, Y.; Jin, J.Y.; Mukadam, S.; Malhi, V.; Kenny, J.R. Application of IVIVE and PBPK modeling in prospective prediction of clinical pharmacokinetics: Strategy and approach during the drug discovery phase with four case studies. Biopharm. Drug Dispos. 2012, 33, 85–98. [Google Scholar] [CrossRef] [Green Version]
- Huang, S.-M.; Abernethy, D.R.; Wang, Y.; Zhao, P.; Zineh, I. The Utility of Modeling and Simulation in Drug Development and Regulatory Review. J. Pharm. Sci. 2013, 102, 2912–2923. [Google Scholar] [CrossRef]
- Zhang, Z.; Fu, S.; Wang, F.; Yang, C.; Wang, L.; Yang, M.; Zhang, W.; Zhong, W.; Zhuang, X. A PBPK Model of Ternary Cyclodextrin Complex of ST-246 Was Built to Achieve a Reasonable IV Infusion Regimen for the Treatment of Human Severe Smallpox. Front. Pharmacol. 2022, 13, 836356. [Google Scholar] [CrossRef]
- Fukuda, H.; Ohashi, R.; Tsuda-Tsukimoto, M.; Tamai, I. Effect of plasma protein binding on in vitro-in vivo correlation of biliary excretion of drugs evaluated by sandwich-cultured rat hepatocytes. Drug Metab. Dispos. 2008, 36, 1275–1282. [Google Scholar] [CrossRef] [Green Version]
- Yamazaki, S.; Skaptason, J.; Romero, D.; Vekich, S.; Jones, H.M.; Tan, W.; Wilner, K.D.; Koudriakova, T. Prediction of Oral Pharmacokinetics of cMet Kinase Inhibitors in Humans: Physiologically Based Pharmacokinetic Model Versus Traditional One-Compartment Model. Drug Metab. Dispos. 2011, 39, 383. [Google Scholar] [CrossRef] [PubMed]


| Calibration Curve Parameters | CY-14S-4A83 | CY-16S-4A43 | CY-14S-4A93 |
|---|---|---|---|
| Linearity equation | y = 0.038713x − 0.000446 | y = 0.045595x + 0.000448 | y = 0.028248x − 0.000252 |
| R2 | 0.99994 | 0.99986 | 0.99362 |
| LLOQ (ng/mL) | 10 | 10 | 10 |
| Property | Concentration (ng/mL) | CY-14S-4A83 | CY-16S-4A43 | CY-14S-4A93 |
|---|---|---|---|---|
| Intraday Precision (%) (n = 6) | 10–800 | 3.4–8.5 | 2.3–5 | 1.6–7.8 |
| Interday Precision (%) (n = 6) | 10–800 | 2.9–7.9 | 3.6–8.8 | 1.2–12.5 |
| Intraday Accuracy (%) (n = 6) a | 10–800 | 102.9–108.2 | 106.2–108.3 | 98.8–109 |
| Interday Accuracy (%) (n = 18) a | 10–800 | 101.7–107.8 | 105.4–108.7 | 103.4–106.1 |
| Recovery (%) (n = 6) | 20–800 | 99.9–114.4 | 85.2–87.5 | 101.8–112.5 |
| CV (%) | 8.8 | 1.4 | 5 | |
| Matrix effect (%) (n = 6) | 20–800 | 86.4–103.7 | 86.3–94.5 | 88.4–113.9 |
| CV (%) | 10.3 | 5.2 | 12.6 | |
| Stability (%) (n = 5) | 20–800 | 88–94.4 | 86–99.5 | 86.5–94.7 |
| CV (%) | 3.8 | 7.3 | 4.7 | |
| Dilution integrity (n = 6) a | 500 | 89.2 ± 3.2 | 102.3 ± 3.5 | 94.4 ± 2.7 |
| Compound | Vmax (pmol/min/mg Protein) a | Km (μM) a | CLint (µL/min/mg) |
|---|---|---|---|
| CY-14S-4A83 | 6044.0 ± 290.8 | 18.0 ± 2.3 | 336.0 |
| CY-16S-4A43 | 481.2 ± 30.0 | 1.4 ± 0.3 | 332.8 |
| CY-14S-4A93 | 220.0 ± 14.1 | 1.3 ± 0.2 | 173.8 |
| Parameters | Unit | CY-14S-4A83 | CY-16S-4A43 | CY-16S-4A93 |
|---|---|---|---|---|
| 0.5 mg/kg | 1.67 mg/kg | 1.67 mg/kg | ||
| AUC(0–∞) | ng·h/mL | 1343.6 ± 475.4 | 672.6 ± 181.6 | 3854.6 ± 1774.3 |
| AUC(0–24 h) | ng·h/mL | 1308.0 ± 461.7 | 668.6 ± 181.8 | 3845.1 ± 1773.4 |
| Cmax | ng/mL | 945.9 ± 452.5 | 1209.6 ± 481.9 | 9376.2 ± 4205.6 |
| Tmax | h | 0.2 ± 0.2 | 0.1 ± 0.1 | 0.1 ± 0 |
| Vd | L/kg | 0.56 ± 0.15 | 2.03 ± 0.63 | 0.68 ± 0.38 |
| CL | mL/h/kg | 414.5 ± 145.7 | 2624.6 ± 648.4 | 500.6 ± 195.2 |
| t1/2 | h | 1.0 ± 0.2 | 0.5 ± 0.1 | 0.9 ± 0.2 |
| MRT | h | 6.1 ± 1.5 | 4.5 ± 1 | 2.2 ± 0.7 |
| Parameters | CY-14S-4A83 | CY-16S-4A43 | CY-14S-4A93 |
|---|---|---|---|
| MW (g/mol) | 552.53 | 559.55 | 602.54 |
| log Po:w | 2.497 | 1.807 | 2.88 |
| compound type | Monoprotic Acid | Monoprotic Acid | Monoprotic Acid |
| pKa | 5.12 | 5.13 | 5.1 |
| B/P | 12 | 2 | 9 |
| fu | 0.02 | 0.03 | 0.03 |
| LM CLint (µL/min/mg) | 336.033 | 332.8 | 173.83 |
| Compounds | Parameters | Cmax (ng/mL) | AUC (ng·h/mL) |
|---|---|---|---|
| CY-14S-4A83 | Experimental data | 945.9 ± 452.5 | 1308.0 ± 461.7 |
| Prediction data 1 a | 553.83 | 757.87 | |
| Fold Error | 1.71 | 1.73 | |
| Prediction data 2 b | 620.14 | 757.86 | |
| Fold Error | 1.53 | 1.73 | |
| Prediction data 2 c | 972.74 | 757.87 | |
| Fold Error | 1.03 | 1.73 | |
| CY-16S-4A43 | Experimental data | 1209.6 ± 481.9 | 668.6 ± 181.8 |
| Prediction data 1 a | 3437.49 | 1863.46 | |
| Fold Error | 2.84 | 2.79 | |
| Prediction data 2 d | 1456.07 | 1863.45 | |
| Fold Error | 1.2 | 2.79 | |
| Prediction data 3 e | 1410.01 | 661.82 | |
| Fold Error | 1.17 | 1.01 | |
| CY-16S-4A93 | Experimental data | 9376.2 ± 4205.6 | 3845.1 ± 1773.4 |
| Prediction data 1 a | 2363.36 | 3263.5 | |
| Fold Error | 3.97 | 1.18 | |
| Prediction data 2 f | 2754.85 | 3263.47 | |
| Fold Error | 3.4 | 1.18 | |
| Prediction data 2 g | 10,369.84 | 3263.57 | |
| Fold Error | 1.11 | 1.18 |
| Tissues | Kp | ||
|---|---|---|---|
| CY-14S-4A83 | CY-16S-4A43 | CY-16S-4A93 | |
| Adipose | 0.00 | 0.02 | 0.00 |
| Bone | 0.00 | 0.83 | 0.00 |
| Brain | 0.00 | 1.51 | 0.00 |
| Gut | 0.00 | 1.49 | 0.00 |
| Heart | 0.00 | 1.37 | 0.00 |
| Kidney | 0.00 | 1.35 | 0.00 |
| Liver | 1.00 | 1.32 | 1.00 |
| Lung | 0.00 | 1.43 | 0.00 |
| Muscle | 0.00 | 1.29 | 0.00 |
| Skin | 0.00 | 1.47 | 0.00 |
| Spleen | 0.00 | 1.35 | 0.00 |
| Compound | Q1/Da | Q3/Da | DT/Msec | Frag/V | CE/V |
|---|---|---|---|---|---|
| CY-14S-4A93 | 603.1 | 333.1 | 75 | 380 | 33 |
| CY-16S-4A43 | 560.1 | 290.0 | 75 | 380 | 29 |
| CY-14S-4A83 | 553.1 | 187.8 | 75 | 380 | 37 |
| CY-11S-1A26(IS) | 445.1 | 175.9 | 75 | 380 | 25 |
Disclaimer/Publisher’s Note: The statements, opinions and data contained in all publications are solely those of the individual author(s) and contributor(s) and not of MDPI and/or the editor(s). MDPI and/or the editor(s) disclaim responsibility for any injury to people or property resulting from any ideas, methods, instructions or products referred to in the content. |
© 2023 by the authors. Licensee MDPI, Basel, Switzerland. This article is an open access article distributed under the terms and conditions of the Creative Commons Attribution (CC BY) license (https://creativecommons.org/licenses/by/4.0/).
Share and Cite
Yuan, Y.; Li, Z.; Wang, K.; Zhang, S.; He, Q.; Liu, L.; Tang, Z.; Zhu, X.; Chen, Y.; Cai, W.; et al. Pharmacokinetics of Novel Furoxan/Coumarin Hybrids in Rats Using LC-MS/MS Method and Physiologically Based Pharmacokinetic Model. Molecules 2023, 28, 837. https://doi.org/10.3390/molecules28020837
Yuan Y, Li Z, Wang K, Zhang S, He Q, Liu L, Tang Z, Zhu X, Chen Y, Cai W, et al. Pharmacokinetics of Novel Furoxan/Coumarin Hybrids in Rats Using LC-MS/MS Method and Physiologically Based Pharmacokinetic Model. Molecules. 2023; 28(2):837. https://doi.org/10.3390/molecules28020837
Chicago/Turabian StyleYuan, Yawen, Zhihong Li, Ke Wang, Shunguo Zhang, Qingfeng He, Lucy Liu, Zhijia Tang, Xiao Zhu, Ying Chen, Weimin Cai, and et al. 2023. "Pharmacokinetics of Novel Furoxan/Coumarin Hybrids in Rats Using LC-MS/MS Method and Physiologically Based Pharmacokinetic Model" Molecules 28, no. 2: 837. https://doi.org/10.3390/molecules28020837