
Pyrolysis Kinetics of Byrsonima crassifolia Stone as Agro-Industrial Waste through Isoconversional Models

 , , , and
Abstract
:1. Introduction
2. Results and Discussions
2.1. Biomass Physicochemical Characterization
2.2. Thermogravimetric Analysis (TGA & DTG)
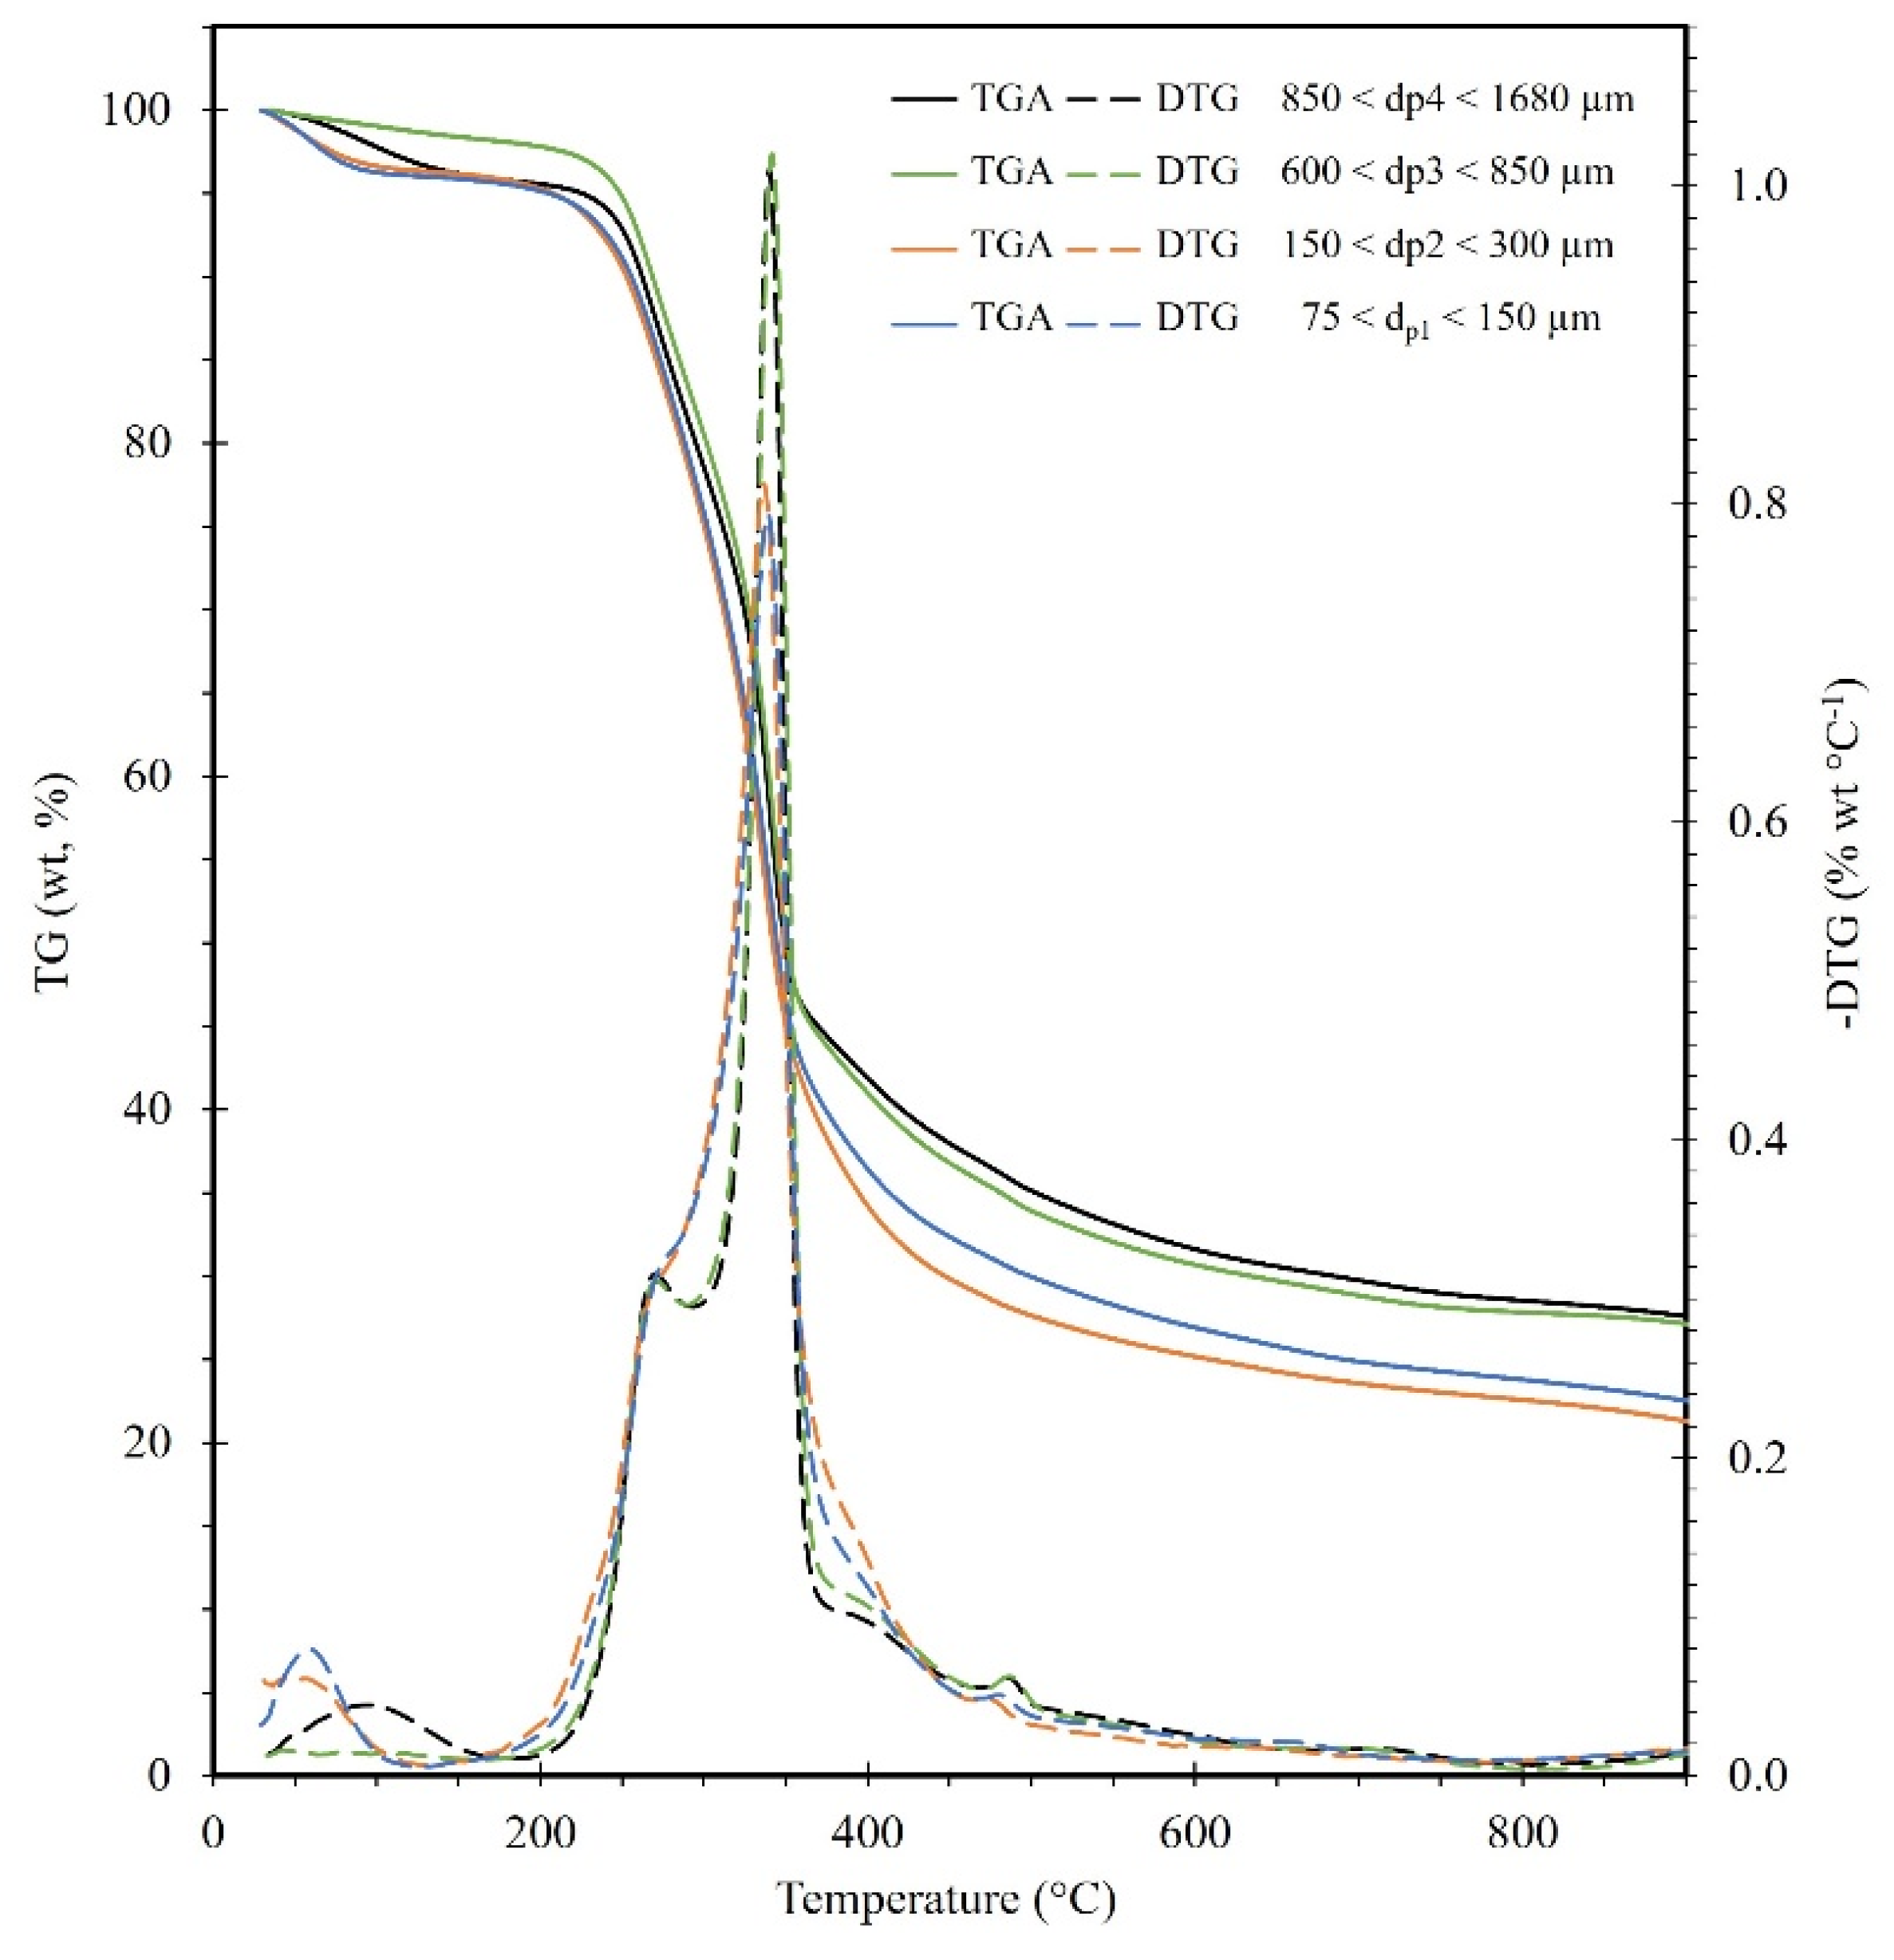
2.2.1. Particle Size Effect
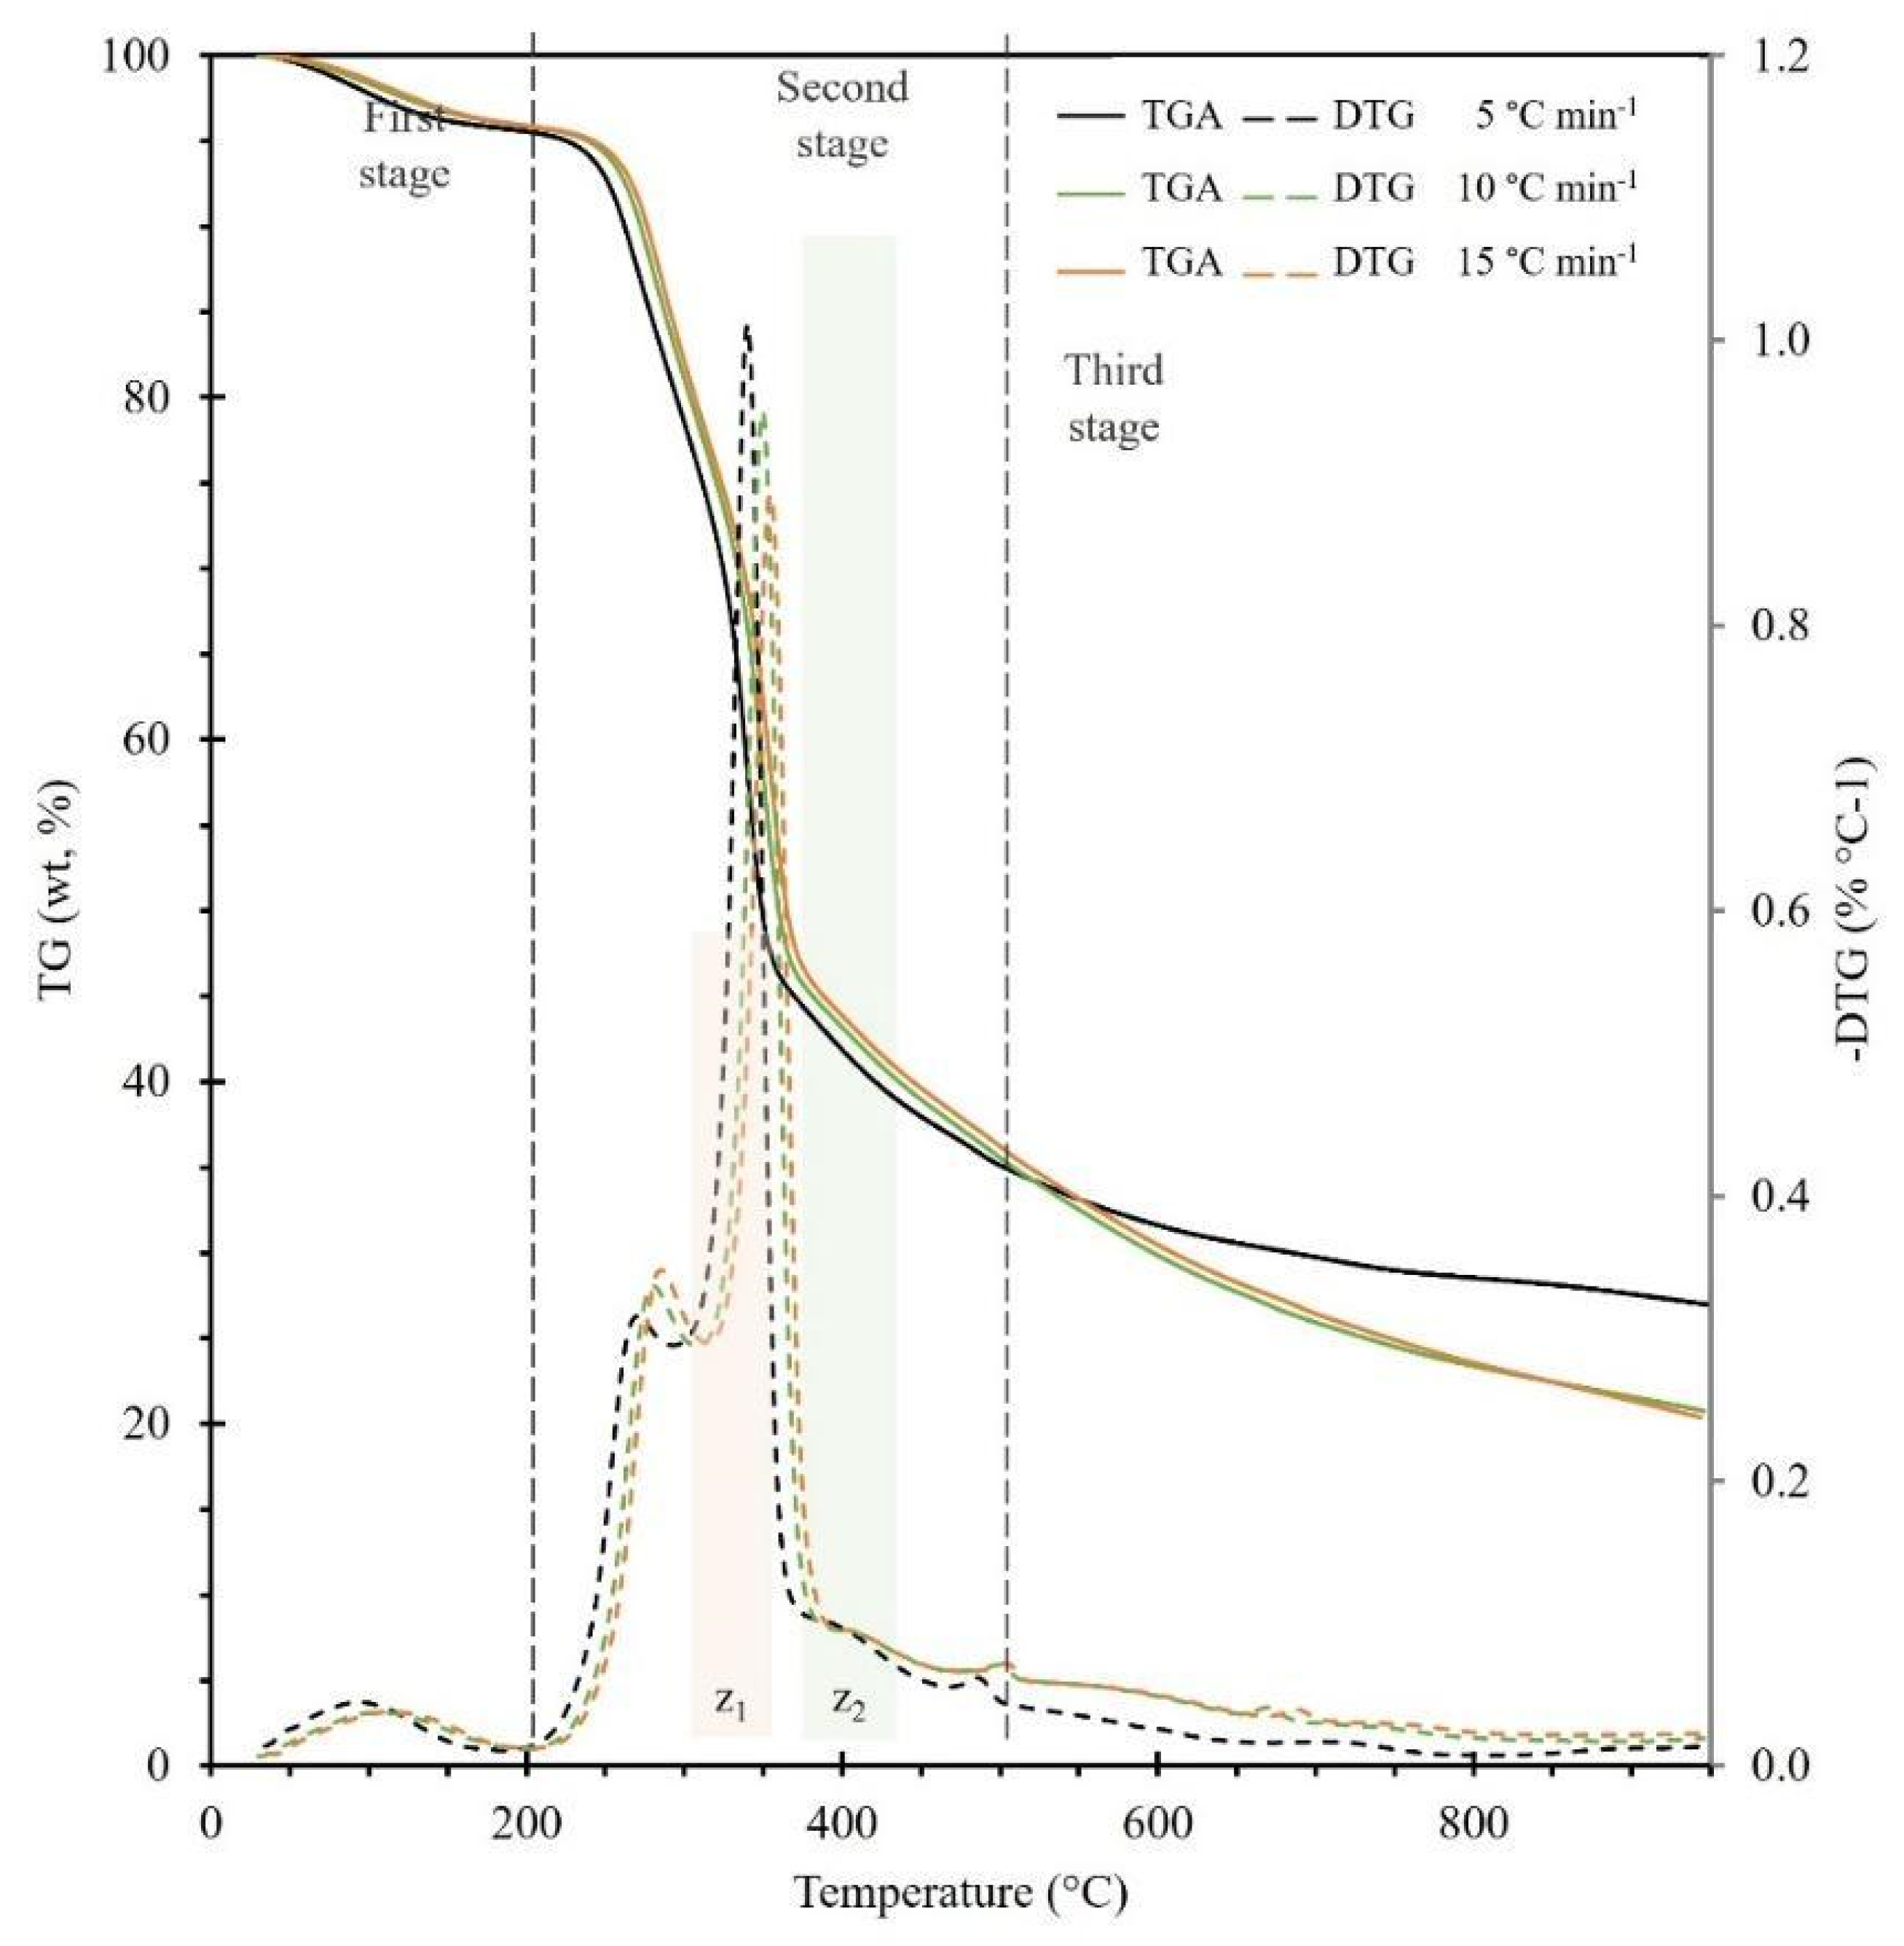
2.2.2. Heating Rates Effect
2.3. Kinetic Triplet Analysis
2.3.1. Apparent Activation Energy
2.3.2. Pre-Exponential Factor (Aα)
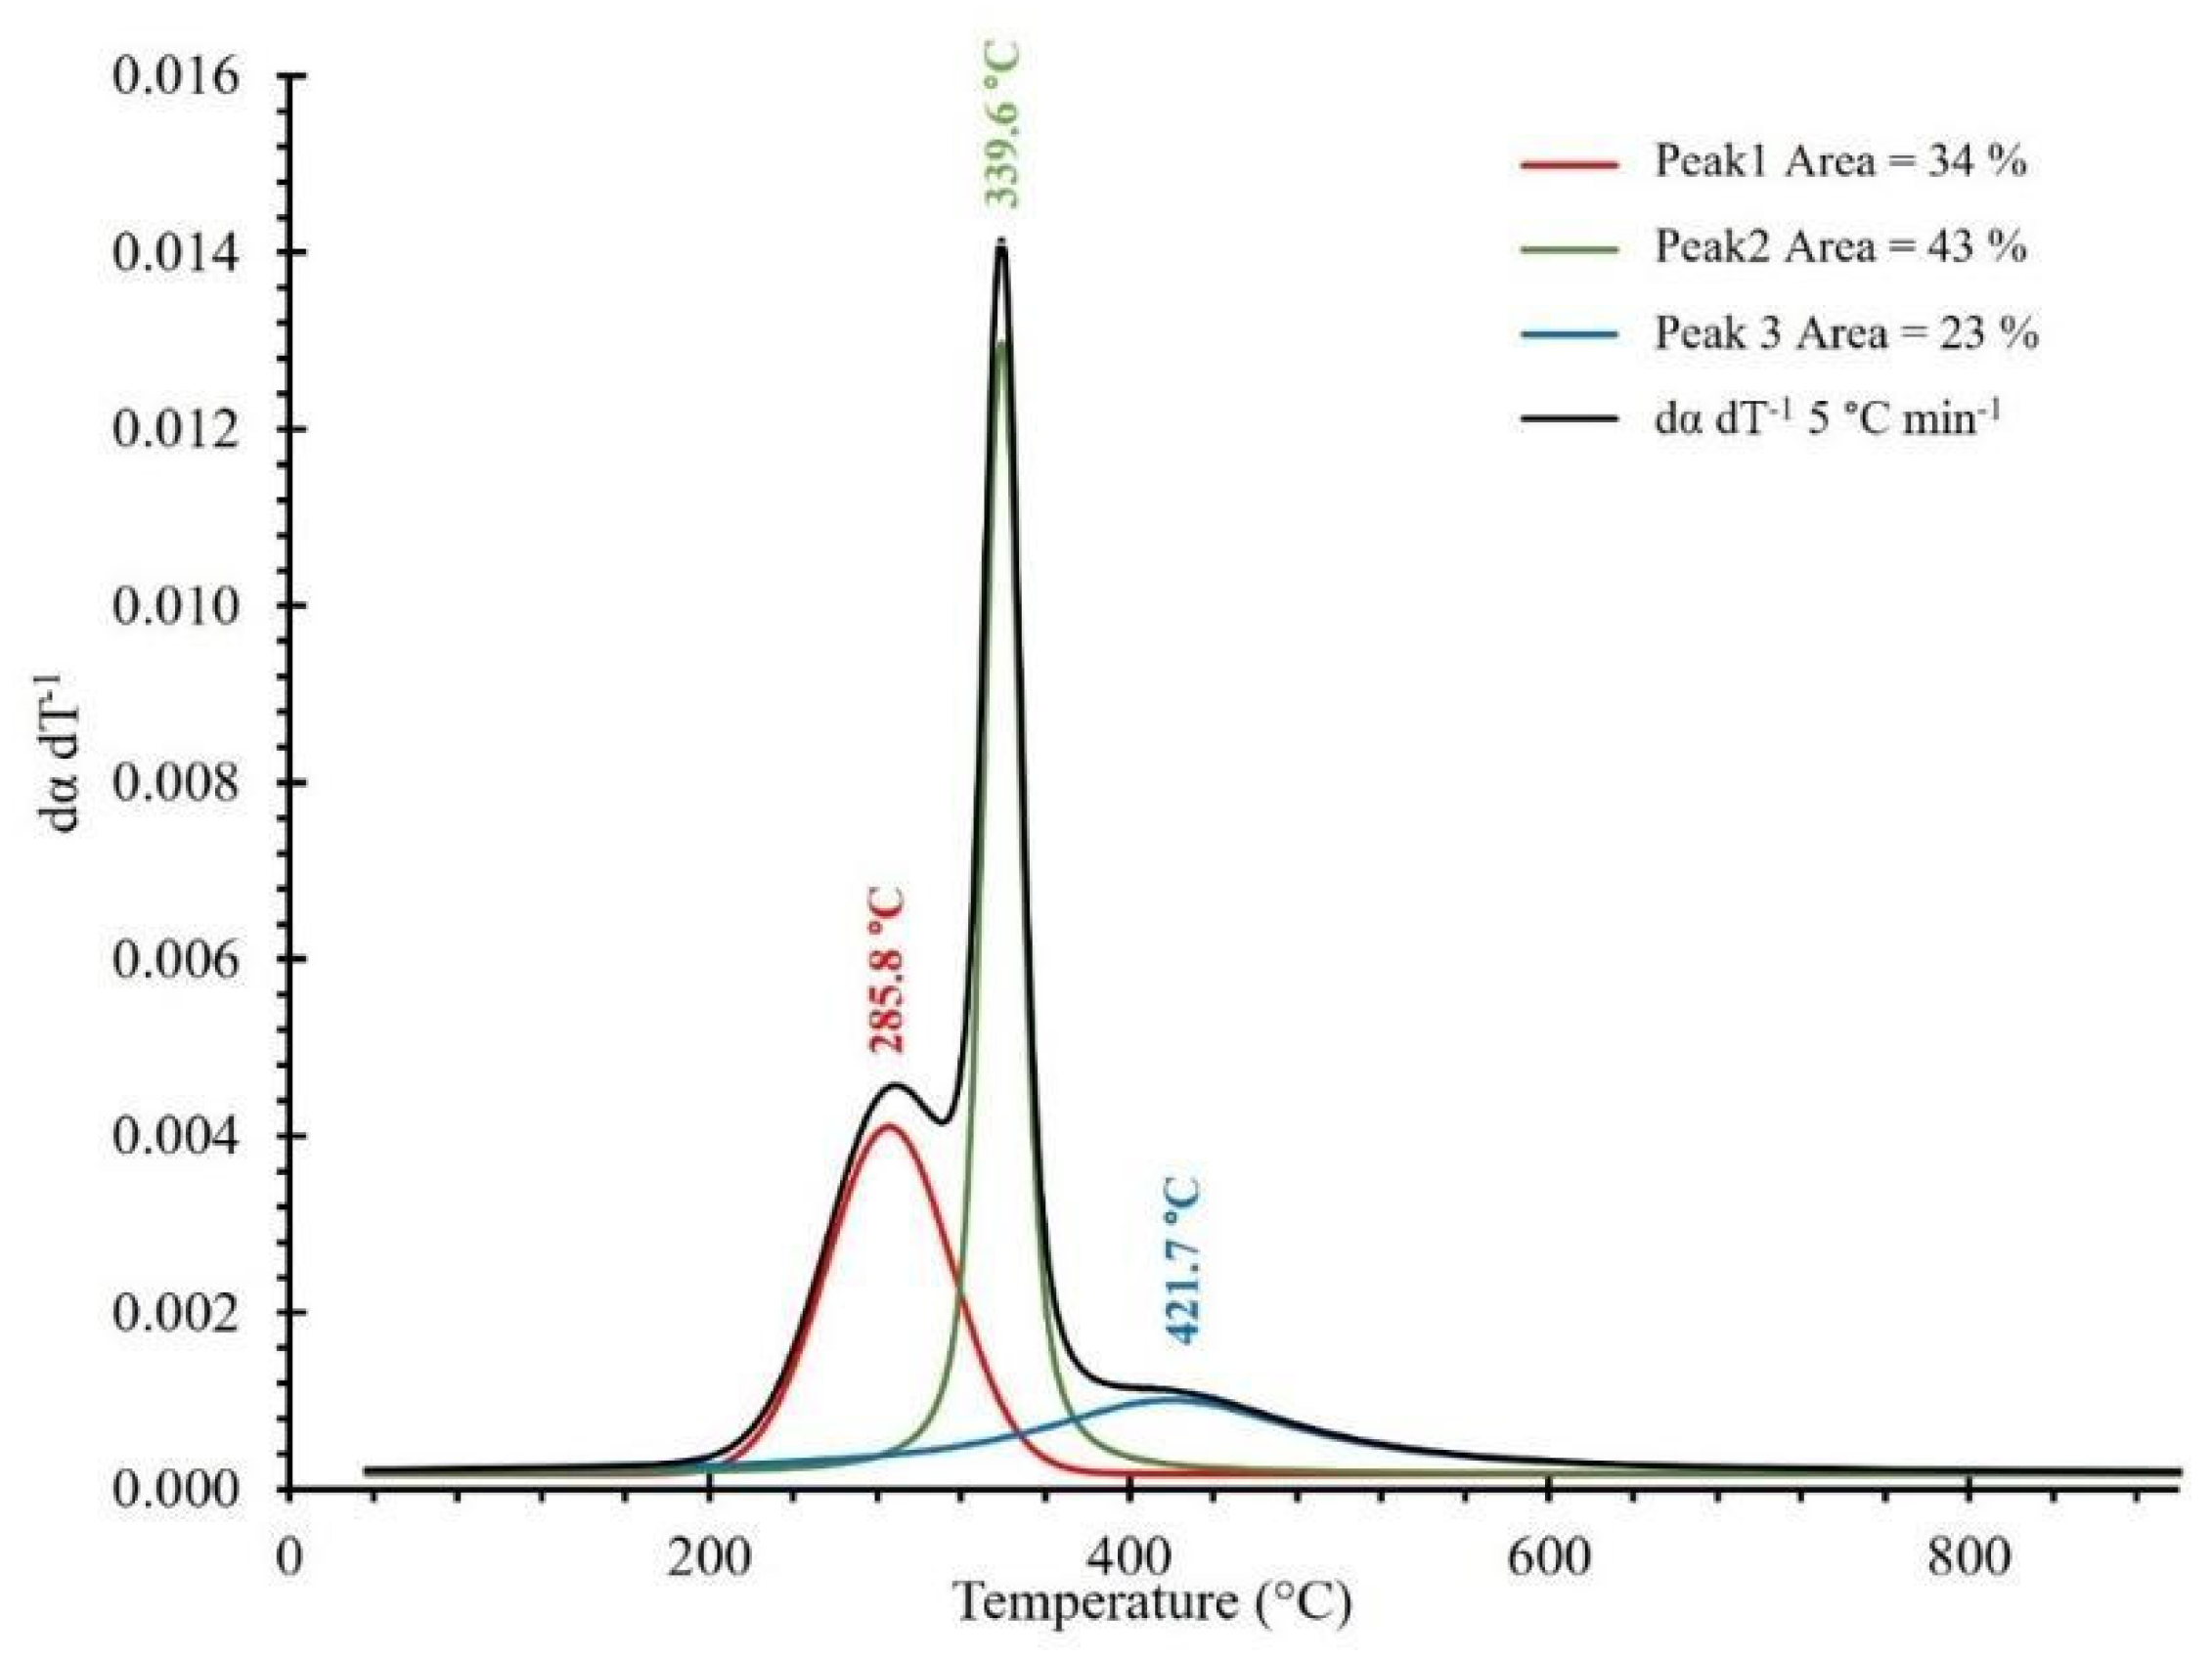
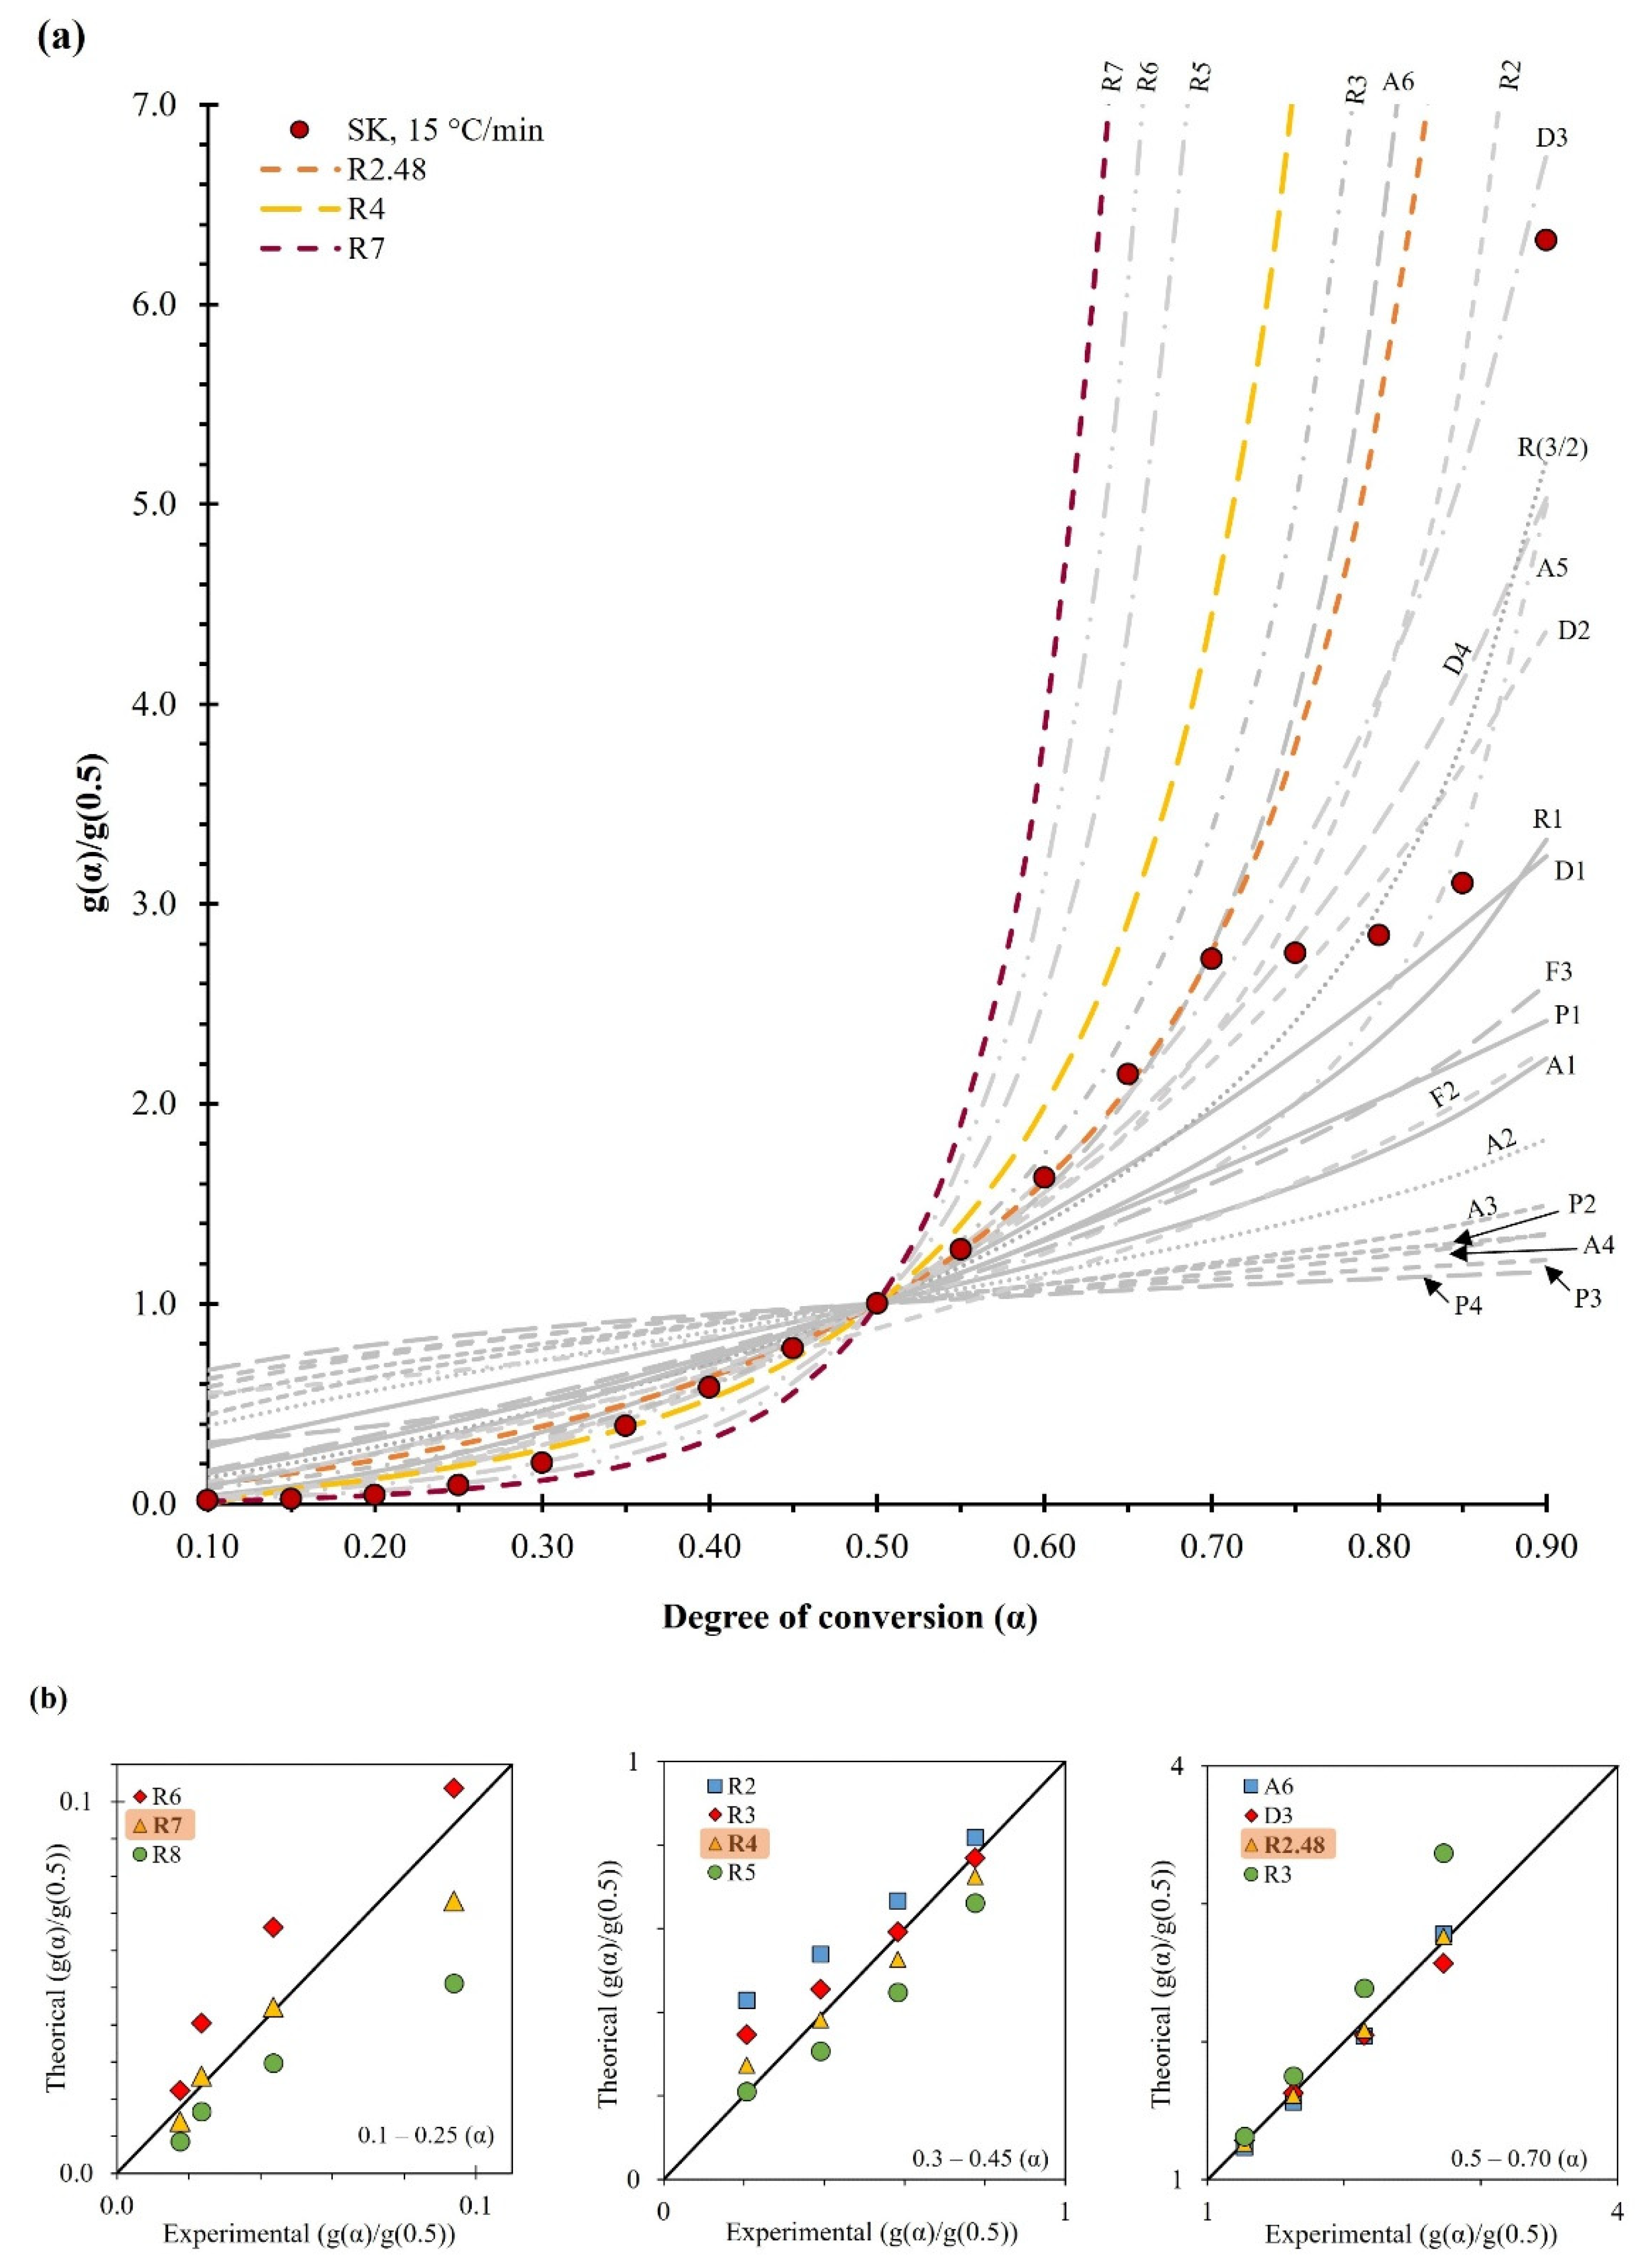
2.3.3. Reaction Model f(α)
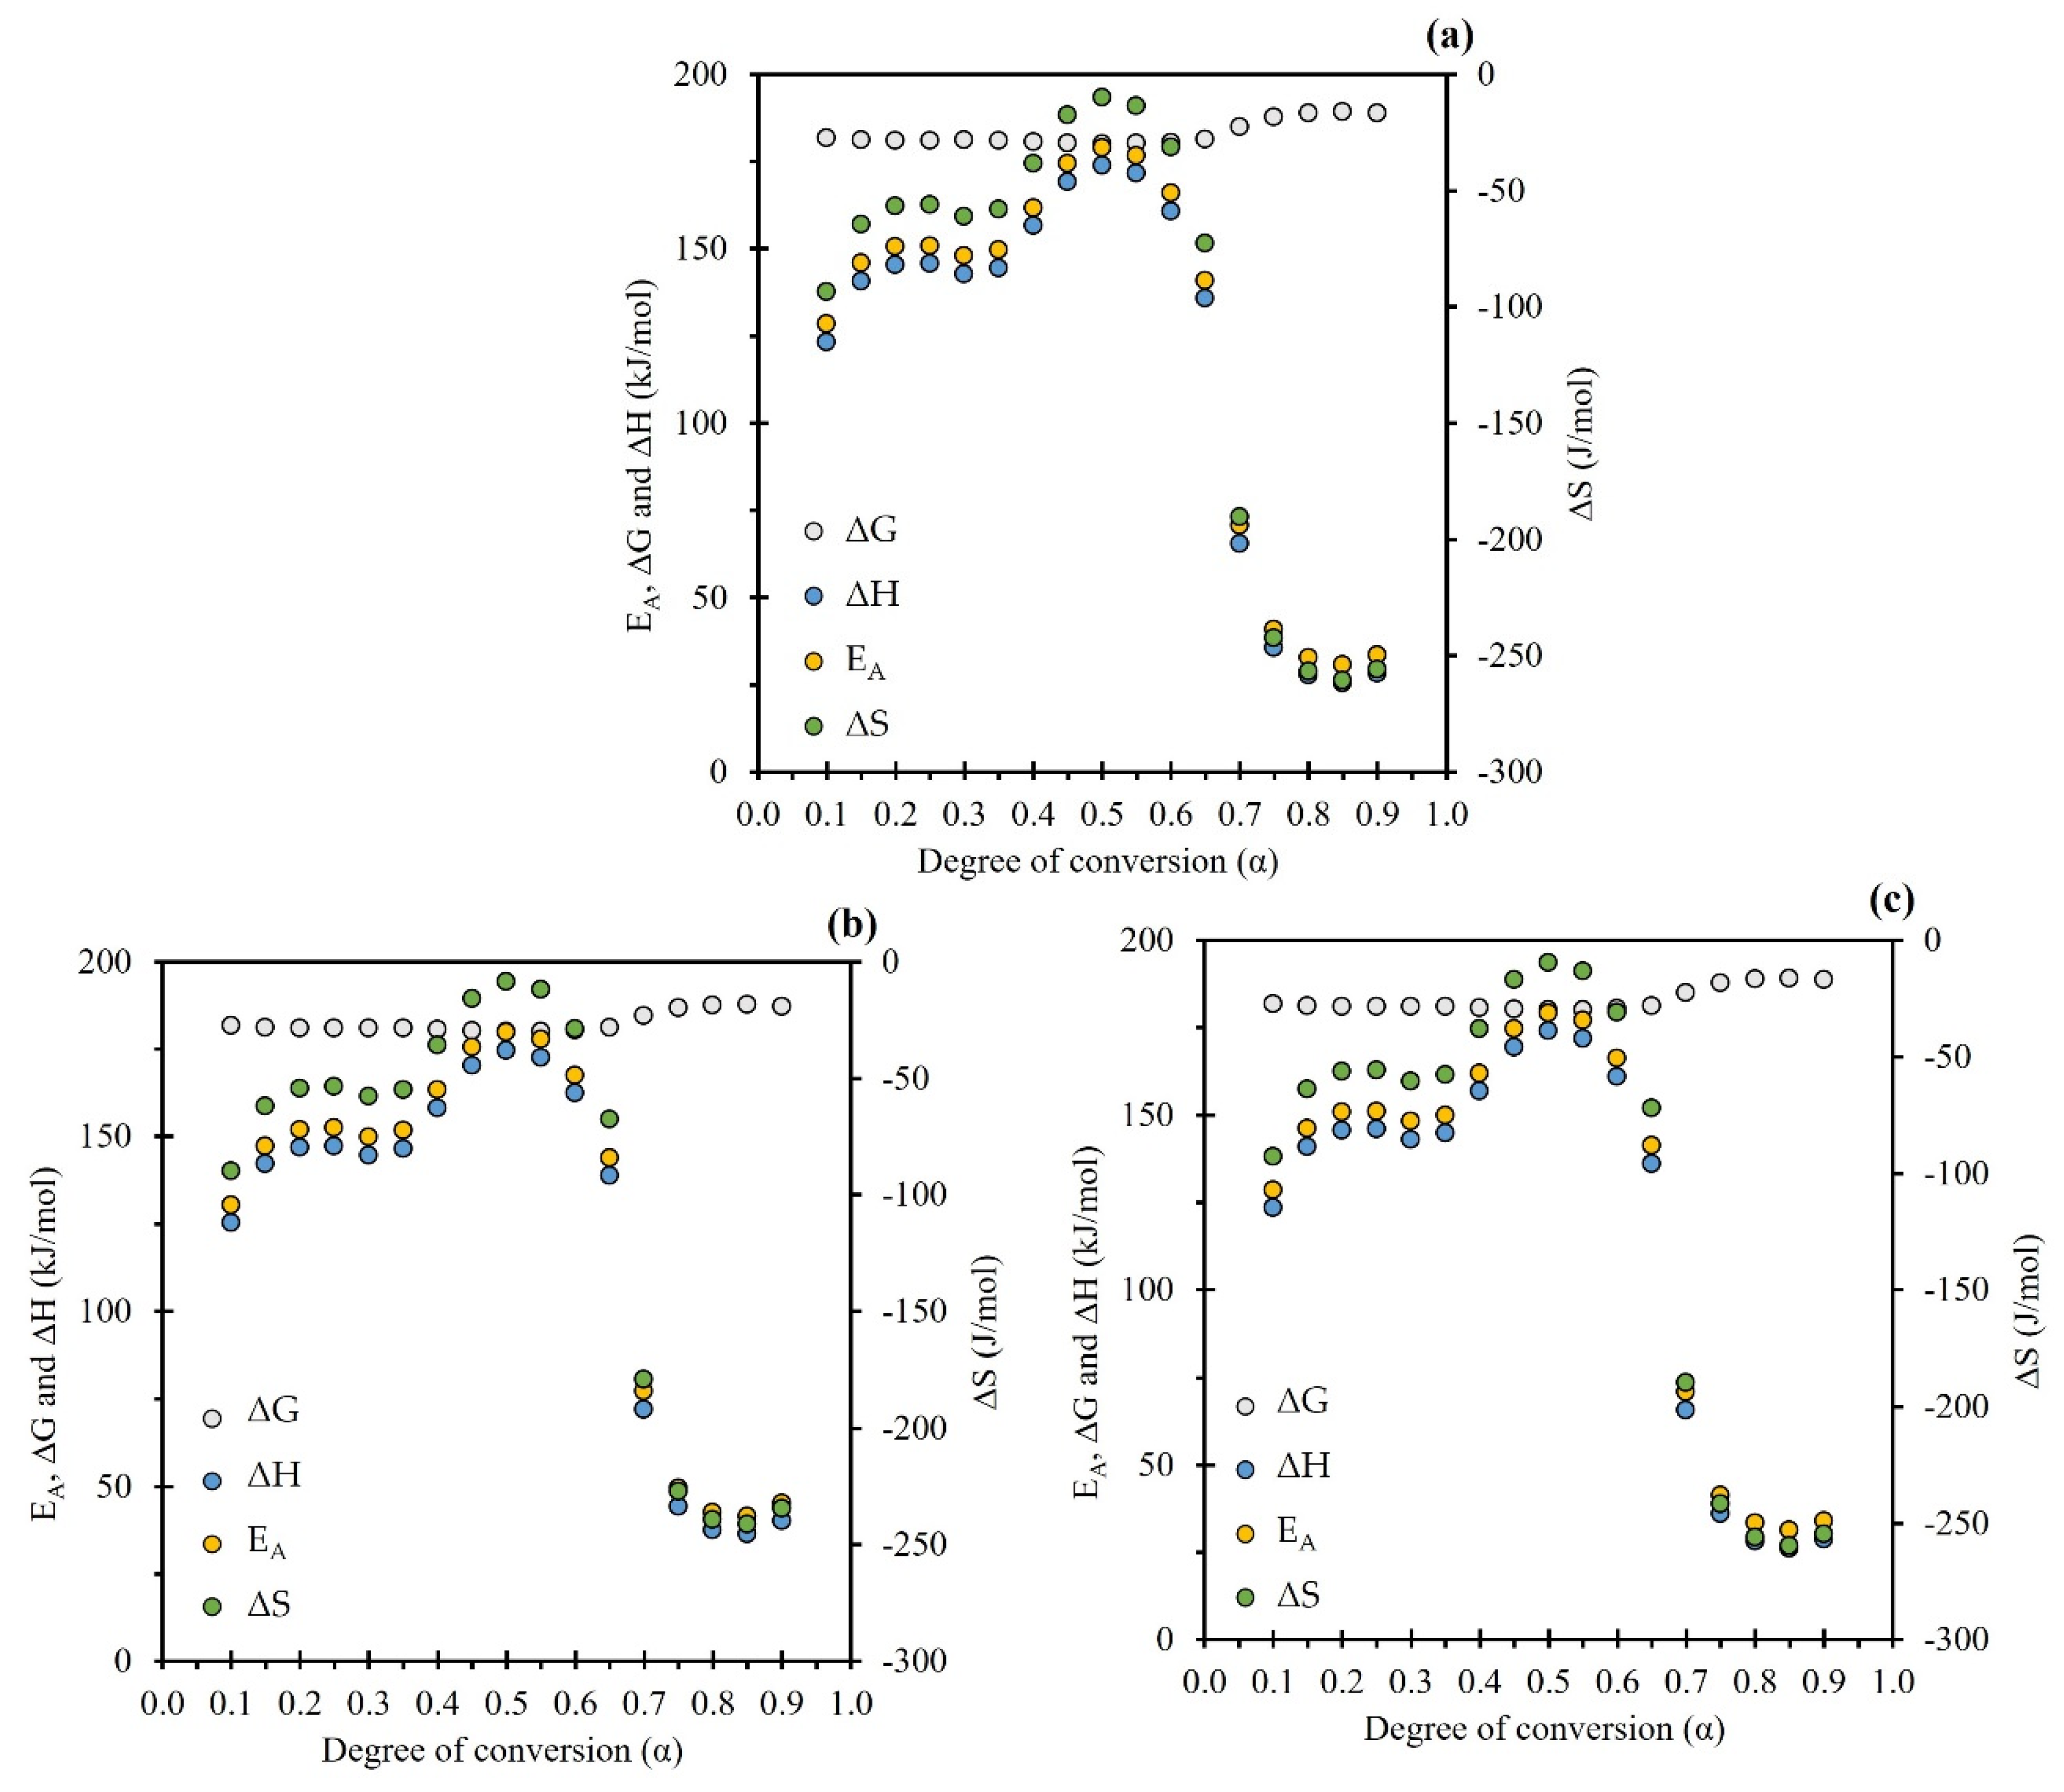
2.4. Thermodynamics Analysis
3. Materials and Methods
3.1. Feedstock Preparation and Characterization
3.2. Thermogravimetric Analysis
3.3. Kinetic Triplet Estimation
3.3.1. Estimation of Apparent Activation Energy (EA)
3.3.2. Estimation of the Pre-Exponential Factor (Aα)
3.3.3. Estimation of the Reaction Model
3.4. Estimation of Thermodynamic Parameters
4. Conclusions
Supplementary Materials
Author Contributions
Funding
Institutional Review Board Statement
Informed Consent Statement
Data Availability Statement
Acknowledgments
Conflicts of Interest
Sample Availability
References
- Luo, L.; Guo, X.; Zhang, Z.; Chai, M.; Rahman, M.M.; Zhang, X.; Cai, J. Insight into Pyrolysis Kinetics of Lignocellulosic Biomass: Isoconversional Kinetic Analysis by the Modified Friedman Method. Energy Fuels 2020, 34, 4874–4881. [Google Scholar] [CrossRef]
- Missaoui, A.; Bostyn, S.; Belandria, V.; Cagnon, B.; Sarh, B.; Gökalp, I. Hydrothermal Carbonization of Dried Olive Pomace: Energy Potential and Process Performances. J. Anal. Appl. Pyrolysis 2017, 128, 281–290. [Google Scholar] [CrossRef]
- Pravin Kumar, S.A.; Nagarajan, R.; Midhun Prasad, K.; Anand, B.; Murugavelh, S. Thermogravimetric Study and Kinetics of Banana Peel Pyrolysis: A Comparison of ‘Model-Free’ Methods. Biofuels 2022, 13, 129–138. [Google Scholar] [CrossRef]
- Singh, S.; Prasad Chakraborty, J.; Kumar Mondal, M. Intrinsic Kinetics, Thermodynamic Parameters and Reaction Mechanism of Non-Isothermal Degradation of Torrefied Acacia Nilotica Using Isoconversional Methods. Fuel 2020, 259, 116263. [Google Scholar] [CrossRef]
- Mishra, R.K.; Mohanty, K. Characterization of Non-Edible Lignocellulosic Biomass in Terms of Their Candidacy towards Alternative Renewable Fuels. Biomass Convers. Biorefin. 2018, 8, 799–812. [Google Scholar] [CrossRef]
- Sangaré, D.; Bostyn, S.; Moscosa Santillán, M.; García-Alamilla, P.; Belandria, V.; Gökalp, I. Comparative Pyrolysis Studies of Lignocellulosic Biomasses: Online Gas Quantification, Kinetics Triplets, and Thermodynamic Parameters of the Process. Bioresour. Technol. 2022, 346, 126598. [Google Scholar] [CrossRef]
- Agredano-De la Garza, C.S.; Balois-Morales, R.; Berumen-Varela, G.; León-Fernández, A.E.; Bautista-Rosales, P.U.; López-Guzmán, G.G.; Pérez-Ramírez, I.F. Physicochemical Characterization and Dietary Fiber of 15 Nance (Byrsonima Crassifolia L.) Fruits Selections from Nayarit. Sci. Hortic 2021, 289, 110460. [Google Scholar] [CrossRef]
- Espinosa-Rodríguez, M.Á.; Hidalgo-Millán, A.; Delgado-Delgado, R.; Olvera-Izaguirre, L.; Bernal-Jácome, L.A. Adsorción de Cd(II) y Pb(II) Presentes En Solución Acuosa Con Hueso de Nanche (Byrsonima Crassifolia). Rev. Colomb. Química 2020, 48, 30–36. [Google Scholar] [CrossRef]
- M, R.; G, F. Chemical and Aroma Determination of the Pulp and Seeds of Murici (Byrsonima Crassifolia L.). J. Braz. Chem. Soc. 2003, 14. [Google Scholar] [CrossRef]
- de Souza, V.R.; Pereira, P.A.P.; Queiroz, F.; Borges, S.V.; de Deus Souza Carneiro, J. Determination of Bioactive Compounds, Antioxidant Activity and Chemical Composition of Cerrado Brazilian Fruits. Food Chem. 2012, 134, 381–386. [Google Scholar] [CrossRef]
- Servicio de Información Agroalimentaria y Pesquera Sistema de Información Agroalimentaria de Consulta. Available online: https://www.gob.mx/siap/prensa/sistema-de-informacion-agroalimentaria-de-consulta-siacon (accessed on 10 June 2022).
- Caballero-Roque, A.; Gilber, V.; Pérez, J.; Escobar, R.; Ballinas, J. Uso de Nanche (Byrsonima Crassifolia (L.) Kunth) En Gelatina Artesanal Para Niños. Etnobiología 2012, 10, 50–55. [Google Scholar]
- Alves, J.L.F.; da Silva, J.C.G.; da Silva Filho, V.F.; Alves, R.F.; Ahmad, M.S.; Ahmad, M.S.; Galdino, W.V.d.A.; de Sena, R.F. Bioenergy Potential of Red Macroalgae Gelidium Floridanum by Pyrolysis: Evaluation of Kinetic Triplet and Thermodynamics Parameters. Bioresour. Technol. 2019, 291, 121892. [Google Scholar] [CrossRef] [PubMed]
- Ferreira, M.F.P.; Oliveira, B.F.H.; Pinheiro, W.B.S.; Correa, N.F.; França, L.F.; Ribeiro, N.F.P. Generation of Biofuels by Slow Pyrolysis of Palm Empty Fruit Bunches: Optimization of Process Variables and Characterization of Physical-Chemical Products. Biomass Bioenergy 2020, 140, 105707. [Google Scholar] [CrossRef]
- Cai, J.; Xu, D.; Dong, Z.; Yu, X.; Yang, Y.; Banks, S.W.; Bridgwater, A.V. Processing Thermogravimetric Analysis Data for Isoconversional Kinetic Analysis of Lignocellulosic Biomass Pyrolysis: Case Study of Corn Stalk. Renew. Sustain. Energy Rev. 2018, 82, 2705–2715. [Google Scholar] [CrossRef] [Green Version]
- Rasool, T.; Najar, I.; Srivastava, V.C.; Pandey, A. Pyrolysis of Almond (Prunus Amygdalus) Shells: Kinetic Analysis, Modelling, Energy Assessment and Technical Feasibility Studies. Bioresour. Technol. 2021, 337, 125466. [Google Scholar] [CrossRef]
- Açıkalın, K. Determination of Kinetic Triplet, Thermal Degradation Behaviour and Thermodynamic Properties for Pyrolysis of a Lignocellulosic Biomass. Bioresour. Technol. 2021, 337, 125438. [Google Scholar] [CrossRef]
- Mumbach, G.D.; Alves, J.L.F.; da Silva, J.C.G.; di Domenico, M.; de Sena, R.F.; Marangoni, C.; Machado, R.A.F.; Bolzan, A. Pyrolysis of Cocoa Shell and Its Bioenergy Potential: Evaluating the Kinetic Triplet, Thermodynamic Parameters, and Evolved Gas Analysis Using TGA-FTIR. Biomass Convers. Biorefin. 2022, 12, 723–739. [Google Scholar] [CrossRef]
- Guerrero, M.R.B.; Marques Da Silva Paula, M.; Zaragoza, M.M.; Gutiérrez, J.S.; Velderrain, V.G.; Ortiz, A.L.; Collins-Martínez, V. Thermogravimetric Study on the Pyrolysis Kinetics of Apple Pomace as Waste Biomass. Int. J. Hydrogen Energy 2014, 39, 16619–16627. [Google Scholar] [CrossRef]
- Singh, R.K.; Patil, T.; Sawarkar, A.N. Pyrolysis of Garlic Husk Biomass: Physico-Chemical Characterization, Thermodynamic and Kinetic Analyses. Bioresour. Technol. Rep. 2020, 12, 100558. [Google Scholar] [CrossRef]
- Mani, T.; Murugan, P.; Abedi, J.; Mahinpey, N. Pyrolysis of Wheat Straw in a Thermogravimetric Analyzer: Effect of Particle Size and Heating Rate on Devolatilization and Estimation of Global Kinetics. Chem. Eng. Res. Des. 2010, 88, 952–958. [Google Scholar] [CrossRef]
- Sangare, D.; Chartier, A.; Moscosa-Santillan, M.; Gökalp, I.; Bostyn, S. Kinetic Studies of Hydrothermal Carbonization of Avocado Stone and Analysis of the Polycyclic Aromatic Hydrocarbon Contents in the Hydrochars Produced. Fuel 2022, 316, 123163. [Google Scholar] [CrossRef]
- Friedman, H.L. Kinetics of Thermal Degradation of Char-Forming Plastics from Thermogravimetry. Application to a Phenolic Plastic. J. Polym. Sci. Part C: Polym. Symp. 1964, 6, 183–195. [Google Scholar] [CrossRef]
- Muravyev, N.V.; Vyazovkin, S. The Status of Pyrolysis Kinetics Studies by Thermal Analysis: Quality Is Not as Good as It Should and Can Readily Be. Thermo 2022, 2, 435–452. [Google Scholar] [CrossRef]
- White, J.E.; Catallo, W.J.; Legendre, B.L. Biomass Pyrolysis Kinetics: A Comparative Critical Review with Relevant Agricultural Residue Case Studies. J. Anal. Appl. Pyrolysis 2011, 91, 1–33. [Google Scholar] [CrossRef]
- Shimada, N.; Kawamoto, H.; Saka, S. Different Action of Alkali/Alkaline Earth Metal Chlorides on Cellulose Pyrolysis. J. Anal. Appl. Pyrolysis 2008, 81, 80–87. [Google Scholar] [CrossRef] [Green Version]
- Kumar, M.; Upadhyay, S.N.; Mishra, P.K. A Comparative Study of Thermochemical Characteristics of Lignocellulosic Biomasses. Bioresour. Technol. Rep. 2019, 8, 100186. [Google Scholar] [CrossRef]
- Dwivedi, K.K.; Prabhansu; Karmakar, M.K.; Chatterjee, P.K. Thermal Degradation, Characterization and Kinetic Modeling of Different Particle Size Coal through TGA. Therm. Sci. Eng. Prog. 2020, 18, 100523. [Google Scholar] [CrossRef]
- Luo, M.; Stanmore, B. The Combustion Characteristics of Char from Pulverized Bagasse. Fuel 1992, 71, 1074–1076. [Google Scholar] [CrossRef]
- Gašparovič, L.; Koreňová, Z.; Jelemenský, Ľ. Kinetic Study of Wood Chips Decomposition by TGA. Chem. Pap. 2010, 64, 174–181. [Google Scholar] [CrossRef]
- Yang, H.; Yan, R.; Chen, H.; Lee, D.H.; Zheng, C. Characteristics of Hemicellulose, Cellulose and Lignin Pyrolysis. Fuel 2007, 86, 1781–1788. [Google Scholar] [CrossRef]
- Du, Z.; Sarofim, A.F.; Longwell, J.P. Activation Energy Distribution in Temperature-Programmed Desorption: Modeling and Application to the Soot Oxygen System. Energy Fuels 1990, 4, 296–302. [Google Scholar] [CrossRef]
- Várhegyi, G.; Szabó, P.; Antal, M.J. Kinetics of the Thermal Decomposition of Cellulose under the Experimental Conditions of Thermal Analysis. Theoretical Extrapolations to High Heating Rates. Biomass Bioenergy 1994, 7, 69–74. [Google Scholar] [CrossRef] [Green Version]
- Kumi, A.G.; Ibrahim, M.G.; Nasr, M.; Fujii, M. Biochar Synthesis for Industrial Wastewater Treatment: A Critical Review. Mater. Sci. Forum 2020, 1008, 202–212. [Google Scholar] [CrossRef]
- Saffe, A.; Fernandez, A.; Mazza, G.; Rodriguez, R. Prediction of Regional Agro-Industrial Wastes Characteristics by Thermogravimetric Analysis to Obtain Bioenergy Using Thermal Process. Energy Explor. Exploit. 2018, 37, 544–557. [Google Scholar] [CrossRef] [Green Version]
- Perejón, A.; Sánchez-Jiménez, P.E.; Criado, J.M.; Pérez-Maqueda, L.A. Kinetic Analysis of Complex Solid-State Reactions. A New Deconvolution Procedure. J. Phys. Chem. B 2011, 115, 1780–1791. [Google Scholar] [CrossRef] [PubMed] [Green Version]
- Ceylan, S. Kinetic Analysis on the Non-Isothermal Degradation of Plum Stone Waste by Thermogravimetric Analysis and Integral Master-Plots Method. Waste Manag. Res. 2015, 33, 345–352. [Google Scholar] [CrossRef]
- el may, Y.; Jeguirim, M.; Dorge, S.; Trouvé, G.; Said, R. Study on the Thermal Behavior of Different Date Palm Residues: Characterization and Devolatilization Kinetics under Inert and Oxidative Atmospheres. Energy 2012, 44, 702–709. [Google Scholar] [CrossRef]
- García, G.B.; Calero De Hoces, M.; Martínez García, C.; Cotes Palomino, M.T.; Gálvez, A.R.; Martín-Lara, M.Á. Characterization and Modeling of Pyrolysis of the Two-Phase Olive Mill Solid Waste. Fuel Process. Technol. 2014, 126, 104–111. [Google Scholar] [CrossRef]
- Damartzis, T.; Vamvuka, D.; Sfakiotakis, S.; Zabaniotou, A. Thermal Degradation Studies and Kinetic Modeling of Cardoon (Cynara Cardunculus) Pyrolysis Using Thermogravimetric Analysis (TGA). Bioresour. Technol. 2011, 102, 6230–6238. [Google Scholar] [CrossRef]
- Amutio, M.; Lopez, G.; Aguado, R.; Artetxe, M.; Bilbao, J.; Olazar, M. Kinetic Study of Lignocellulosic Biomass Oxidative Pyrolysis. Fuel 2012, 95, 305–311. [Google Scholar] [CrossRef]
- Khunphakdee, P.; Korkerd, K.; Soanuch, C.; Chalermsinsuwan, B. Data-Driven Correlations of Higher Heating Value for Biomass, Waste and Their Combination Based on Their Elemental Compositions. Energy Rep. 2022, 8, 36–42. [Google Scholar] [CrossRef]
- Huang, Y.F.; Kuan, W.H.; Chiueh, P.T.; Lo, S.L. Pyrolysis of Biomass by Thermal Analysis–Mass Spectrometry (TA–MS). Bioresour. Technol. 2011, 102, 3527–3534. [Google Scholar] [CrossRef] [PubMed]
- Singh, R.K.; Pandey, D.; Patil, T.; Sawarkar, A.N. Pyrolysis of Banana Leaves Biomass: Physico-Chemical Characterization, Thermal Decomposition Behavior, Kinetic and Thermodynamic Analyses. Bioresour. Technol. 2020, 310, 123464. [Google Scholar] [CrossRef] [PubMed]
- Demirbaş, A. Calculation of Higher Heating Values of Biomass Fuels. Fuel 1997, 76, 431–434. [Google Scholar] [CrossRef]
- Vlaev, L.; Georgieva, V.; Tavlieva, M. On the Kinetic Mechanism of Non-Isothermal Degradation of Solids. In Reactions and Mechanisms in Thermal Analysis of Advanced Materials; Wiley: Hoboken, NJ, USA, 2015; pp. 547–578. ISBN 9781119117575. [Google Scholar]
- He, Y.; Qu, Y.; Liu, Q.; Li, P.; Fang, S.; Chen, J.; Chang, C. Characterization of Cornstalk and Bituminous Coal Based on Kinetic and Thermodynamic Parameter for Co-Pyrolysis. IOP Conf. Ser. Earth Environ. Sci. 2020, 555, 012001. [Google Scholar] [CrossRef]
- Chen, C.; Miao, W.; Zhou, C.; Wu, H. Thermogravimetric Pyrolysis Kinetics of Bamboo Waste via Asymmetric Double Sigmoidal (Asym2sig) Function Deconvolution. Bioresour. Technol. 2017, 225, 48–57. [Google Scholar] [CrossRef]
- Chen, D.; Zhou, J.; Zhang, Q. Effects of Heating Rate on Slow Pyrolysis Behavior, Kinetic Parameters and Products Properties of Moso Bamboo. Bioresour. Technol. 2014, 169, 313–319. [Google Scholar] [CrossRef]
- Saha, D.; Sinha, A.; Pattanayak, S.; Roy, B. Pyrolysis Kinetics and Thermodynamic Parameters of Plastic Grocery Bag Based on Thermogravimetric Data Using Iso-Conversional Methods. Int. J. Environ. Sci. Technol. 2022, 19, 391–406. [Google Scholar] [CrossRef]
- Daugaard, D.E.; Brown, R.C. Enthalpy for Pyrolysis for Several Types of Biomass. Energy Fuels 2003, 17, 934–939. [Google Scholar] [CrossRef] [Green Version]
- Alves, J.L.F.; da Silva, J.C.G.; Languer, M.P.; Batistella, L.; di Domenico, M.; da Silva Filho, V.F.; Moreira, R.d.F.P.M.; José, H.J. Assessing the Bioenergy Potential of High-Ash Anaerobic Sewage Sludge Using Pyrolysis Kinetics and Thermodynamics to Design a Sustainable Integrated Biorefinery. Biomass Convers. Biorefin. 2022, 12, 693–704. [Google Scholar] [CrossRef]
- Vyazovkin, S.; Burnham, A.K.; Criado, J.M.; Pérez-Maqueda, L.A.; Popescu, C.; Sbirrazzuoli, N. ICTAC Kinetics Committee Recommendations for Performing Kinetic Computations on Thermal Analysis Data. Thermochim. Acta 2011, 520. [Google Scholar] [CrossRef]
- Koga, N.; Vyazovkin, S.; Burnham, A.K.; Favergeon, L.; Muravyev, N.V.; Perez-Maqueda, L.A.; Saggese, C.; Sánchez-Jiménez, P.E. ICTAC Kinetics Committee Recommendations for Analysis of Thermal Decomposition Kinetics. Thermochim. Acta 2023, 719, 179384. [Google Scholar] [CrossRef]
- Kissinger, H.E. Reaction Kinetics in Differential Thermal Analysis. Anal. Chem. 1957, 29, 1702–1706. [Google Scholar] [CrossRef]
- Akahira, T.; Sunuse, T.T. Joint Convention of Four Electrical Institutes. Res. Rep. Chiba Inst. Technol. 1971, 16, 22–31. [Google Scholar]
- Ozawa, T. A New Method of Analyzing Thermogravimetric Data. Bull. Chem. Soc. Jpn. 1965, 38, 1881–1886. [Google Scholar] [CrossRef] [Green Version]
- Flynn, J.H.; Wall, L.A. A Quick, Direct Method for the Determination of Activation Energy from Thermogravimetric Data. J. Polym. Sci. B 1966, 4, 323–328. [Google Scholar] [CrossRef]
- Starink, M.J. The Determination of Activation Energy from Linear Heating Rate Experiments: A Comparison of the Accuracy of Isoconversion Methods. Thermochim. Acta 2003, 404, 163–176. [Google Scholar] [CrossRef]


| Elemental analysis (wt %, dry basis) | |
| C | 49.88 |
| H | 5.65 |
| N | 1.52 |
| O a | 42.95 |
| S | N.D. |
| Compositional analysis (wt %, dry extraibles-free basis) | |
| Cellulose a | 44.16 |
| Hemicellulose | 21.17 |
| Lignin | 34.67 |
| Extractibles with ethanol | 2.01 |
| Proximate analysis (wt %, dry basis) | |
| MC | 11.3 |
| VM | 71.7 |
| FC a | 14.8 |
| Ash | 2.2 |
| Ash composition (wt %) | |
| B | 0.23 |
| Ba | 0.42 |
| Ca | 6.66 |
| Co | 0.02 |
| Cr | 0.21 |
| Cu | 0.34 |
| Fe | 1.41 |
| K | 76.38 |
| Mg | 1.59 |
| Mn | 0.61 |
| Mo | 0.03 |
| Na | 7.95 |
| Ni | 0.26 |
| Si | 2.49 |
| Sr | 0.83 |
| Ti | 0.16 |
| Zn | 0.40 |
| Physical properties (dry basis) | |
| Bulk density (kg/m3) | 980 |
| Calorific Power (MJ/kg) | 14.93 |
| BCS sample (5 °C/min) | Dp1 | Dp2 | Dp3 | Dp4 |
| Particle size (µm) | 75–150 | 150–300 | 600–850 | 850–1680 |
| Peakmax.Temp. (°C) | 338.85 | 336.28 | 341.49 | 340.03 |
| DTGmax (%/°C) | 0.7932 | 0.8125 | 1.020 | 1.01 |
| Residue940°C (%) | 21.87 | 20.46 | 26.45 | 27.08 |
| BCS Dp4|Heating rate °C/min) | 5 °C/min | 10 °C/min | 15 °C/min | |
| Peakmax,1 Temp. (°C) | 269.98 | 280.55 | 285.45 | |
| Peakmax,2 Temp. (°C) | 340.03 | 394.56 | 354.54 | |
| DTGmax (%/°C) | 1.01 | 0.95 | 0.89 | |
| Residue940°C (%) | 27.08 | 20.86 | 20.48 |
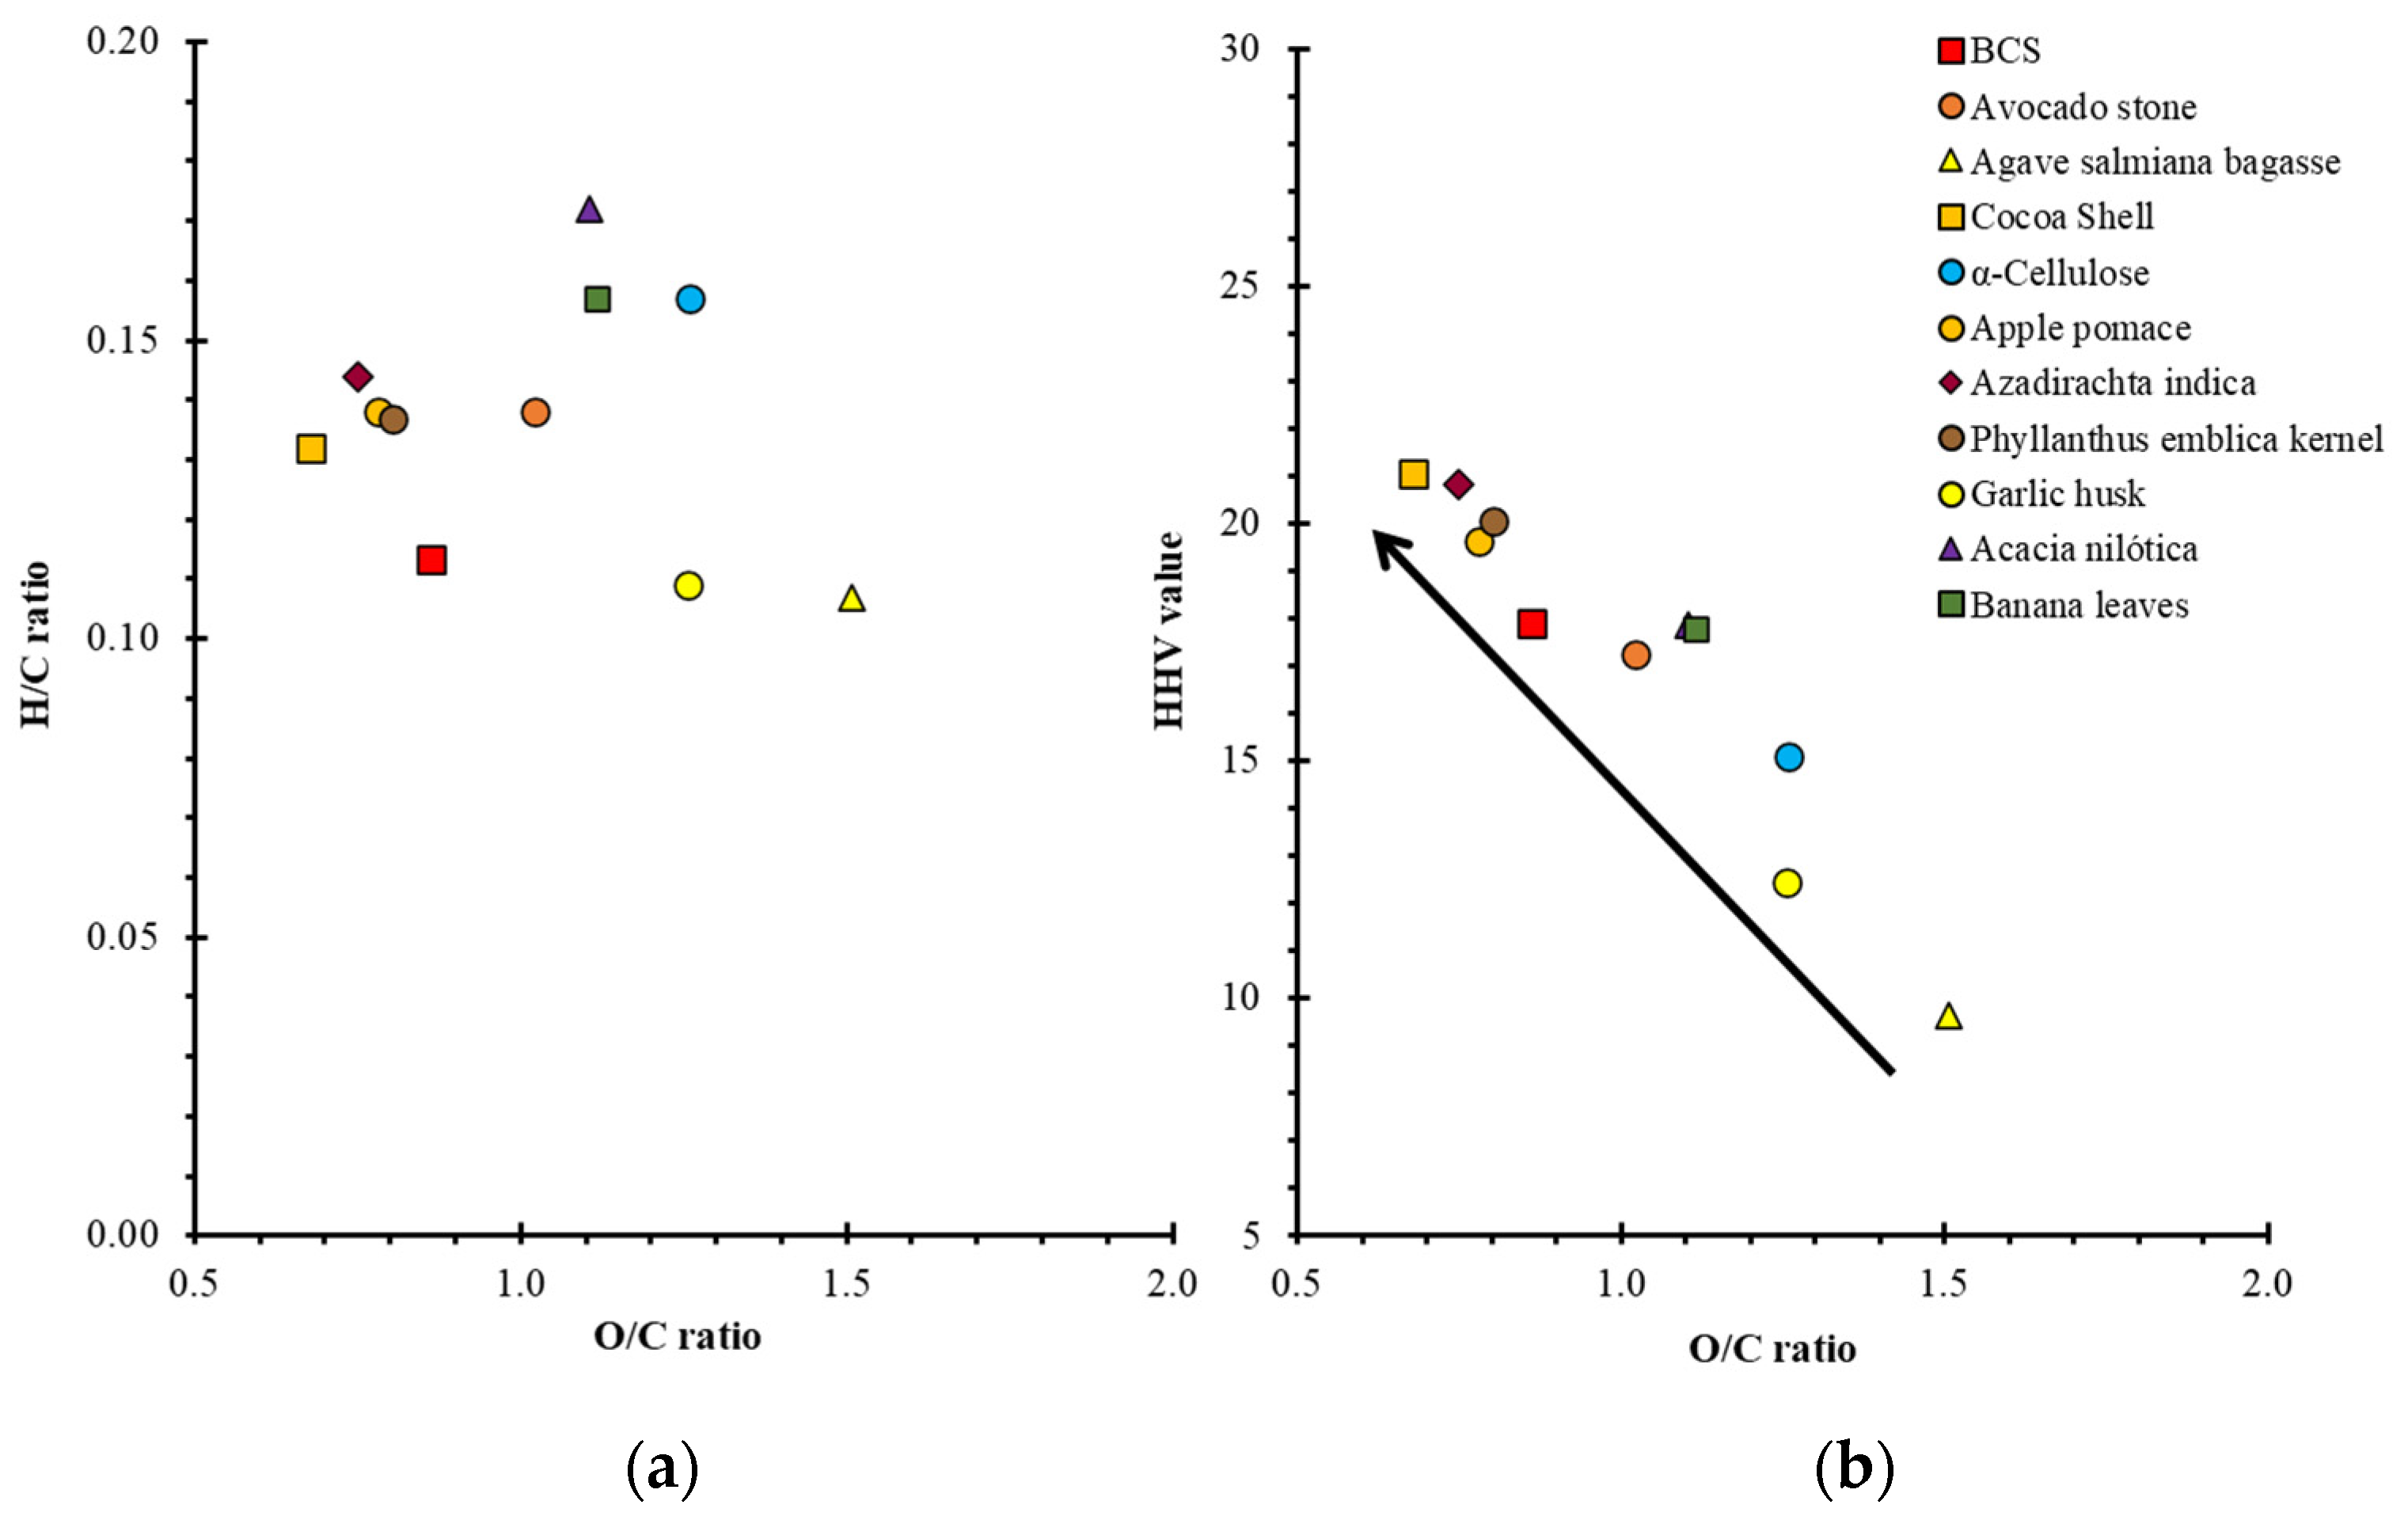
| Sample | EA (kJ/mol) | HE a (%) | CE b (%) | LI c (%) | O/C Ratio | H/C Ratio | HHV d (MJ/kg) | Reference |
|---|---|---|---|---|---|---|---|---|
| BCS | 122.7 e | 21.17 | 44.16 | 34.67 | 0.861 | 0.113 | 17.92 | This study |
| Avocado stone | 88.9 f | 76.4 | 3.0 | 17.0 | 1.021 | 0.138 | 17.24 | Sangaré et al. [6] |
| Agave salmiana bagasse | 111.6 f | 43.8 | 40.7 | 14.2 | 1.507 | 0.107 | 9.65 | |
| Cocoa Shell | 197.7 f | 45.4 | 7.8 | 21.5 | 0.678 | 0.132 | 21.06 | |
| α-Cellulose | 166.4 f | - | 100 | - | 1.258 | 0.157 | 15.10 | |
| Apple pomace | 194.8 f | 27.77 | 47.49 | 24.72 | 0.780 | 0.138 | 19.66 | Baray-Guerrero et al. [19] |
| Azadirachta indica | 193.7 f | 24.64 | 38.61 | 12.89 | 0.750 | 0.144 | 20.83 | Mishra et al. [5] |
| Phyllanthus emblica kernel | 195.1 f | 21.43 | 46.11 | 10.22 | 0.803 | 0.137 | 20.08 | |
| Garlic husk | 154.9 f | 29.34 | 41.32 | 17.14 | 1.255 | 0.109 | 12.46 | Singh et al. [20] |
| Acacia nilótica | 221.6 f | 28.64 | 41.66 | 24.20 | 1.105 | 0.172 | 17.86 | Singh et al. [4] |
| Banana leaves | 84 f | 34.34 | 43.34 | 15 | 1.116 | 0.157 | 17.80 | Singh et al. [44] |
| α | EA (kJ/mol) | Aα (min−1) | Gibbs Free Energy ΔG (kJ/mol): | Enthalpy ΔH (kJ/mol): | Entropy ΔS (J/mol): |
|---|---|---|---|---|---|
| 0.10 | 128.6 | 2.9 × 10¹⁰ | 181.8 | 123.3 | −93.1 |
| 0.15 | 146.1 | 9.6 × 10¹¹ | 181.1 | 140.9 | −64.1 |
| 0.20 | 150.8 | 2.5 × 10¹² | 180.9 | 145.6 | −56.3 |
| 0.25 | 151.1 | 2.6 × 10¹² | 180.9 | 145.9 | −55.9 |
| 0.30 | 148.1 | 1.4 × 10¹² | 181.0 | 142.9 | −60.7 |
| 0.35 | 149.9 | 2.1 × 10¹² | 181.0 | 144.7 | −57.8 |
| 0.40 | 161.9 | 2.2 × 10¹³ | 180.6 | 156.7 | −38.0 |
| 0.45 | 174.6 | 2.7 × 10¹⁴ | 180.2 | 169.4 | −17.1 |
| 0.50 | 179.2 | 6.7 × 10¹⁴ | 180.0 | 174.0 | −9.6 |
| 0.55 | 177.0 | 4.3 × 10¹⁴ | 180.1 | 171.7 | −13.3 |
| 0.60 | 166.1 | 5.1 × 10¹³ | 180.4 | 160.9 | −31.1 |
| 0.65 | 141.2 | 3.6 × 10¹¹ | 181.3 | 136.0 | −72.2 |
| 0.70 | 70.9 | 2.6 × 10⁵ | 184.9 | 65.7 | −189.8 |
| 0.75 | 41.2 | 5.1 × 10² | 187.7 | 36.0 | −241.7 |
| 0.80 | 33.3 | 9.0 × 101 | 188.8 | 28.1 | −256.1 |
| 0.85 | 31.2 | 5.7 × 101 | 189.1 | 26.0 | −259.9 |
| 0.90 | 34.0 | 1.0 × 10² | 188.7 | 28.8 | −254.8 |
| Average | 122.7 | 8.6 × 10¹³ | 182.8 | 117.4 | −104.2 |
Disclaimer/Publisher’s Note: The statements, opinions and data contained in all publications are solely those of the individual author(s) and contributor(s) and not of MDPI and/or the editor(s). MDPI and/or the editor(s) disclaim responsibility for any injury to people or property resulting from any ideas, methods, instructions or products referred to in the content. |
© 2023 by the authors. Licensee MDPI, Basel, Switzerland. This article is an open access article distributed under the terms and conditions of the Creative Commons Attribution (CC BY) license (https://creativecommons.org/licenses/by/4.0/).
Share and Cite
Sanchez-Silva, J.M.; Ocampo-Pérez, R.; Padilla-Ortega, E.; Sangaré, D.; Escobedo-Bretado, M.A.; Domínguez-Arvizu, J.L.; Hernández-Majalca, B.C.; Salinas-Gutiérrez, J.M.; López-Ortiz, A.; Collins-Martínez, V. Pyrolysis Kinetics of Byrsonima crassifolia Stone as Agro-Industrial Waste through Isoconversional Models. Molecules 2023, 28, 544. https://doi.org/10.3390/molecules28020544
Sanchez-Silva JM, Ocampo-Pérez R, Padilla-Ortega E, Sangaré D, Escobedo-Bretado MA, Domínguez-Arvizu JL, Hernández-Majalca BC, Salinas-Gutiérrez JM, López-Ortiz A, Collins-Martínez V. Pyrolysis Kinetics of Byrsonima crassifolia Stone as Agro-Industrial Waste through Isoconversional Models. Molecules. 2023; 28(2):544. https://doi.org/10.3390/molecules28020544
Chicago/Turabian StyleSanchez-Silva, Jonathan M., Raúl Ocampo-Pérez, Erika Padilla-Ortega, Diakaridia Sangaré, Miguel A. Escobedo-Bretado, Jorge L. Domínguez-Arvizu, Blanca C. Hernández-Majalca, Jesús M. Salinas-Gutiérrez, Alejandro López-Ortiz, and Virginia Collins-Martínez. 2023. "Pyrolysis Kinetics of Byrsonima crassifolia Stone as Agro-Industrial Waste through Isoconversional Models" Molecules 28, no. 2: 544. https://doi.org/10.3390/molecules28020544