
Contribution of Reliable Chromatographic Data in QSAR for Modelling Bisphenol Transport across the Human Placenta Barrier
Abstract
:
1. Introduction
2. Results
2.1. Data Collection
2.1.1. Clearance Indices
2.1.2. Molecular Descriptors
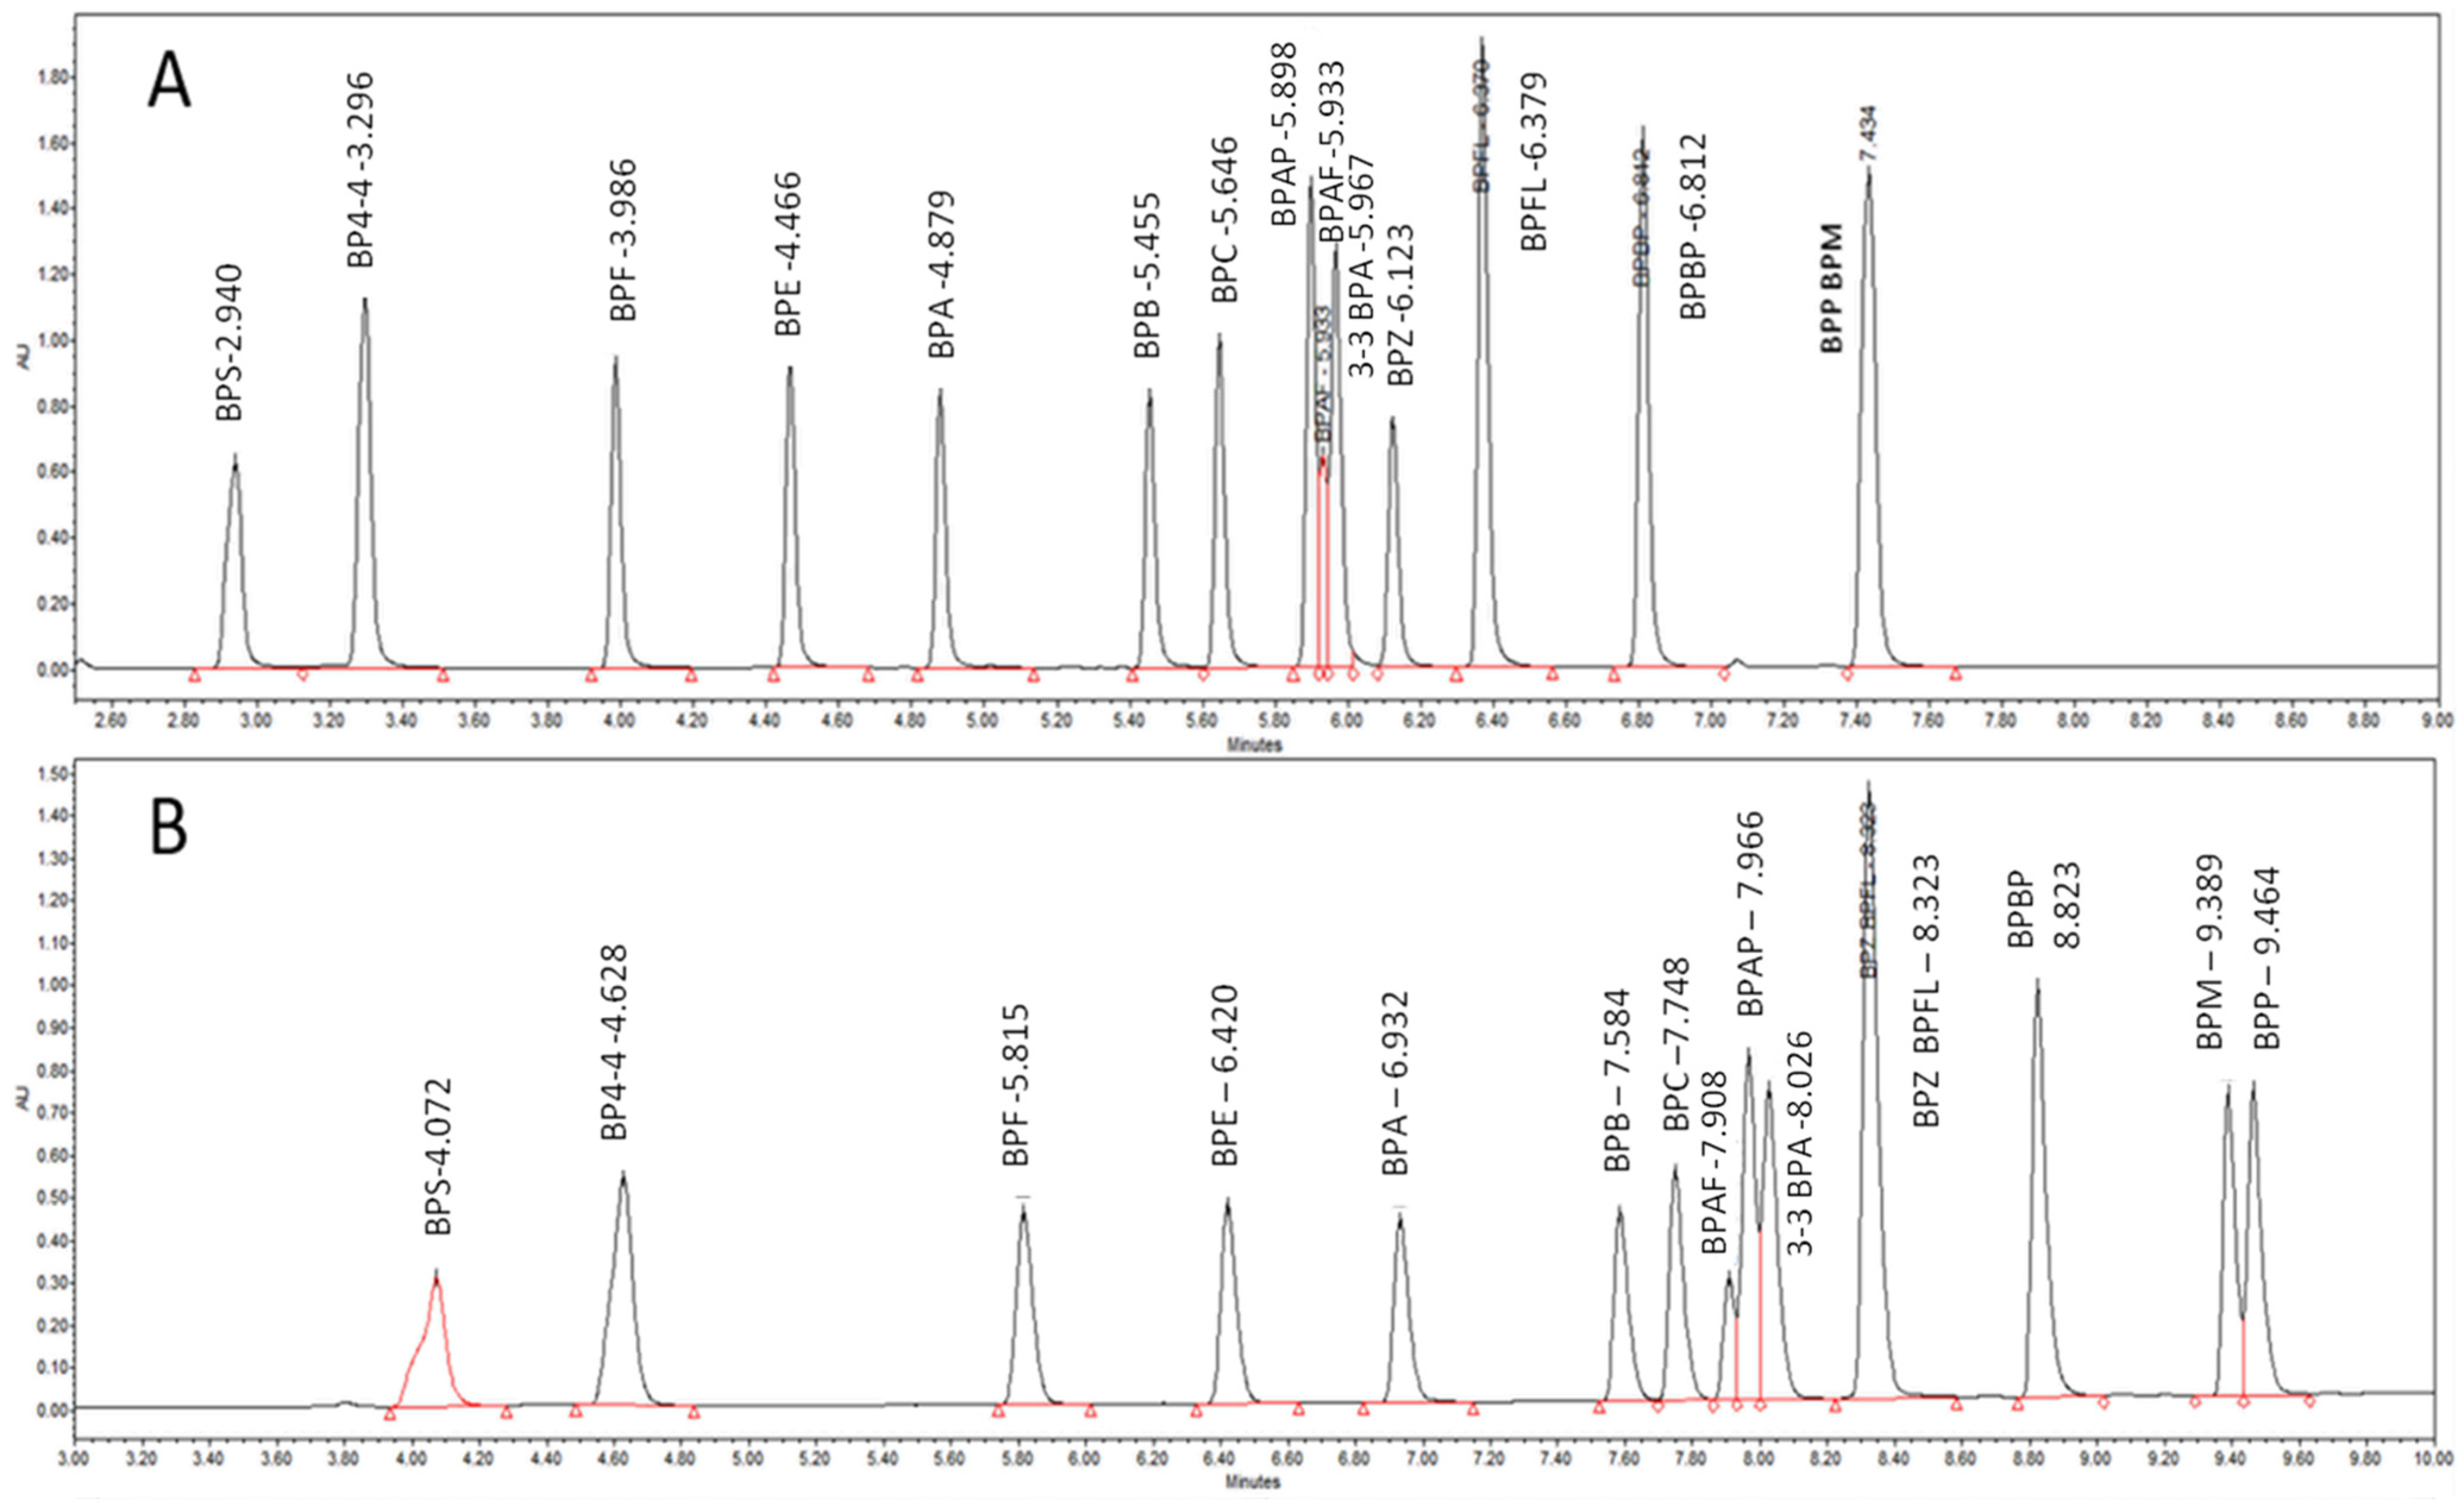
2.1.3. Chromatographic Descriptors
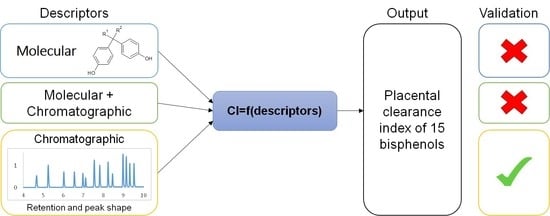
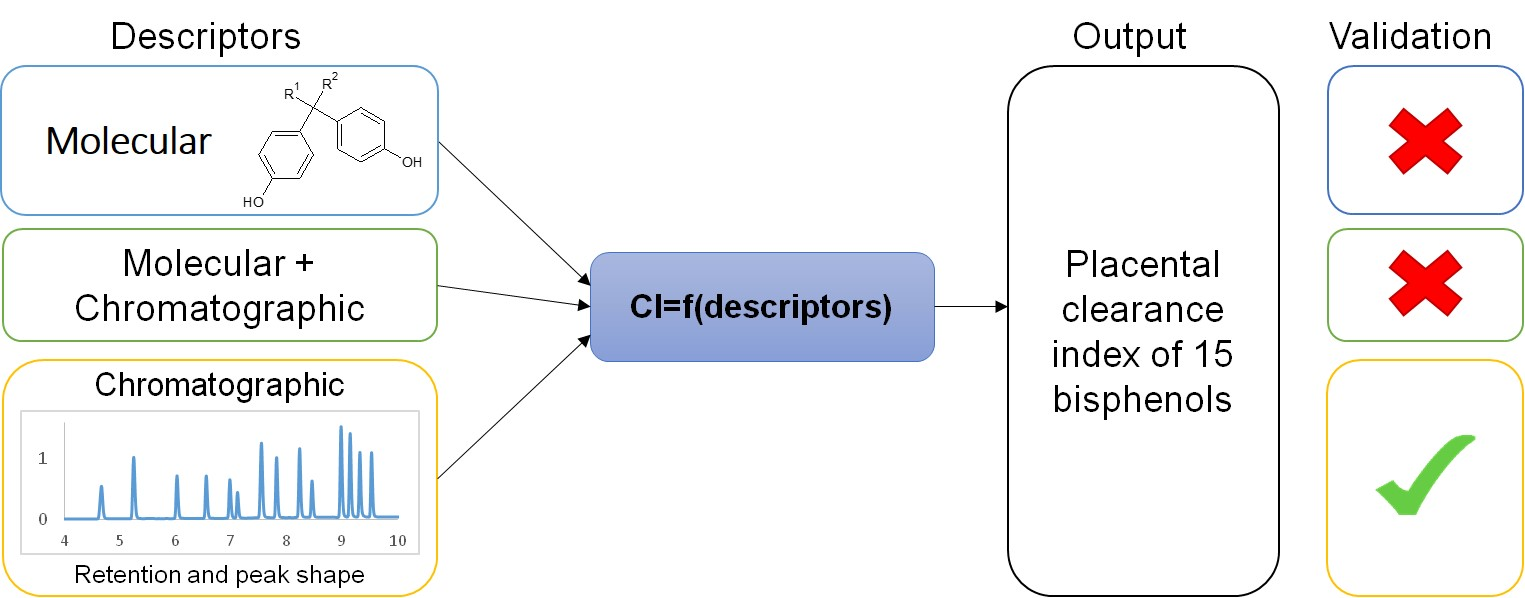
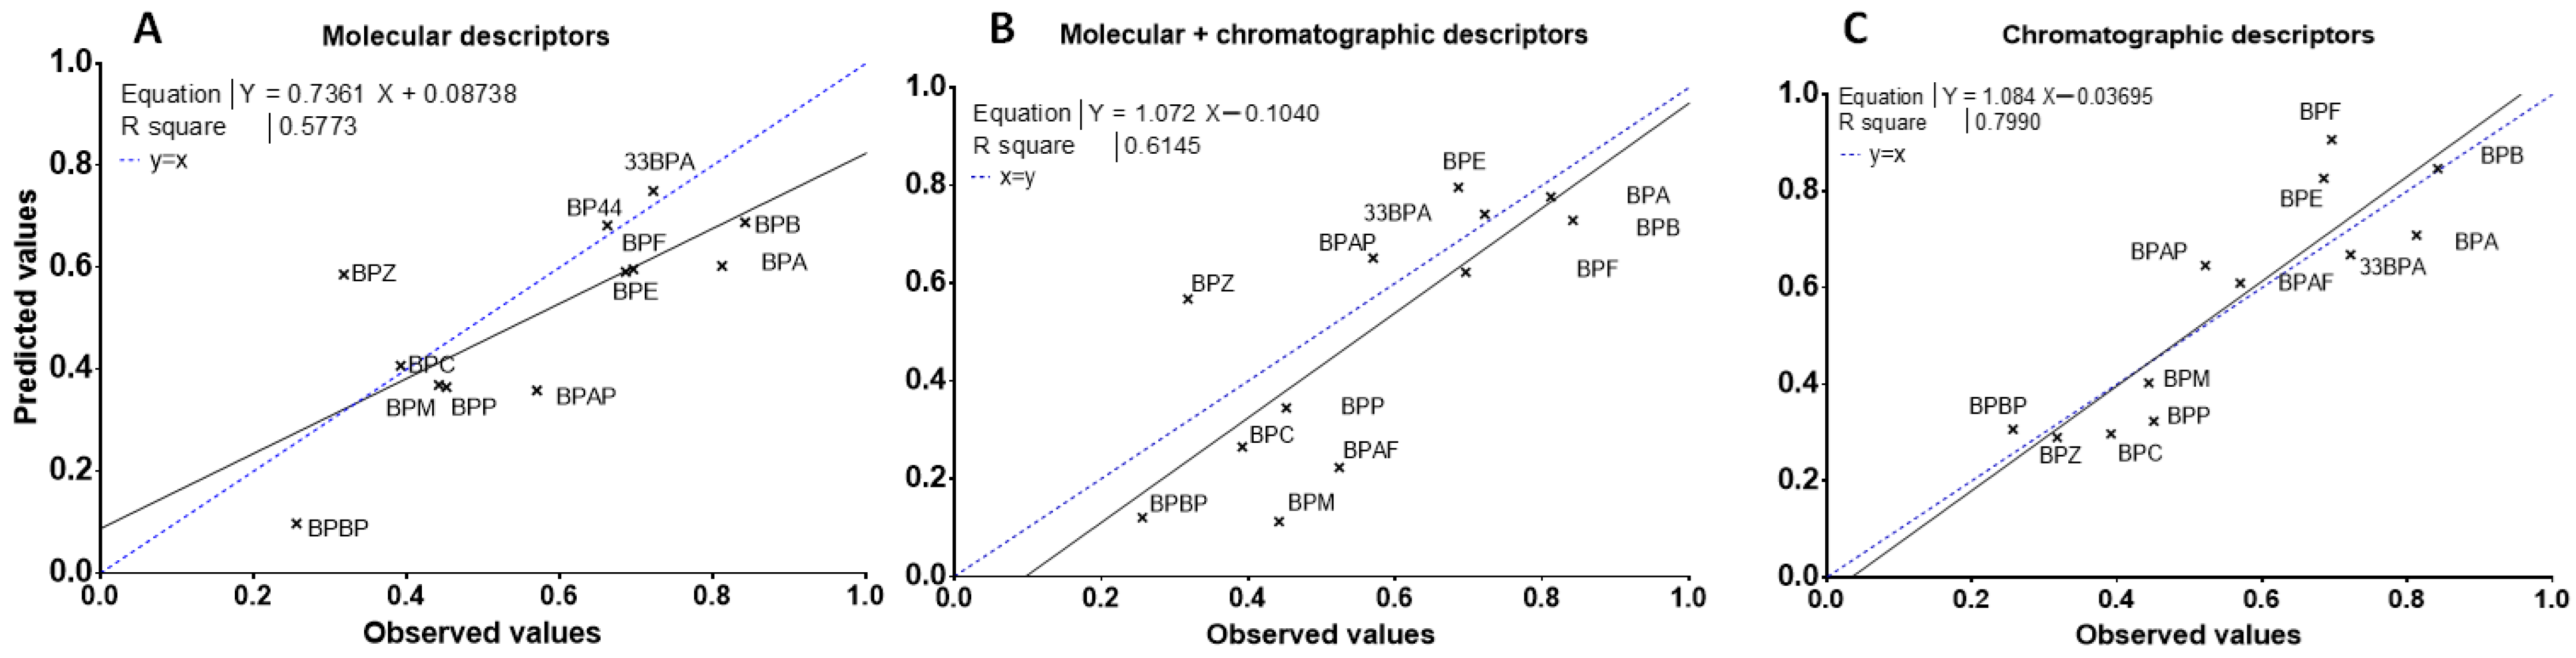
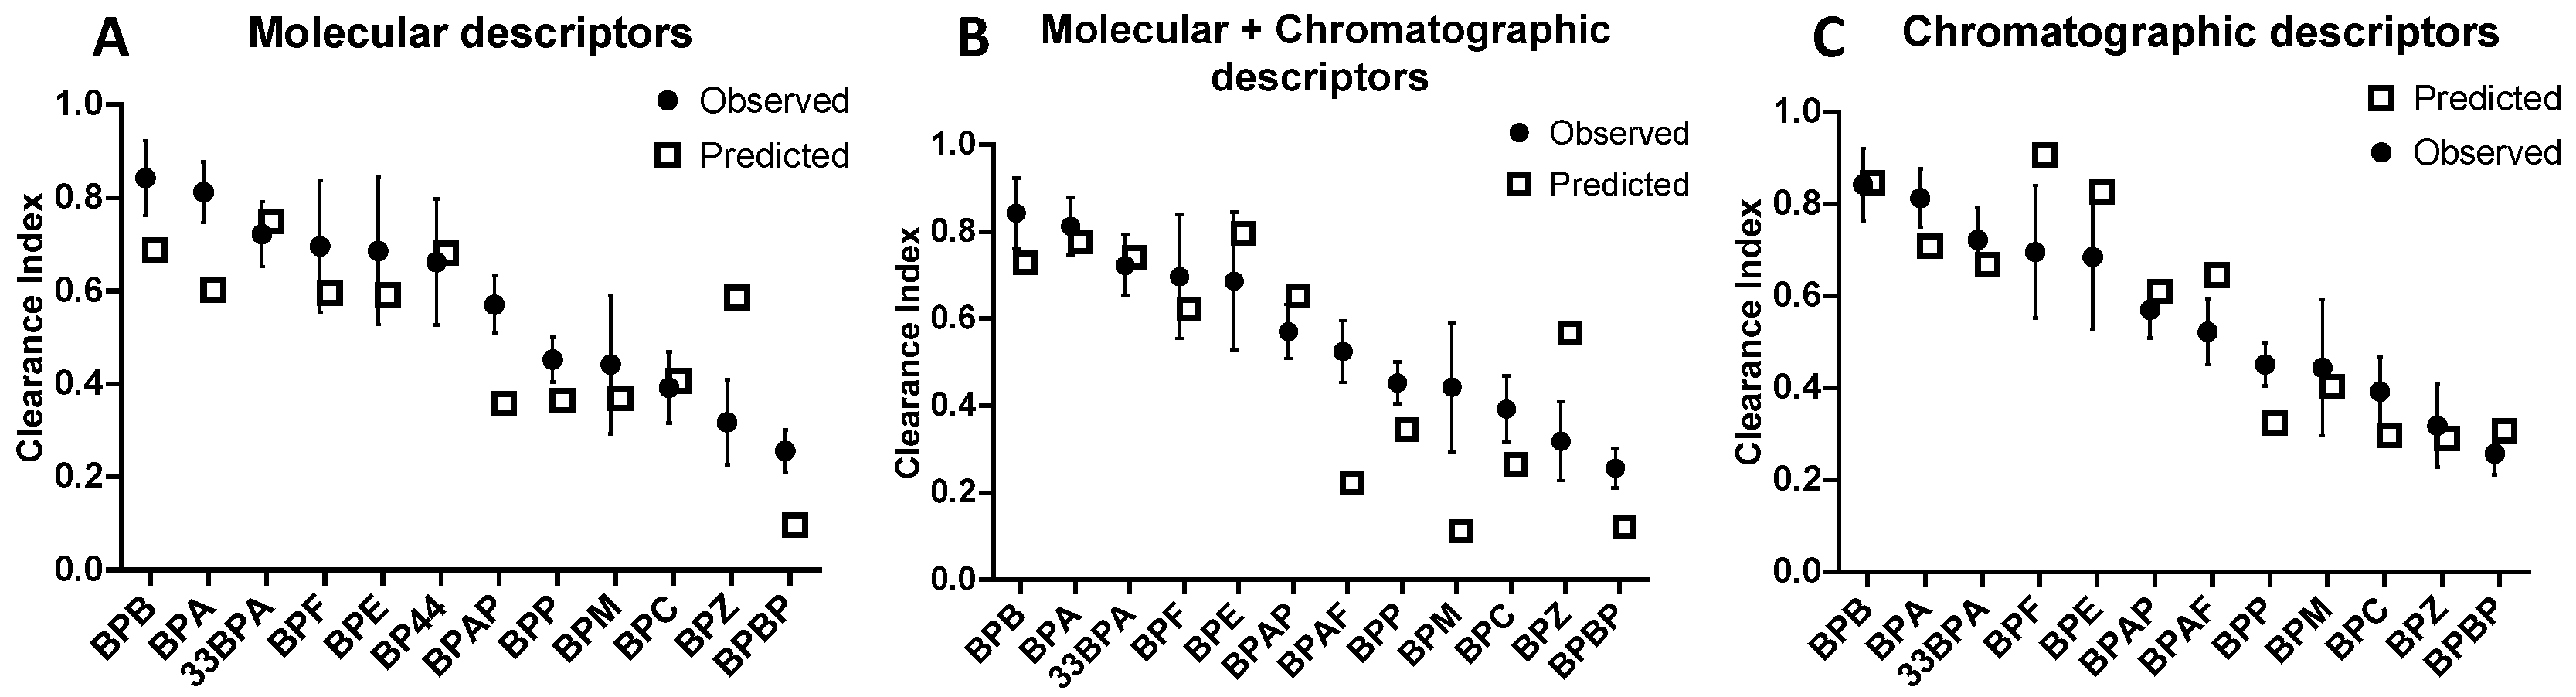
2.2. QSAR Modelling
2.2.1. Molecular Descriptors in the QSAR Model for Predicting Placental Passage
2.2.2. Combining Chromatographic Descriptors and Molecular Descriptors in the QSAR Model for Predicting Placental Passage
RCBA8 − 0.27 × PFPM2 + 0.23 × PFPM7
2.2.3. Chromatographic Descriptors in the QSAR Model for Predicting Placental Passage
3. Discussion
4. Materials and Methods
4.1. Data Set
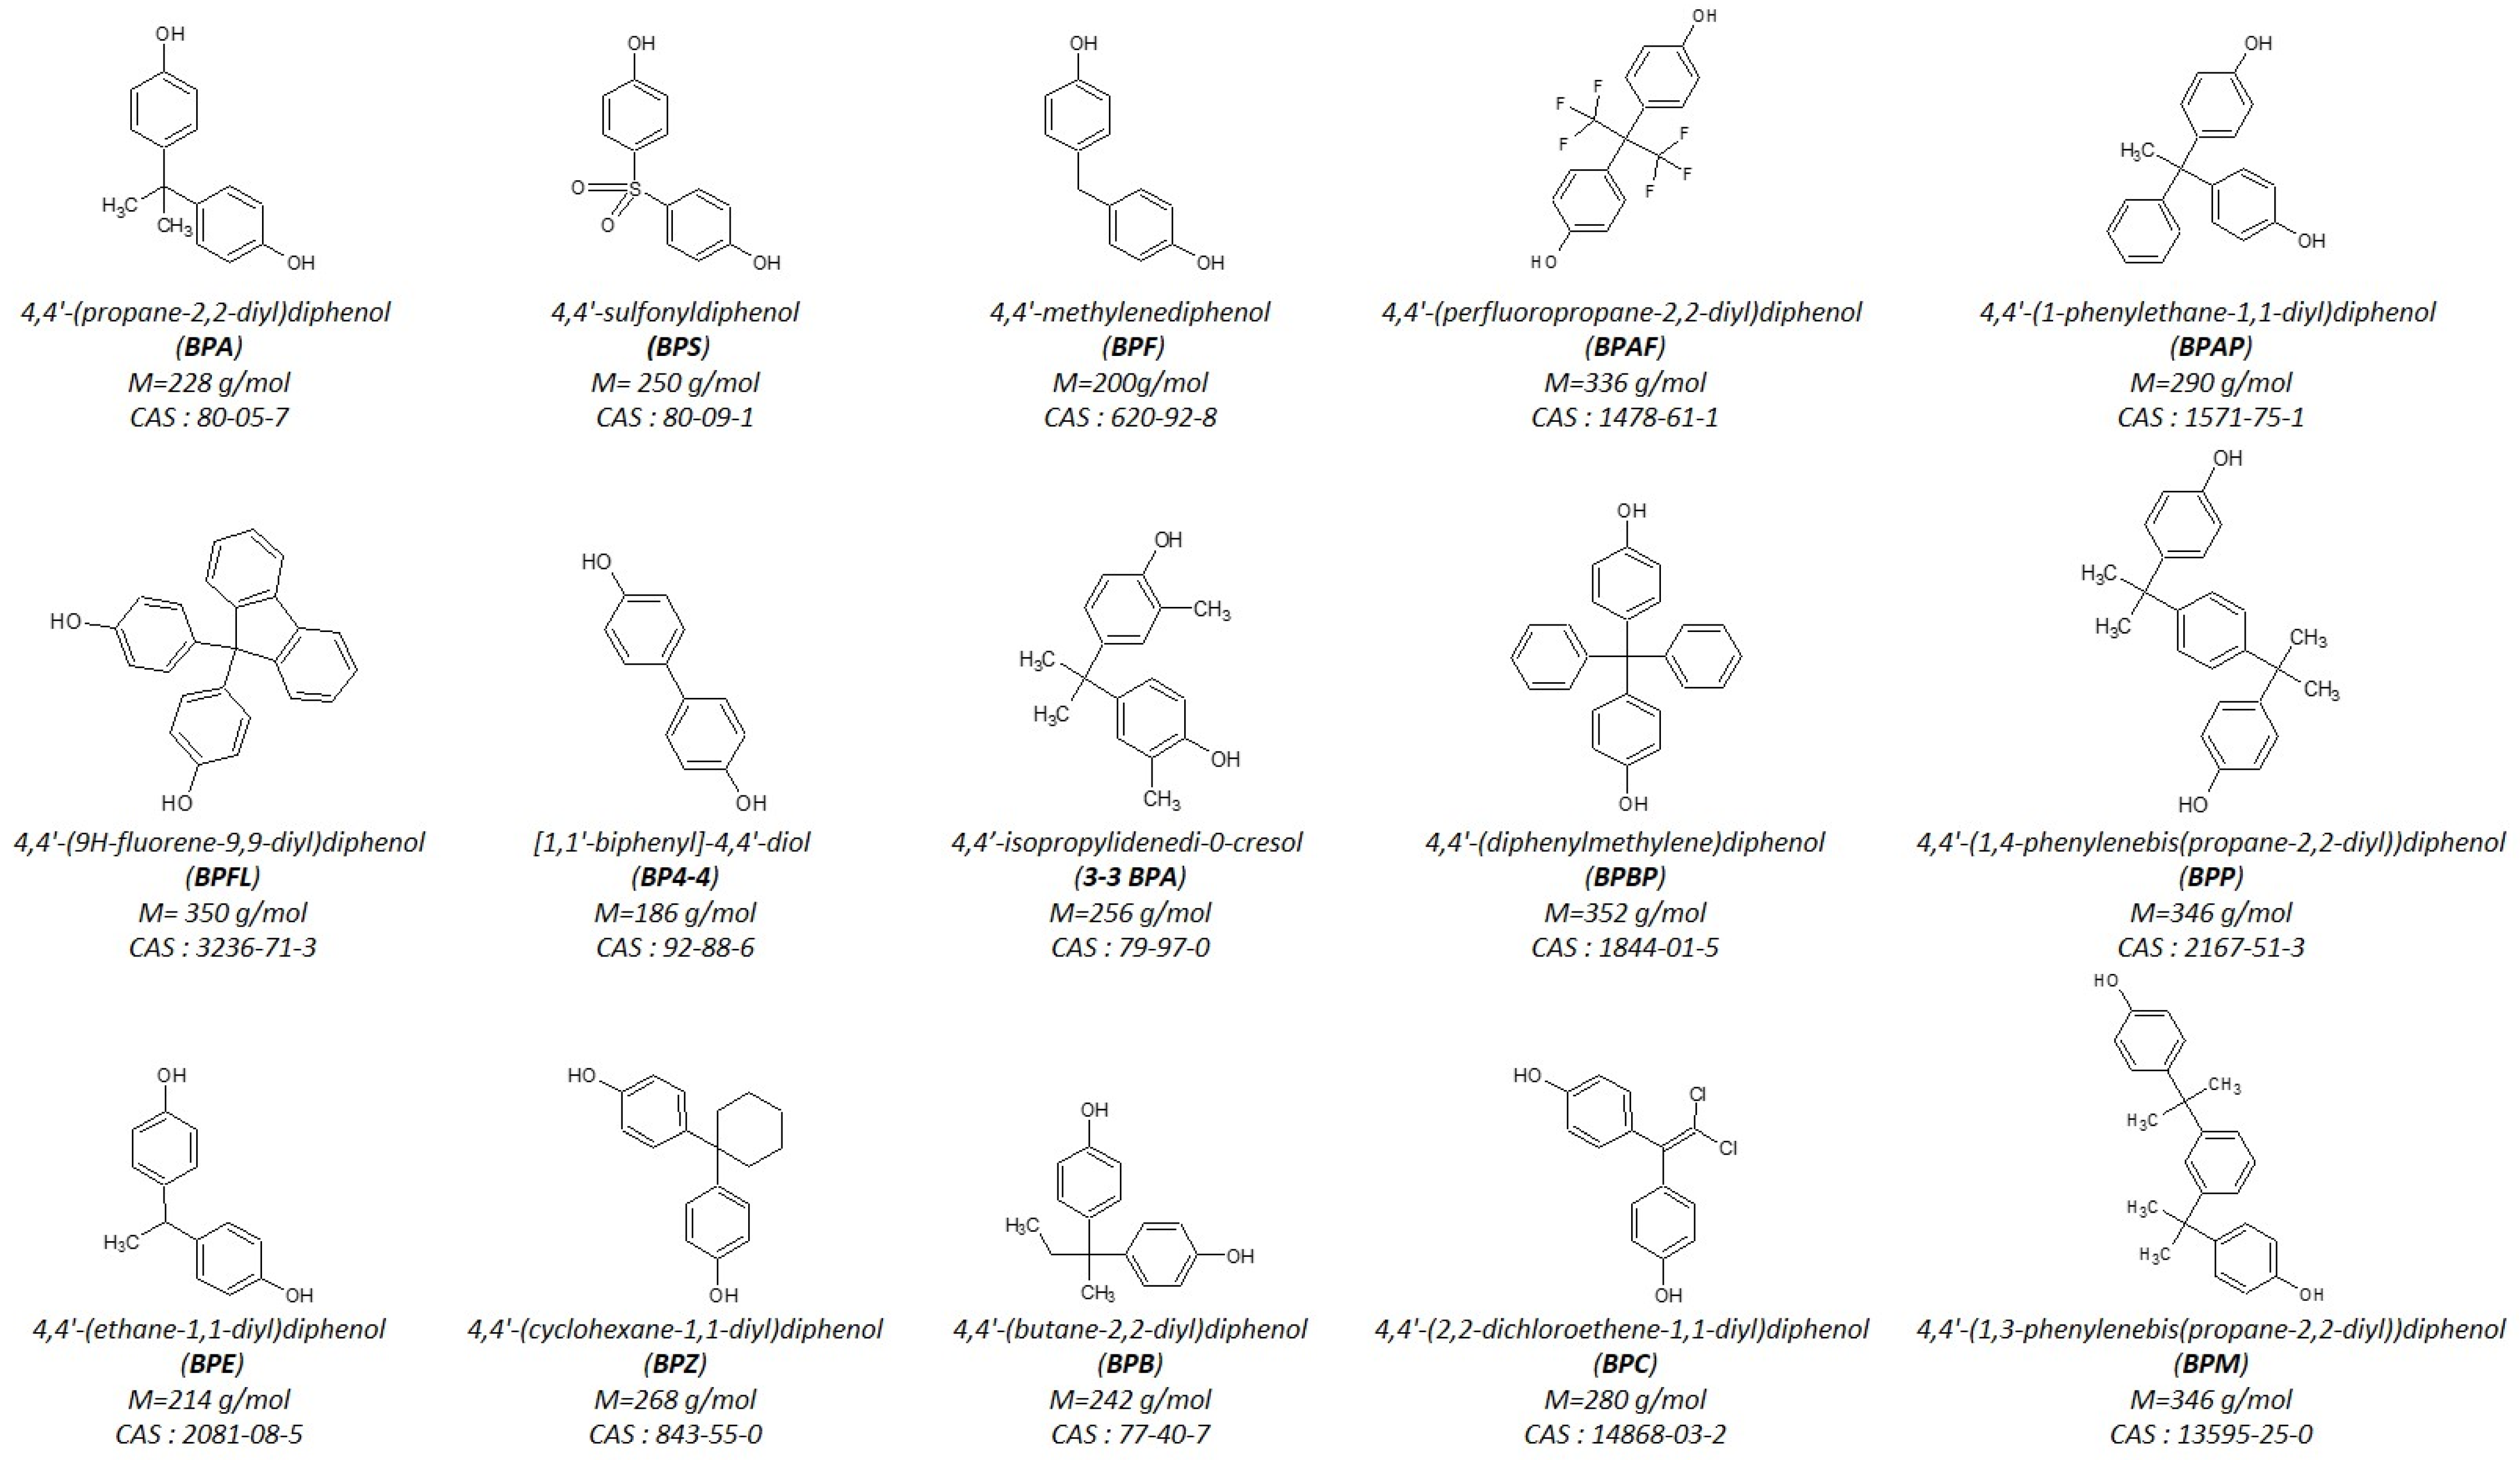
4.1.1. Compounds
4.1.2. Molecular Descriptors
4.1.3. Chromatographic Descriptors
4.2. QSAR Modelling
4.2.1. Variable Selection and Multi-Linear Regression
4.2.2. Data Splitting
4.2.3. Validation
5. Conclusions
Supplementary Materials
Author Contributions
Funding
Institutional Review Board Statement
Informed Consent Statement
Data Availability Statement
Acknowledgments
Conflicts of Interest
Sample Availability
References
- Chen, D.; Kannan, K.; Tan, H.; Zheng, Z.; Feng, Y.-L.; Wu, Y.; Widelka, M. Bisphenol Analogues Other Than BPA: Environmental Occurrence, Human Exposure, and Toxicity—A Review. Environ. Sci. Technol. 2016, 50, 5438–5453. [Google Scholar] [CrossRef] [PubMed]
- González, N.; Marquès, M.; Cunha, S.C.; Fernandes, J.O.; Domingo, J.L.; Nadal, M. Biomonitoring of Co-Exposure to Bisphenols by Consumers of Canned Foodstuffs. Environ. Int. 2020, 140, 105760. [Google Scholar] [CrossRef] [PubMed]
- Liao, C.; Kannan, K. A Survey of Alkylphenols, Bisphenols, and Triclosan in Personal Care Products from China and the United States. Arch. Environ. Contam. Toxicol. 2014, 67, 50–59. [Google Scholar] [CrossRef] [PubMed]
- Karrer, C.; Andreassen, M.; von Goetz, N.; Sonnet, F.; Sakhi, A.K.; Hungerbühler, K.; Dirven, H.; Husøy, T. The EuroMix Human Biomonitoring Study: Source-to-Dose Modeling of Cumulative and Aggregate Exposure for the Bisphenols BPA, BPS, and BPF and Comparison with Measured Urinary Levels. Environ. Int. 2020, 136, 105397. [Google Scholar] [CrossRef] [PubMed]
- Zhang, H.; Quan, Q.; Zhang, M.; Zhang, N.; Zhang, W.; Zhan, M.; Xu, W.; Lu, L.; Fan, J.; Wang, Q. Occurrence of Bisphenol A and Its Alternatives in Paired Urine and Indoor Dust from Chinese University Students: Implications for Human Exposure. Chemosphere 2020, 247, 125987. [Google Scholar] [CrossRef]
- Le Fol, V.; Aït-Aïssa, S.; Sonavane, M.; Porcher, J.-M.; Balaguer, P.; Cravedi, J.-P.; Zalko, D.; Brion, F. In Vitro and in Vivo Estrogenic Activity of BPA, BPF and BPS in Zebrafish-Specific Assays. Ecotoxicol. Environ. Saf. 2017, 142, 150–156. [Google Scholar] [CrossRef]
- Moreman, J.; Lee, O.; Trznadel, M.; David, A.; Kudoh, T.; Tyler, C.R. Acute Toxicity, Teratogenic, and Estrogenic Effects of Bisphenol A and Its Alternative Replacements Bisphenol S, Bisphenol F, and Bisphenol AF in Zebrafish Embryo-Larvae. Environ. Sci. Technol. 2017, 51, 12796–12805. [Google Scholar] [CrossRef]
- Pelch, K.; Wignall, J.A.; Goldstone, A.E.; Ross, P.K.; Blain, R.B.; Shapiro, A.J.; Holmgren, S.D.; Hsieh, J.-H.; Svoboda, D.; Auerbach, S.S.; et al. A Scoping Review of the Health and Toxicological Activity of Bisphenol A (BPA) Structural Analogues and Functional Alternatives. Toxicology 2019, 424, 152235. [Google Scholar] [CrossRef]
- Rosenmai, A.K.; Dybdahl, M.; Pedersen, M.; van Vugt-Lussenburg, B.M.A.; Wedebye, E.B.; Taxvig, C.; Vinggaard, A.M. Are Structural Analogues to Bisphenol A Safe Alternatives? Toxicol. Sci. 2014, 139, 35–47. [Google Scholar] [CrossRef]
- Siracusa, J.S.; Yin, L.; Measel, E.; Liang, S.; Yu, X. Effects of Bisphenol A and Its Analogs on Reproductive Health: A Mini Review. Reprod. Toxicol. 2018, 79, 96–123. [Google Scholar] [CrossRef]
- Kaimal, A.; Al Mansi, M.H.; Dagher, J.B.; Pope, C.; Varghese, M.G.; Rudi, T.B.; Almond, A.E.; Cagle, L.A.; Beyene, H.K.; Bradford, W.T.; et al. Prenatal Exposure to Bisphenols Affects Pregnancy Outcomes and Offspring Development in Rats. Chemosphere 2021, 276, 130118. [Google Scholar] [CrossRef] [PubMed]
- Shi, M.; Sekulovski, N.; MacLean, J.A.; Whorton, A.; Hayashi, K. Prenatal Exposure to Bisphenol A Analogues on Female Reproductive Functions in Mice. Toxicol. Sci. 2019, 168, 561–571. [Google Scholar] [CrossRef] [PubMed]
- Tucker, D.K.; Hayes Bouknight, S.; Brar, S.S.; Kissling, G.E.; Fenton, S.E. Evaluation of Prenatal Exposure to Bisphenol Analogues on Development and Long-Term Health of the Mammary Gland in Female Mice. Environ. Health Perspect. 2018, 126, 087003. [Google Scholar] [CrossRef] [PubMed] [Green Version]
- Corbel, T.; Gayrard, V.; Puel, S.; Lacroix, M.Z.; Berrebi, A.; Gil, S.; Viguié, C.; Toutain, P.-L.; Picard-Hagen, N. Bidirectional Placental Transfer of Bisphenol A and Its Main Metabolite, Bisphenol A-Glucuronide, in the Isolated Perfused Human Placenta. Reprod. Toxicol. 2014, 47, 51–58. [Google Scholar] [CrossRef] [PubMed]
- Gingrich, J.; Pu, Y.; Ehrhardt, R.; Karthikraj, R.; Kannan, K.; Veiga-Lopez, A. Toxicokinetics of Bisphenol A, Bisphenol S, and Bisphenol F in a Pregnancy Sheep Model. Chemosphere 2019, 220, 185–194. [Google Scholar] [CrossRef] [PubMed]
- Grandin, F.C.; Lacroix, M.Z.; Gayrard, V.; Gauderat, G.; Mila, H.; Toutain, P.-L.; Picard-Hagen, N. Bisphenol S Instead of Bisphenol A: Toxicokinetic Investigations in the Ovine Materno-Feto-Placental Unit. Environ. Int. 2018, 120, 584–592. [Google Scholar] [CrossRef]
- Gély, C.A.; Lacroix, M.Z.; Morin, M.; Vayssière, C.; Gayrard, V.; Picard-Hagen, N. Comparison of the Materno-Fetal Transfer of Fifteen Structurally Related Bisphenol Analogues Using an Ex Vivo Human Placental Perfusion Model. Chemosphere 2021, 276, 130213. [Google Scholar] [CrossRef]
- Grandin, F.C.; Lacroix, M.Z.; Gayrard, V.; Viguié, C.; Mila, H.; de Place, A.; Vayssière, C.; Morin, M.; Corbett, J.; Gayrard, C.; et al. Is Bisphenol S a Safer Alternative to Bisphenol A in Terms of Potential Fetal Exposure? Placental Transfer across the Perfused Human Placenta. Chemosphere 2019, 221, 471–478. [Google Scholar] [CrossRef]
- Pacifici, G.M.; Nottoli, R. Placental Transfer of Drugs Administered to the Mother. Clin. Pharmacokinet. 1995, 28, 235–269. [Google Scholar] [CrossRef]
- Eguchi, A.; Hanazato, M.; Suzuki, N.; Matsuno, Y.; Todaka, E.; Mori, C. Maternal–Fetal Transfer Rates of PCBs, OCPs, PBDEs, and Dioxin-like Compounds Predicted through Quantitative Structure–Activity Relationship Modeling. Environ. Sci. Pollut. Res. 2018, 25, 7212–7222. [Google Scholar] [CrossRef]
- Giaginis, C.; Zira, A.; Theocharis, S.; Tsantili-Kakoulidou, A. Application of Quantitative Structure–Activity Relationships for Modeling Drug and Chemical Transport across the Human Placenta Barrier: A Multivariate Data Analysis Approach. J. Appl. Toxicol. 2009, 29, 724–733. [Google Scholar] [CrossRef]
- Hewitt, M.; Madden, J.C.; Rowe, P.H.; Cronin, M.T.D. Structure-Based Modelling in Reproductive Toxicology: (Q)SARs for the Placental Barrier. SAR QSAR Environ. Res. 2007, 18, 57–76. [Google Scholar] [CrossRef] [PubMed]
- Zhang, Y.-H.; Xia, Z.-N.; Yan, L.; Liu, S.-S. Prediction of Placental Barrier Permeability: A Model Based on Partial Least Squares Variable Selection Procedure. Molecules 2015, 20, 8270–8286. [Google Scholar] [CrossRef] [PubMed] [Green Version]
- Danishuddin; Khan, A.U. Descriptors and Their Selection Methods in QSAR Analysis: Paradigm for Drug Design. Drug Discov. Today 2016, 21, 1291–1302. [Google Scholar] [CrossRef] [PubMed]
- Kaliszan, R. QSRR: Quantitative Structure-(Chromatographic) Retention Relationships. Chem. Rev. 2007, 107, 3212–3246. [Google Scholar] [CrossRef]
- Apostolov, S.; Vastag, G.; Mrdjan, G.; Nakomčić, J.; Stojiljković, I. Chromatographic Descriptors in QSAR Study of Barbiturates. J. Liq. Chromatogr. Relat. Technol. 2019, 42, 194–203. [Google Scholar] [CrossRef]
- Deconinck, E.; Ates, H.; Callebaut, N.; Van Gyseghem, E.; Vander Heyden, Y. Evaluation of Chromatographic Descriptors for the Prediction of Gastro-Intestinal Absorption of Drugs. J. Chromatogr. A 2007, 1138, 190–202. [Google Scholar] [CrossRef]
- Jevrić, L.R.; Podunavac-Kuzmanović, S.O.; Švarc-Gajić, J.V.; Kovačević, S.Z.; Jovanović, B.Ž. RP-HPTLC Retention Data in Correlation with the In-Silico ADME Properties of a Series of s-Triazine Derivatives. Iran. J. Pharm. Res. 2014, 13, 1203–1211. [Google Scholar]
- Koba, M.; Bączek, T.; Marszałł, M.P. Importance of Retention Data from Affinity and Reverse-Phase High-Performance Liquid Chromatography on Antitumor Activity Prediction of Imidazoacridinones Using QSAR Strategy. J. Pharm. Biomed. Anal. 2012, 64–65, 87–93. [Google Scholar] [CrossRef]
- Perisic-Janjic, N.; Kaliszan, R.; Wiczling, P.; Milosevic, N.; Uscumlic, G.; Banjac, N. Reversed-Phase TLC and HPLC Retention Data in Correlation Studies with in Silico Molecular Descriptors and Druglikeness Properties of Newly Synthesized Anticonvulsant Succinimide Derivatives. Mol. Pharm. 2011, 8, 555–563. [Google Scholar] [CrossRef]
- Wenlock, M.C.; Carlsson, L.A. How Experimental Errors Influence Drug Metabolism and Pharmacokinetic QSAR/QSPR Models. J. Chem. Inf. Model. 2015, 55, 125–134. [Google Scholar] [CrossRef] [PubMed]
- Golbraikh, A.; Tropsha, A. Predictive QSAR Modeling Based on Diversity Sampling of Experimental Datasets for the Training and Test Set Selection. J. Comput. Aided Mol. Des. 2002, 16, 357–369. [Google Scholar] [CrossRef] [PubMed]
- Chirico, N.; Gramatica, P. Real External Predictivity of QSAR Models. Part 2. New Intercomparable Thresholds for Different Validation Criteria and the Need for Scatter Plot Inspection. J. Chem. Inf. Model. 2012, 52, 2044–2058. [Google Scholar] [CrossRef] [PubMed]
- Caballero-Casero, N.; Lunar, L.; Rubio, S. Analytical Methods for the Determination of Mixtures of Bisphenols and Derivatives in Human and Environmental Exposure Sources and Biological Fluids. A Review. Anal. Chim. Acta 2016, 908, 22–53. [Google Scholar] [CrossRef] [PubMed]
- Liao, C.; Kannan, K. Concentrations and Profiles of Bisphenol A and Other Bisphenol Analogues in Foodstuffs from the United States and Their Implications for Human Exposure. J. Agric. Food Chem. 2013, 61, 4655–4662. [Google Scholar] [CrossRef] [PubMed]
- European Chemical Agency ECHA-Information on Registered Substances. Available online: https://echa.europa.eu/fr/information-on-chemicals/registered-substances (accessed on 30 November 2022).
- Audus, K.L. Controlling Drug Delivery across the Placenta. Eur. J. Pharm. Sci. 1999, 8, 161–165. [Google Scholar] [CrossRef] [Green Version]
- Evain-Brion, D.; Berveiller, P.; Gil, S. Le passage transplacentaire des médicaments. Therapies 2014, 69, 3–11. [Google Scholar] [CrossRef]
- Syme, M.R.; Paxton, J.W.; Keelan, J.A. Drug Transfer and Metabolism by the Human Placenta. Clin. Pharmacokinet. 2004, 43, 487–514. [Google Scholar] [CrossRef]
- Gao, H.; Huang, H.; Zheng, A.; Yu, N.; Li, N. Determination of Quantitative Retention-Activity Relationships between Pharmacokinetic Parameters and Biological Effectiveness Fingerprints of Salvia Miltiorrhiza Constituents Using Biopartitioning and Microemulsion High-Performance Liquid Chromatography. J. Chromatogr. B 2017, 1067, 10–17. [Google Scholar] [CrossRef]
- Giaginis, C.; Tsantili-Kakoulidou, A. Quantitative Structure–Retention Relationships as Useful Tool to Characterize Chromatographic Systems and Their Potential to Simulate Biological Processes. Chromatographia 2013, 76, 211–226. [Google Scholar] [CrossRef]
- Quiñones-Torrelo, C.; Sagrado, S.; Villanueva-Camañas, R.M.; Medina-Hernández, M.J. Opioid Analgetics Retention-Pharmacologic Activity Models Using Biopartitioning Micellar Chromatography. J. Chromatogr. B Anal. Technol. Biomed. Life Sci. 2002, 766, 265–277. [Google Scholar] [CrossRef] [PubMed]
- Lesellier, E.; West, C. Σpider Diagram: A Universal and Versatile Approach for System Comparison and Classification. Part 2: Stationary Phase Properties. J. Chromatogr. A 2018, 1574, 71–81. [Google Scholar] [CrossRef] [PubMed]
- Lafossas, C.; Benoit-Marquié, F.; Garrigues, J.C. Analysis of the Retention of Tetracyclines on Reversed-Phase Columns: Chemometrics, Design of Experiments and Quantitative Structure-Property Relationship (QSPR) Study for Interpretation and Optimization. Talanta 2019, 198, 550–559. [Google Scholar] [CrossRef] [PubMed]
- Yang, M.; Fazio, S.; Munch, D.; Drumm, P. Impact of Methanol and Acetonitrile on Separations Based on π–π Interactions with a Reversed-Phase Phenyl Column. J. Chromatogr. A 2005, 1097, 124–129. [Google Scholar] [CrossRef] [PubMed]
- Le Mapihan, K.; Vial, J.; Jardy, A. Reversed-Phase Liquid Chromatography Column Testing and Classification: Physicochemical Interpretation Based on a Wide Set of Stationary Phases. J. Chromatogr. A 2007, 1144, 183–196. [Google Scholar] [CrossRef]
- Ravisankar, P.; Anusha, S.; Supriya, K.; Kumar, U.A. Fundamental Chromatographic Parameters. Int. J. Pharm. Sci. Rev. Res. 2020, 55, 46. [Google Scholar]
- Waters Acquity UPLC Colums. Available online: https://www.waters.com/webassets/cms/library/docs/720001140en.pdf (accessed on 9 February 2022).
- Todeschini, R.; Consonni, V. Methods and Principles in Medicinal Chemistry. In Handbook of Molecular Descriptors, 1st ed.; WILEY-VCH Verlag GmbH: Weinheim, Germany, 2000; ISBN 978-3-527-29913-3. [Google Scholar]
- Miyabe, K.; Guiochon, G. Measurement of the Parameters of the Mass Transfer Kinetics in High Performance Liquid Chromatography. J. Sep. Sci. 2003, 26, 155–173. [Google Scholar] [CrossRef]
- Nawrocki, J. The Silanol Group and Its Role in Liquid Chromatography. J. Chromatogr. A 1997, 779, 29–71. [Google Scholar] [CrossRef]
- Chirico, N.; Gramatica, P. Real External Predictivity of QSAR Models: How to Evaluate It? Comparison of Different Validation Criteria and Proposal of Using the Concordance Correlation Coefficient. J. Chem. Inf. Model. 2011, 51, 2320–2335. [Google Scholar] [CrossRef]
- Gramatica, P.; Sangion, A. A Historical Excursus on the Statistical Validation Parameters for QSAR Models: A Clarification Concerning Metrics and Terminology. J. Chem. Inf. Model. 2016, 56, 1127–1131. [Google Scholar] [CrossRef]
- Gramatica, P. Principles of QSAR Models Validation: Internal and External. QSAR Comb. Sci. 2007, 26, 694–701. [Google Scholar] [CrossRef]
- Tropsha, A. Best Practices for QSAR Model Development, Validation, and Exploitation. Mol. Inform. 2010, 29, 476–488. [Google Scholar] [CrossRef] [PubMed]
- Kaliszan, R. Quantitative Structure-Retention Relationships Applied to Reversed-Phase High-Performance Liquid Chromatography. J. Chromatogr. A 1993, 656, 417–435. [Google Scholar] [CrossRef]
- Rocha, B.A.; da Costa, B.R.B.; de Albuquerque, N.C.P.; de Oliveira, A.R.M.; Souza, J.M.O.; Al-Tameemi, M.; Campiglia, A.D.; Barbosa, F., Jr. A Fast Method for Bisphenol A and Six Analogues (S, F, Z, P, AF, AP) Determination in Urine Samples Based on Dispersive Liquid-Liquid Microextraction and Liquid Chromatography-Tandem Mass Spectrometry. Talanta 2016, 154, 511–519. [Google Scholar] [CrossRef] [PubMed]
- Zhou, X.; Kramer, J.P.; Calafat, A.M.; Ye, X. Automated On-Line Column-Switching High Performance Liquid Chromatography Isotope Dilution Tandem Mass Spectrometry Method for the Quantification of Bisphenol A, Bisphenol F, Bisphenol S, and 11 Other Phenols in Urine. J. Chromatogr. B Anal. Technol. Biomed. Life Sci. 2014, 944, 152–156. [Google Scholar] [CrossRef] [PubMed]
- Restek Raptor Stationary Phase: Biphenyl. Available online: https://www.restek.com/globalassets/pdfs/literature/gnbr1891c-unv.pdf (accessed on 9 February 2022).
- Günther, F.; Fritsch, S. Neuralnet: Training of Neural Networks. R J. 2010, 2, 30–38. [Google Scholar] [CrossRef] [Green Version]
- Ripley, B.; Venables, B.; Bates, D.M.; Hornik, K.; Gebhardt, A.; Firth, D. R Package “Mass” 7.3-54. Available online: https://rdocumentation.org/packages/MASS/versions/7.3-54 (accessed on 30 November 2022).
- Hebbali, A. Olsrr|Rsquared Academy. Available online: https://olsrr.rsquaredacademy.com/ (accessed on 30 November 2022).
- Alexander, D.L.J.; Tropsha, A.; Winkler, D.A. Beware of R(2): Simple, Unambiguous Assessment of the Prediction Accuracy of QSAR and QSPR Models. J. Chem. Inf. Model. 2015, 55, 1316–1322. [Google Scholar] [CrossRef] [Green Version]
- Ferreira, M.M.C. Multivariate QSAR. J. Braz. Chem. Soc. 2002, 13, 742–753. [Google Scholar] [CrossRef]


| Bisphenol | Mean CI ± SD (n = 5) | Classification |
|---|---|---|
| BPFL | 0.064 ± 0.021 | Significantly different from antipyrine transfer rate |
| BPS | 0.082 ± 0.016 | |
| BPBP | 0.256 ± 0.046 | |
| BPZ | 0.318 ± 0.090 | |
| BPC | 0.392 ± 0.076 | |
| BPM | 0.442 ± 0.149 | |
| BPP | 0.452 ± 0.048 | |
| BPAF | 0.524 ± 0.071 | |
| BPAP | 0.570 ± 0.062 | Not different from antipyrine transfer rate |
| BP4-4 | 0.662 ± 0.135 | |
| BPE | 0.686 ± 0.158 | |
| BPF | 0.696 ± 0.142 | |
| 3-3BPA | 0.722 ± 0.070 | |
| BPA | 0.812 ± 0.065 | |
| BPB | 0.842 ± 0.080 |
| Regression | Cross-Validation | Leave-Many-Out (LMO) Validation | |||||||
|---|---|---|---|---|---|---|---|---|---|
| RMSEC * | R2 * | BIC | RMSECV * | Q2 * | QLMO2 * | RMSEP ** | CCC ** | Rspearman ** | |
| Validation Criterion | > 0.65 | > 0.5 | > 0.65 | > 0.85 | |||||
| Molecular Descriptors | 0.14 | 0.77 | −64 | 0.14 | 0.71 | 0.57 | 0.17 | 0.64 | 0.7 |
| Chromatographic Descriptors | 0.11 | 0.84 | −89 | 0.11 | 0.81 | 0.73 | 0.13 | 0.81 | 0.83 |
| Both Descriptors | 0.11 | 0.85 | −86 | 0.11 | 0.82 | 0.47 | 0.19 | 0.67 | 0.71 |
| Molecular Descriptors | Chromatographic Descriptors | ||||
|---|---|---|---|---|---|
| Id | Parameters | Id | Column—Solvent—Parameters | Id | Column—Solvent—Parameters |
| CPS3 | Connolly Solvent Excluded Volume | C18A2 | C18—AcN—Width (5%) | RCBA2 | RCB—AcN—Width (5%) |
| C18A7 | C18—AcN—Asymmetry | RCBA8 | RCB—AcN—Tailing factor | ||
| CD1 | Mol Refractivity | C18A8 | C18—AcN—Tailing factor | CC18A2 | CC18—AcN—Width (5%) |
| MT2 | Cluster Count | PHA5 | PH—AcN—k’ vs. BPA | CC18A7 | CC18—AcN—Asymmetry |
| MT5 | Polar Surface Area | FPA2 | FP—AcN—Width (5%) | C18M5 | C18—MeOH—k′ vs. BPA |
| MT12 | Total Connectivity | C8A2 | C8—AcN—Width (5%) | C18M7 | C18—MeOH—Asymmetry |
| DE1 | Heat of formation | T3A2 | T3—AcN—Width (5%) | PHM5 | PH—MeOH—k′ vs. BPA |
| DE2 | Total Energy | T3A5 | T3—AcN—k’ vs. BPA | FPM7 | FP—MeOH—Asymmetry |
| DE5 | Cosmo Area | T3A7 | T3—AcN—Asymmetry | T3M5 | T3—MeOH—k′ vs. BPA |
| DE9 | Lumo Energy | T3A8 | T3—AcN—Width (5%) | PFPM2 | PFP—MeOH—Width (5%) |
| RBA5 | RB—AcN—k’ vs. BPA | PFPM7 | PFP—MeOH—Asymmetry | ||
| PFPA2 | PFP—AcN—Width (5%) | RPM7 | RP—MeOH—Asymmetry | ||
| RPA2 | RP—AcN—Width (5%) | CNM7 | CN—MeOH—Asymmetry | ||
| CNA5 | CN—AcN—k’ vs. BPA | CC18M2 | CC18—MeOH—Width (5%) | ||
| FBA7 | FB—AcN—Asymmetry | ||||
| Chromatographic Descriptors | |||
|---|---|---|---|
| Id | Column—Solvent—Parameters | Id | Column—Solvent—Parameters |
| T3A2 | T3—AcN—Width (5%) | FPM7 | FP—MeOH—Asymmetry |
| RBA7 | RB—AcN—Asymmetry | C8M7 | C8—MeOH—Asymmetry |
| PFPA7 | PFP—AcN—Asymmetry | T3M5 | T3—MeOH—k′ vs. BPA |
| FBA5 | FB—AcN—k′ vs. BPA | PFPM7 | PFP—MeOH—Asymmetry |
| CC18A2 | CC18—AcN—Width (5%) | RPM8 | RP—MeOH—Tailing factor |
| CC18A7 | CC18—AcN—Asymmetry | CNM8 | CN—MeOH—Tailing factor |
| C18M2 | C18—MeOH—Width (5%) | FBM2 | FB—MeOH—Width (5%) |
| C18M5 | C18—MeOH—k′ vs. BPA | FBM7 | FB—MeOH—Asymmetry |
| C18M7 | C18—MeOH—Asymmetry | ||
| Column | Dimension—Granulometry—Supplier | Selectivity |
|---|---|---|
| Raptor Biphenyl (RB) | 100 × 2.1 mm; 2.7 µm, Restek | Polarizability, aromatic and dipolar selectivity |
| Raptor Biphenyl Core-Shell (RCB) | 100 × 2.1 mm; 1.8 µm, Restek | Polarizability, aromatic and dipolar selectivity |
| Force Biphenyl (FB) | 100 × 2.1 mm; 1.8 µm, Restek | Polarizability, aromatic and dipolar selectivity |
| Cortecs C18 (CC18) | 100 × 2.1 mm; 1.6 µm, Waters | Hydrophobicity selectivity |
| BEH C18 (C18) | 100 × 2.1 mm; 1.7 µm, Waters | Hydrophobicity selectivity (reference) |
| BEH RP 18 Shield (RP18) | 100 × 2.1 mm; 1.7 µm, Waters | Basic compound selectivity |
| BEH C8 (C8) | 100 × 2.1 mm; 1.7 µm, Waters | Hydrophobicity selectivity |
| BEH Phenyl (P) | 100 × 2.1 mm; 1.7 µm, Waters | Pi-Pi selectivity |
| CSH Phenyl-Hexyl (PH) | 100 × 2.1 mm; 1.7 µm, Waters | Pi-Pi selectivity |
| CSH Fluoro-Phenyl (FP) | 100 × 2.1 mm; 1.7 µm, Waters | Halogenated and polar compound selectivity |
| HSS T3 (T3) | 100 × 2.1 mm; 1.8 µm, Waters | Polar and hydrophobic molecule selectivity |
| HSS PFP (PFP) | 100 × 2.1 mm; 1.8 µm, Waters | Pi-Pi, H-bonding, dipolar and hydrophobicity selectivity |
| HSS CN (CN) | 100 × 2.1 mm; 1.8 µm, Waters | Alternative to hydrophobicity selectivity |
Disclaimer/Publisher’s Note: The statements, opinions and data contained in all publications are solely those of the individual author(s) and contributor(s) and not of MDPI and/or the editor(s). MDPI and/or the editor(s) disclaim responsibility for any injury to people or property resulting from any ideas, methods, instructions or products referred to in the content. |
© 2023 by the authors. Licensee MDPI, Basel, Switzerland. This article is an open access article distributed under the terms and conditions of the Creative Commons Attribution (CC BY) license (https://creativecommons.org/licenses/by/4.0/).
Share and Cite
Gély, C.A.; Picard-Hagen, N.; Chassan, M.; Garrigues, J.-C.; Gayrard, V.; Lacroix, M.Z. Contribution of Reliable Chromatographic Data in QSAR for Modelling Bisphenol Transport across the Human Placenta Barrier. Molecules 2023, 28, 500. https://doi.org/10.3390/molecules28020500
Gély CA, Picard-Hagen N, Chassan M, Garrigues J-C, Gayrard V, Lacroix MZ. Contribution of Reliable Chromatographic Data in QSAR for Modelling Bisphenol Transport across the Human Placenta Barrier. Molecules. 2023; 28(2):500. https://doi.org/10.3390/molecules28020500
Chicago/Turabian StyleGély, Clémence A., Nicole Picard-Hagen, Malika Chassan, Jean-Christophe Garrigues, Véronique Gayrard, and Marlène Z. Lacroix. 2023. "Contribution of Reliable Chromatographic Data in QSAR for Modelling Bisphenol Transport across the Human Placenta Barrier" Molecules 28, no. 2: 500. https://doi.org/10.3390/molecules28020500