
Comprehensive Study of the Ammonium Sulfamate–Urea Binary System

 , , , , ,
Abstract
:1. Introduction
2. Results and Discussion
2.1. Experimental Study of the Ammonium Sulfamate–Urea System
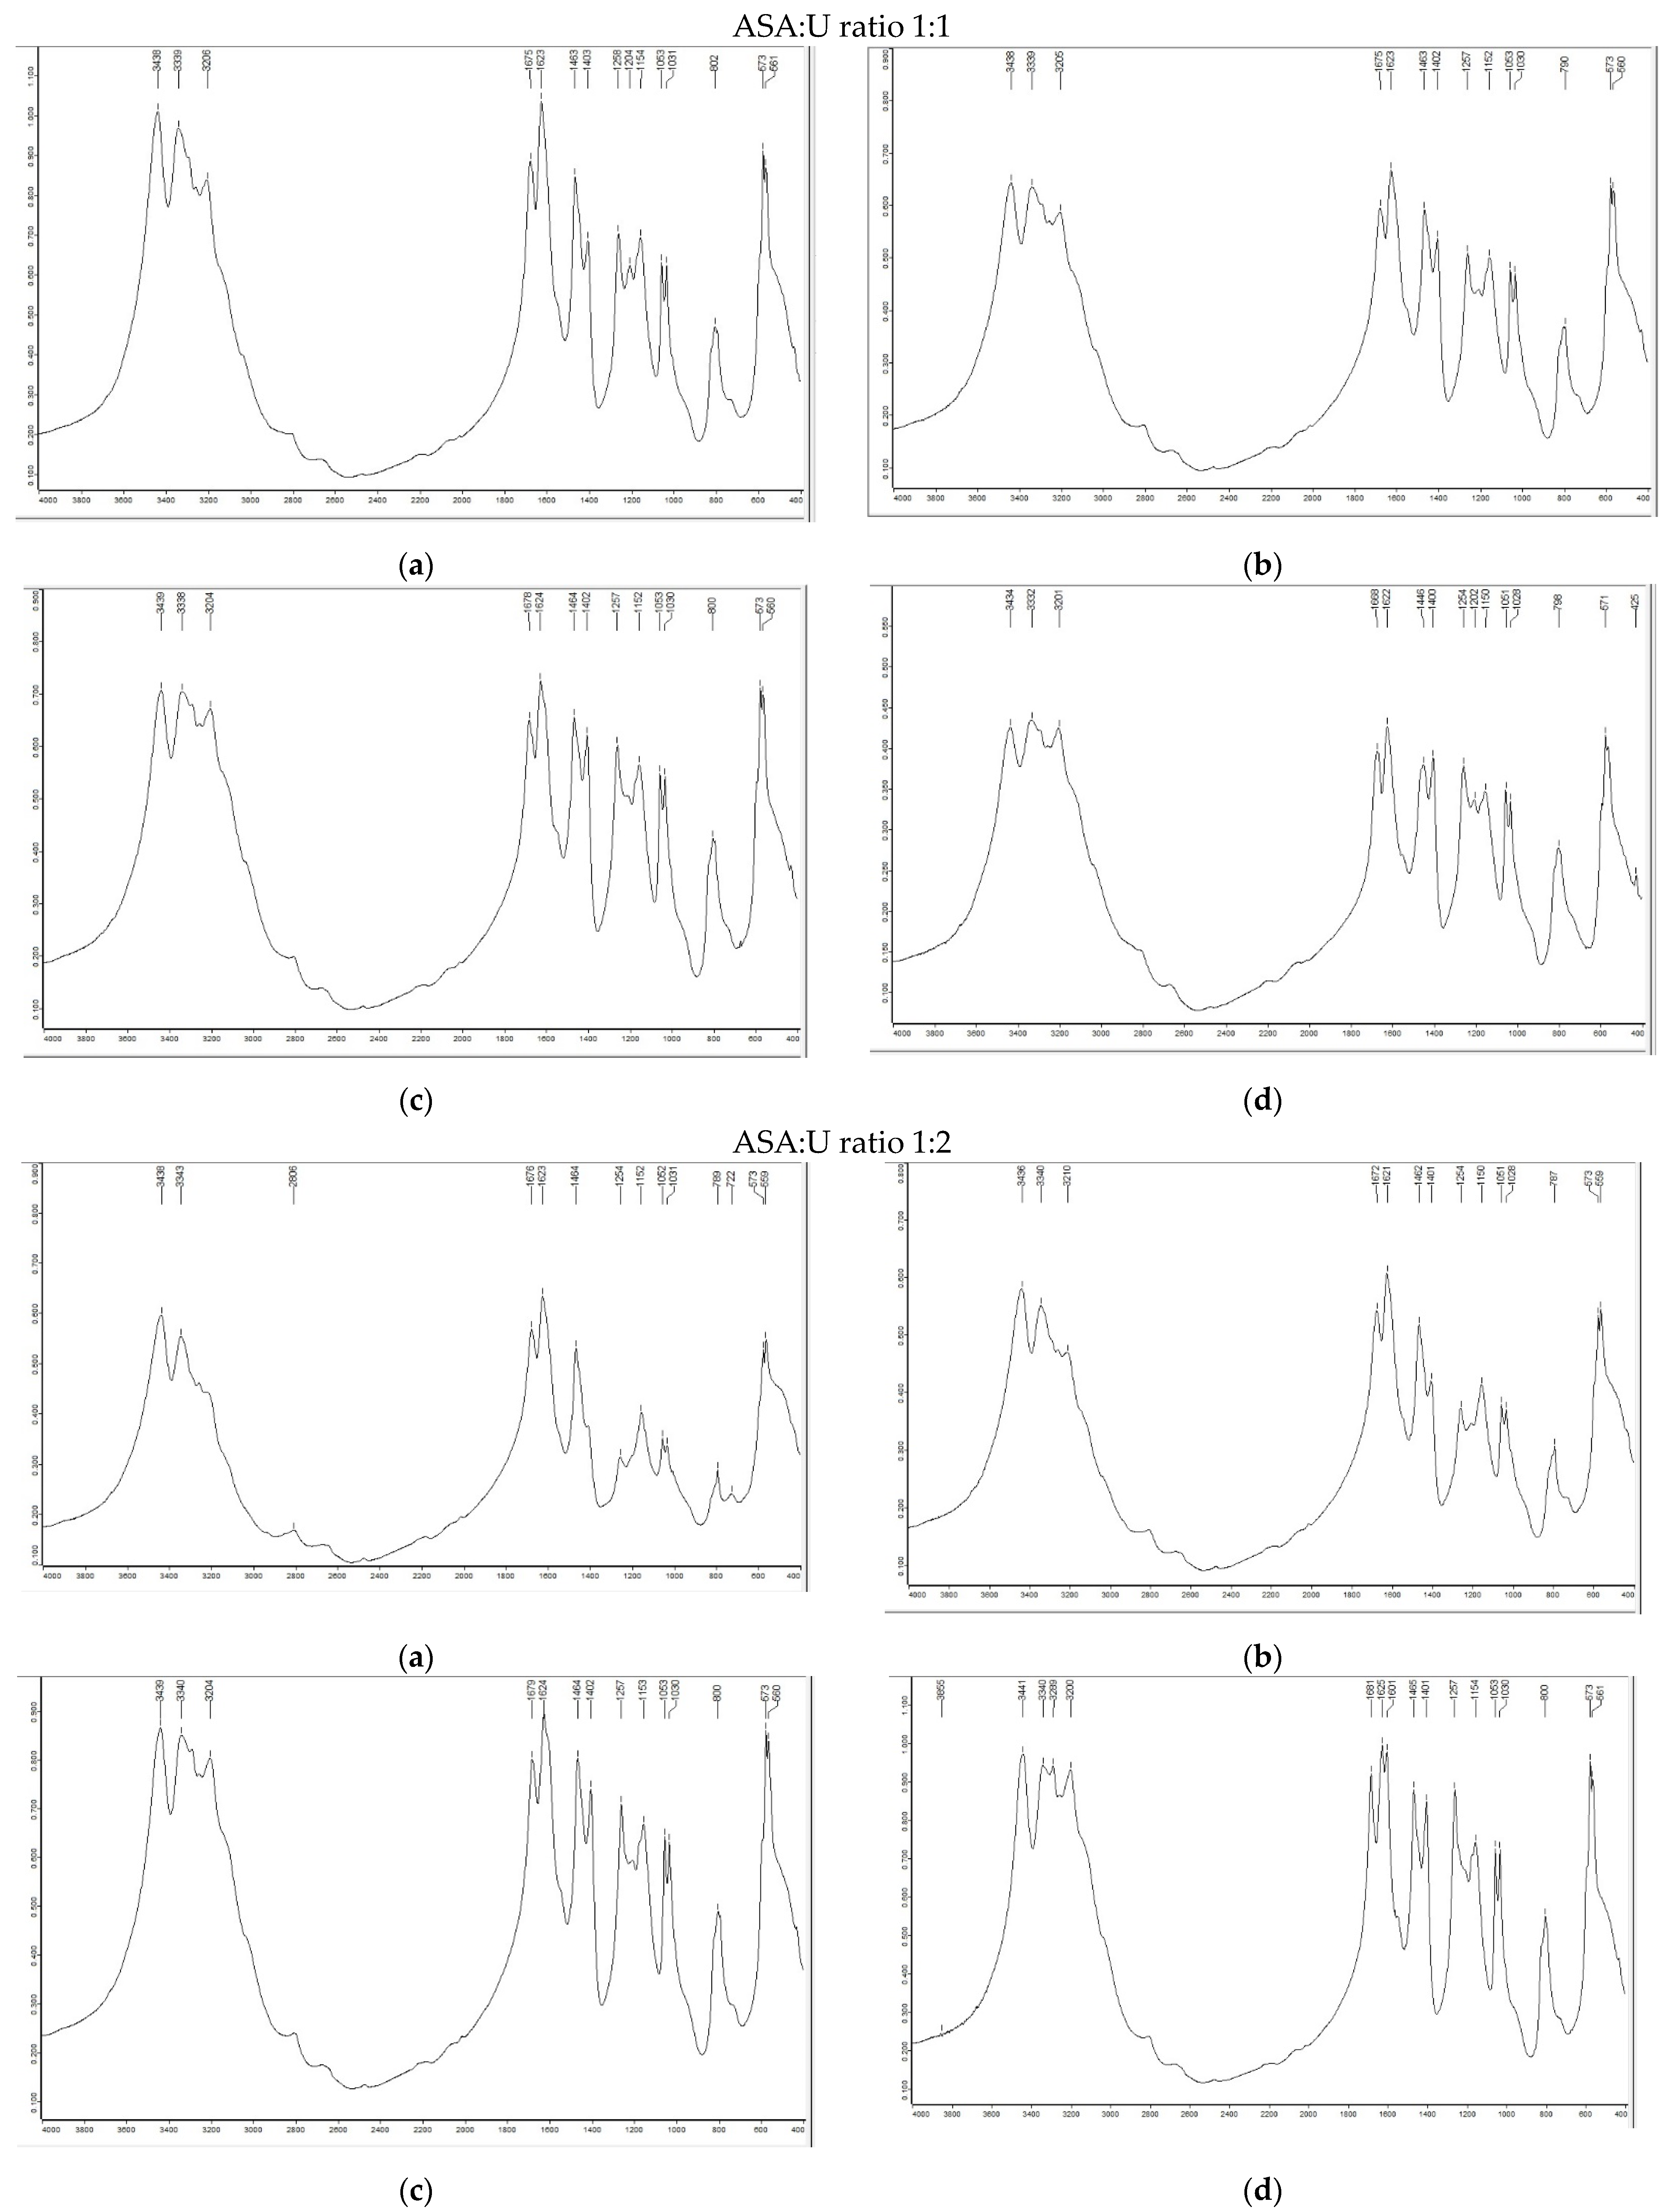
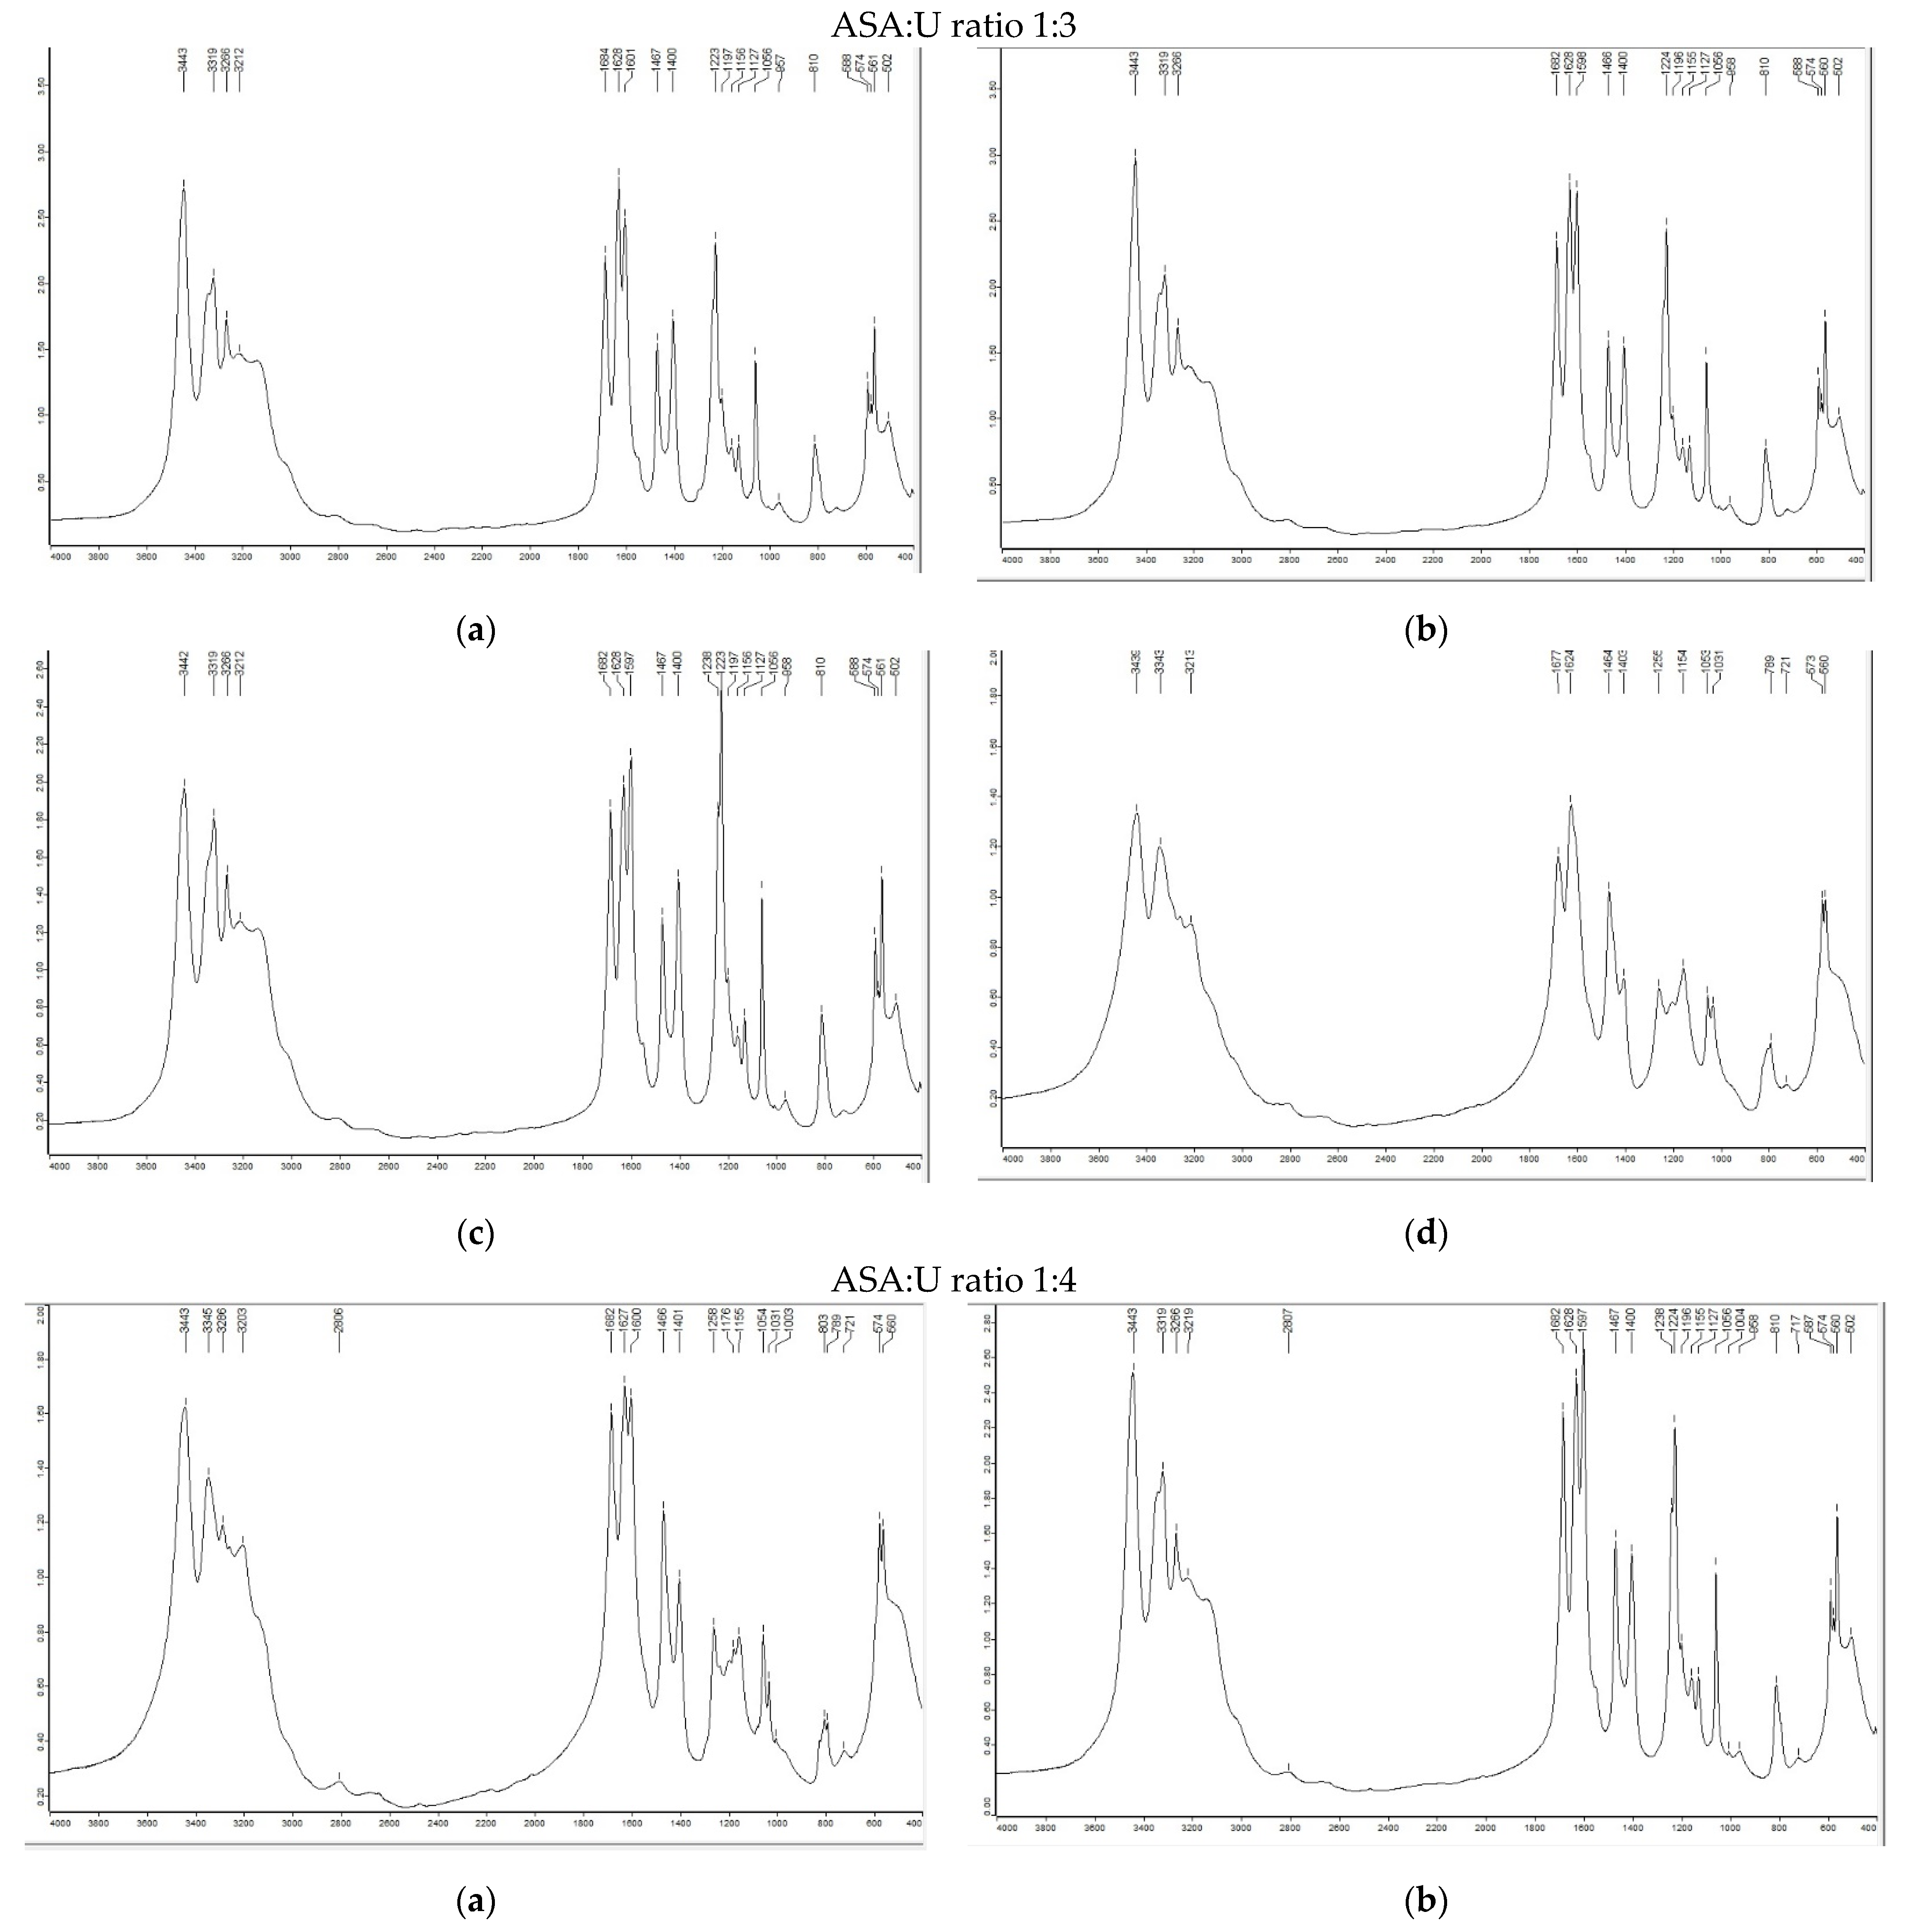
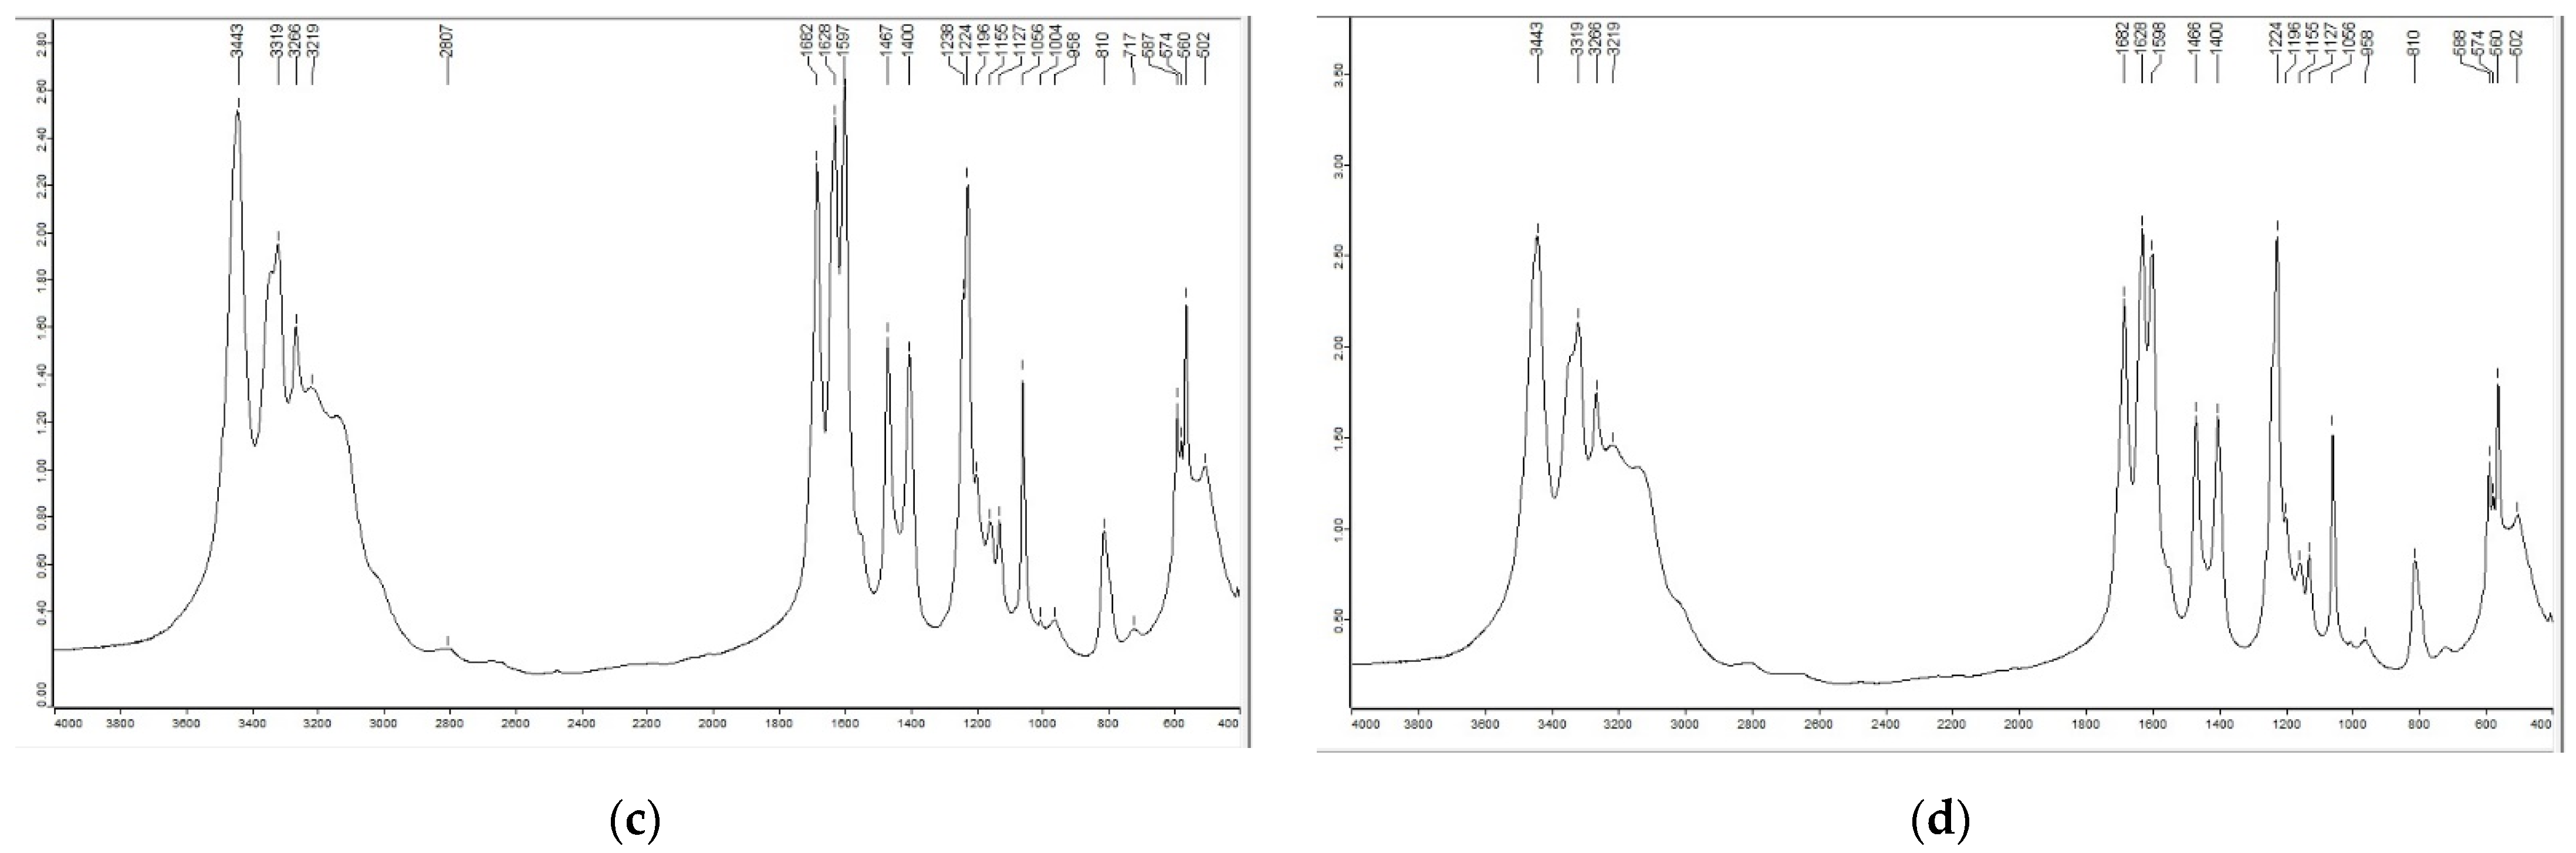
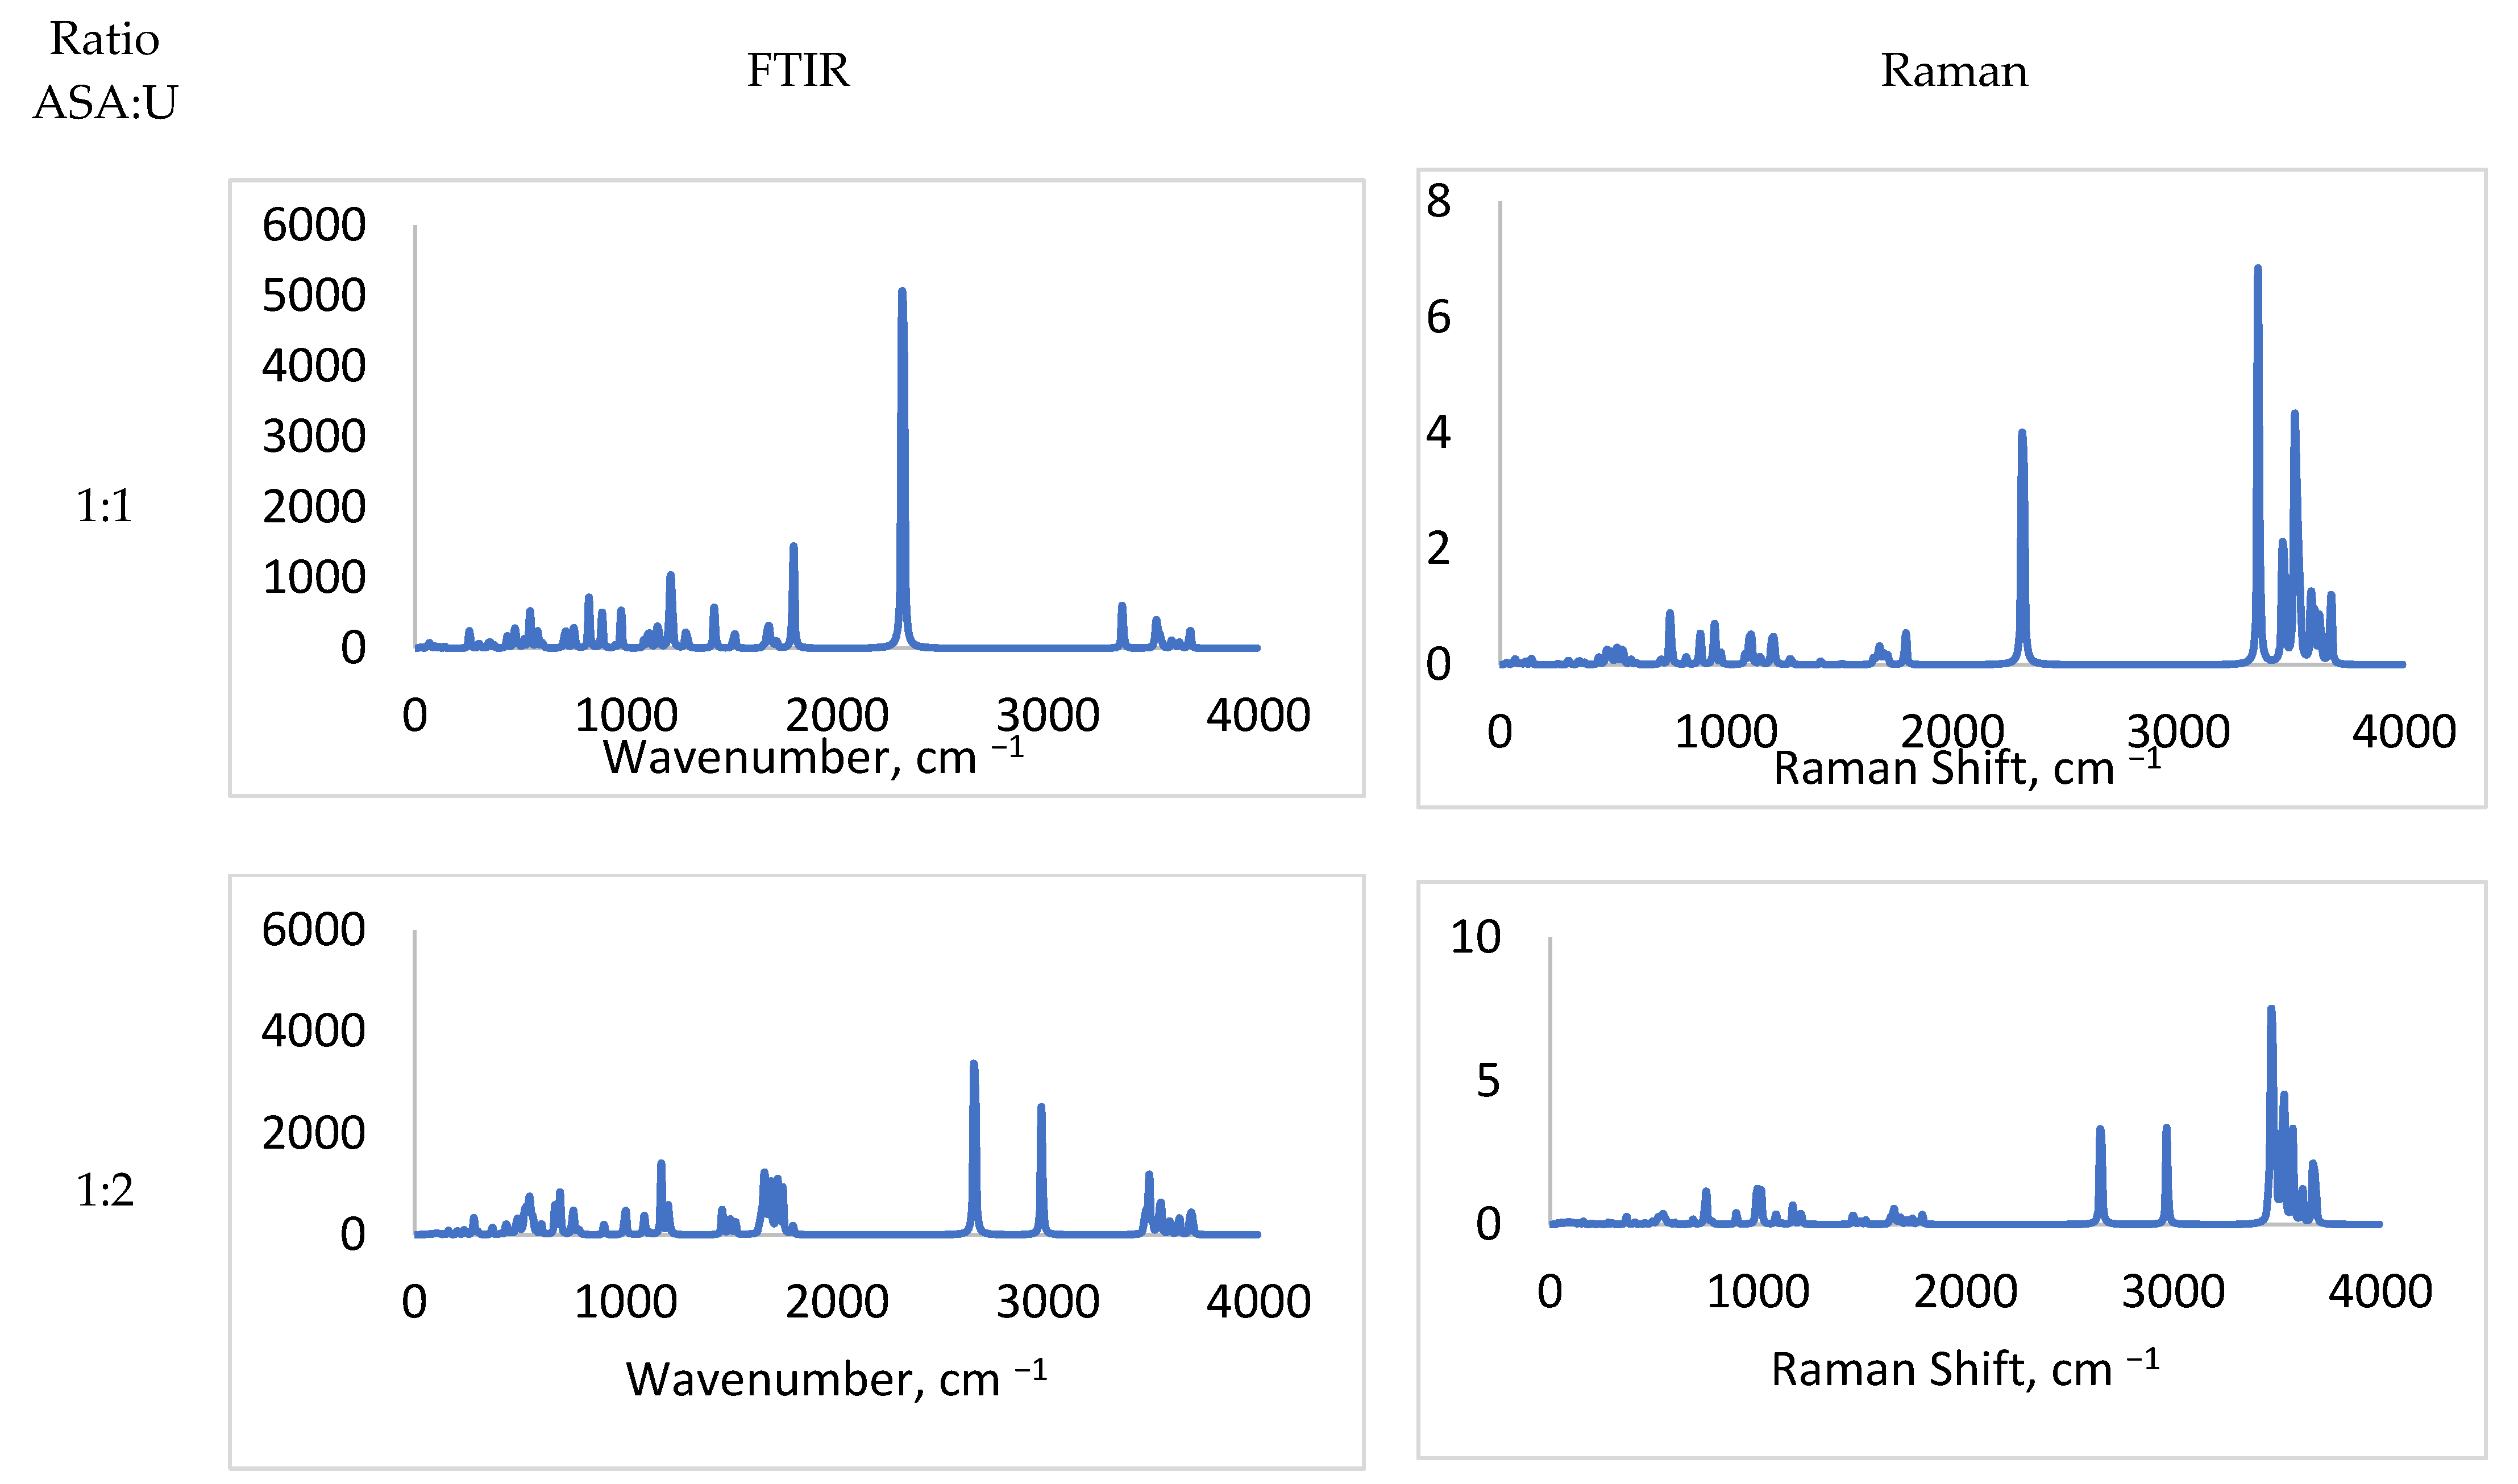
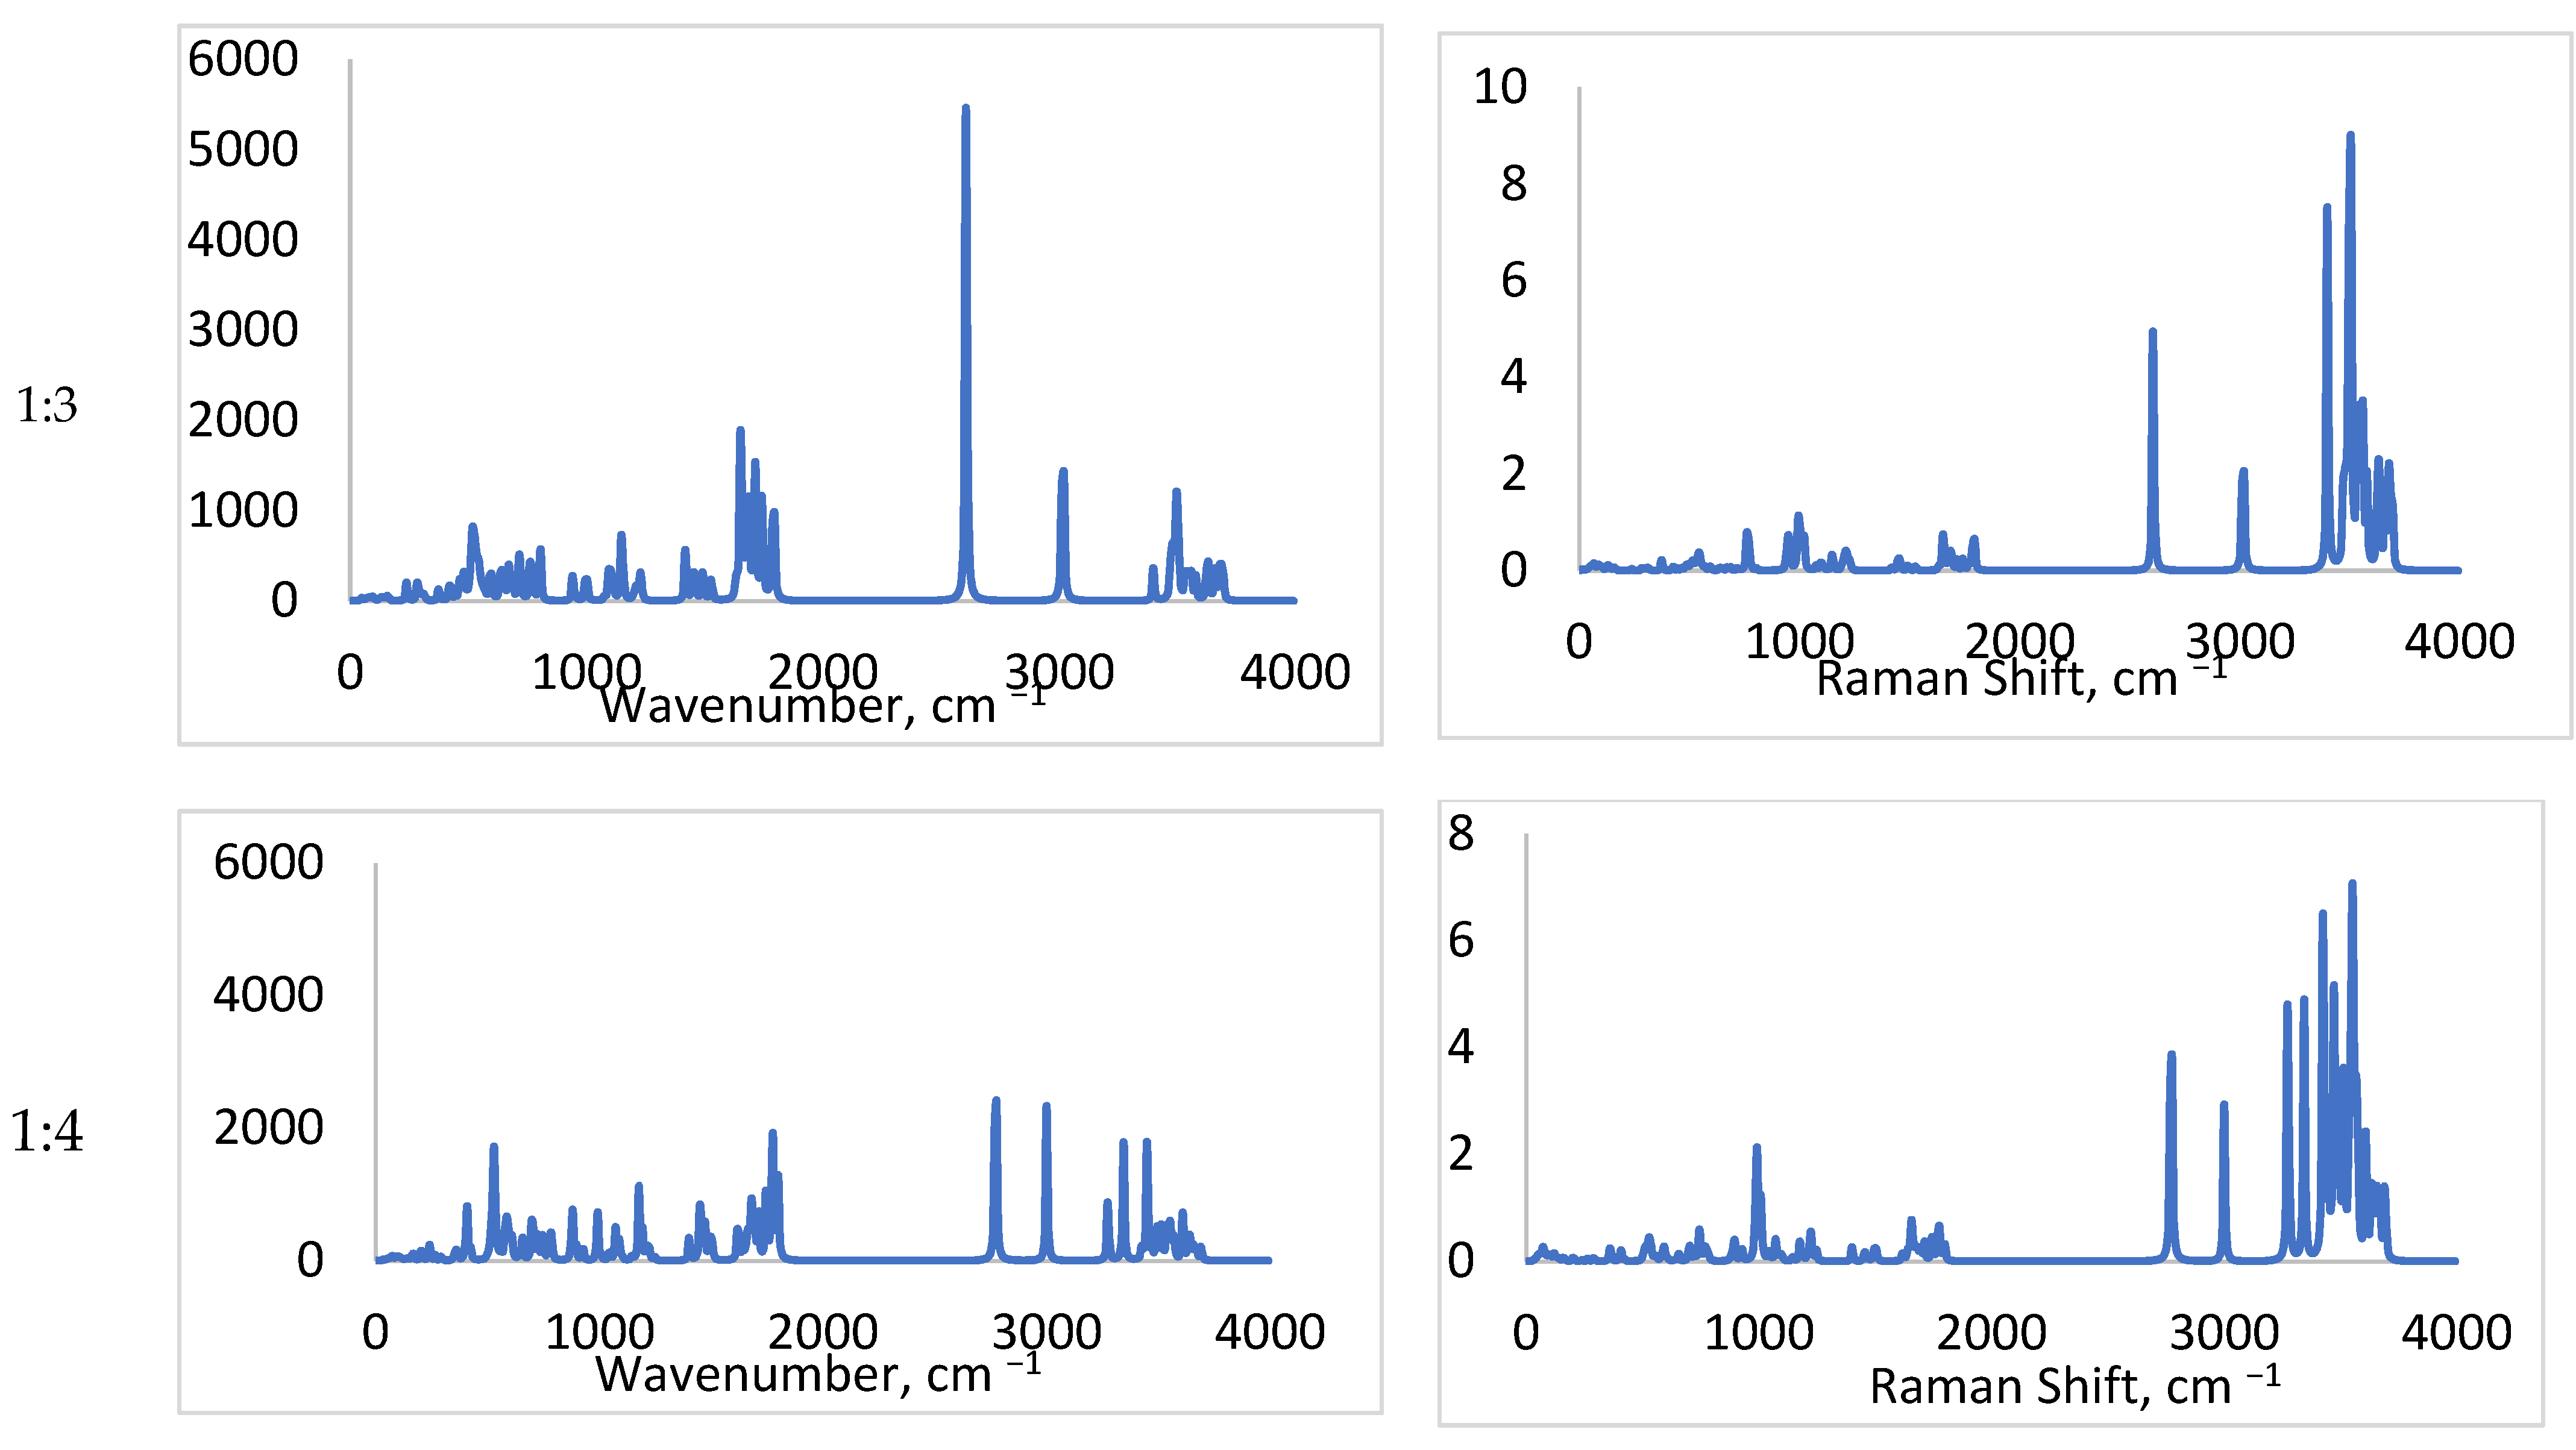
2.1.1. FTIR
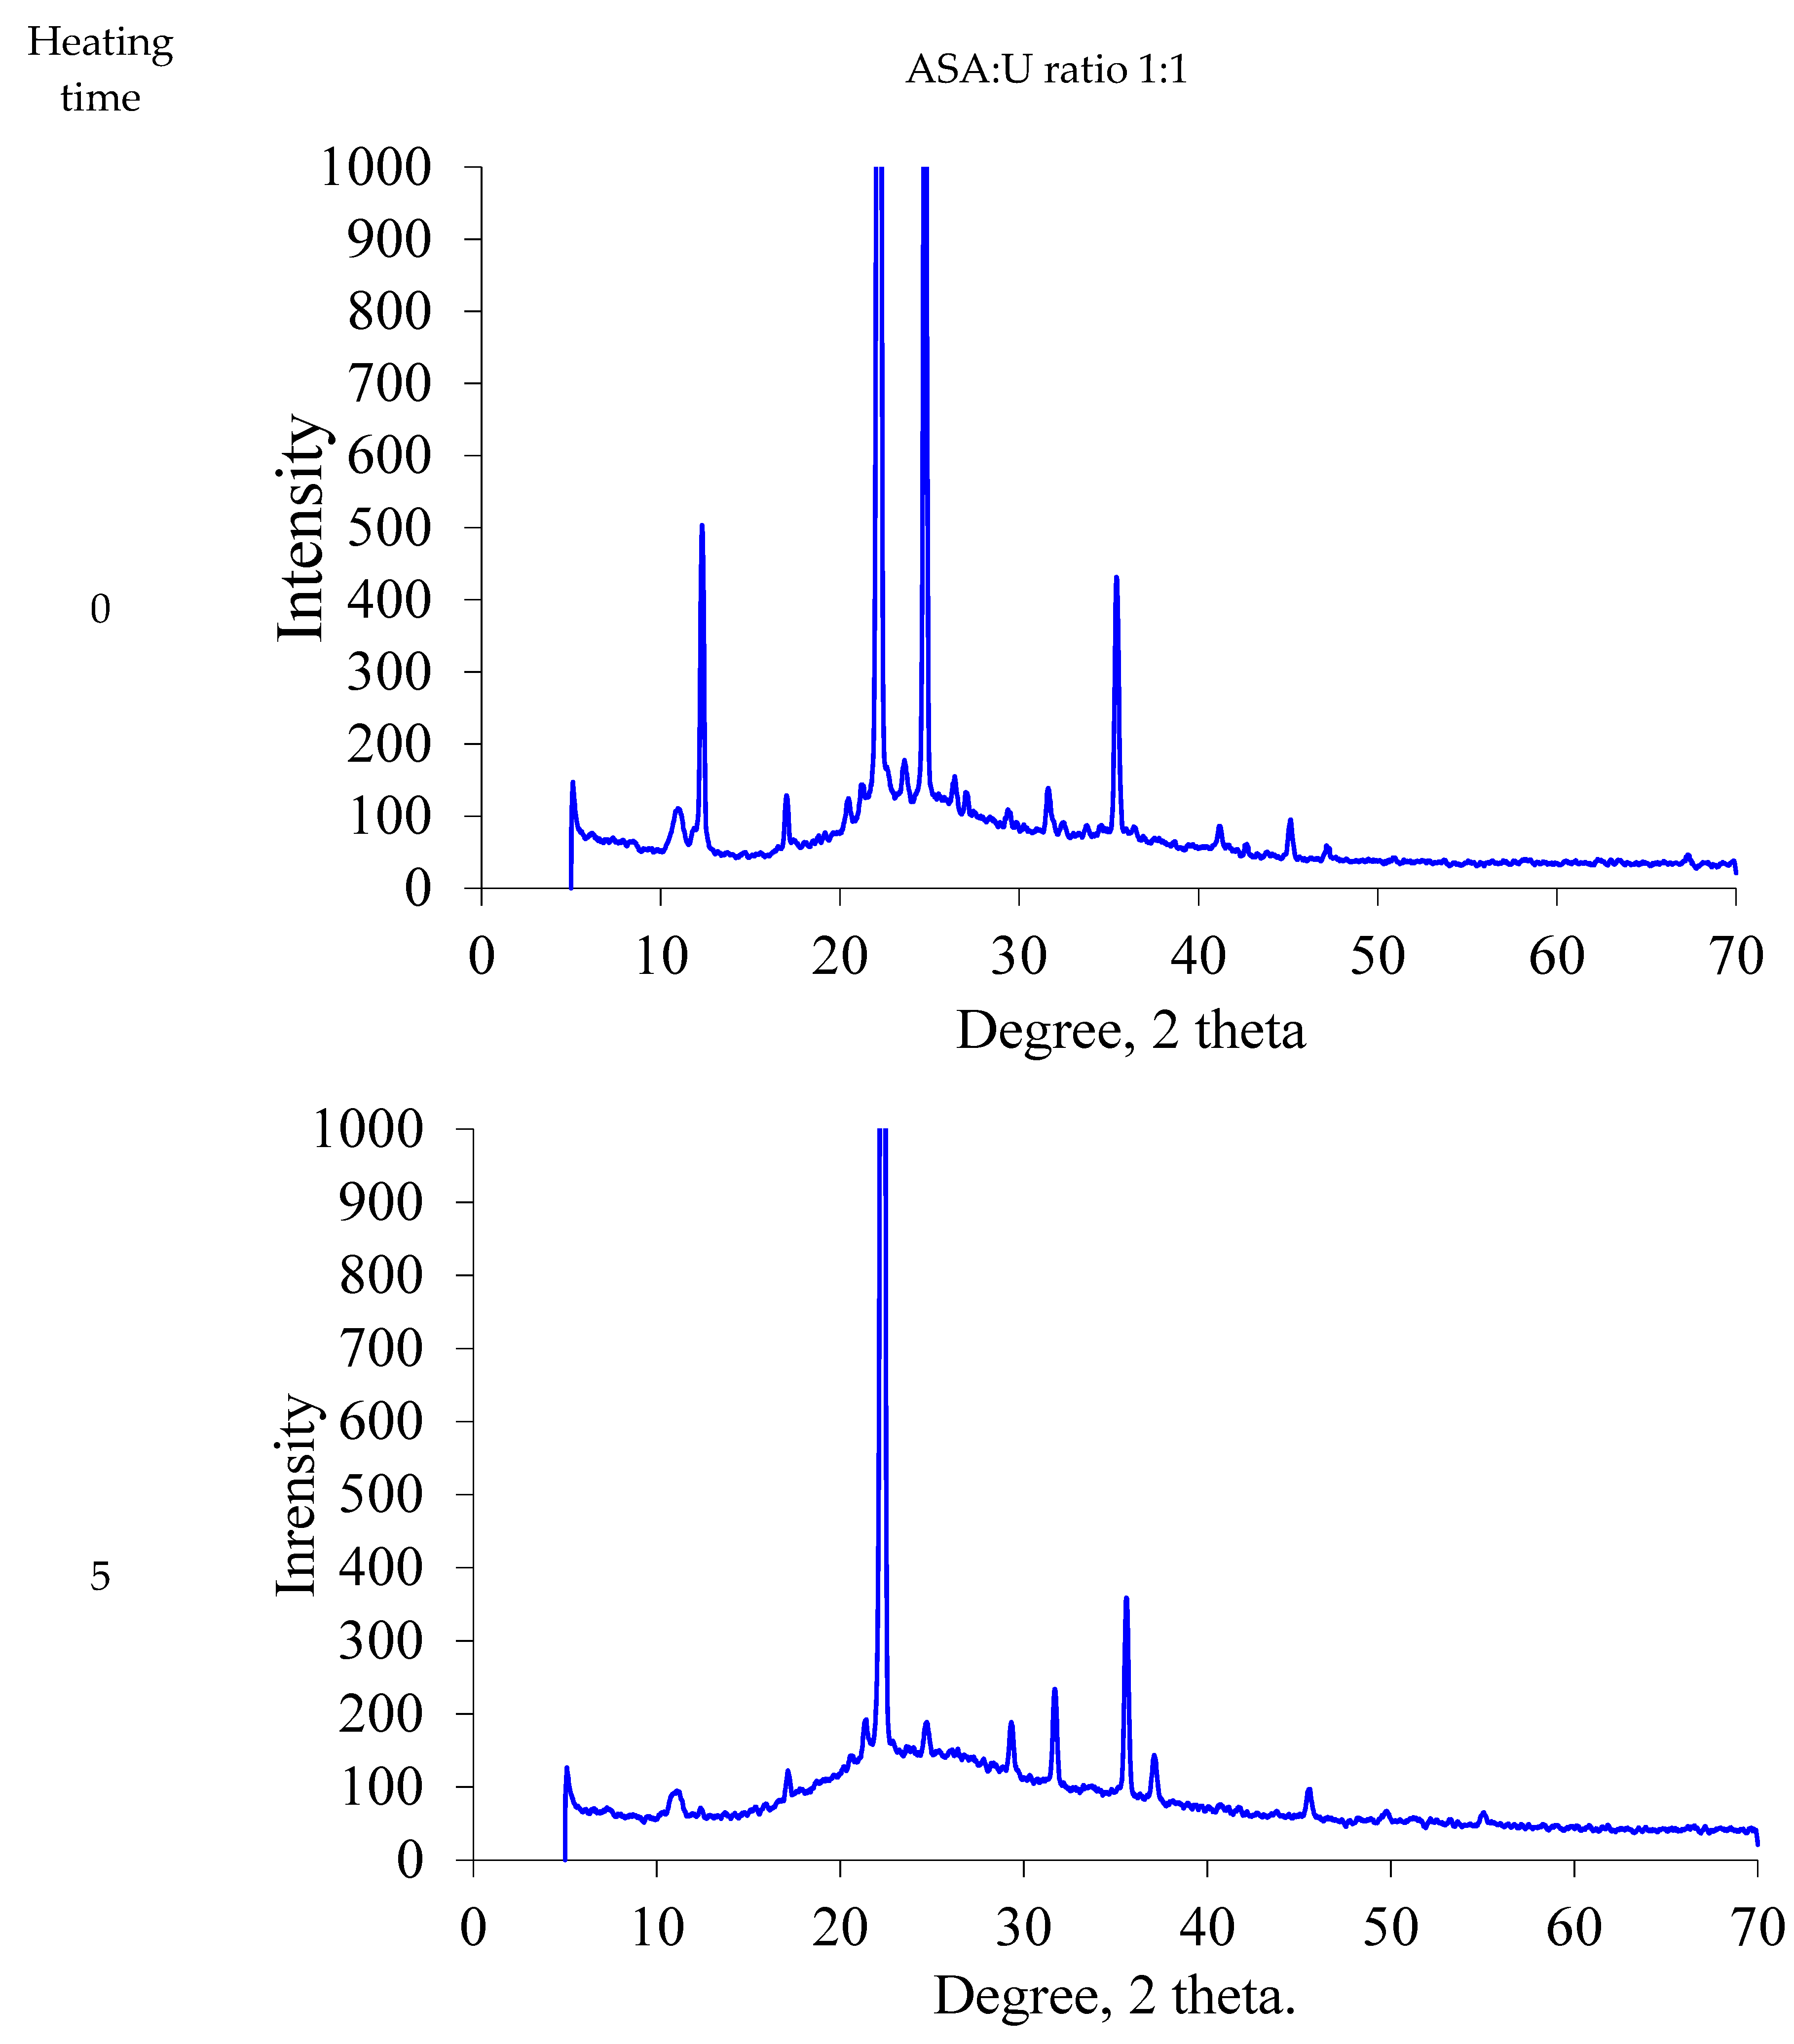
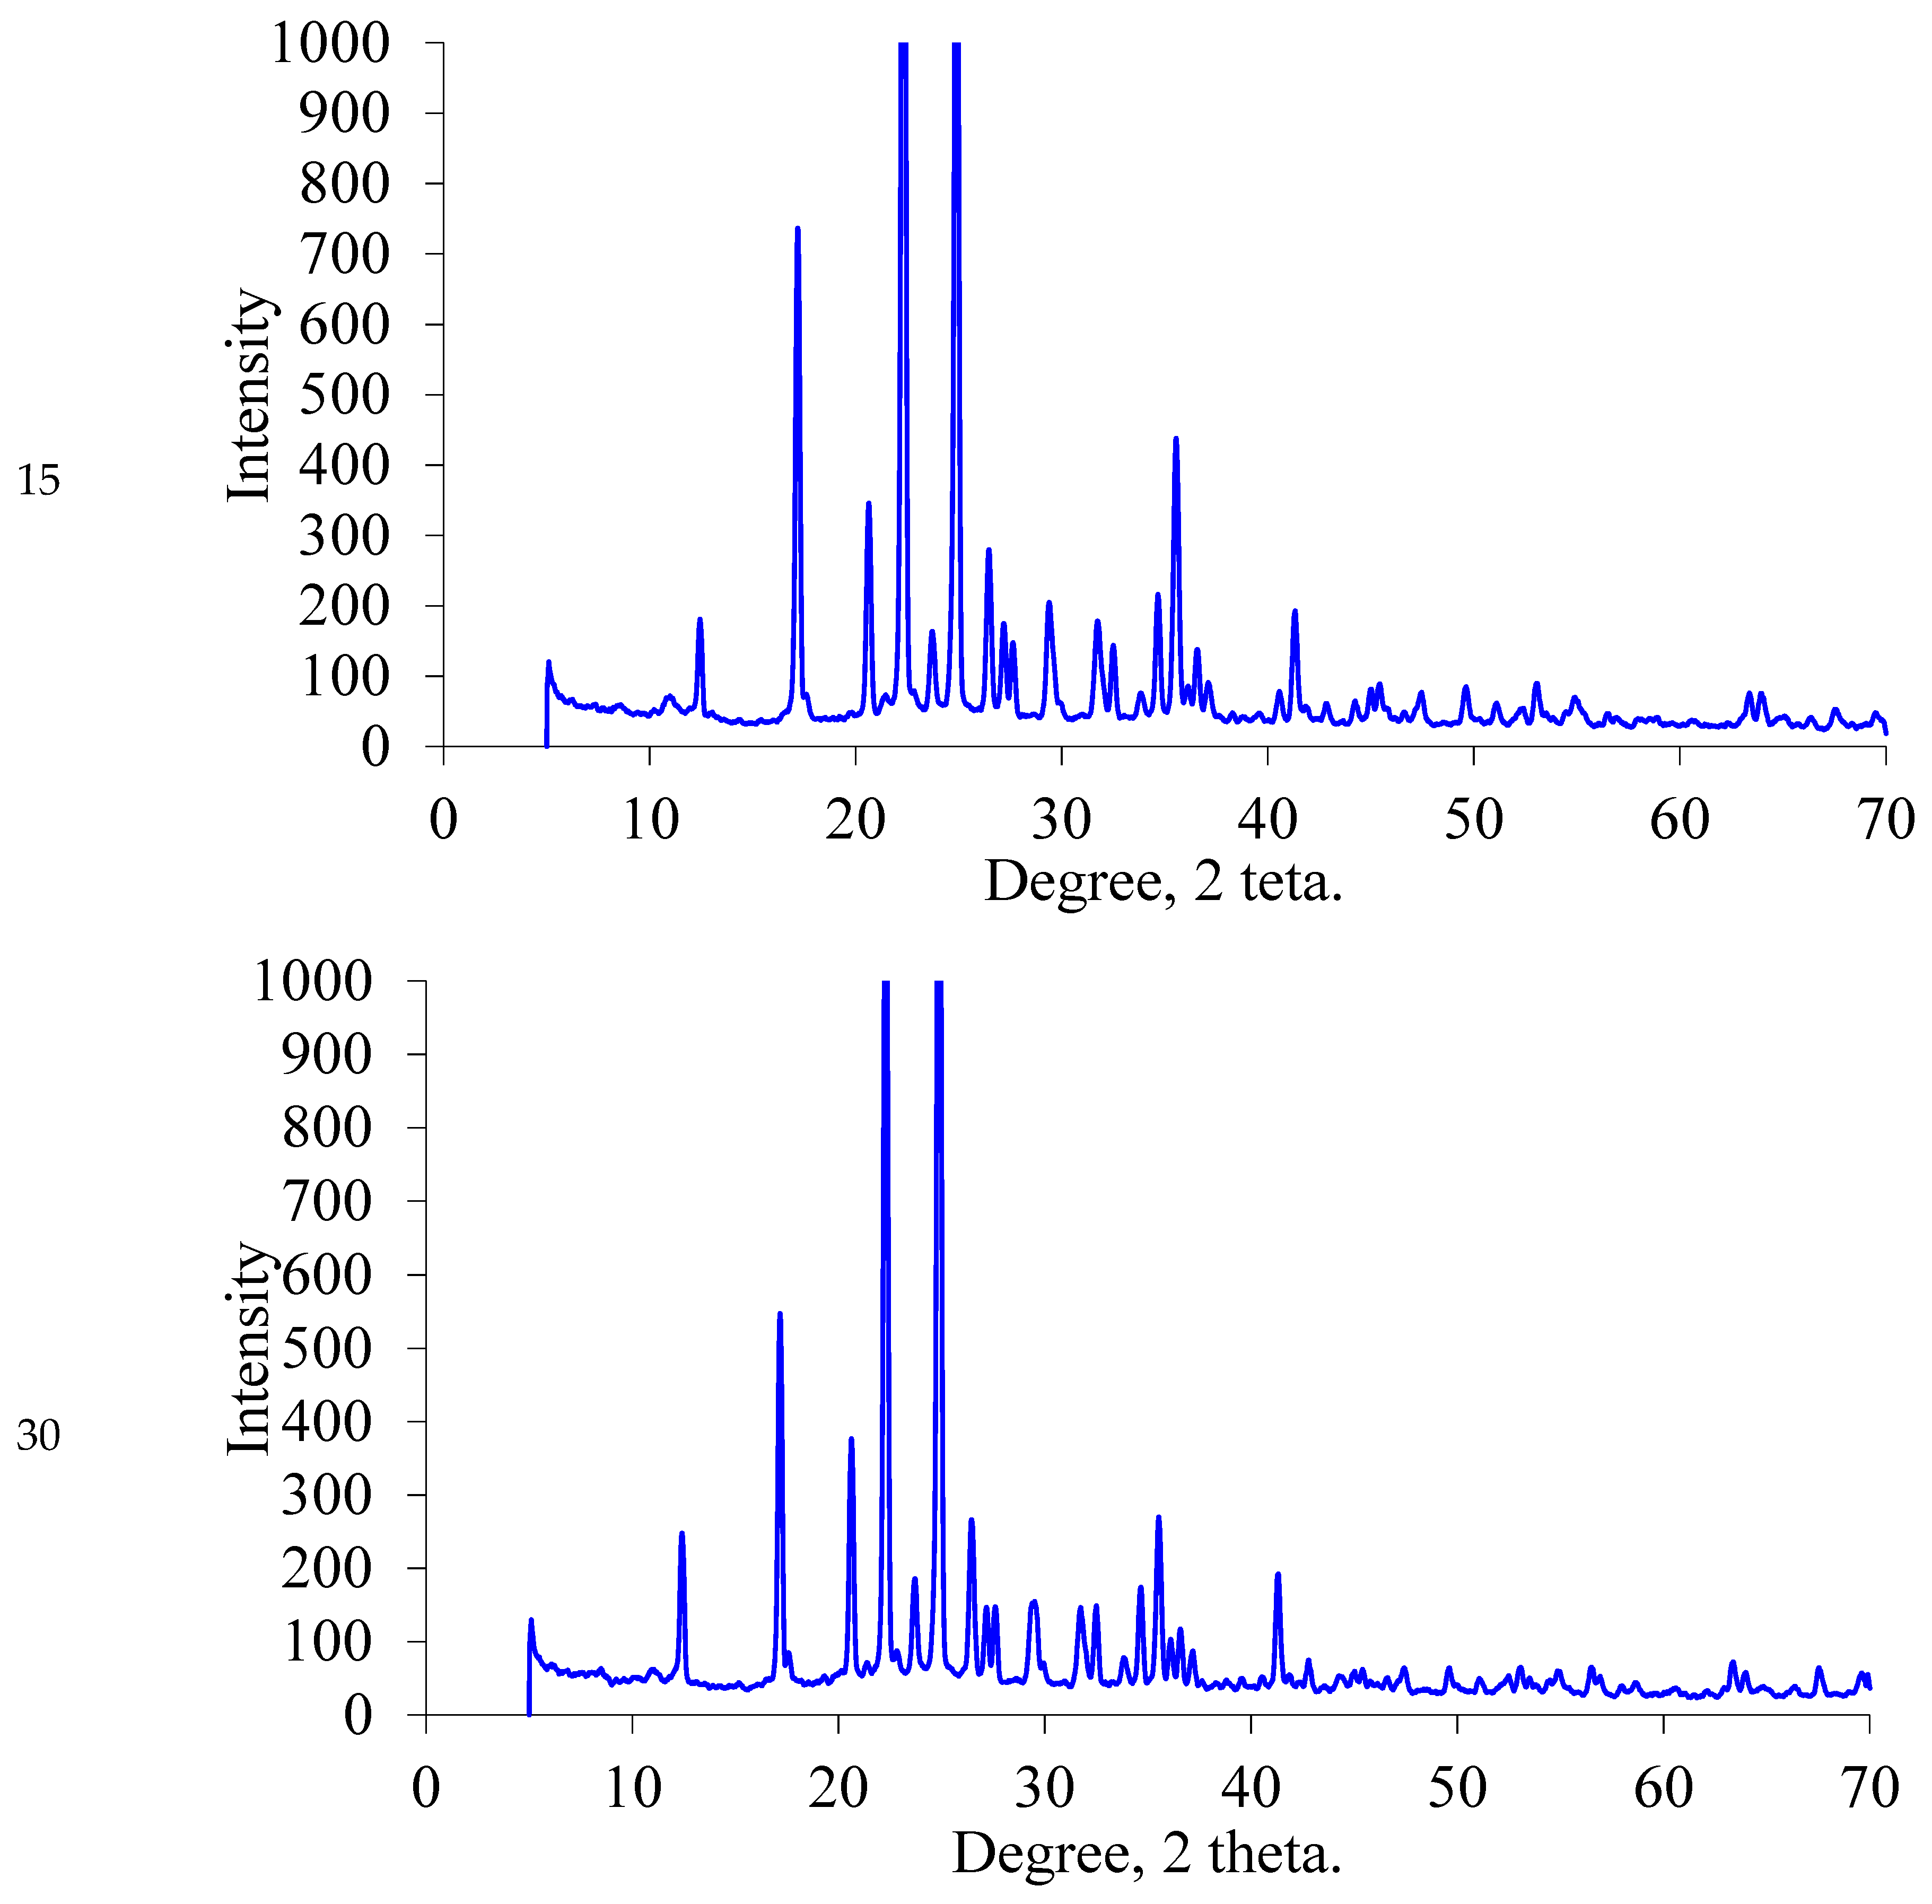
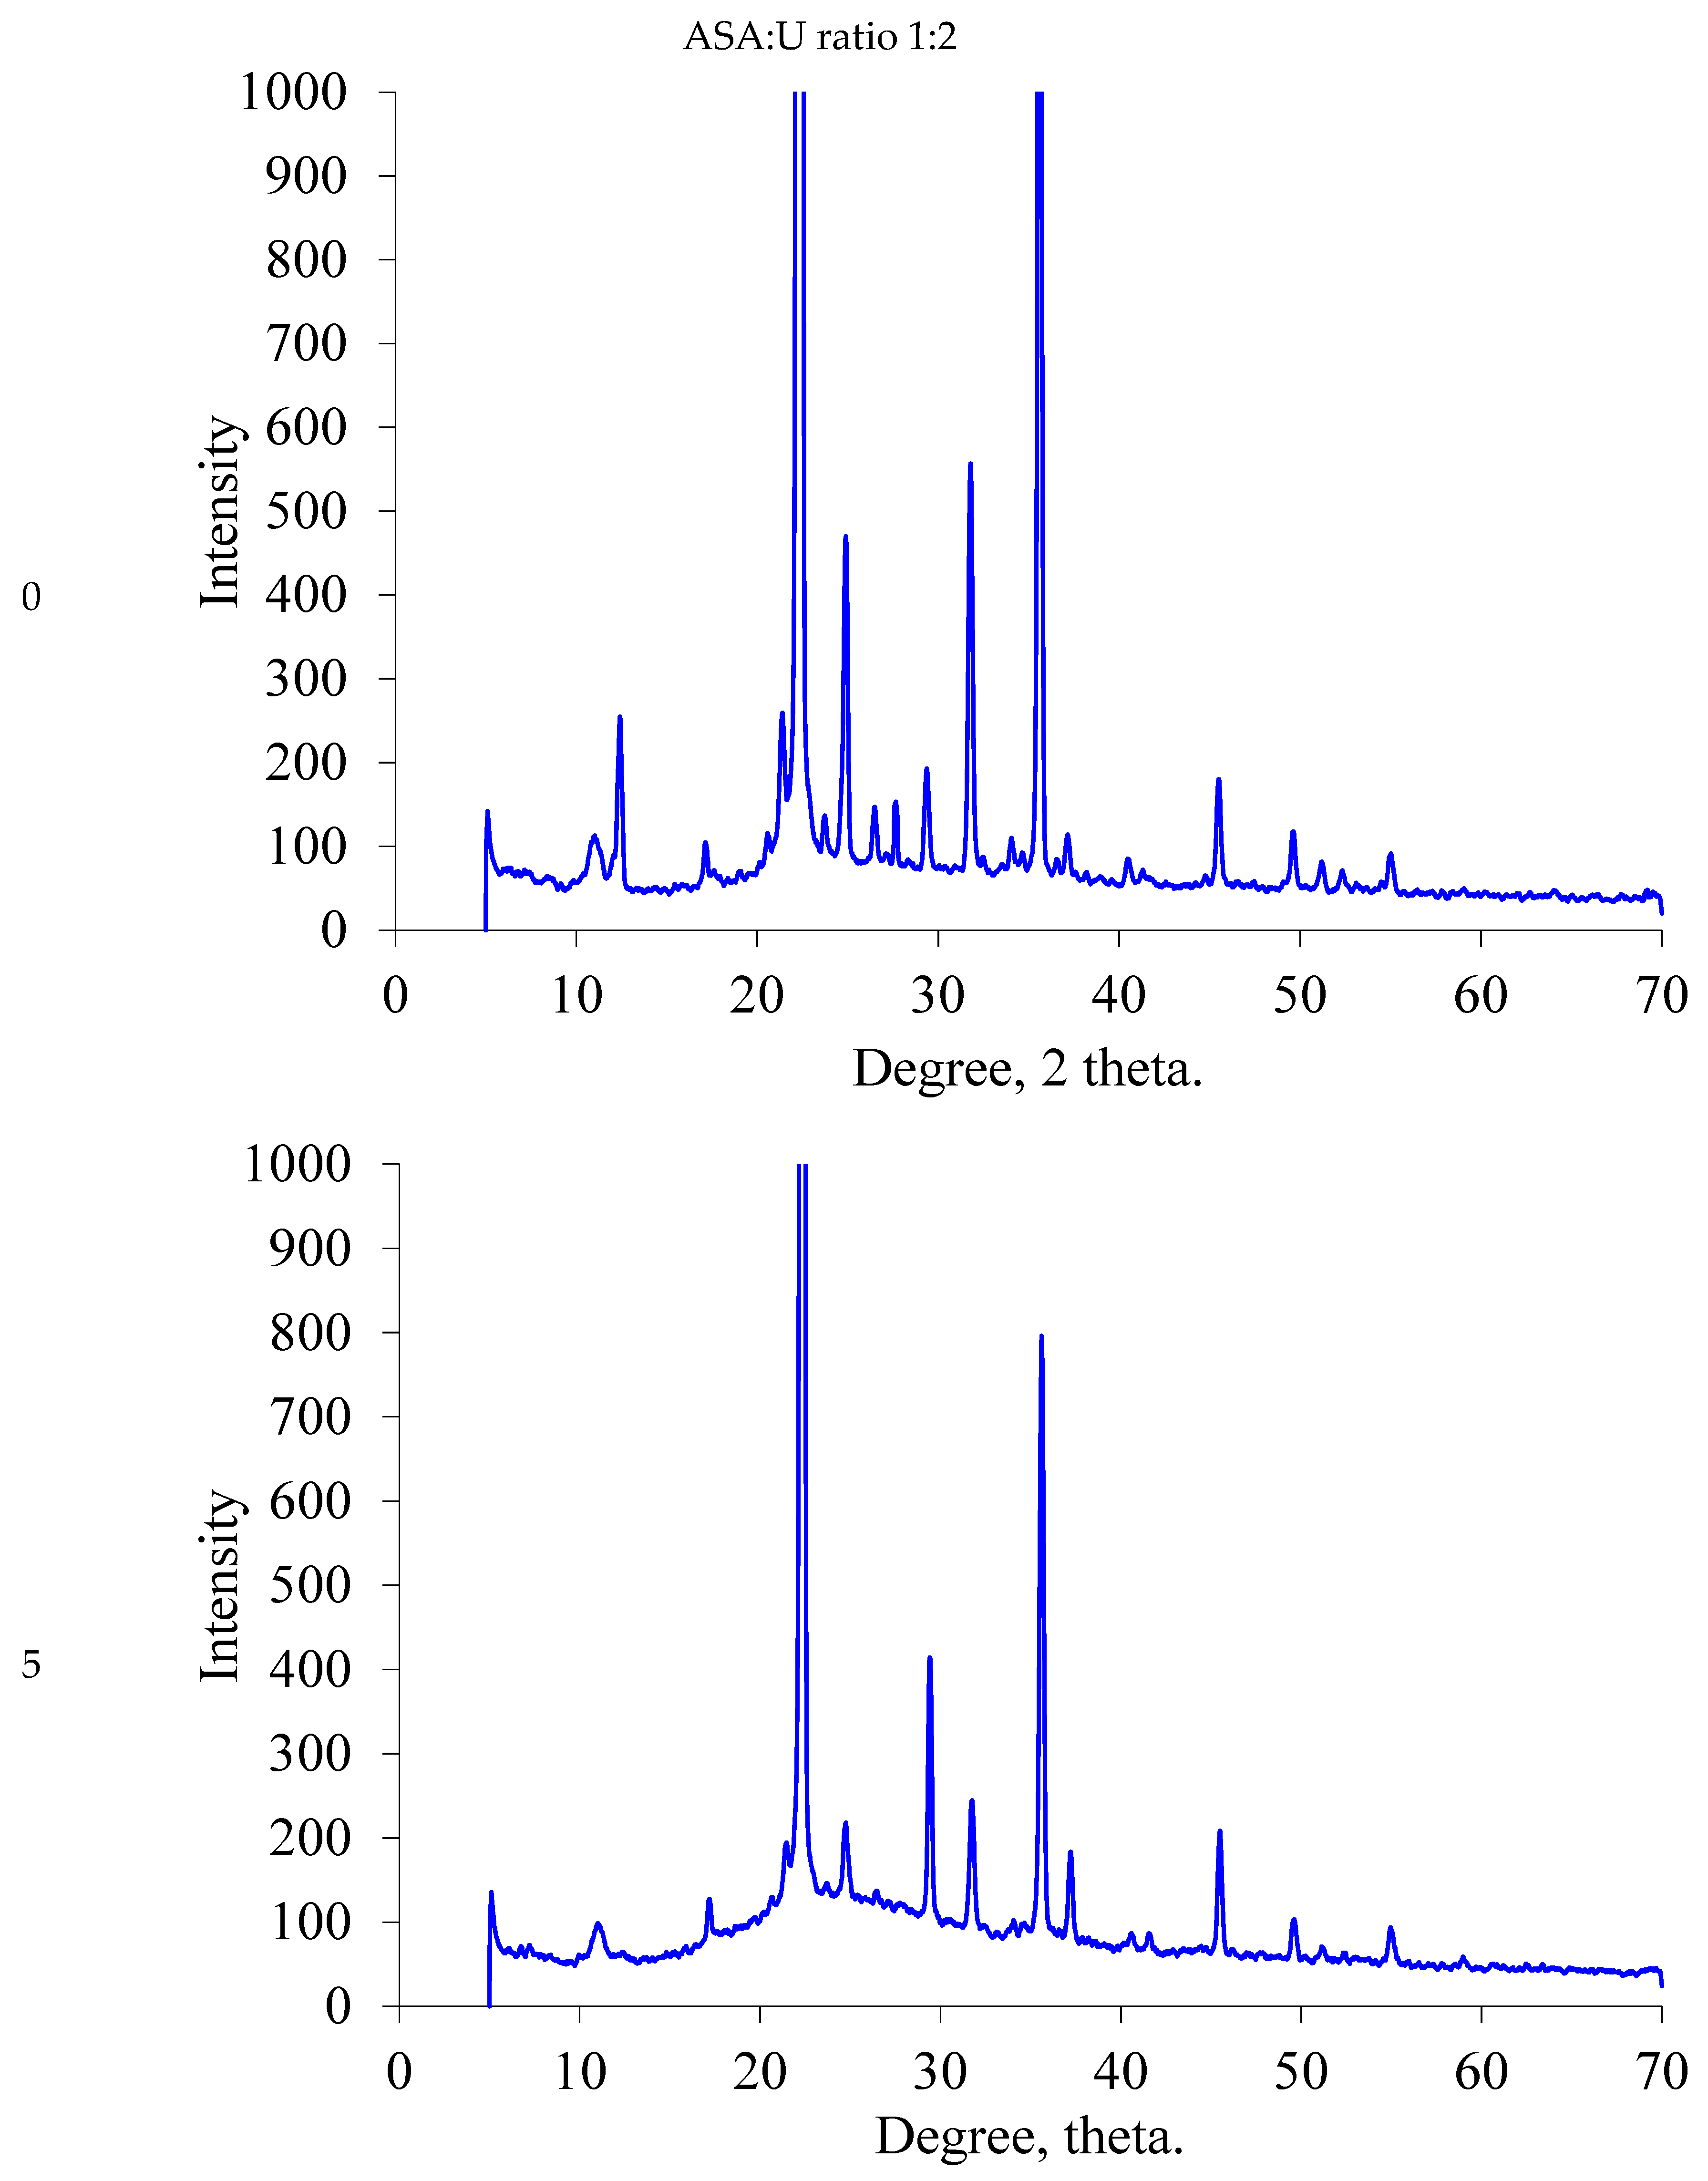
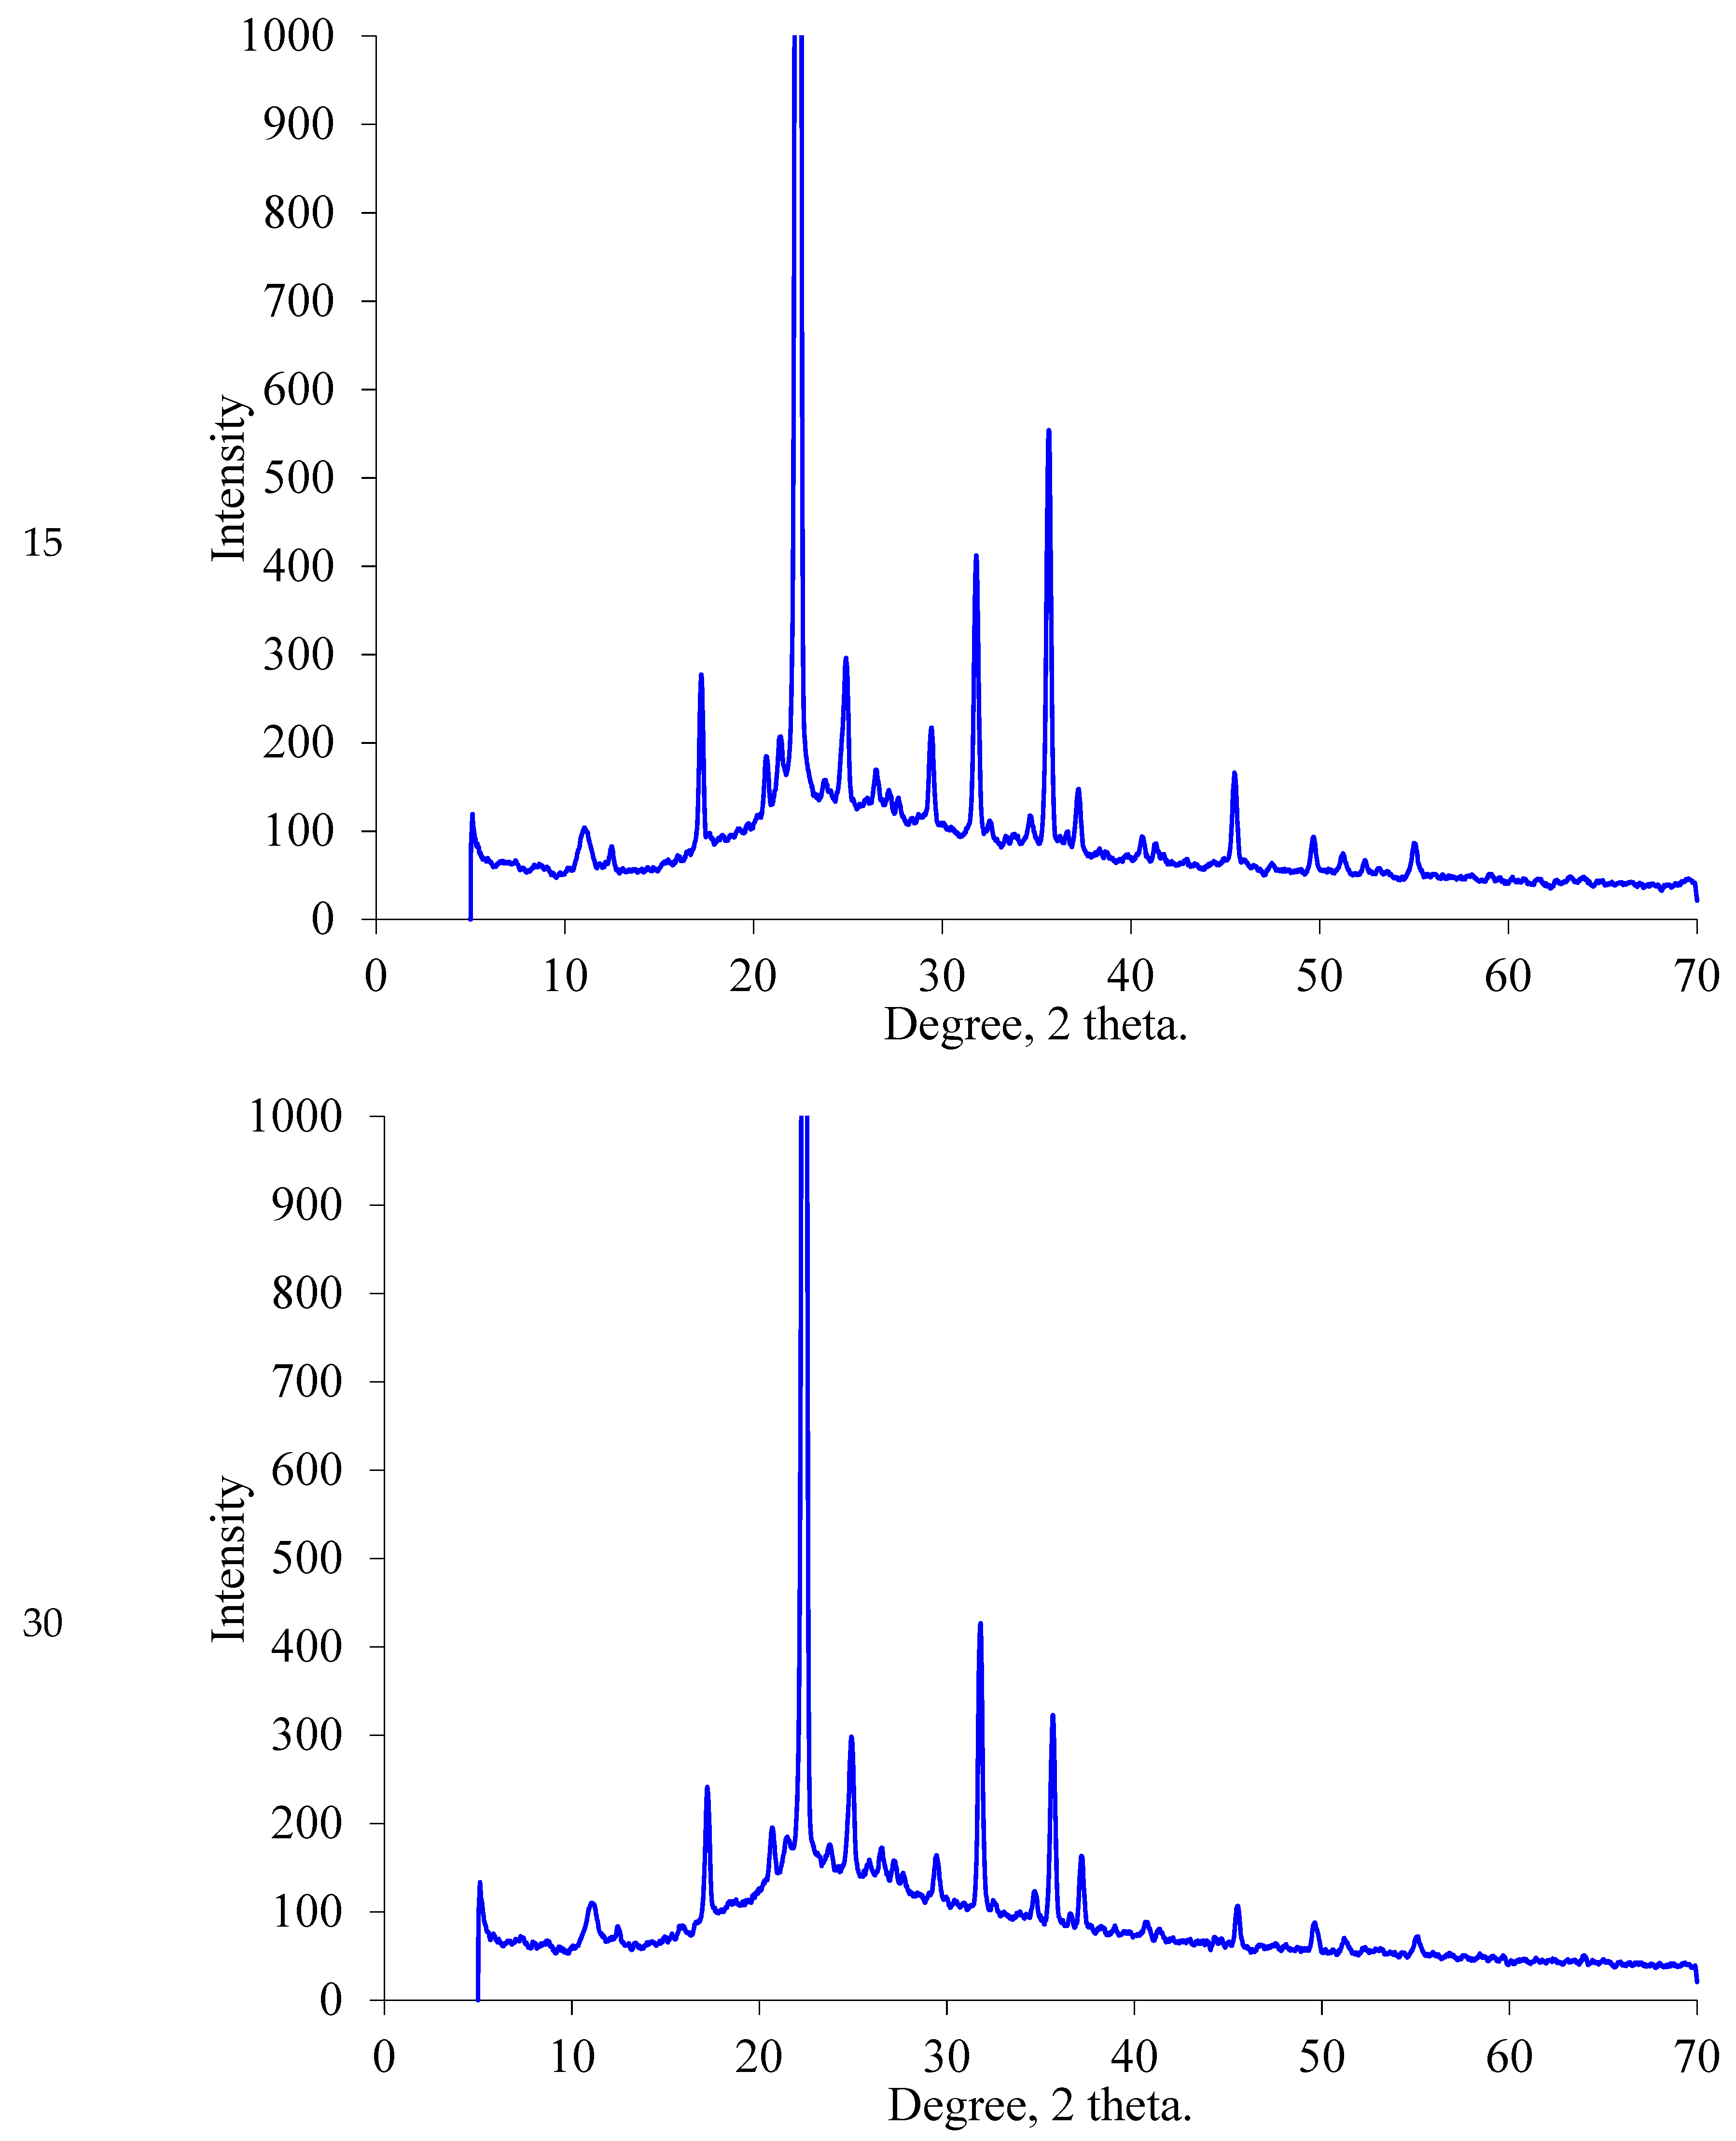
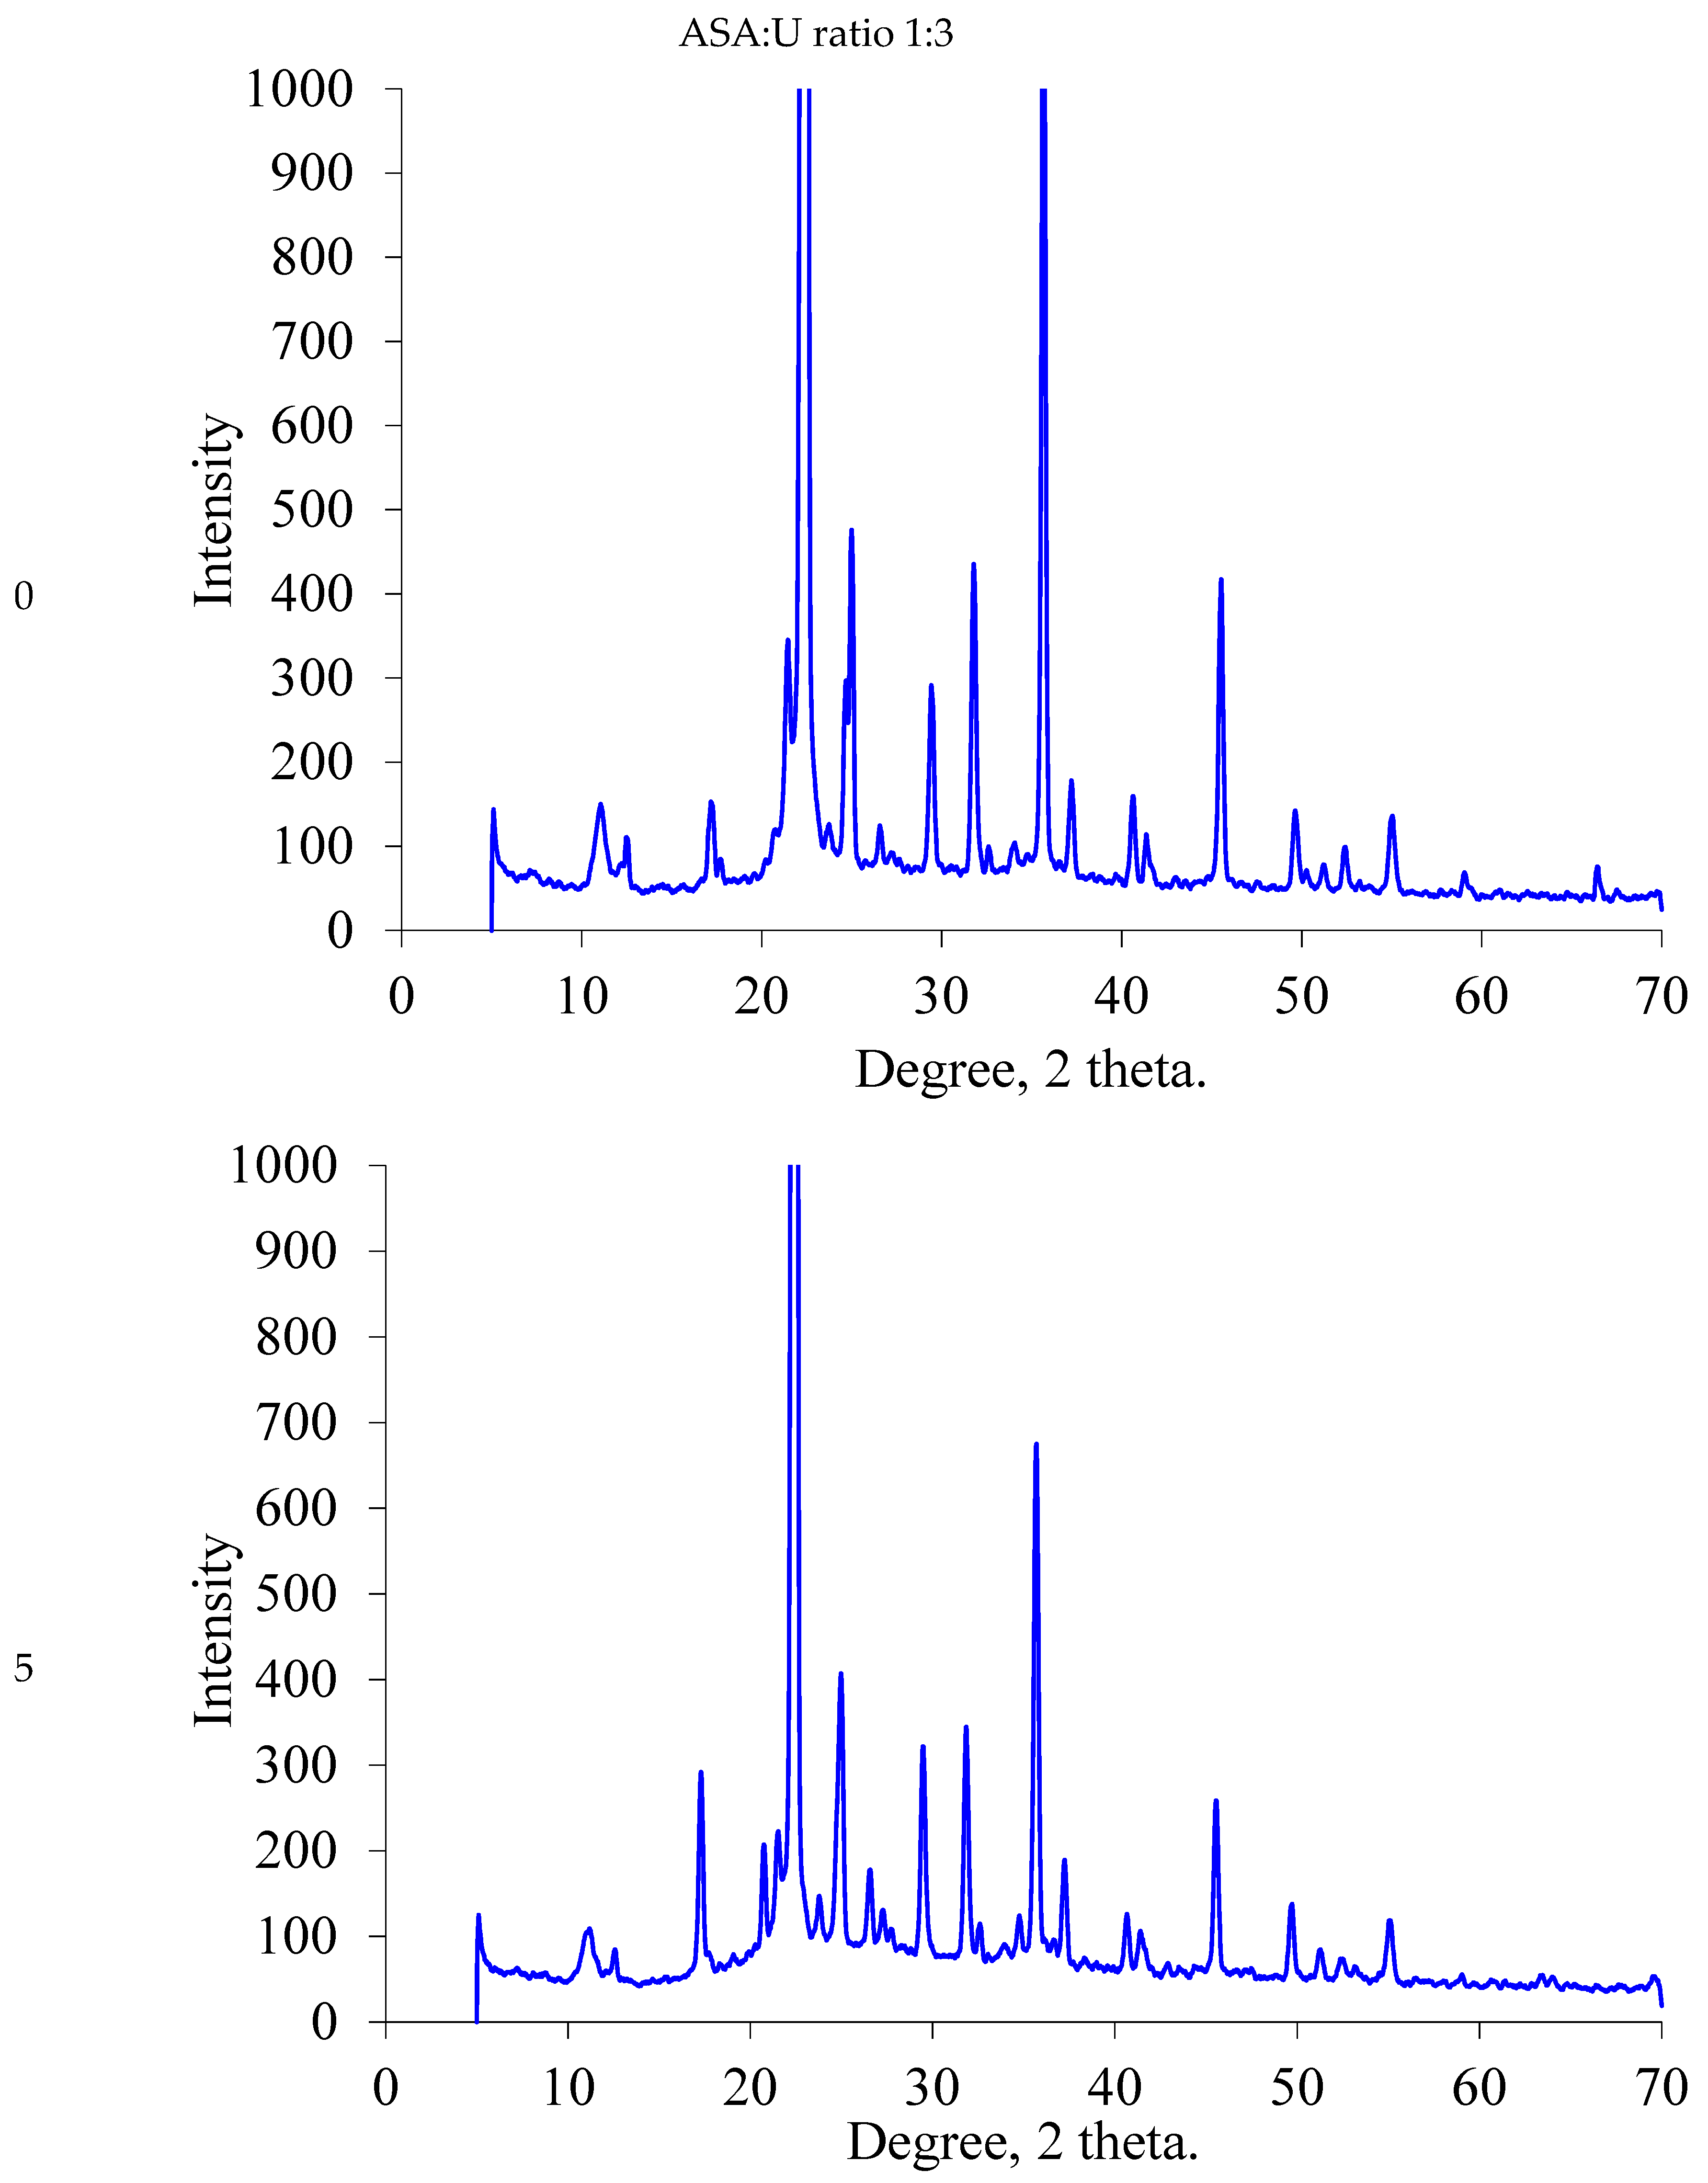
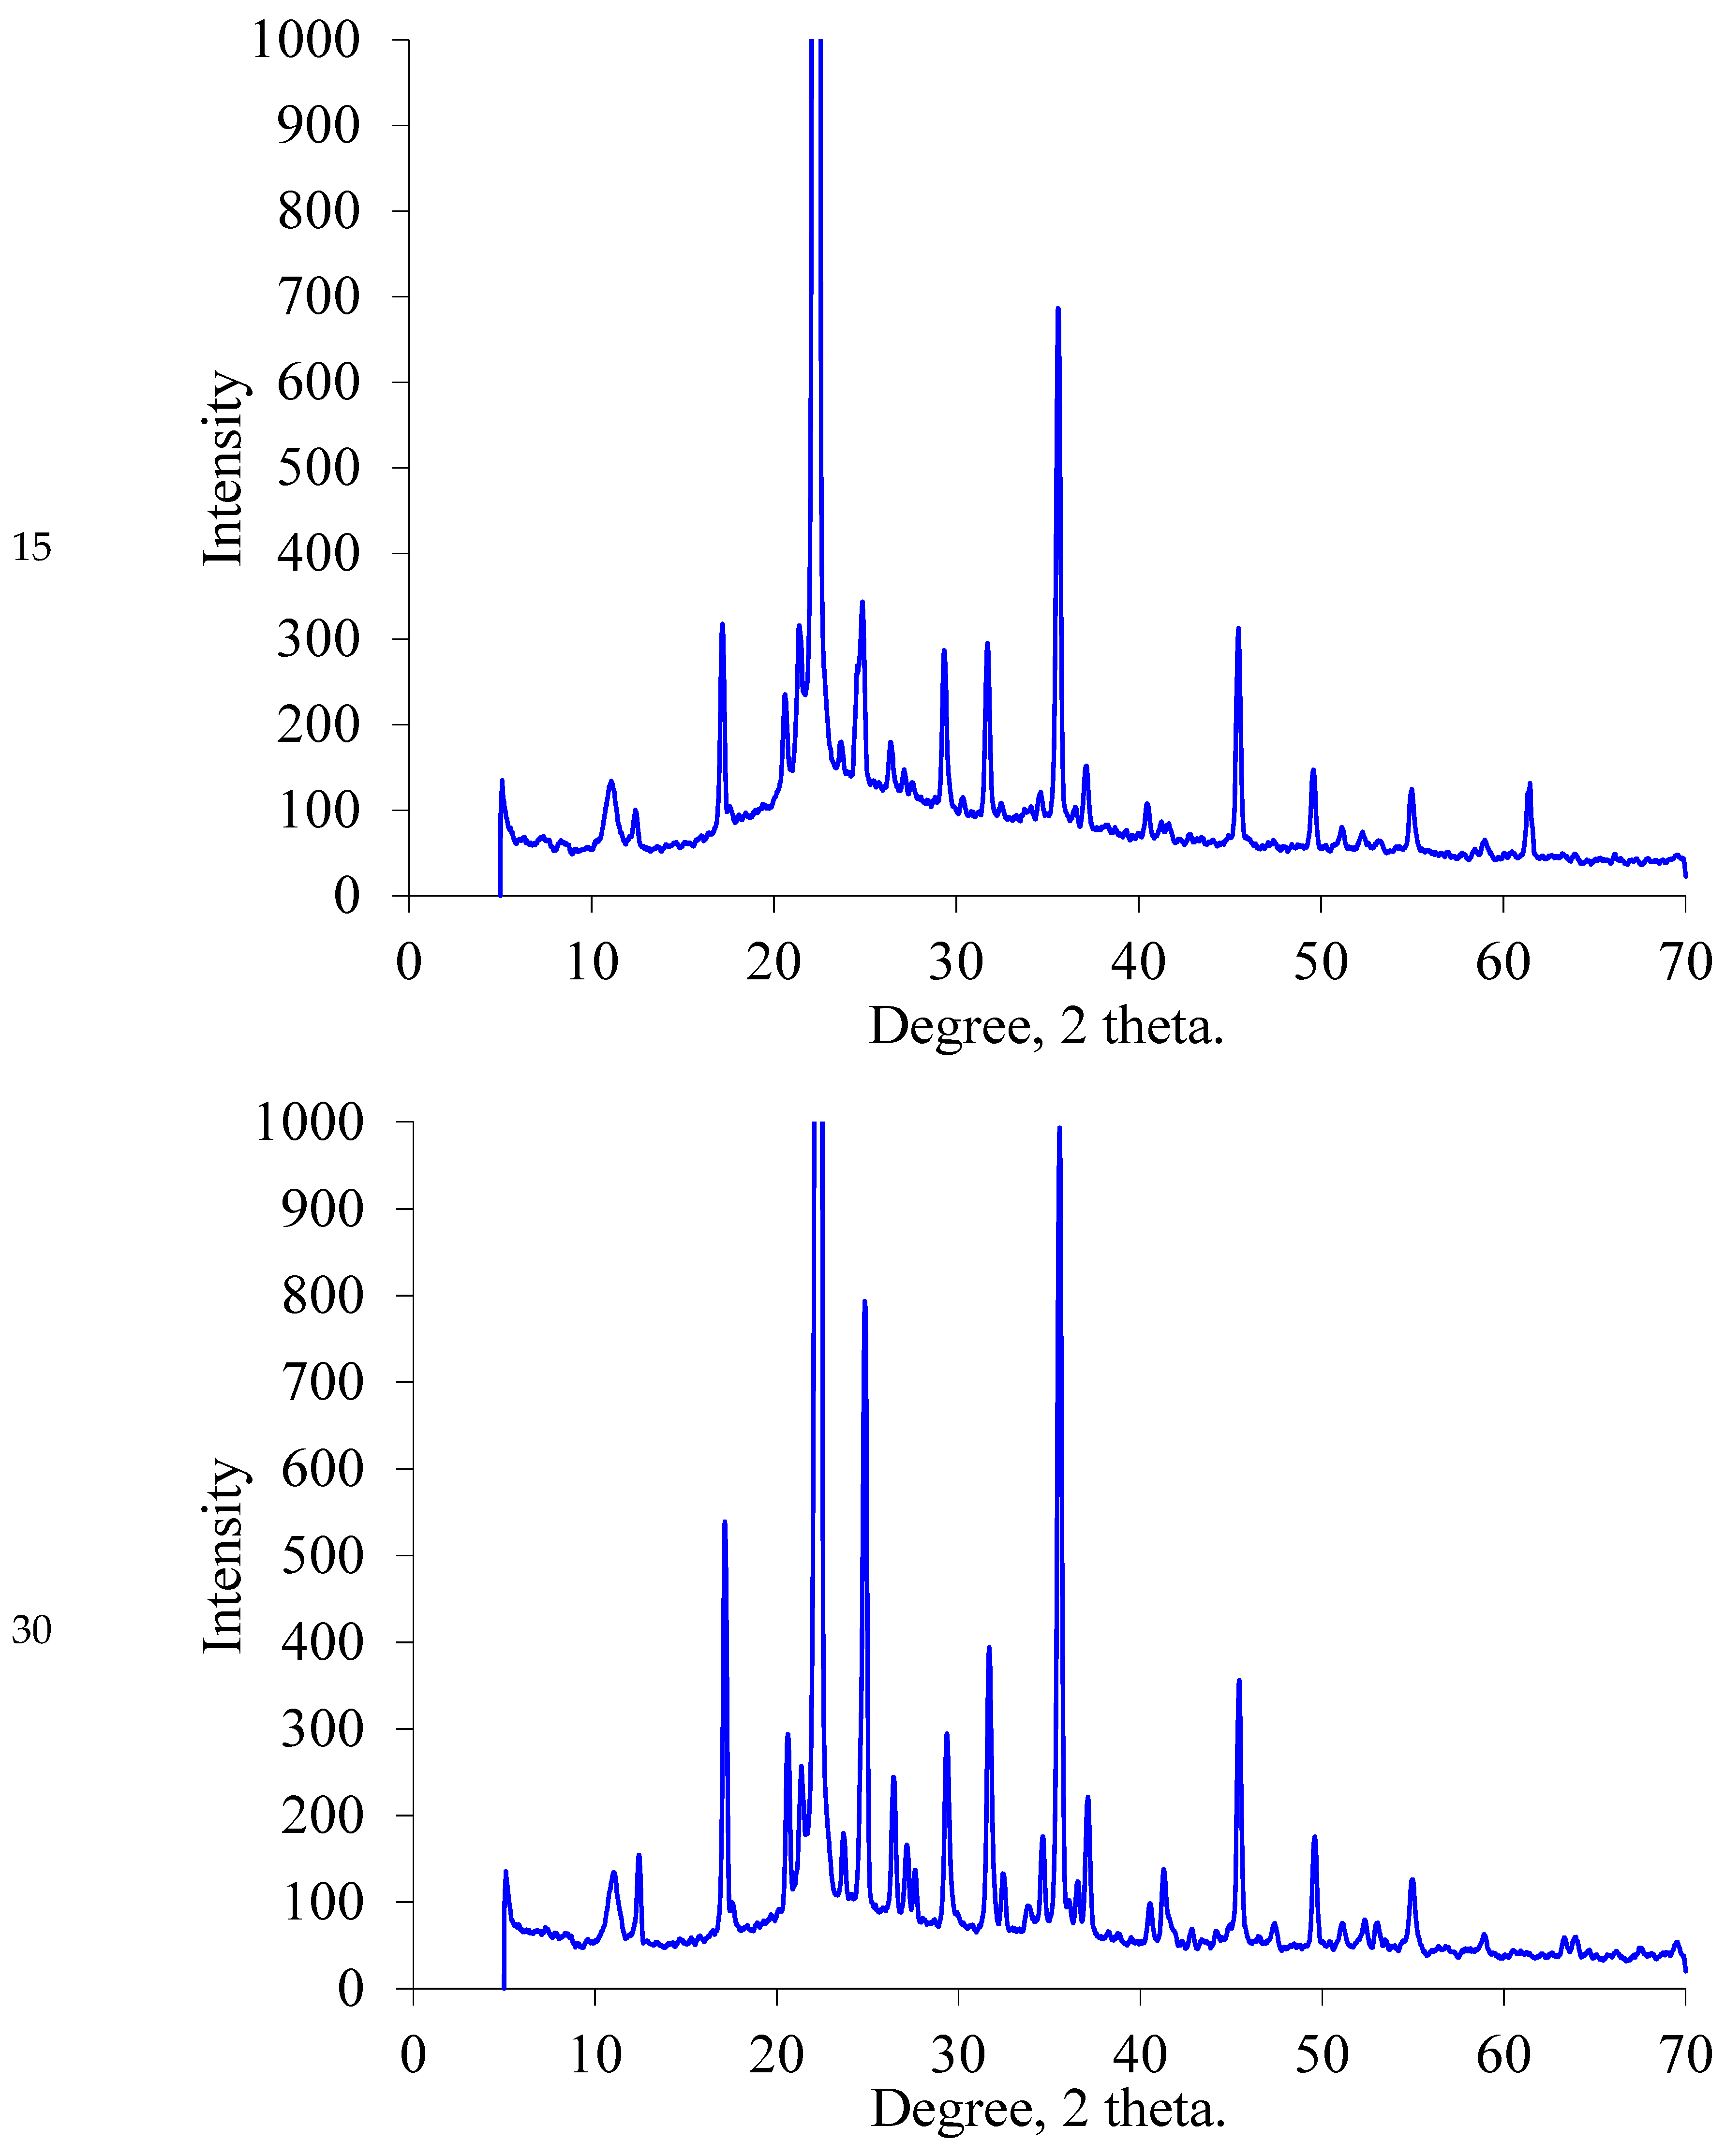
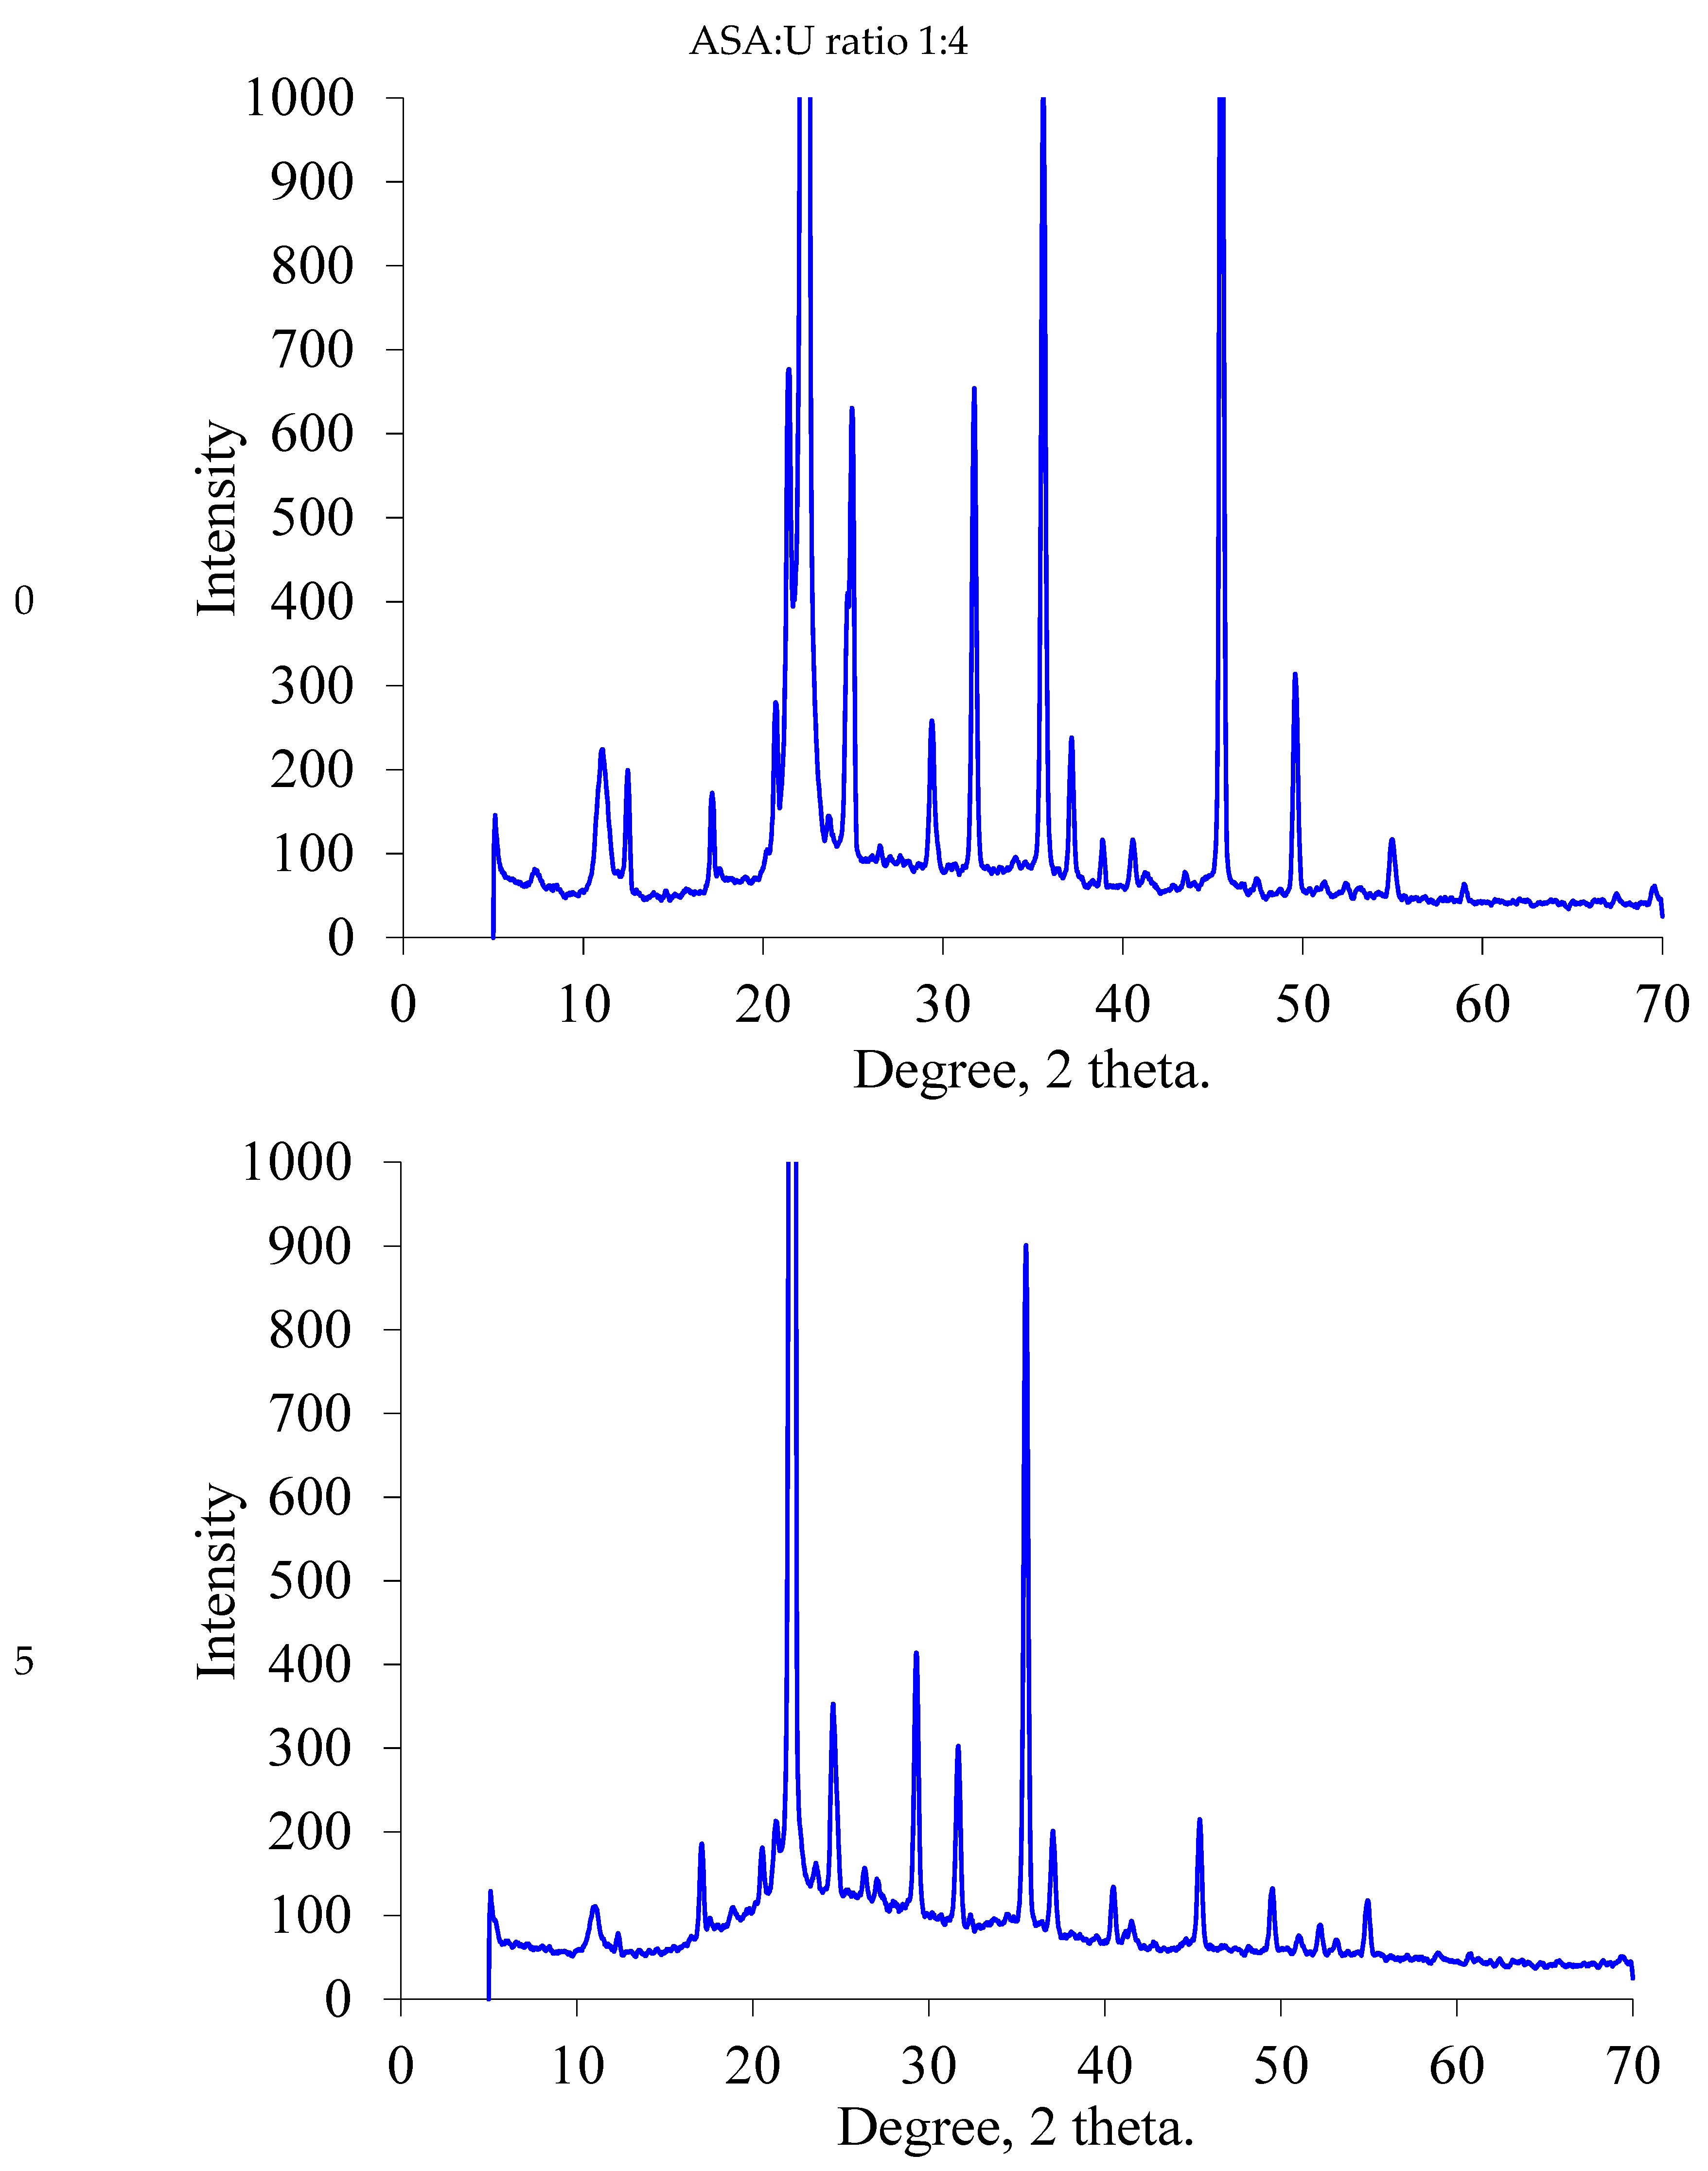
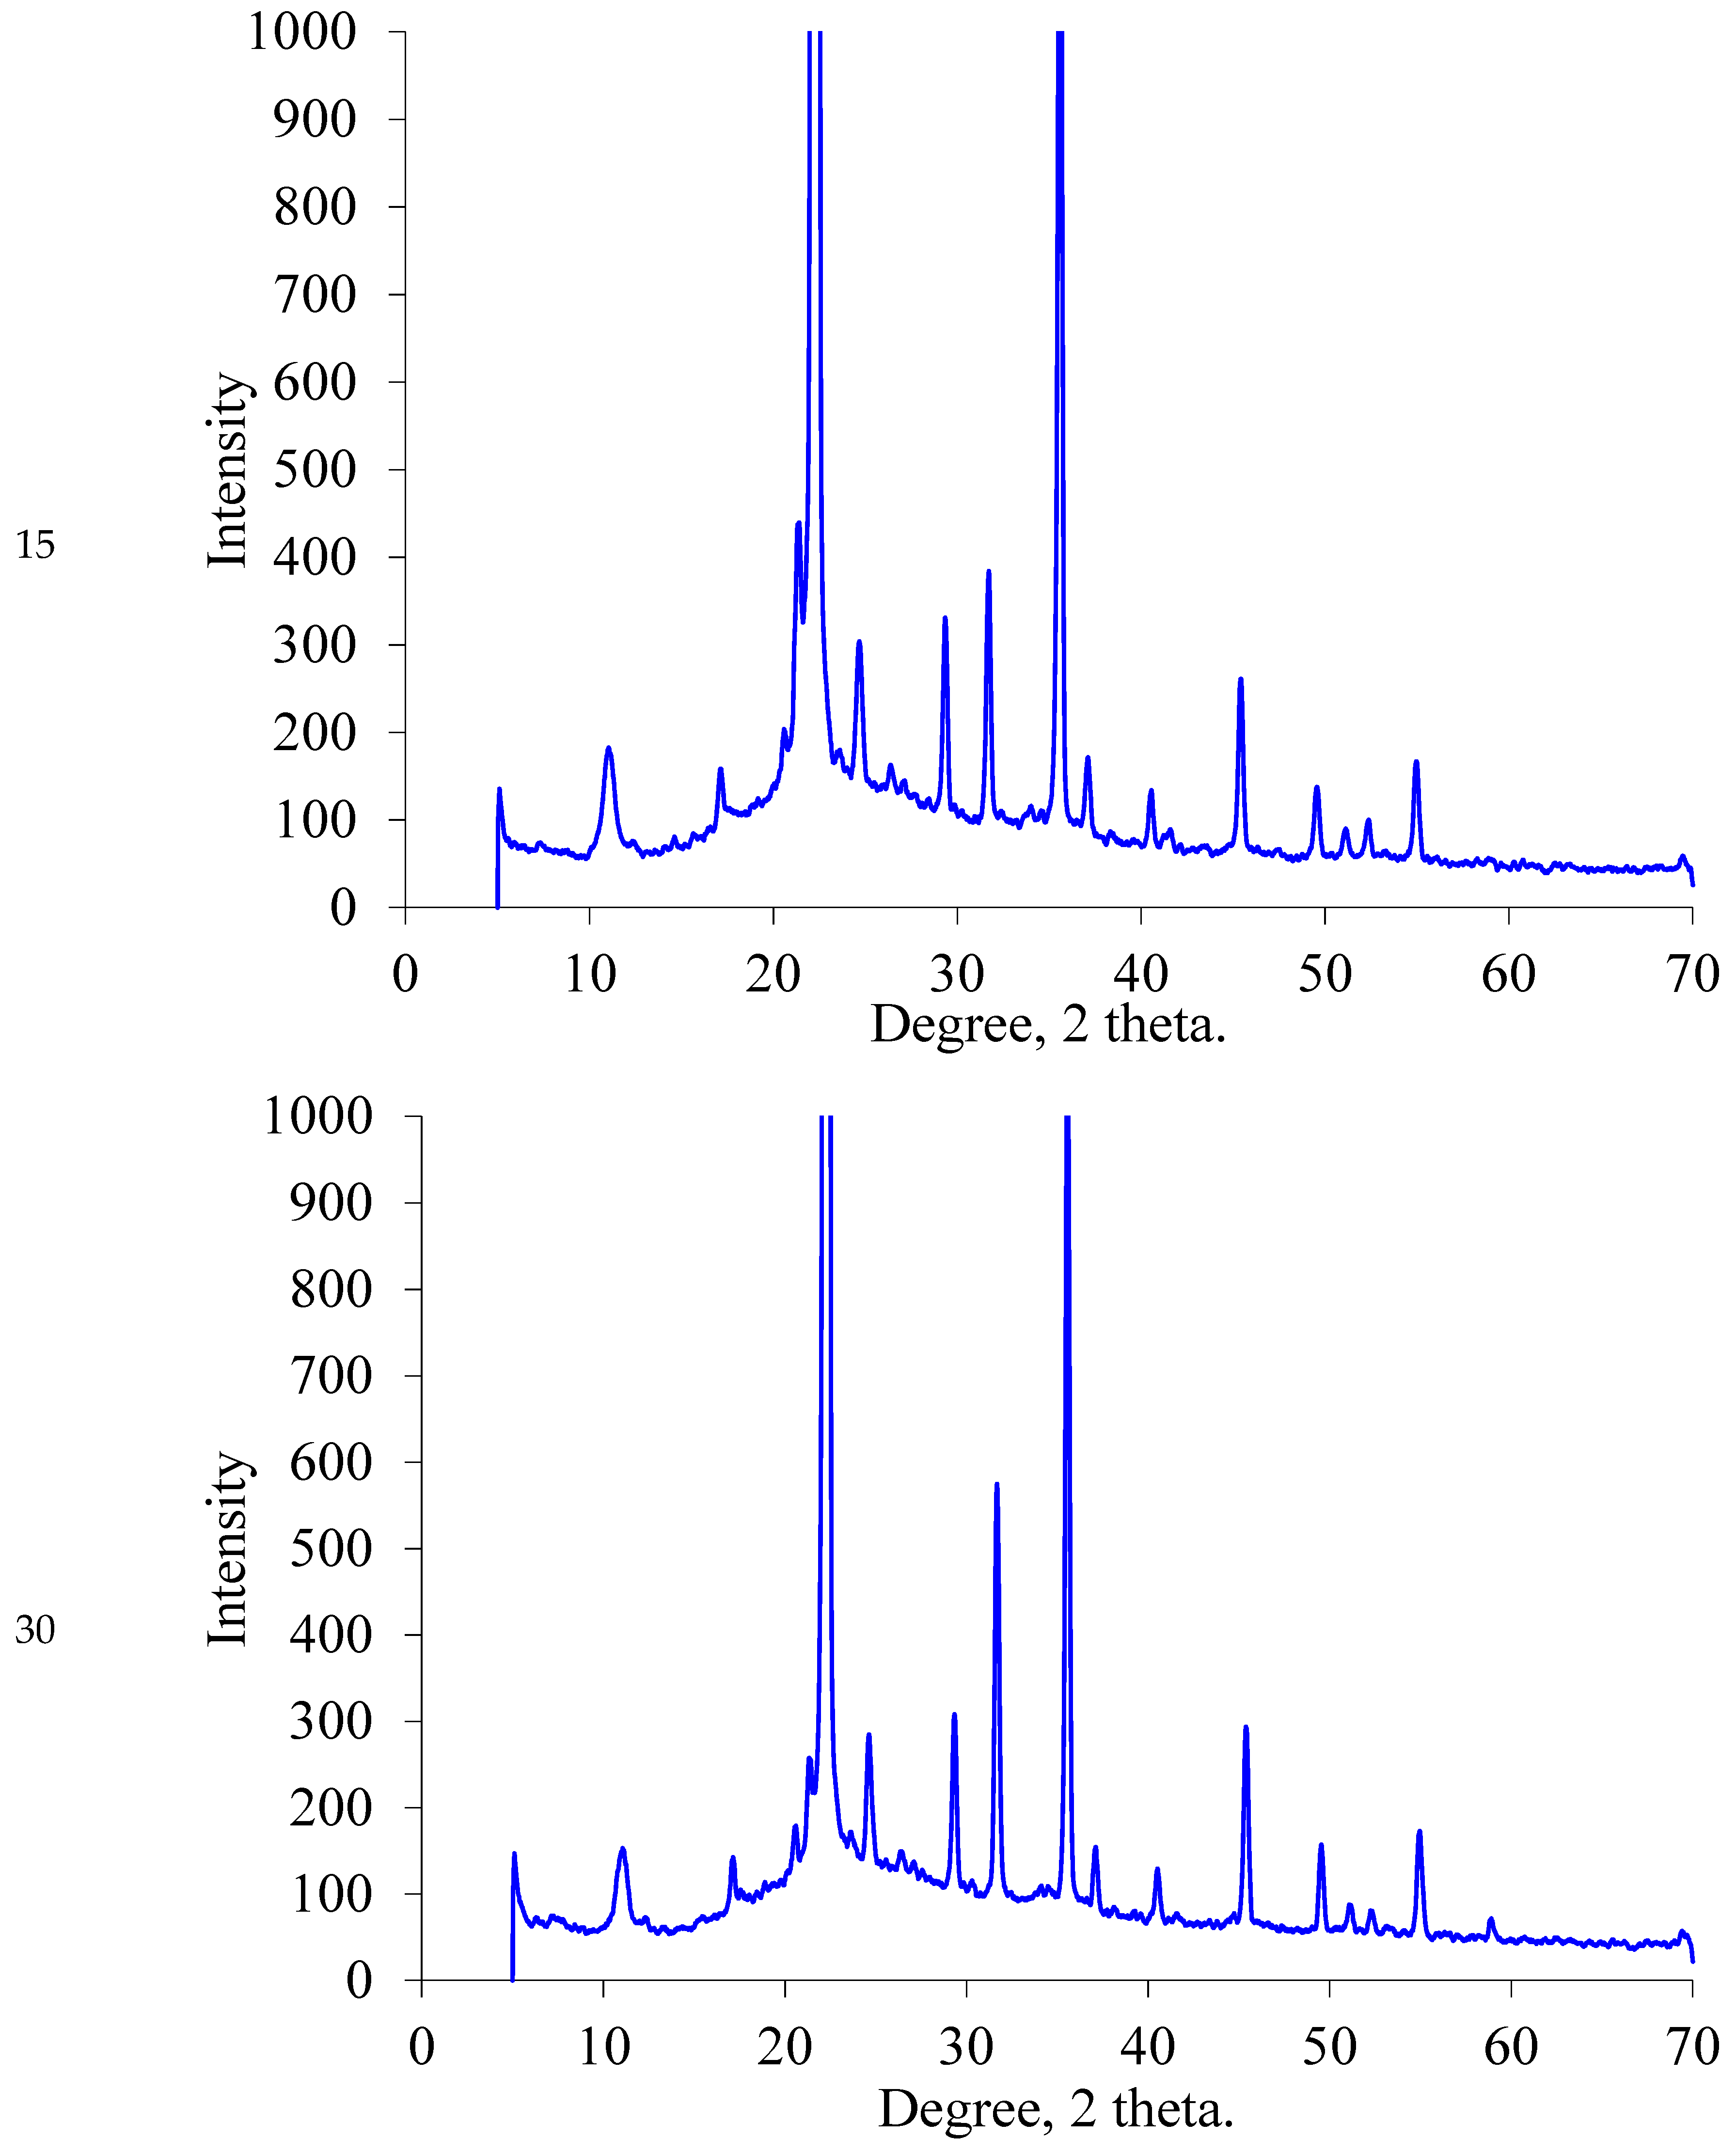
2.1.2. XRD
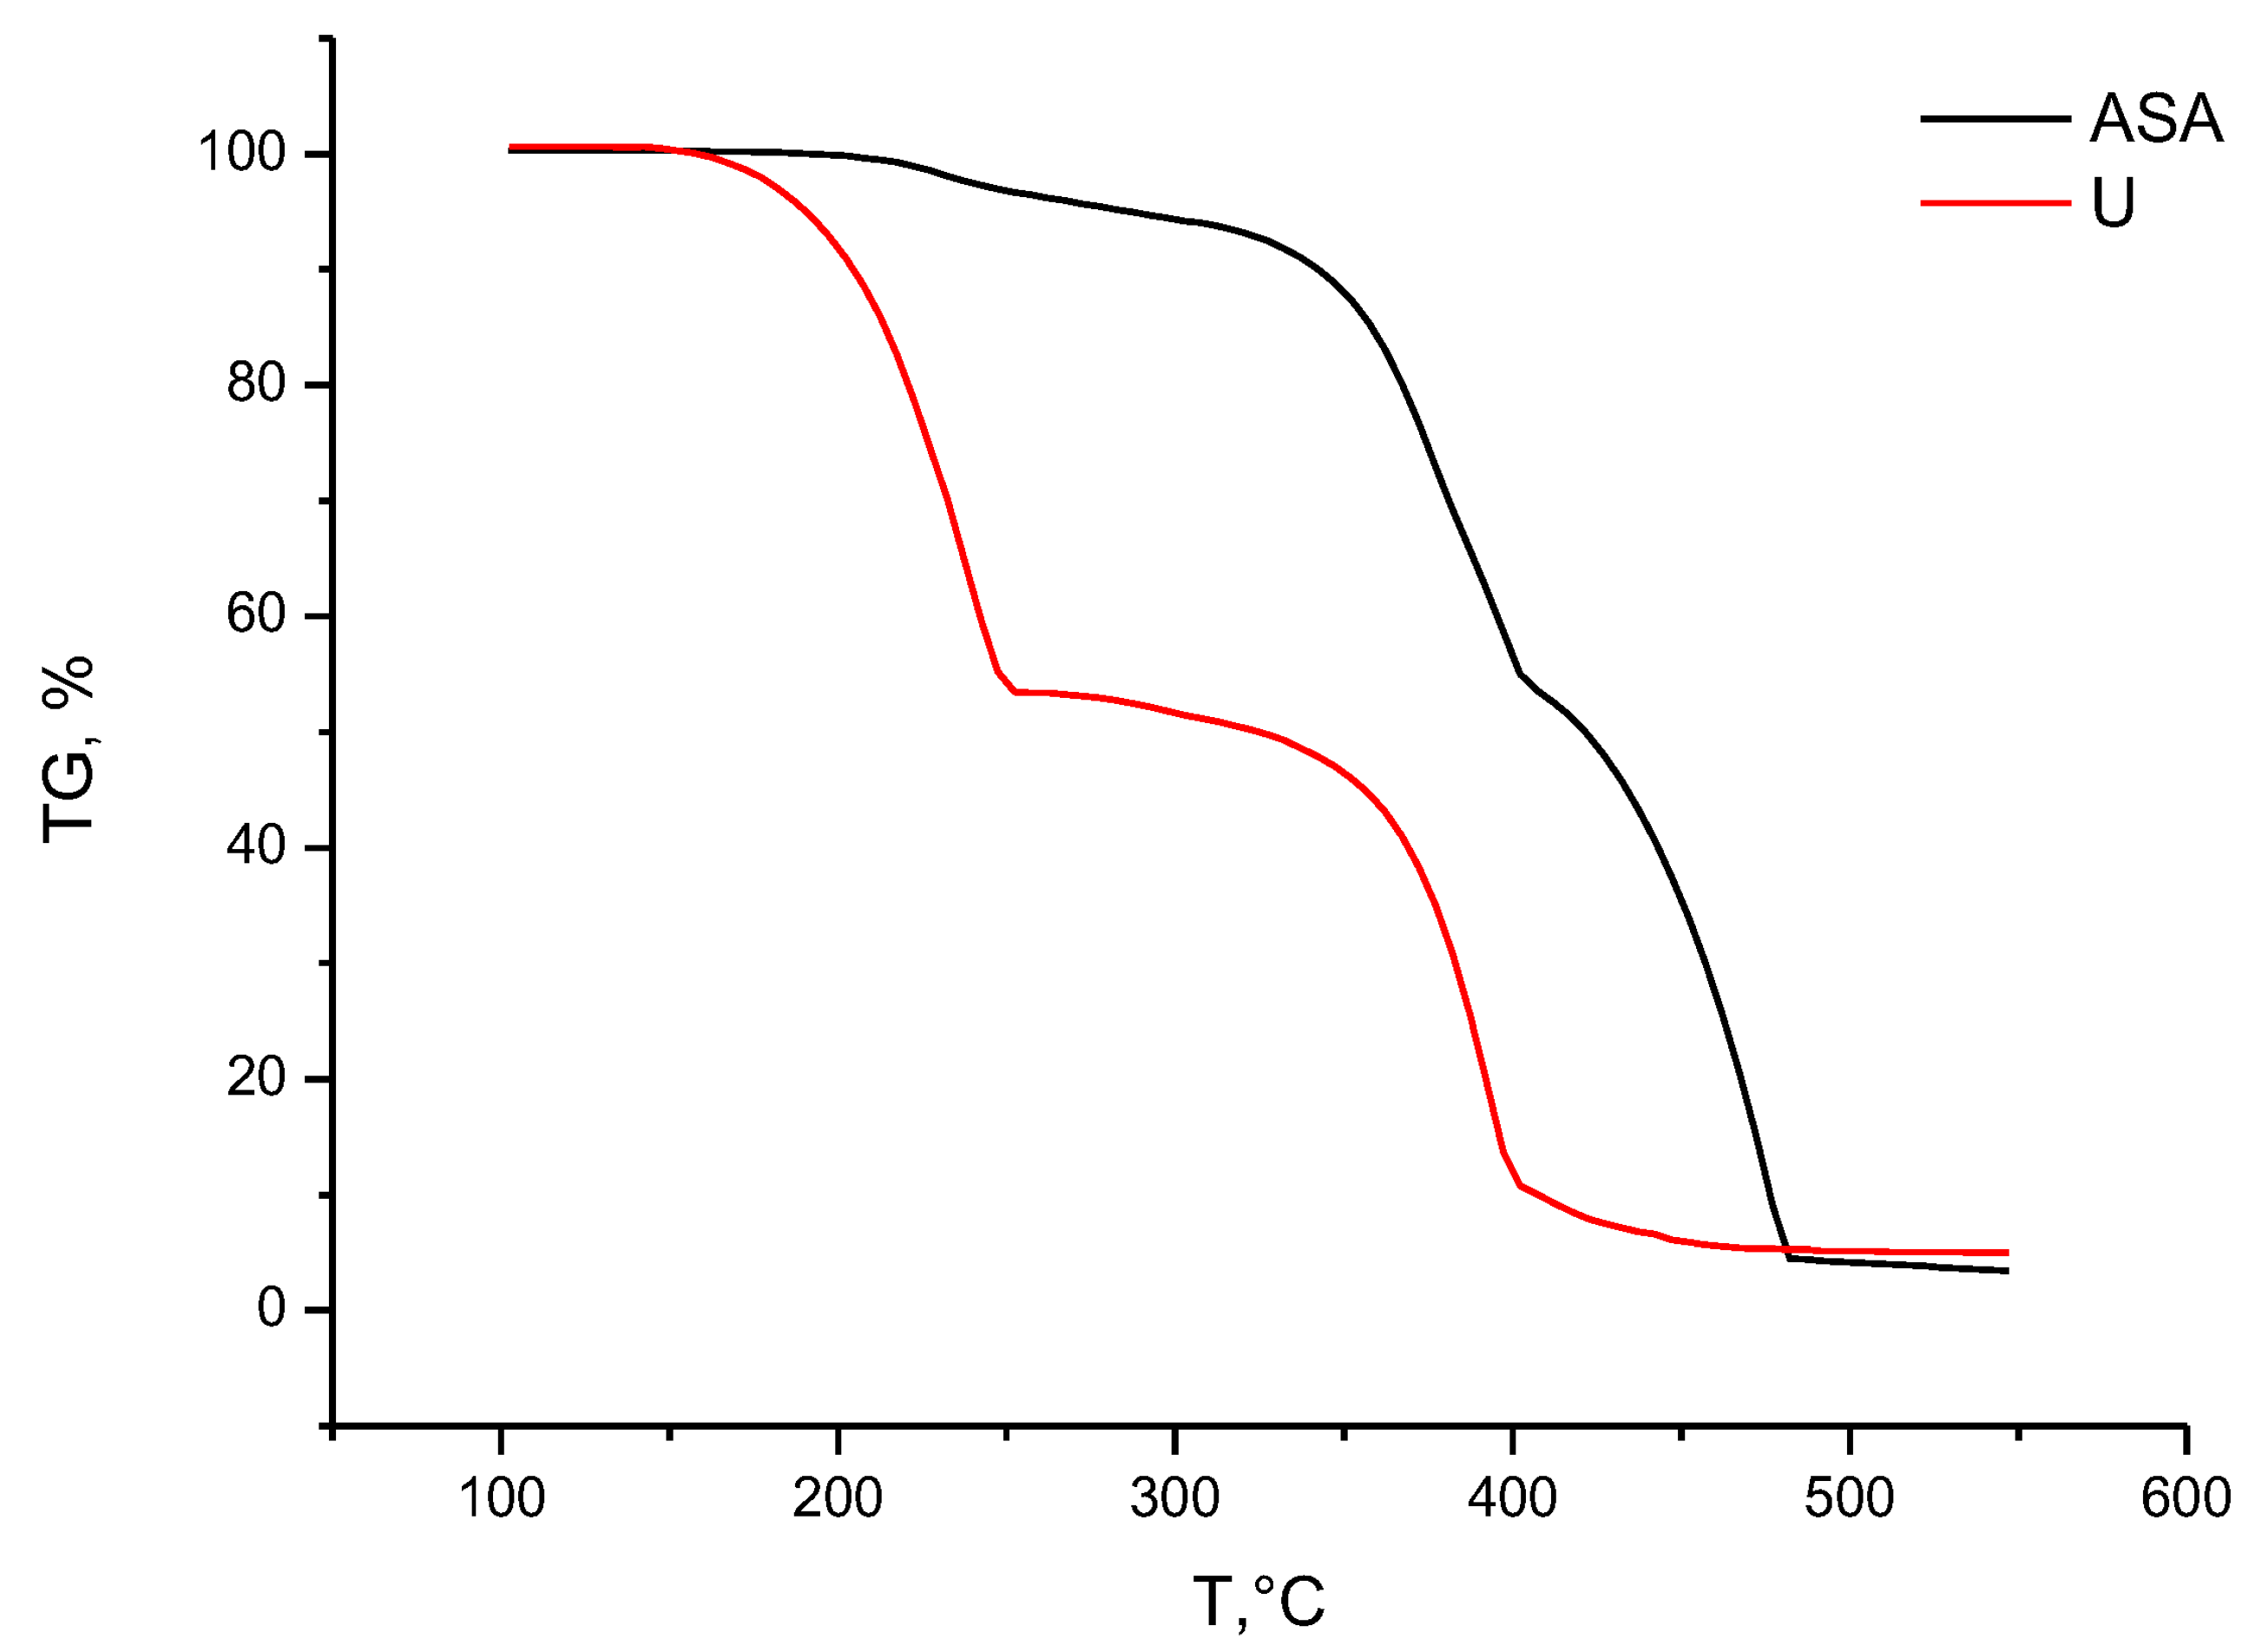
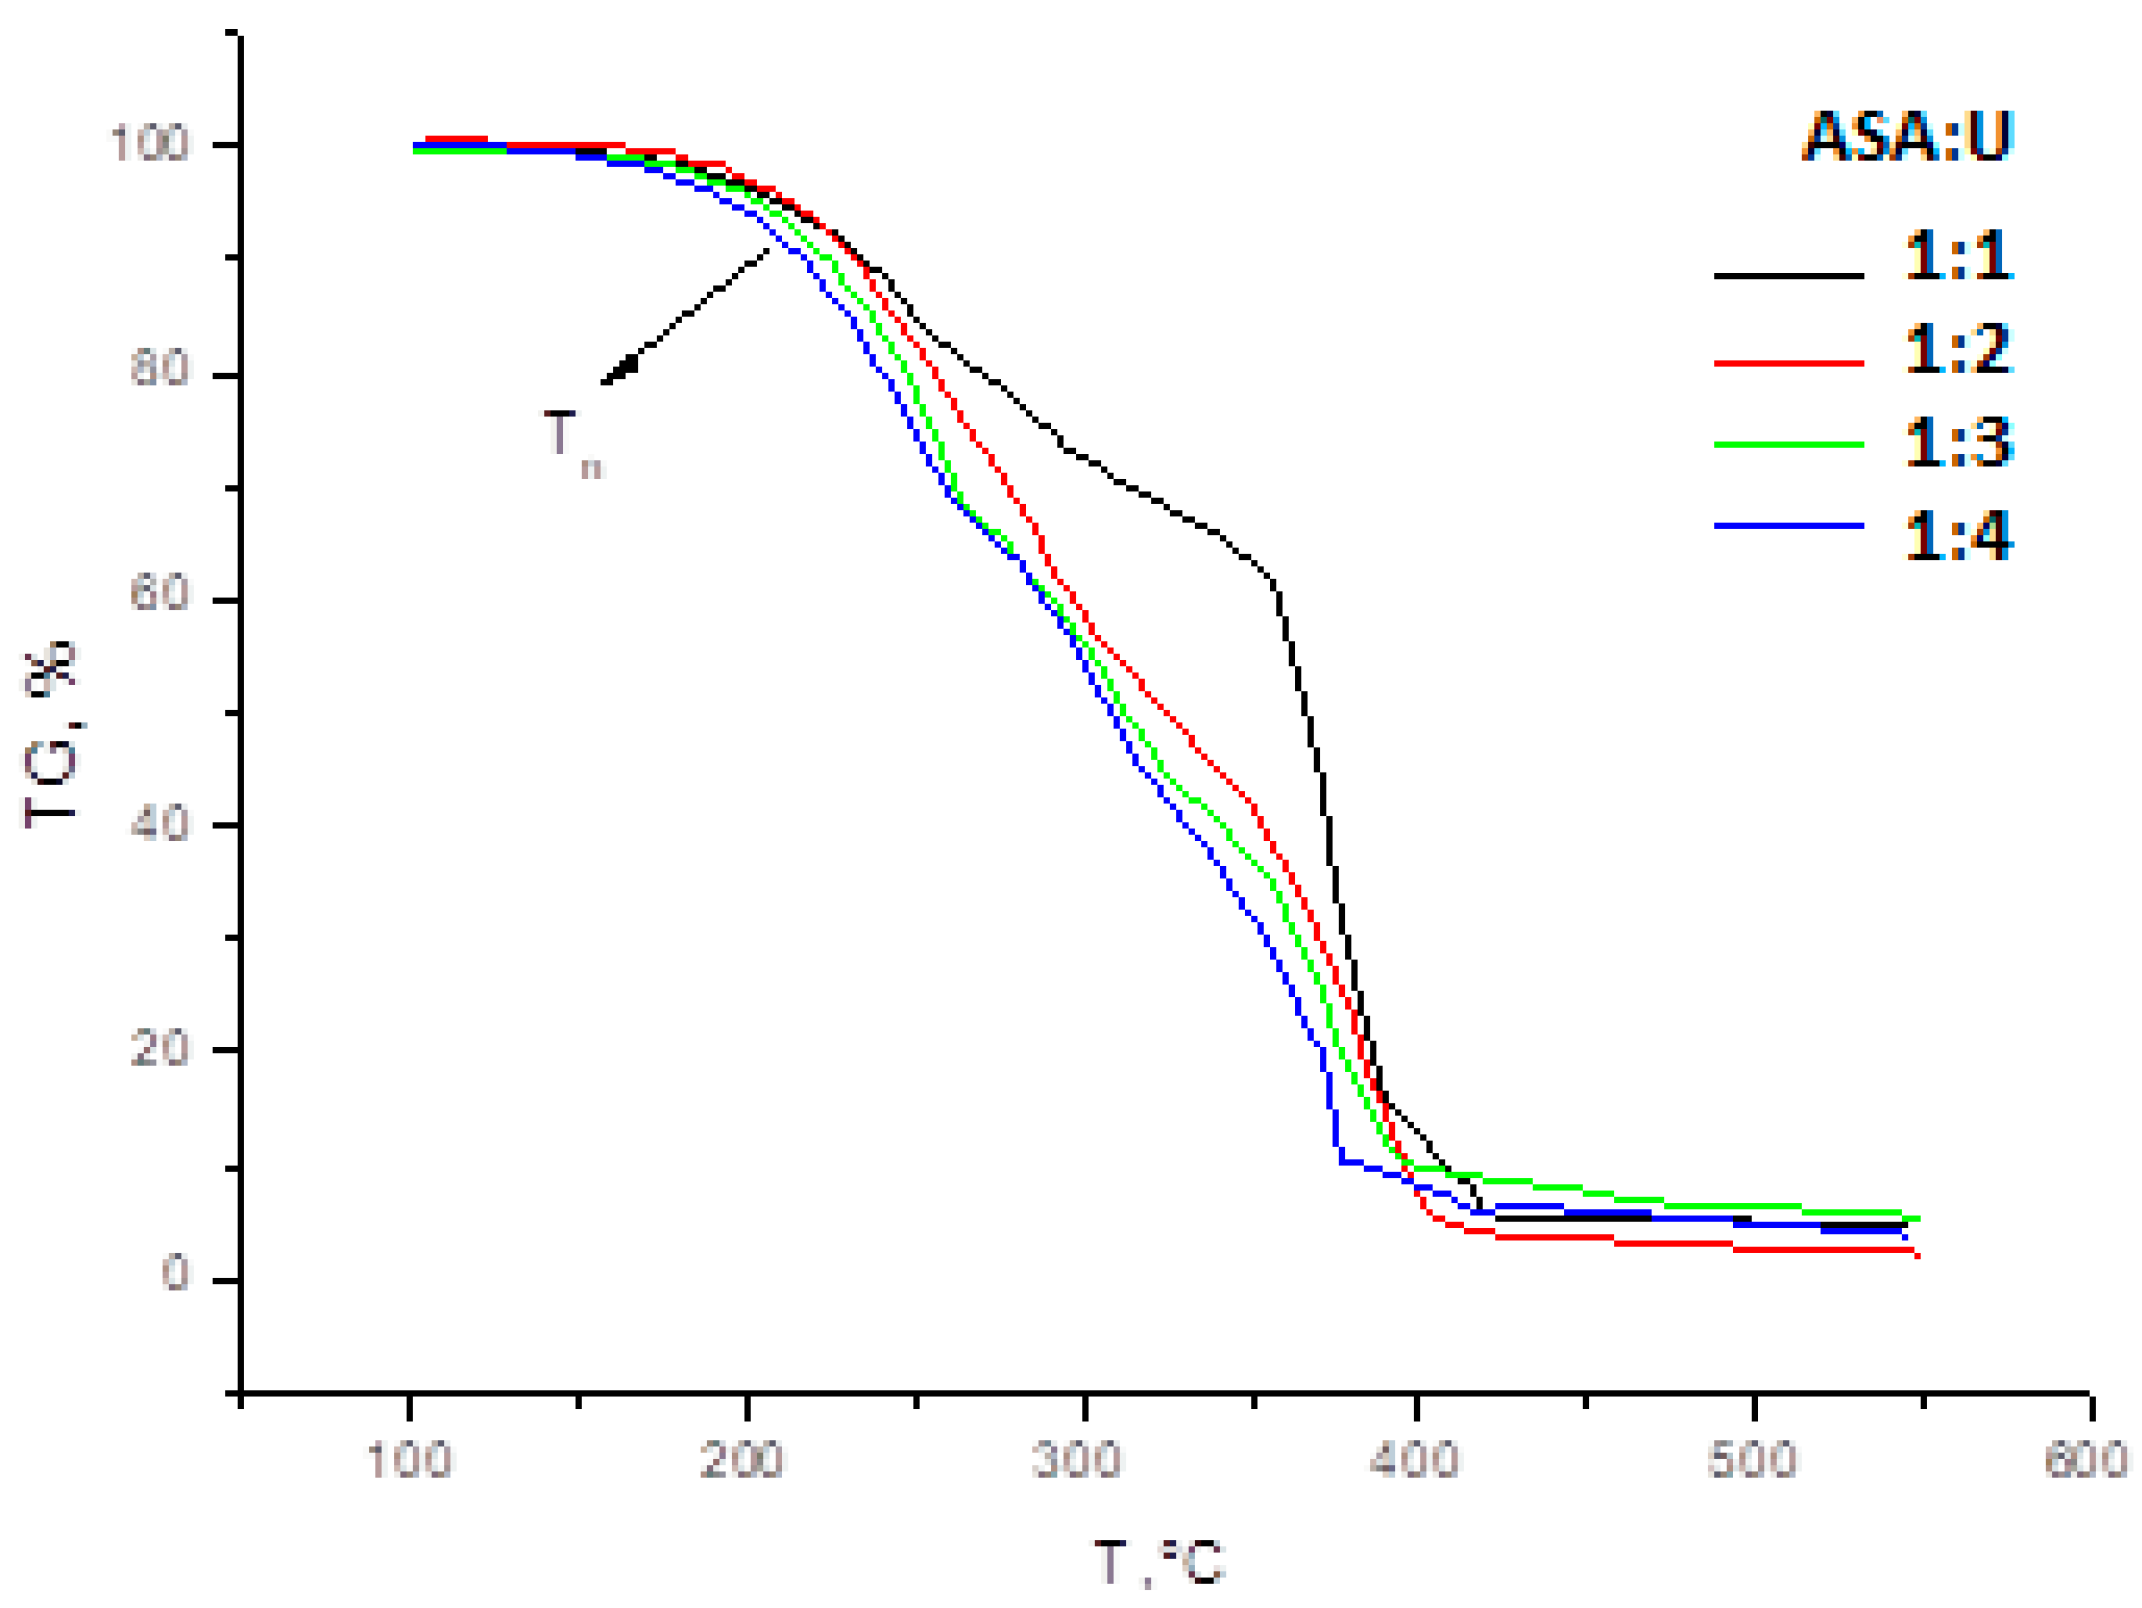
2.1.3. TGA/DSC
2.1.4. Kinetic Analysis of the Thermal Decomposition of the Ammonium Sulfamate–Urea System
2.1.5. Melting Point and Thermodynamic Calculation
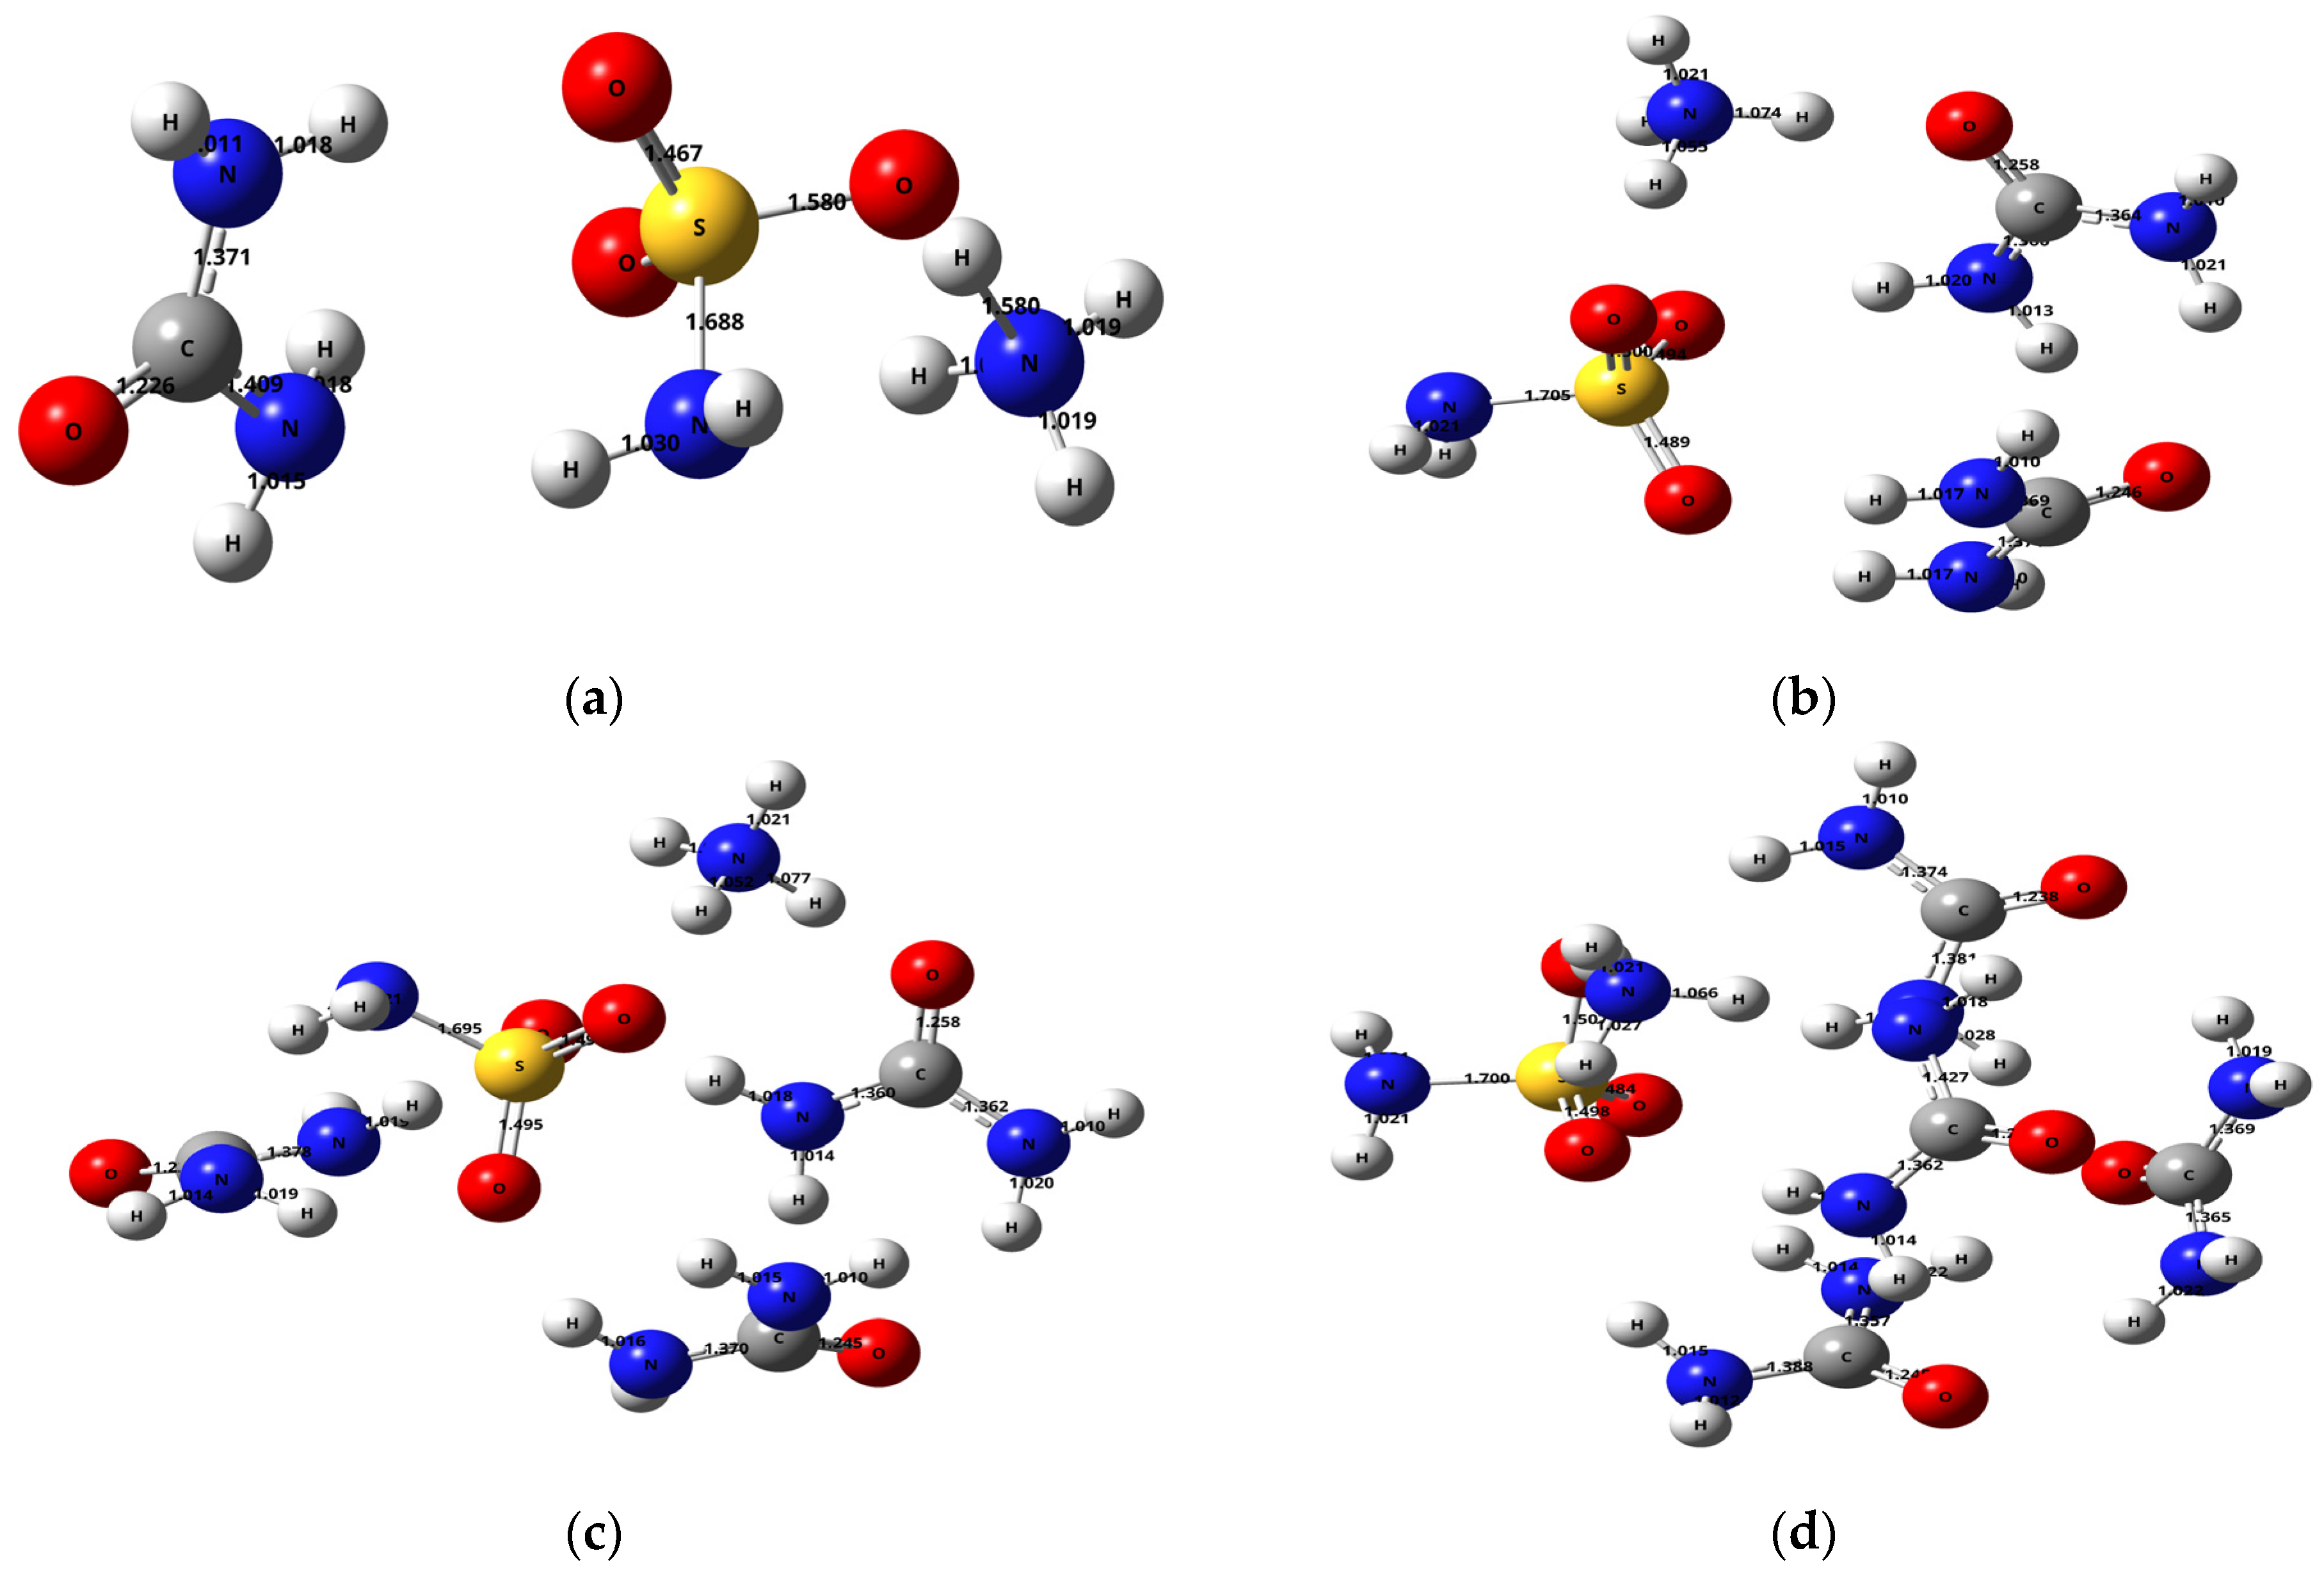
2.2. Theoretical Study of the Ammonium Sulfamate–Urea System
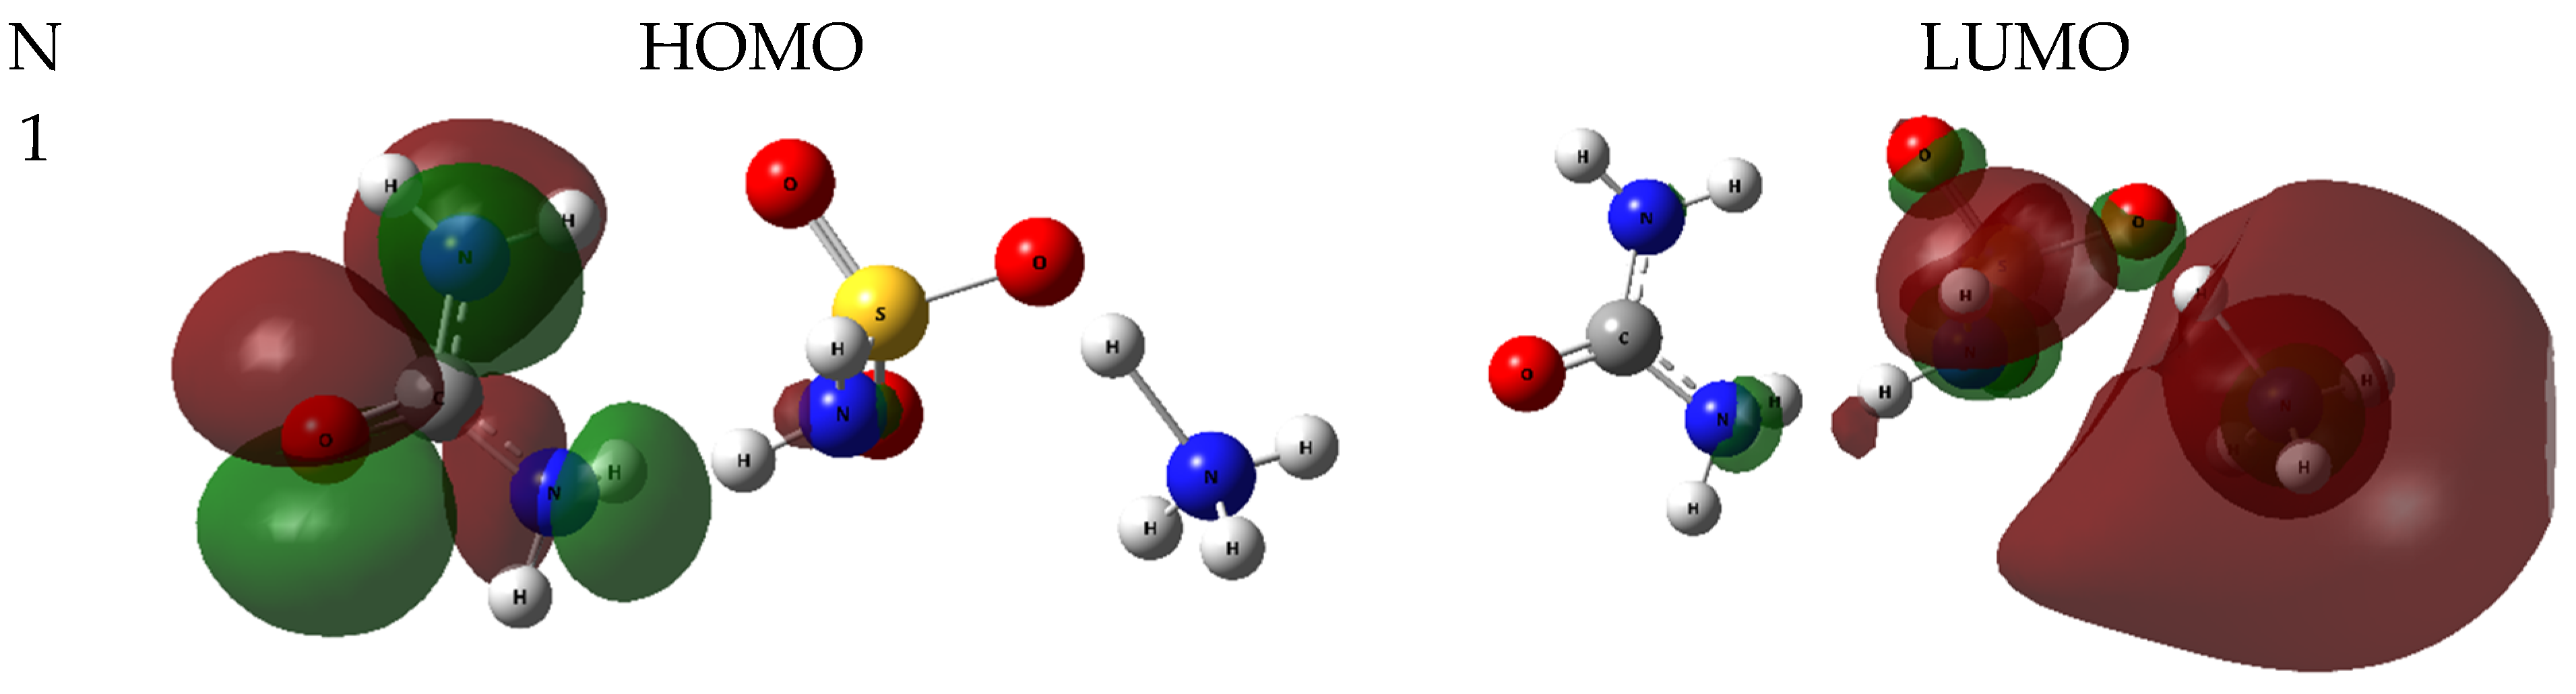
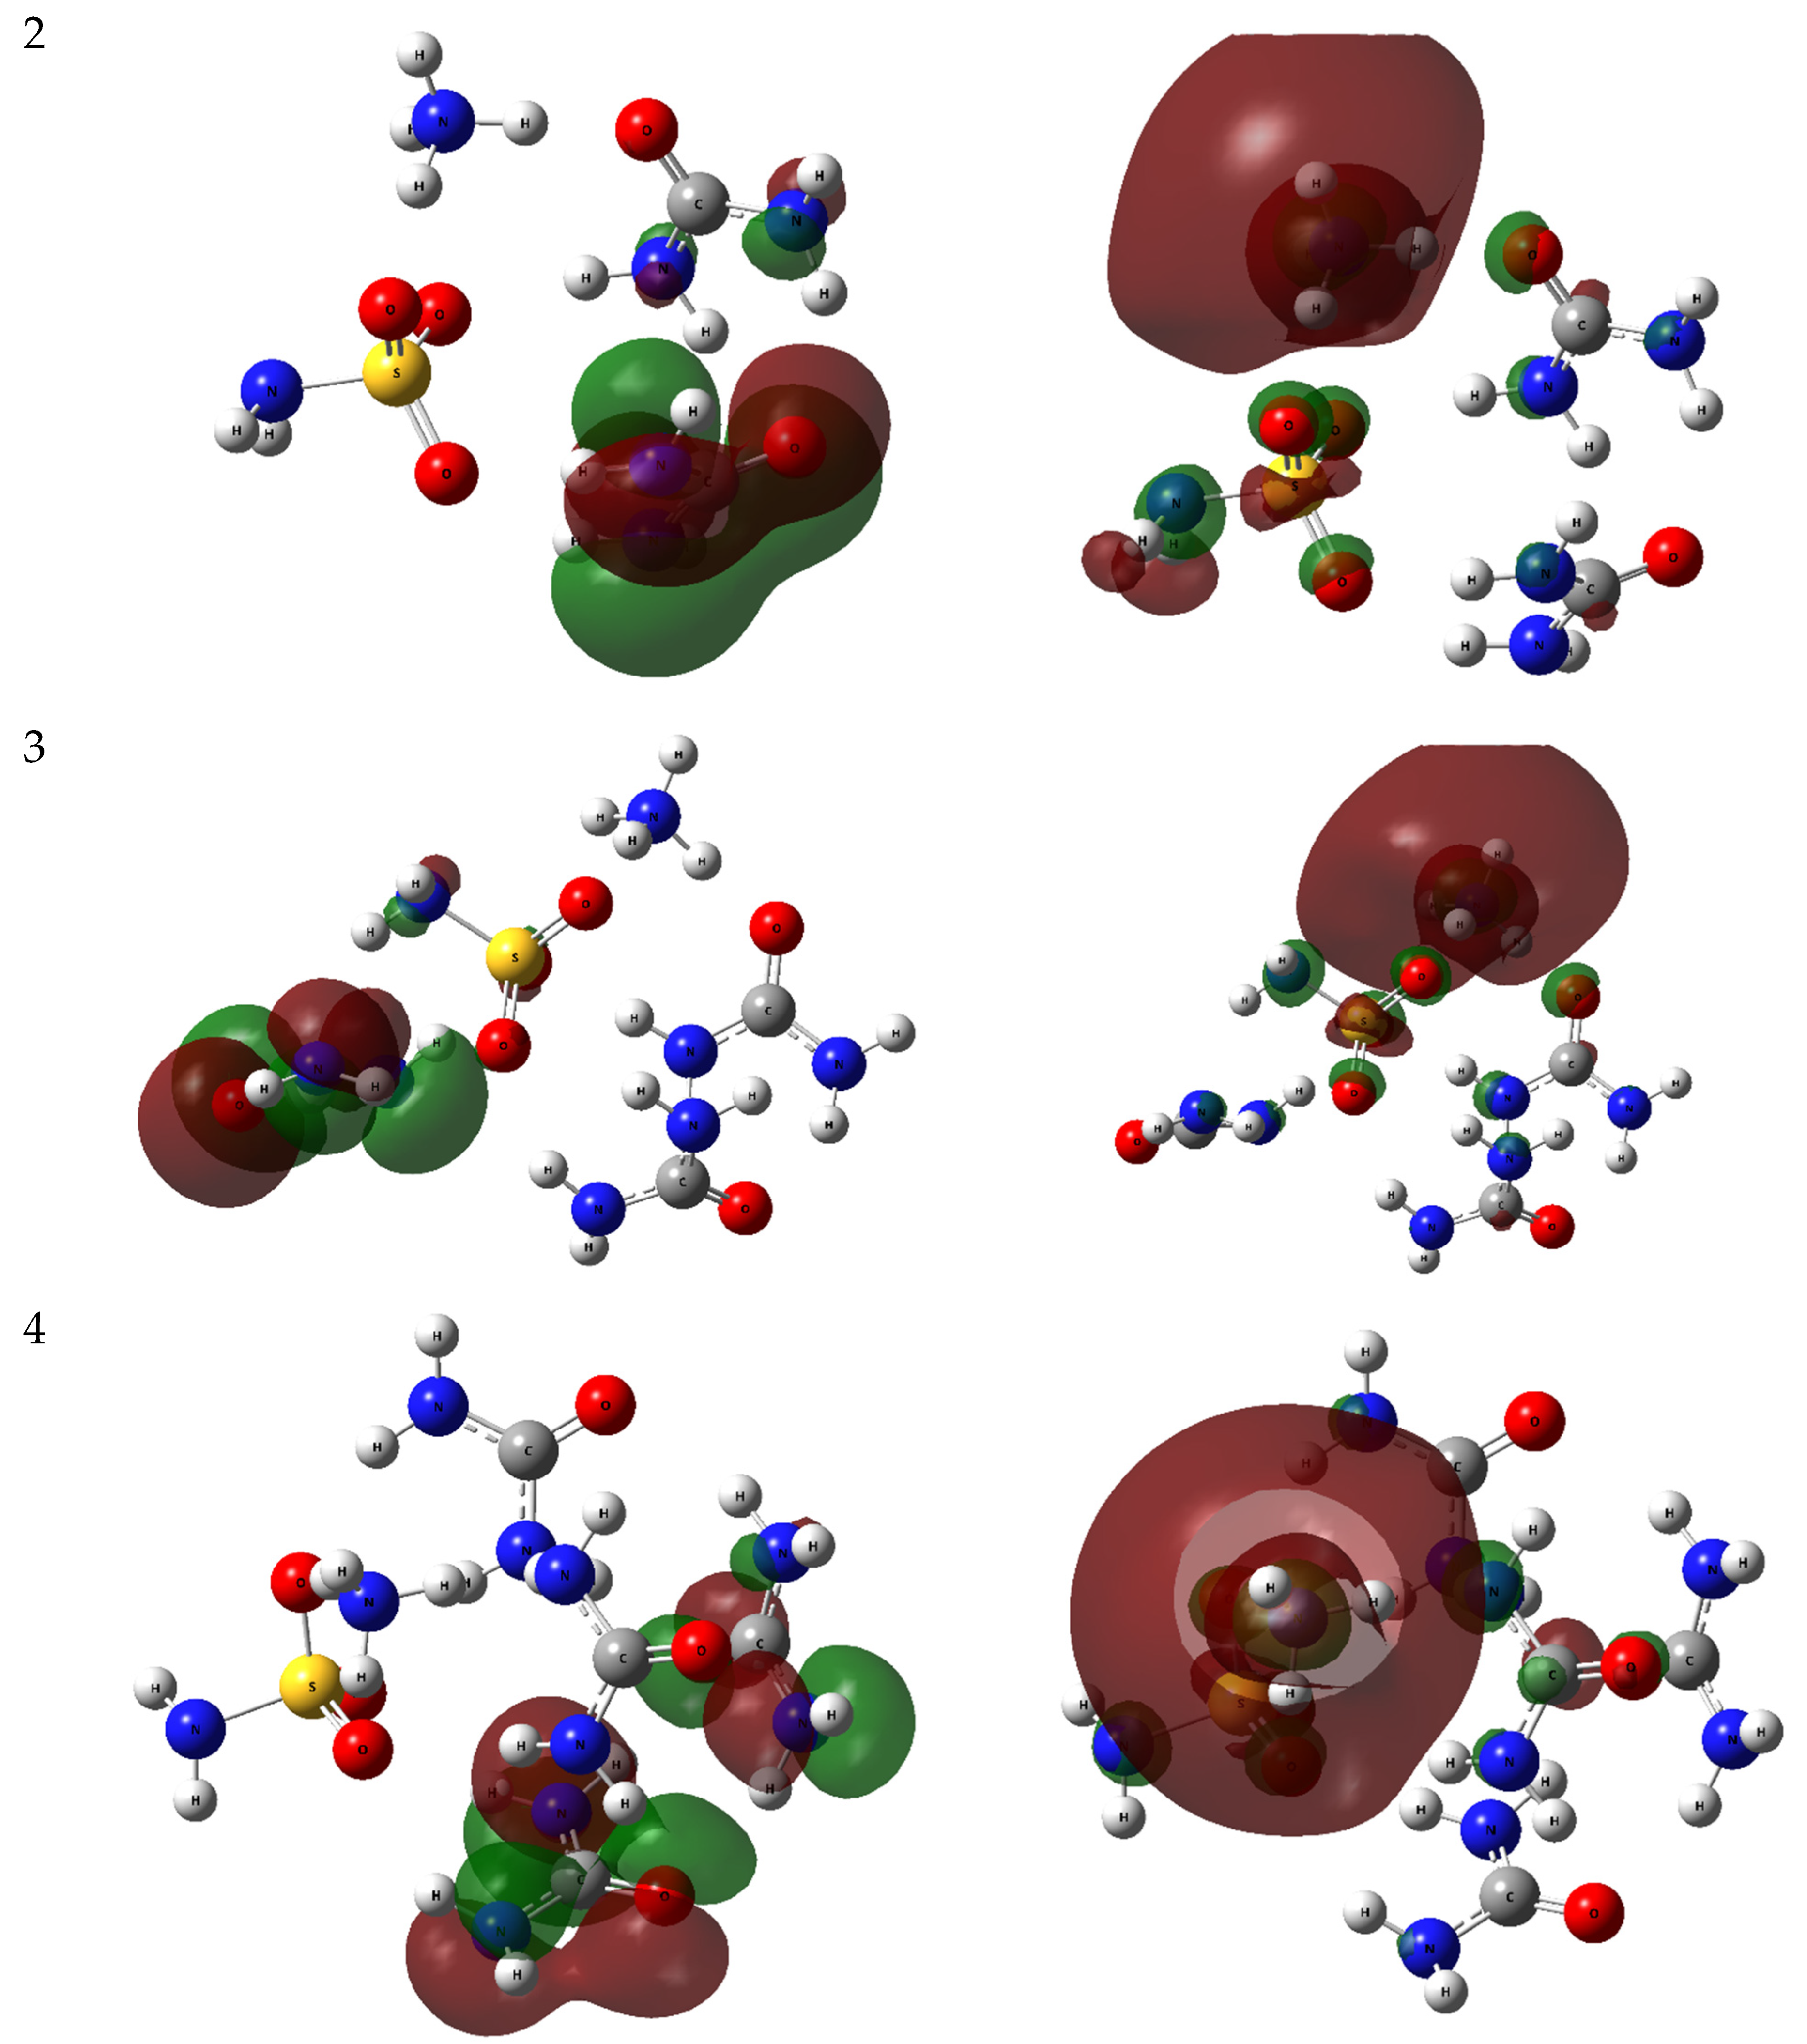
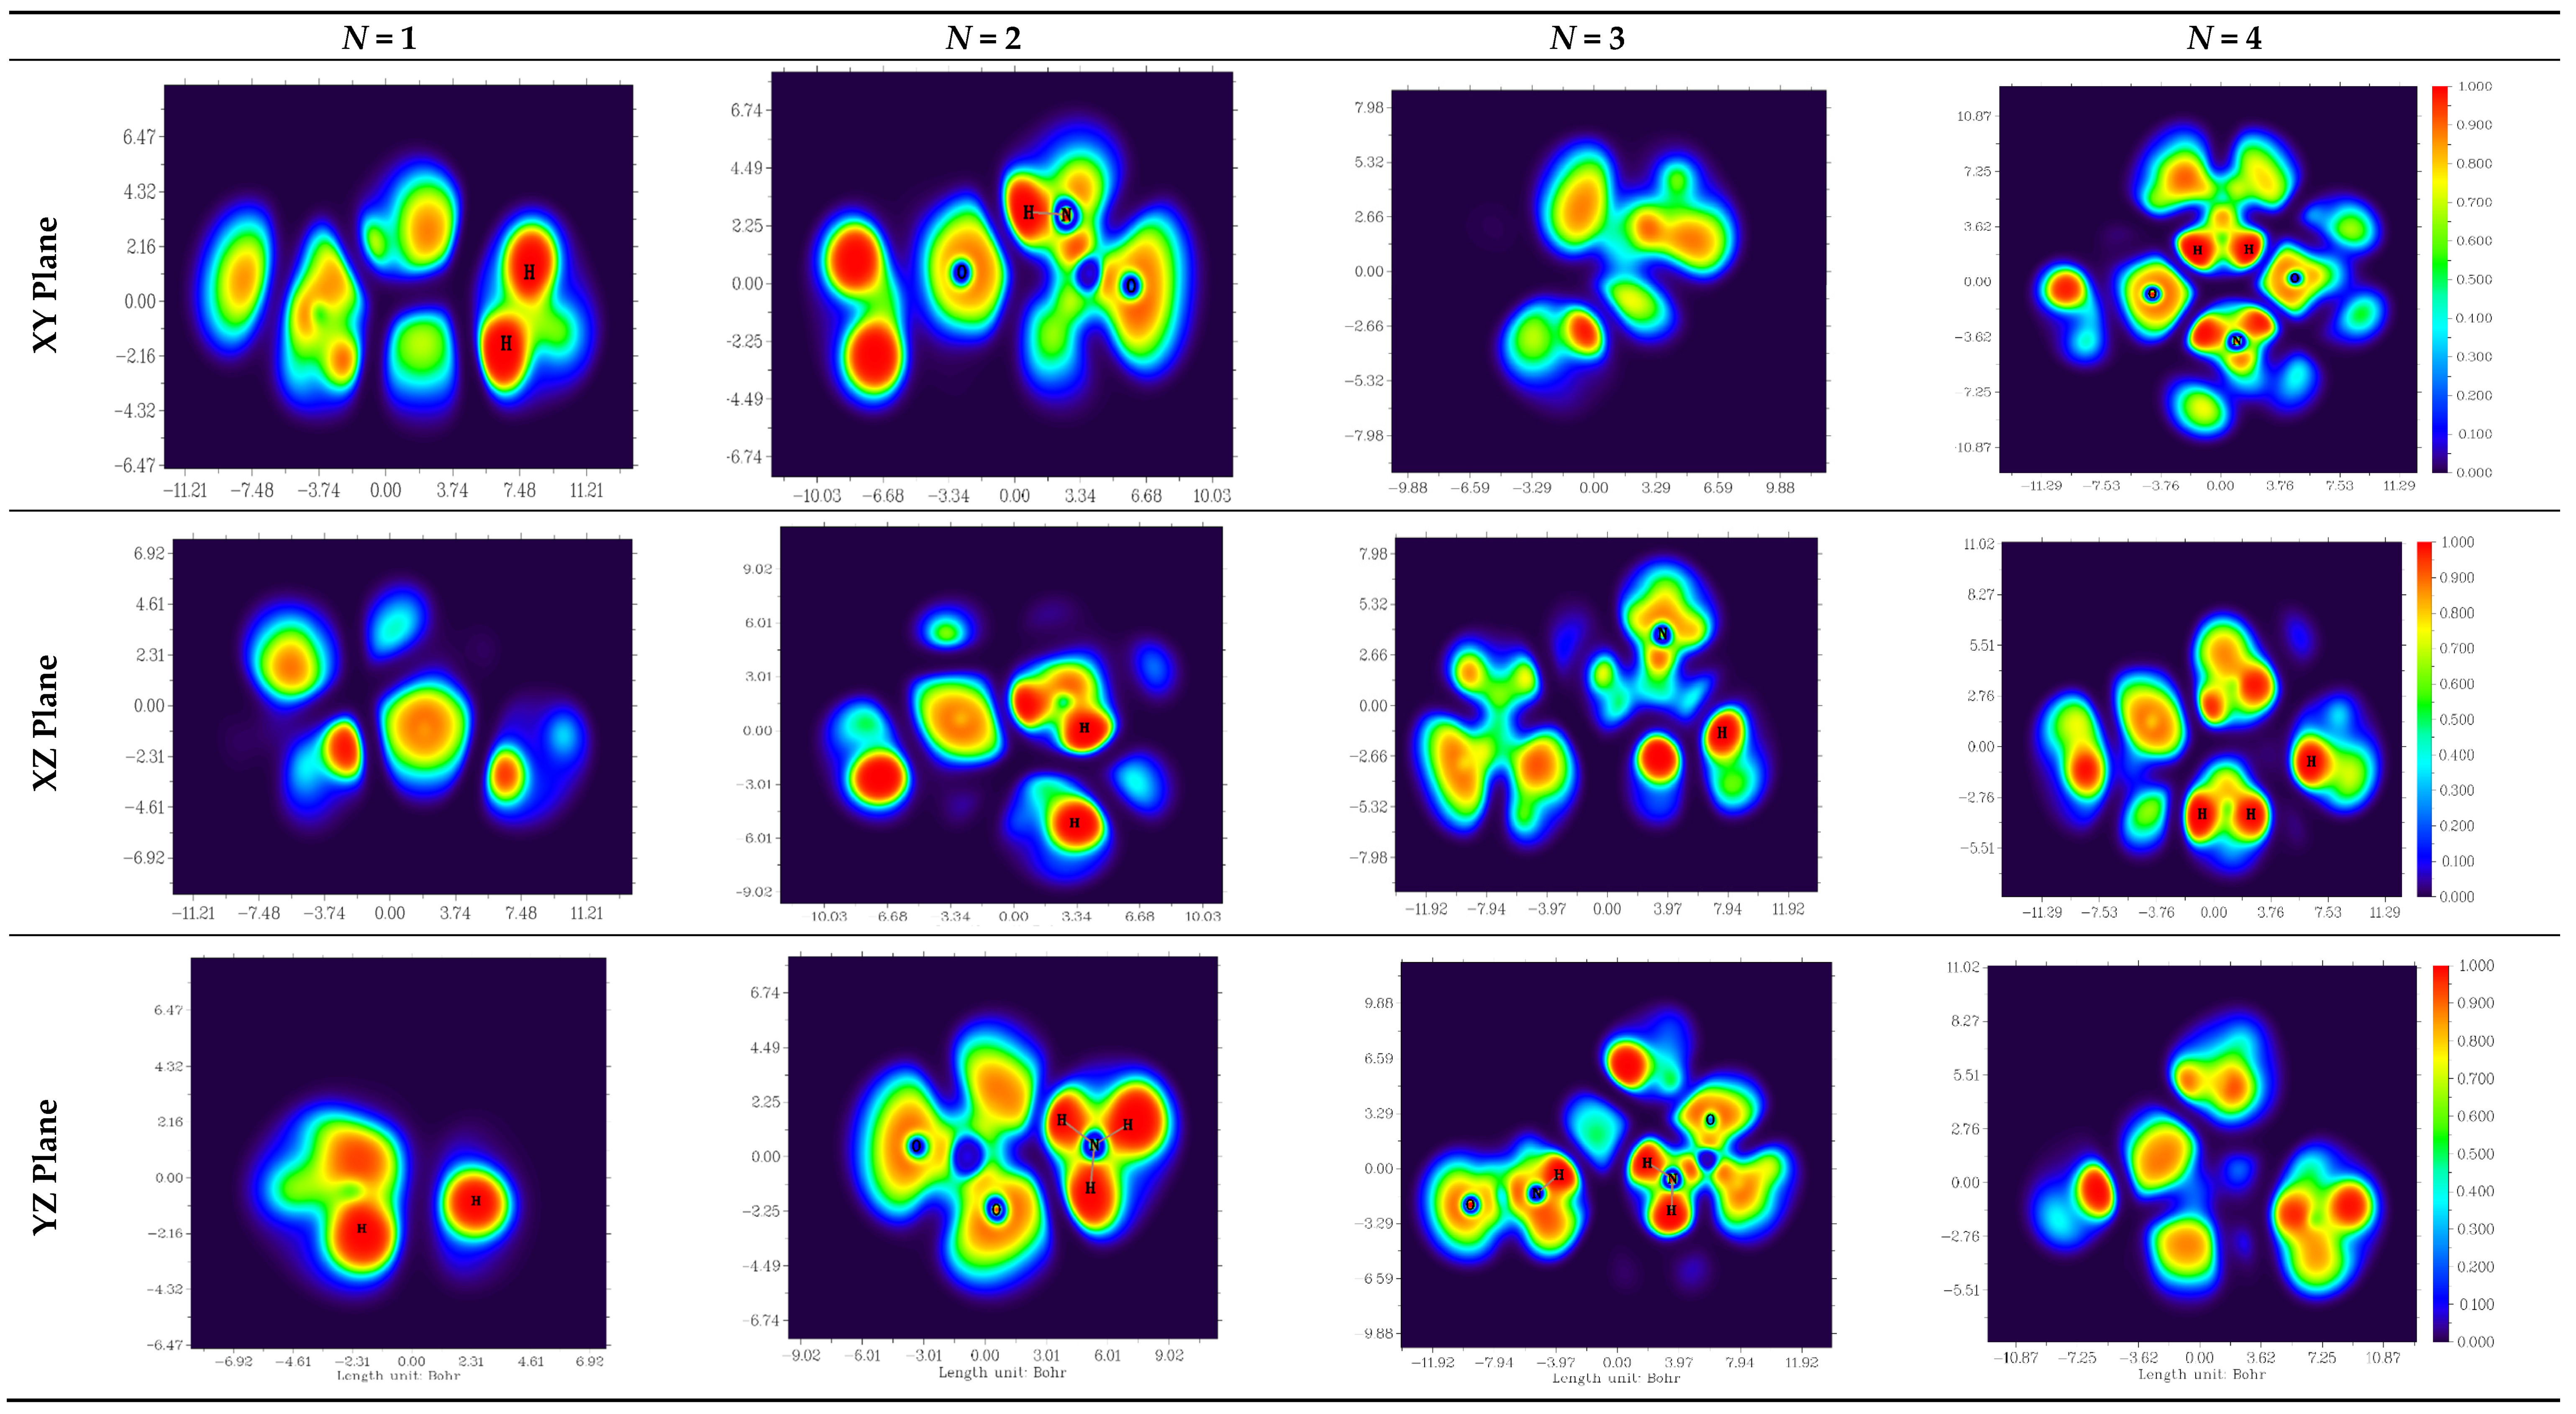
2.2.1. HOMO-LUMO Analysis
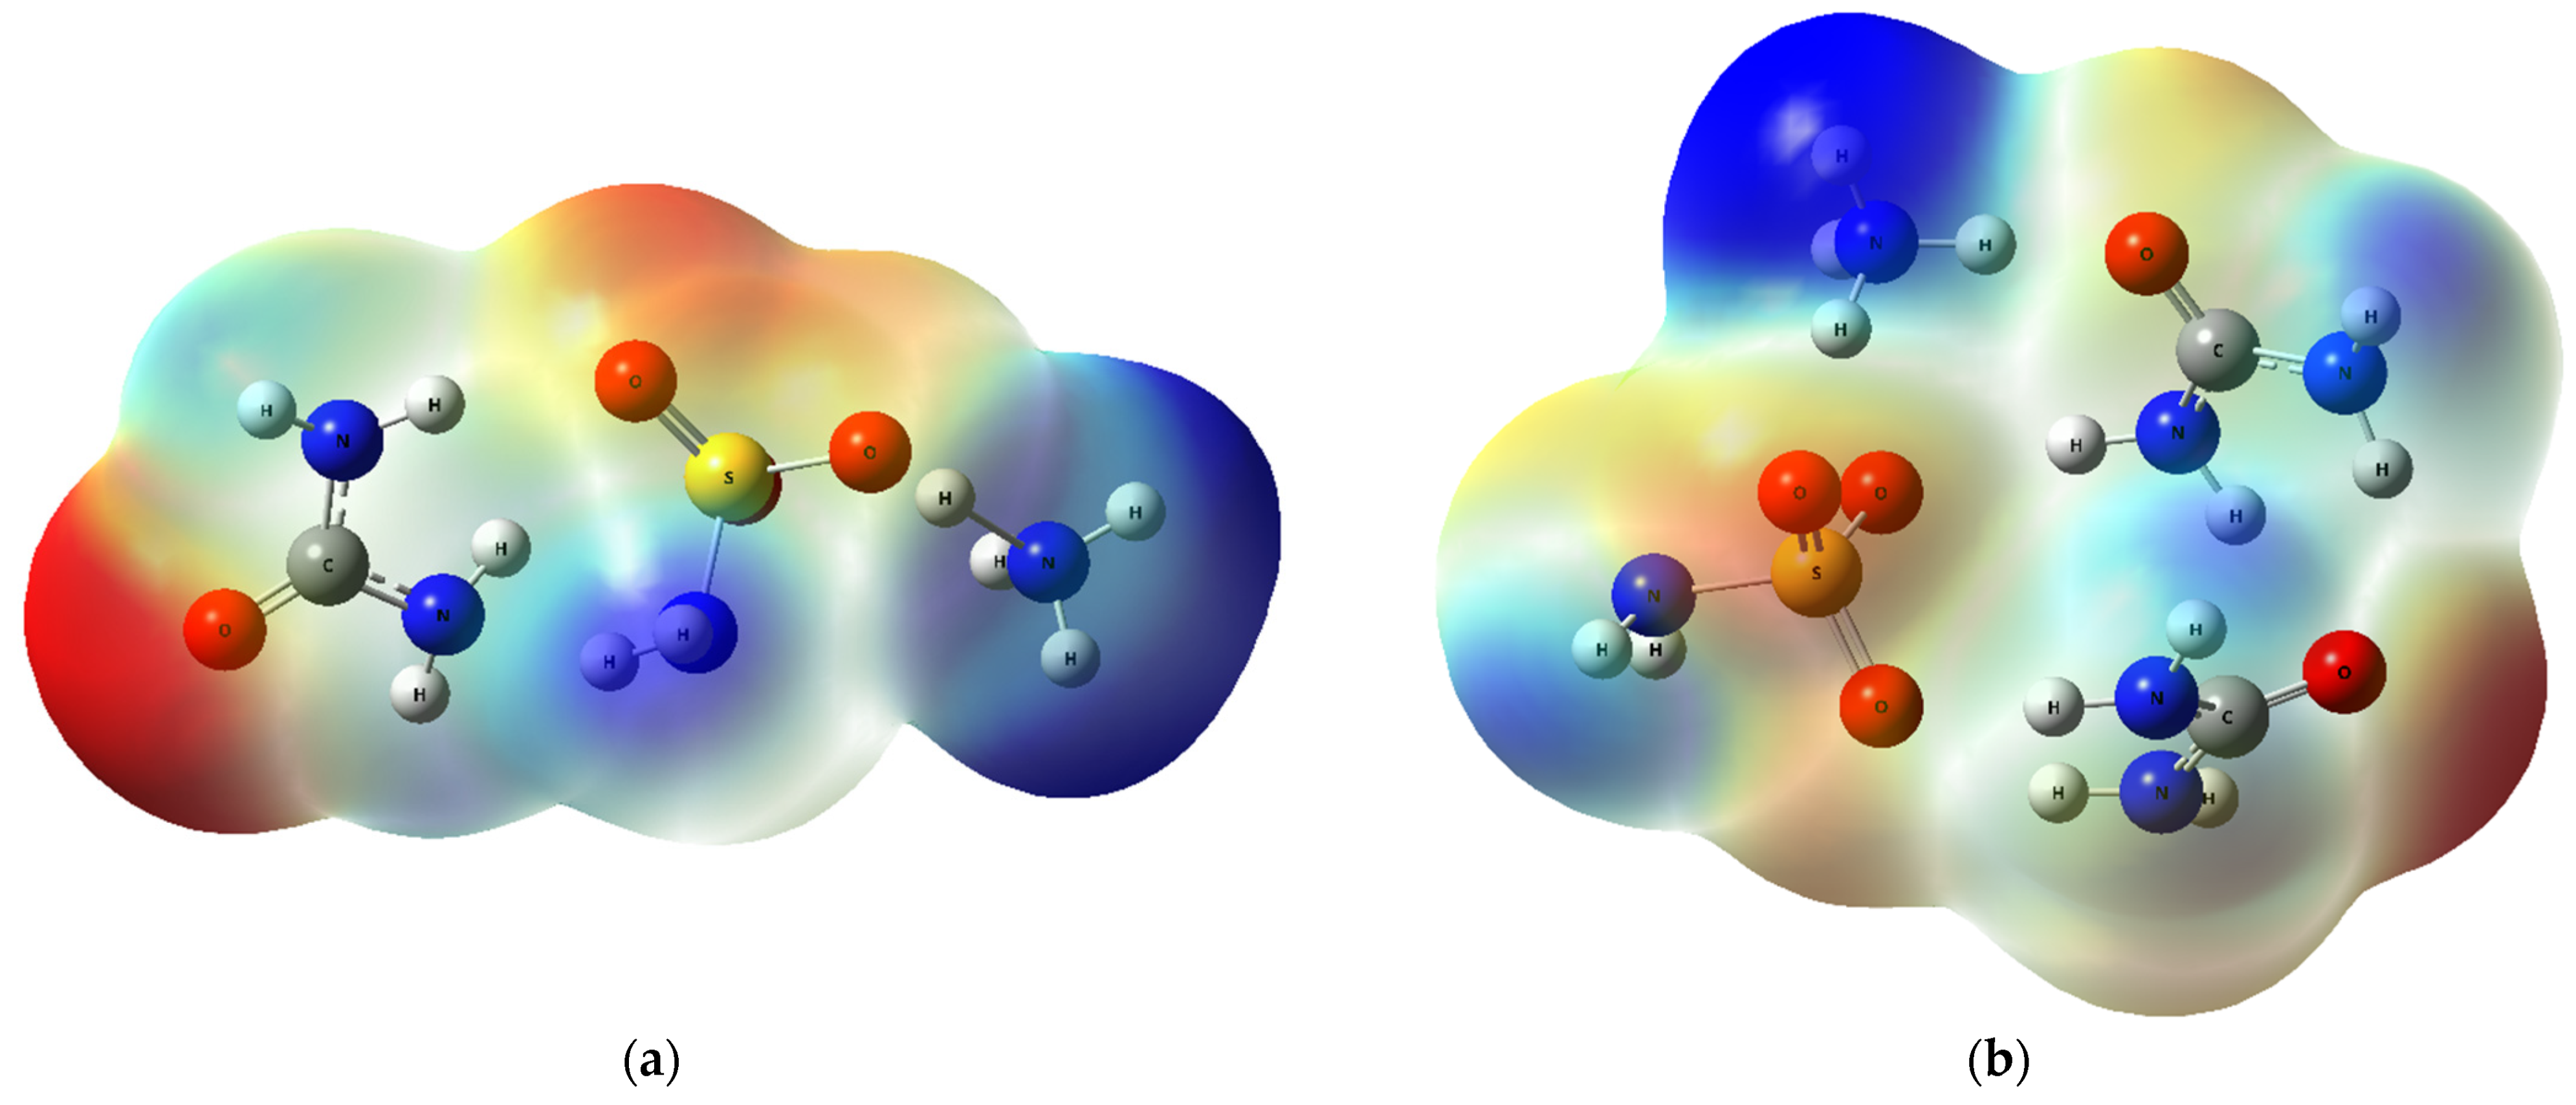
2.2.2. MEP Analysis
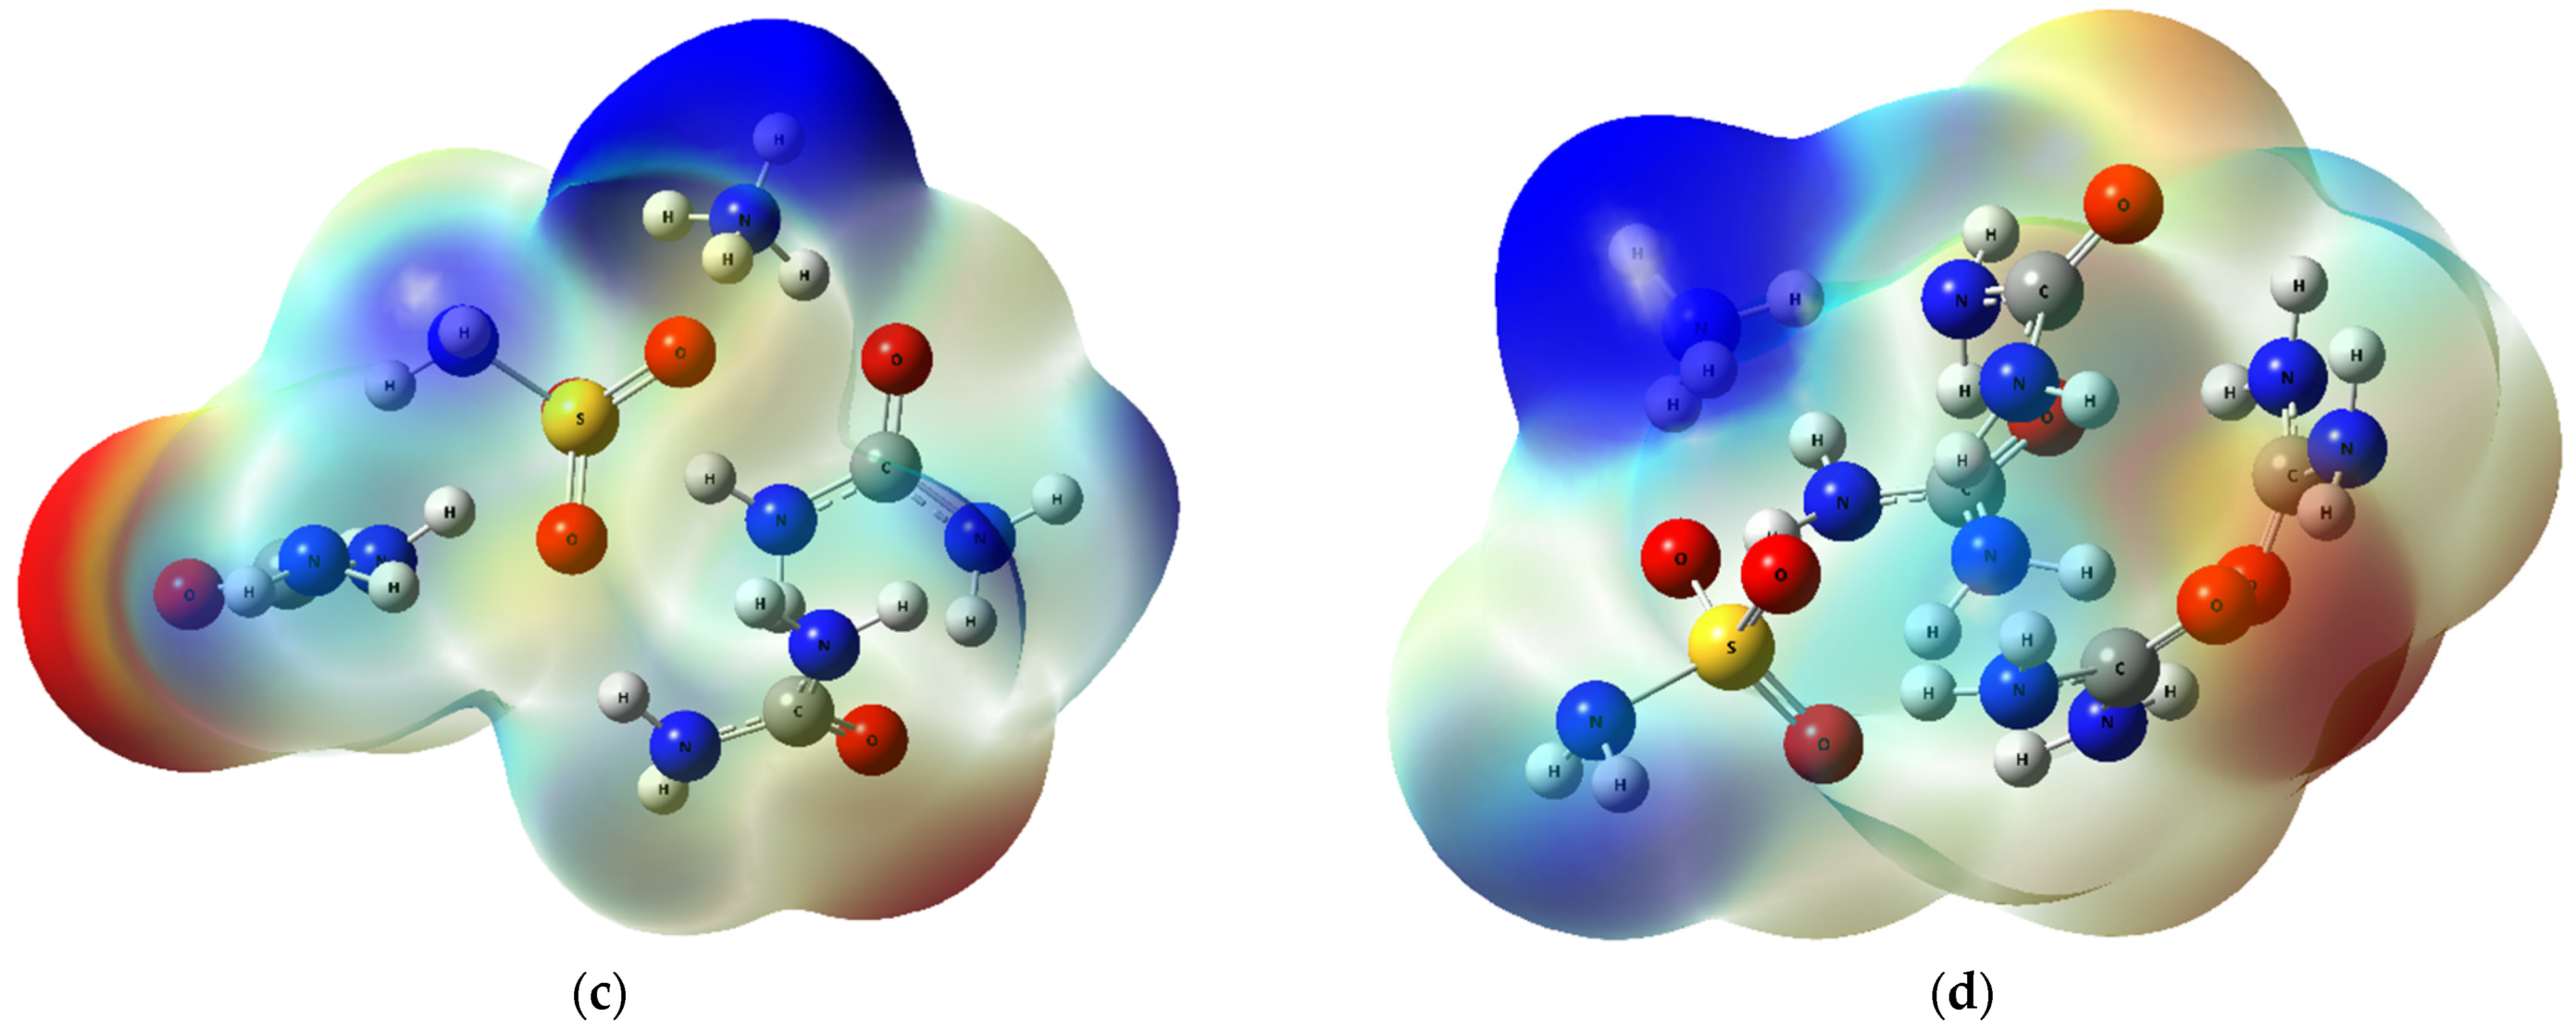
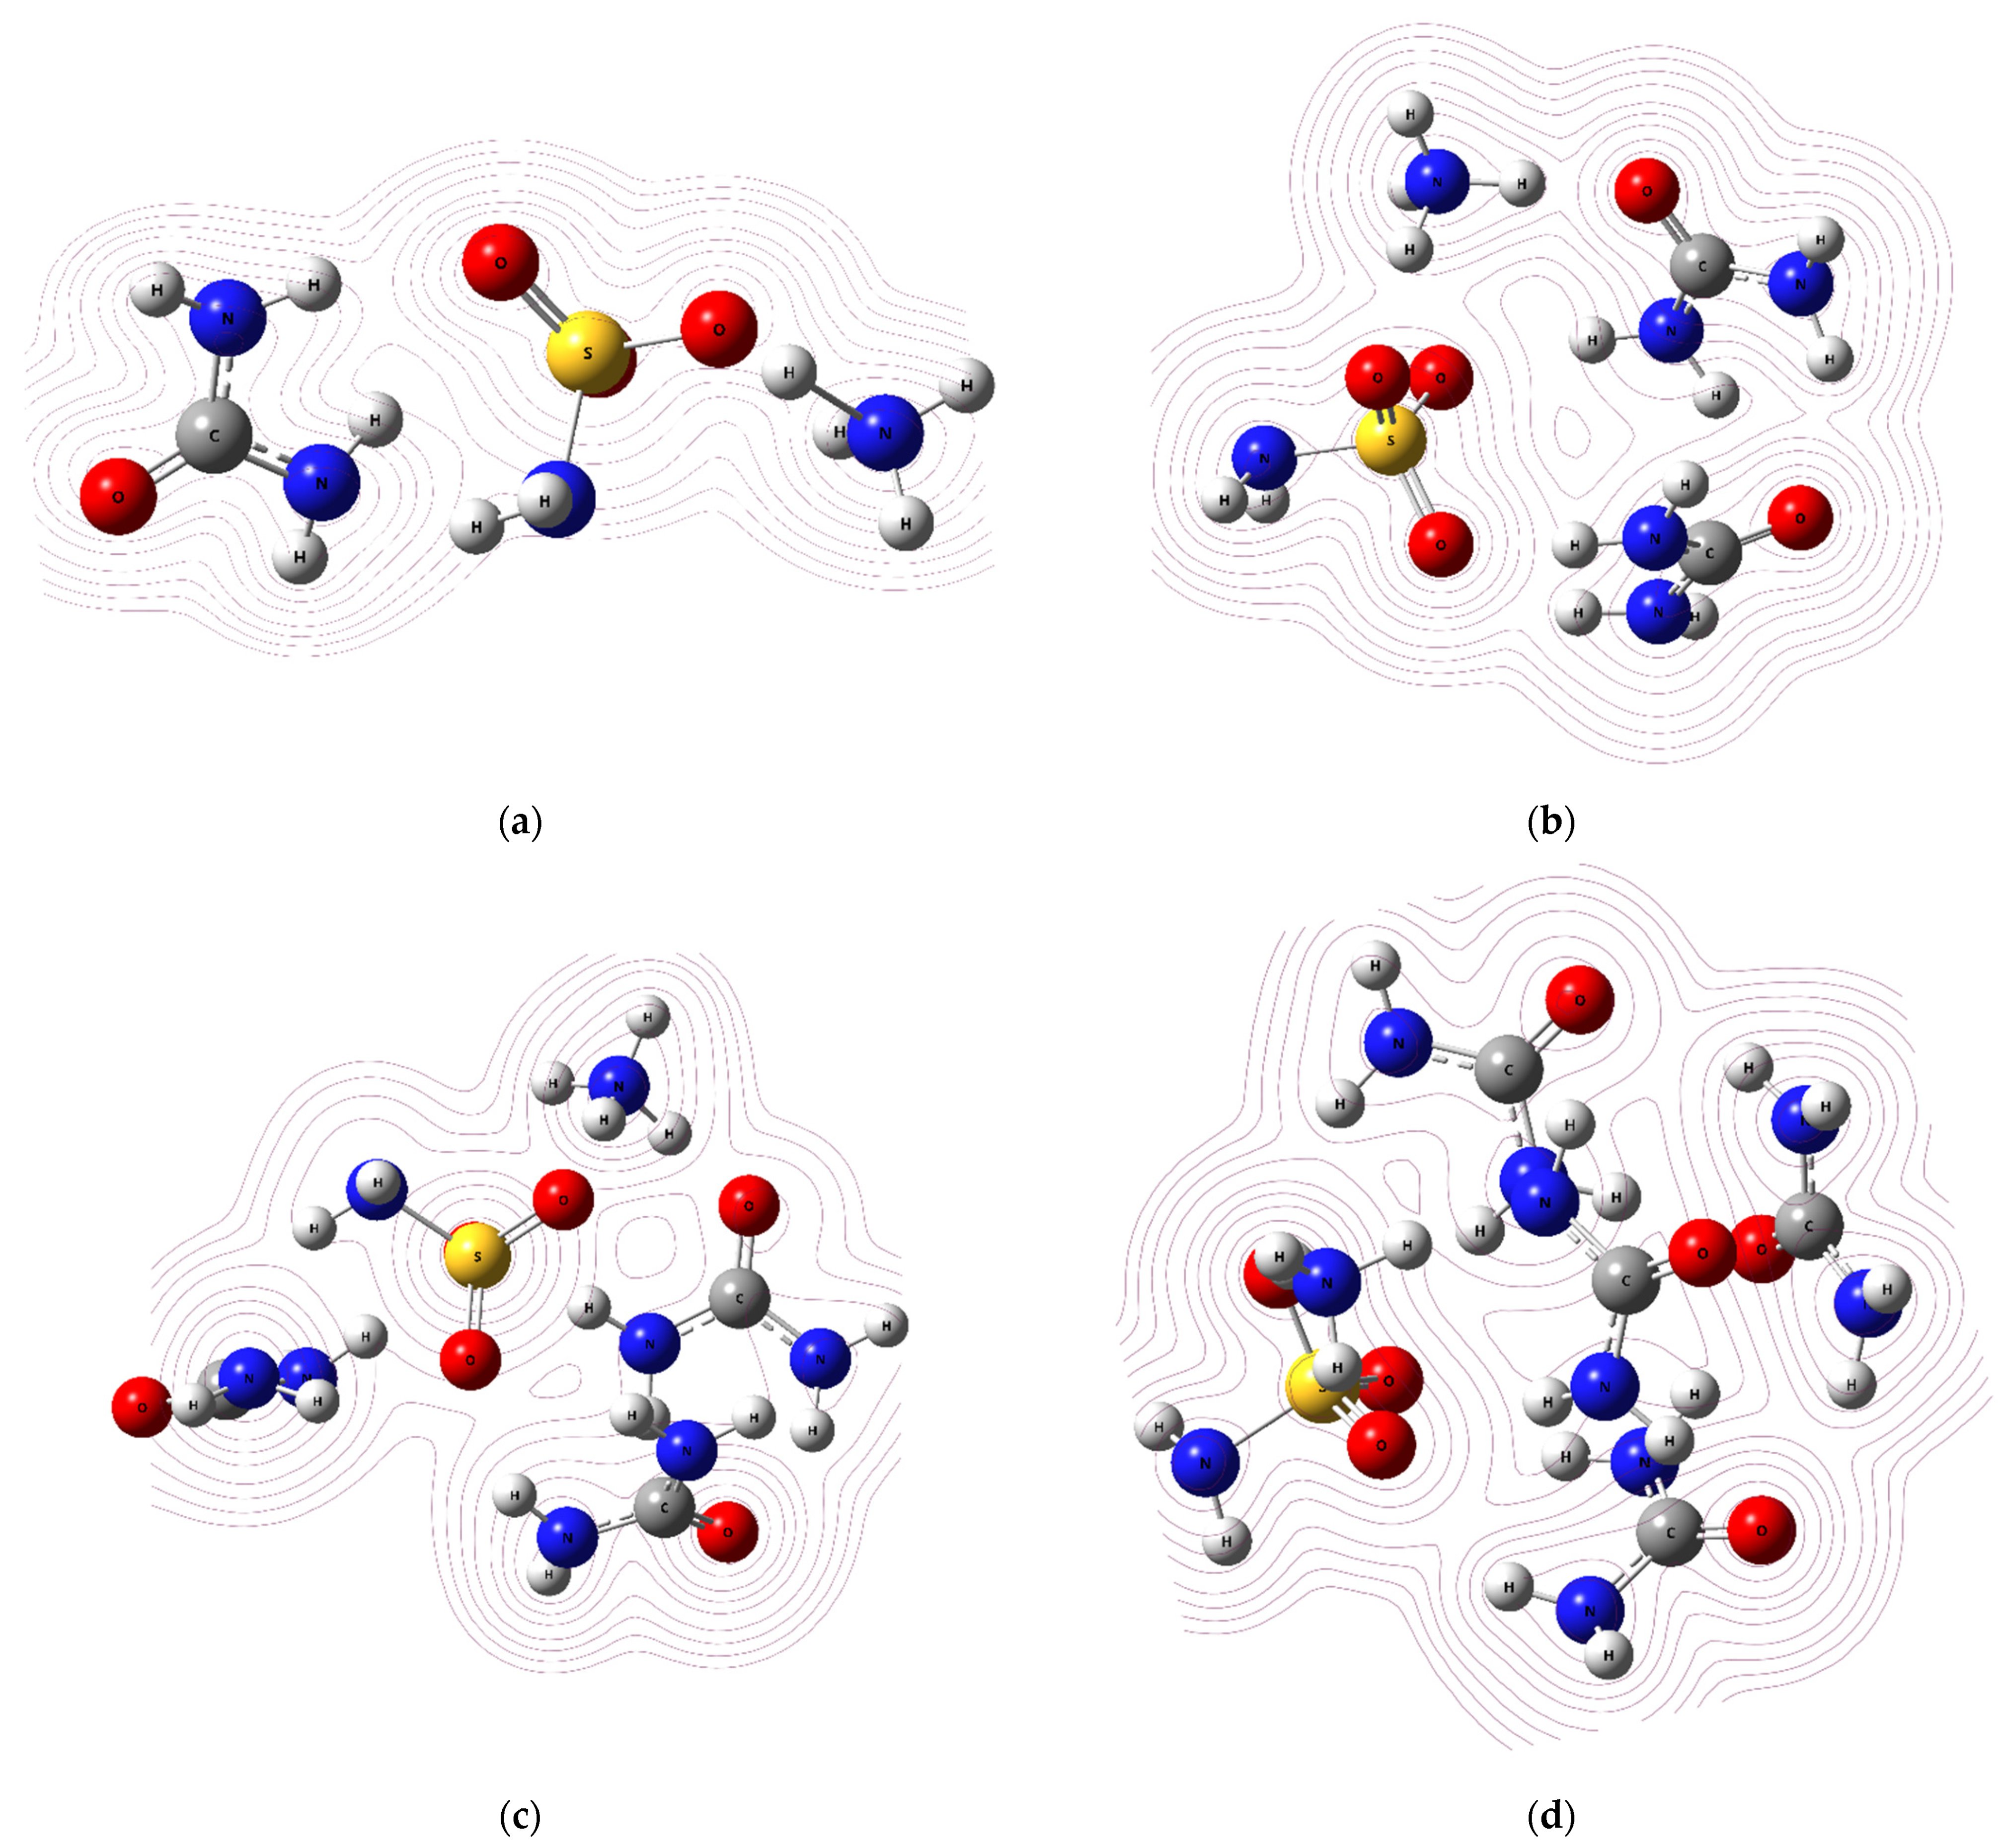
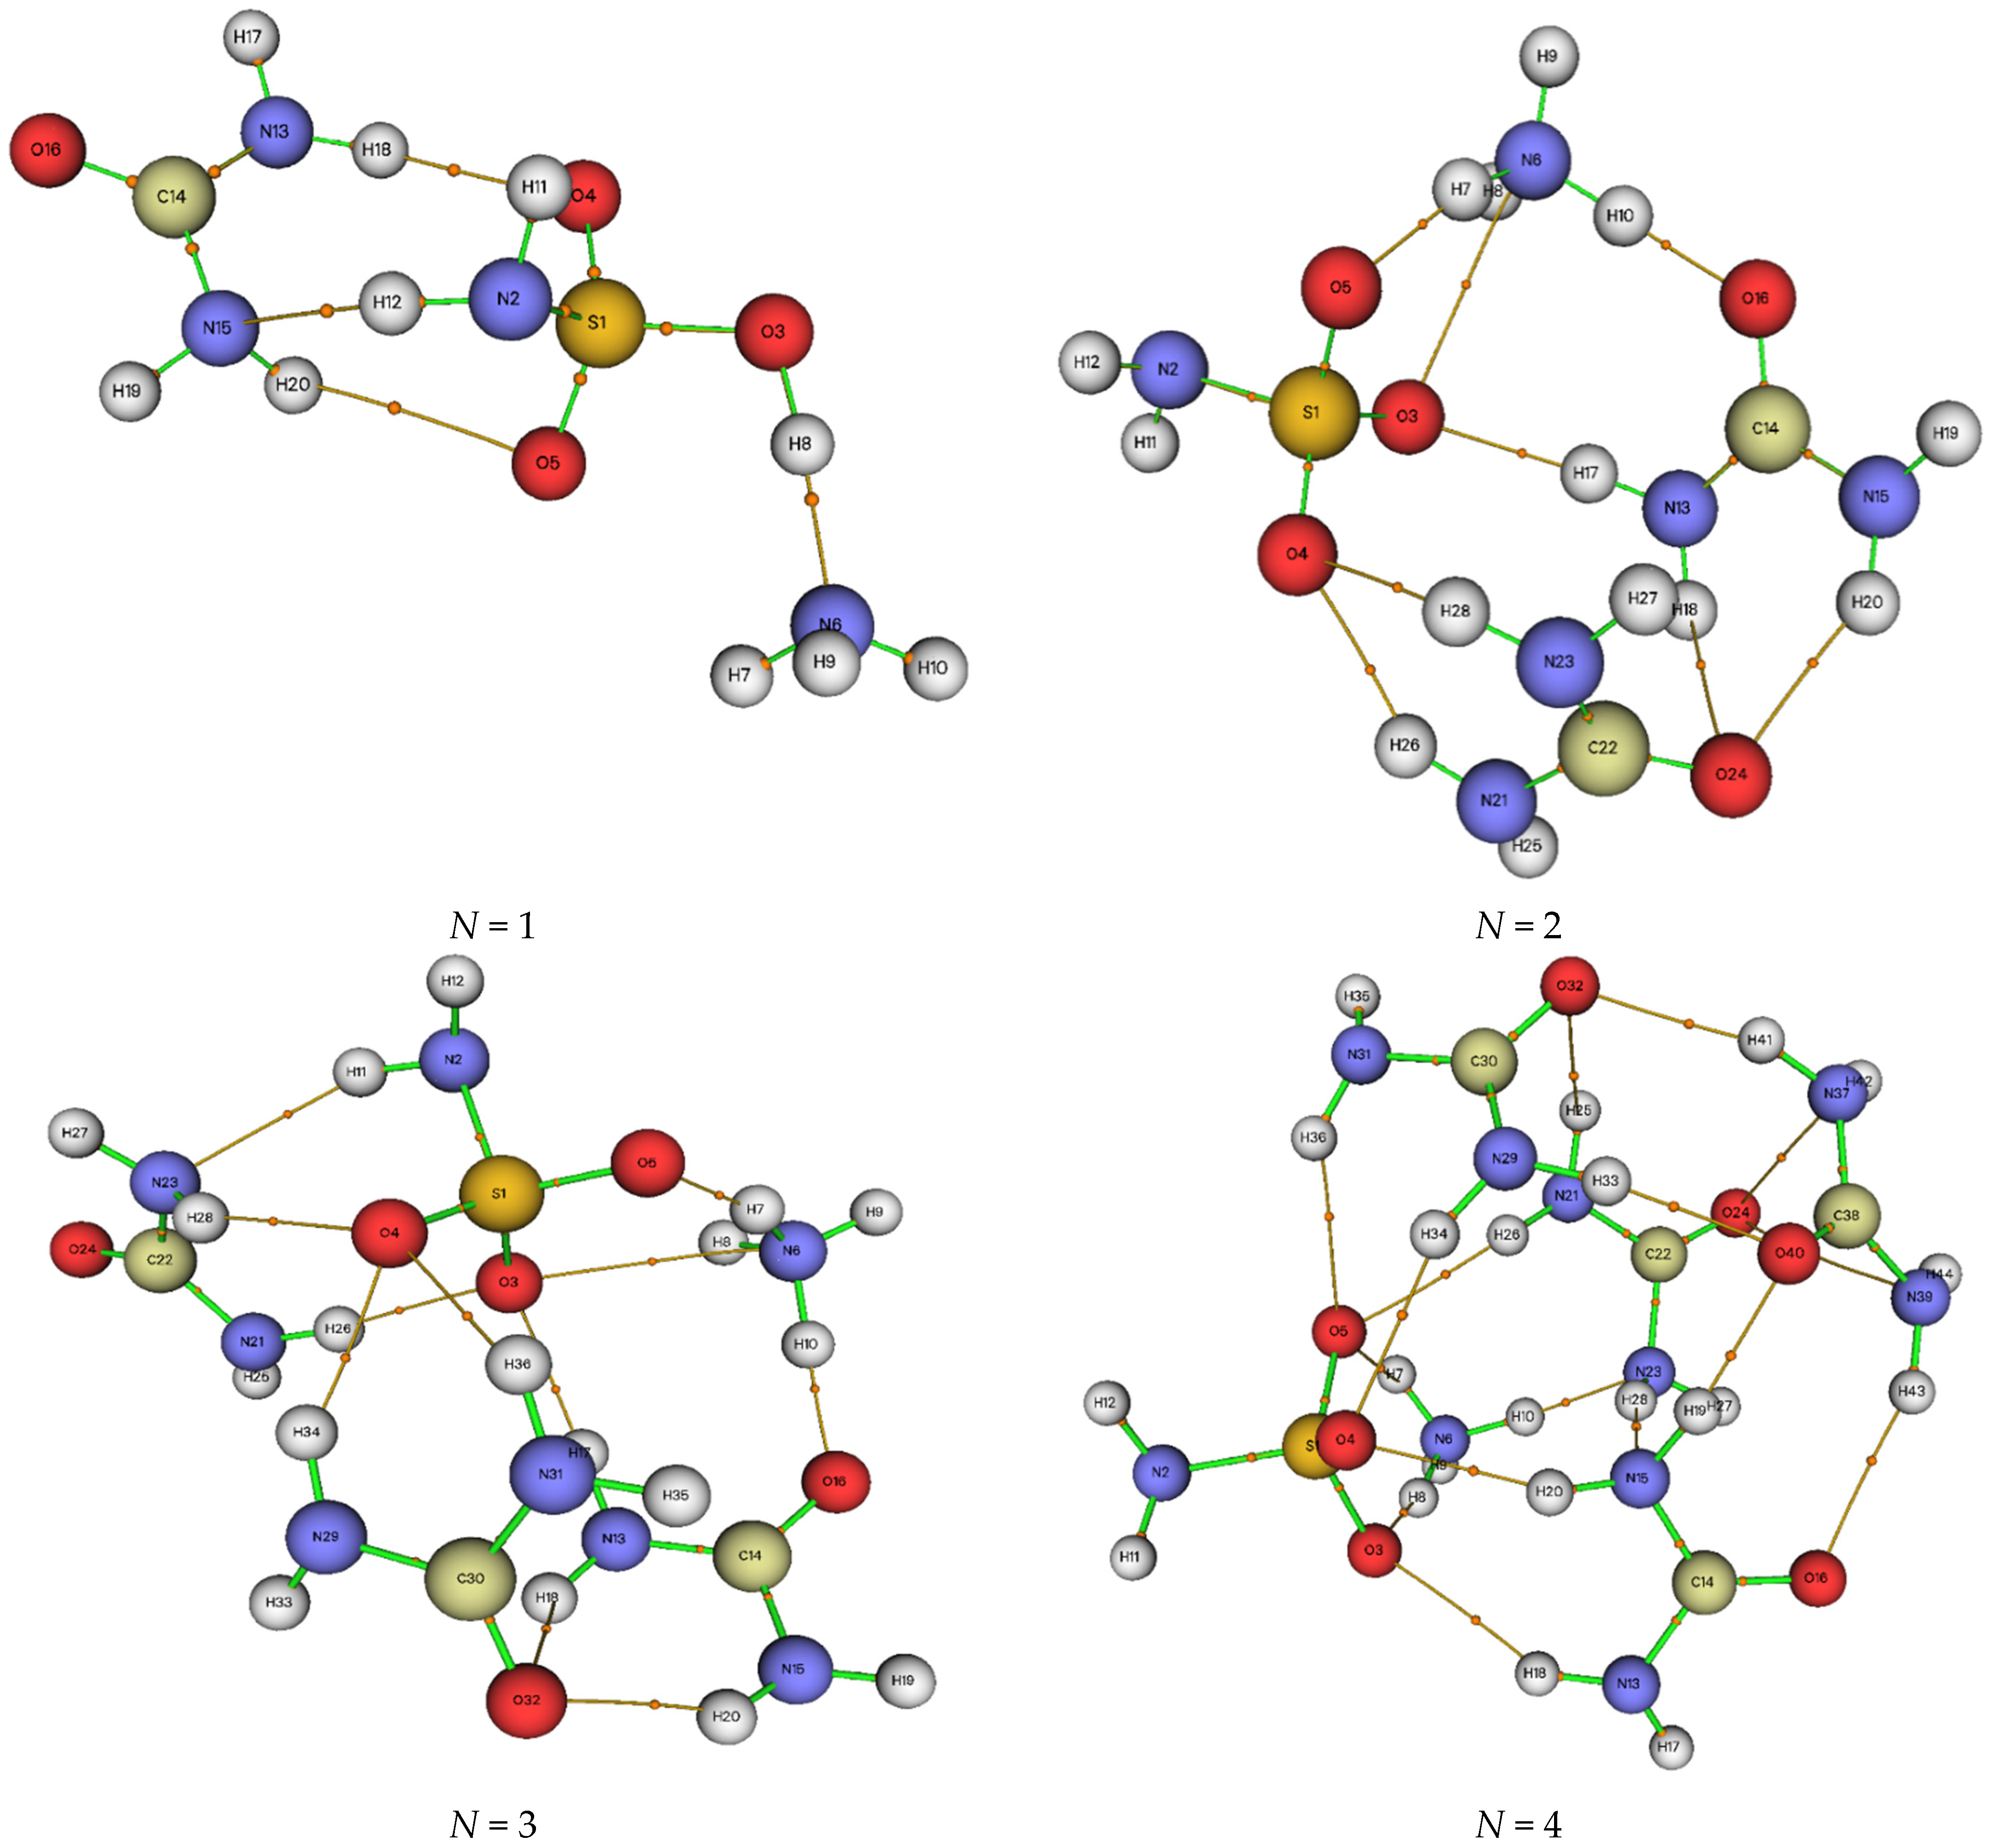
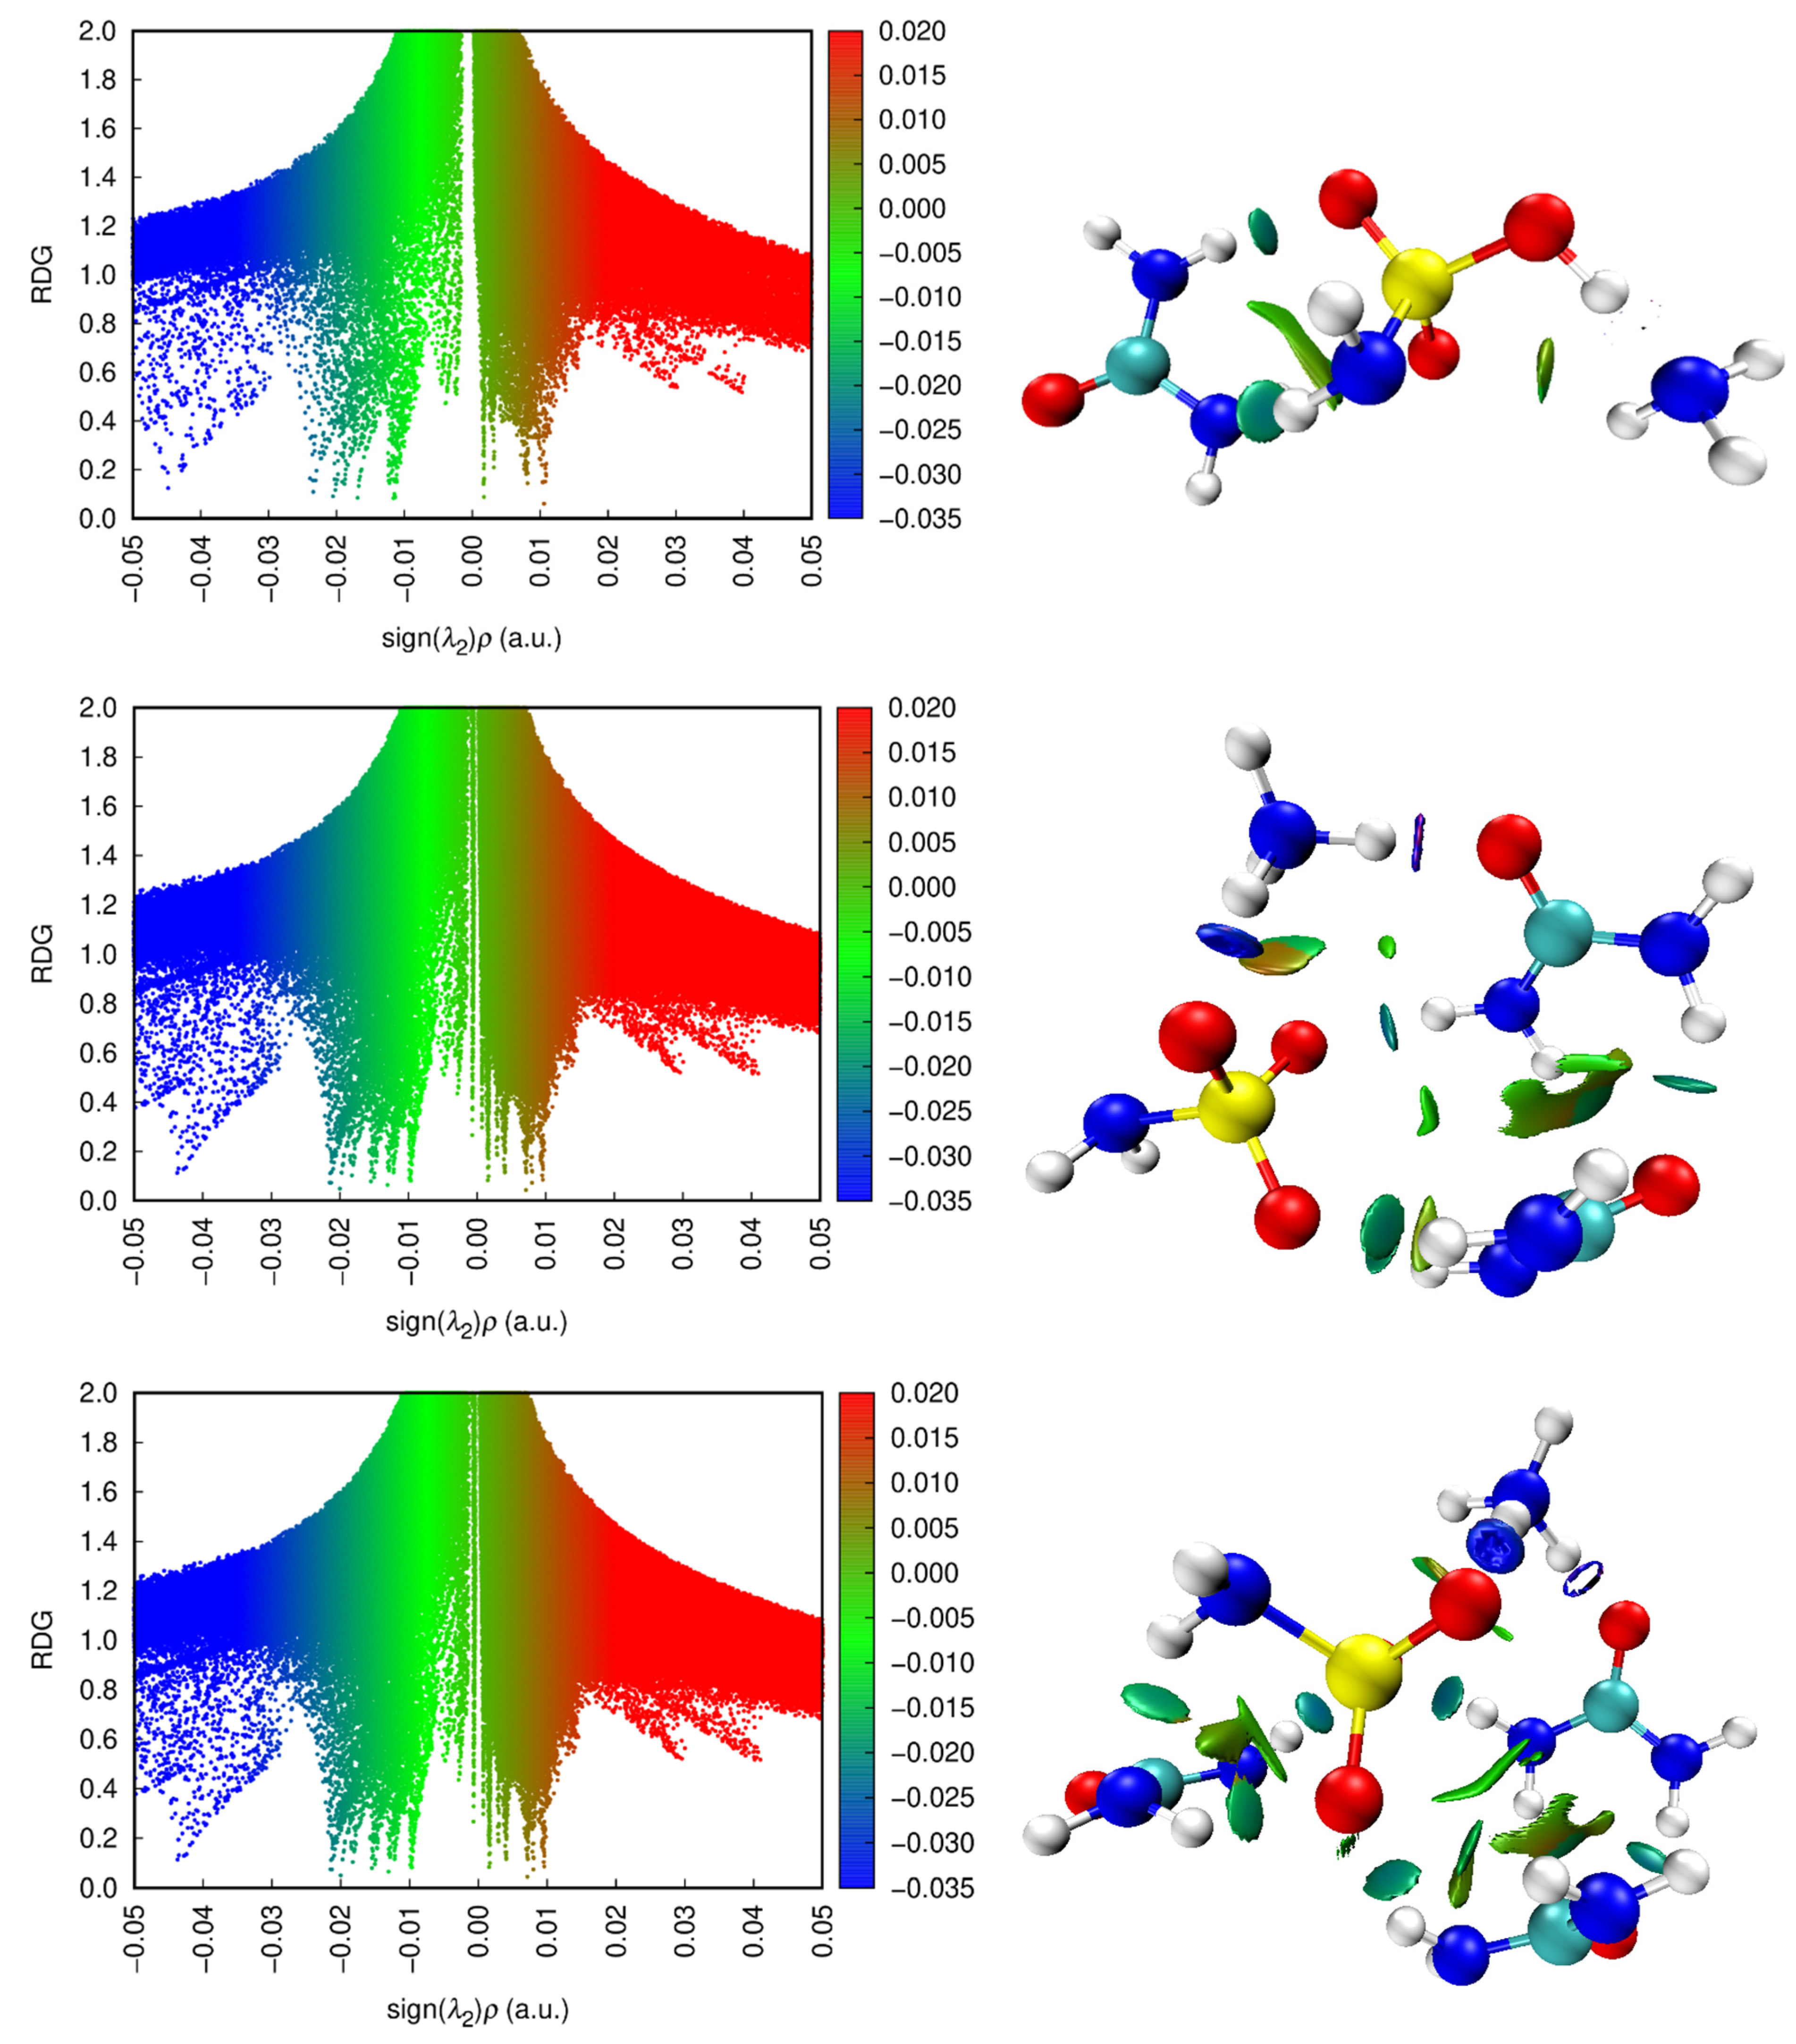
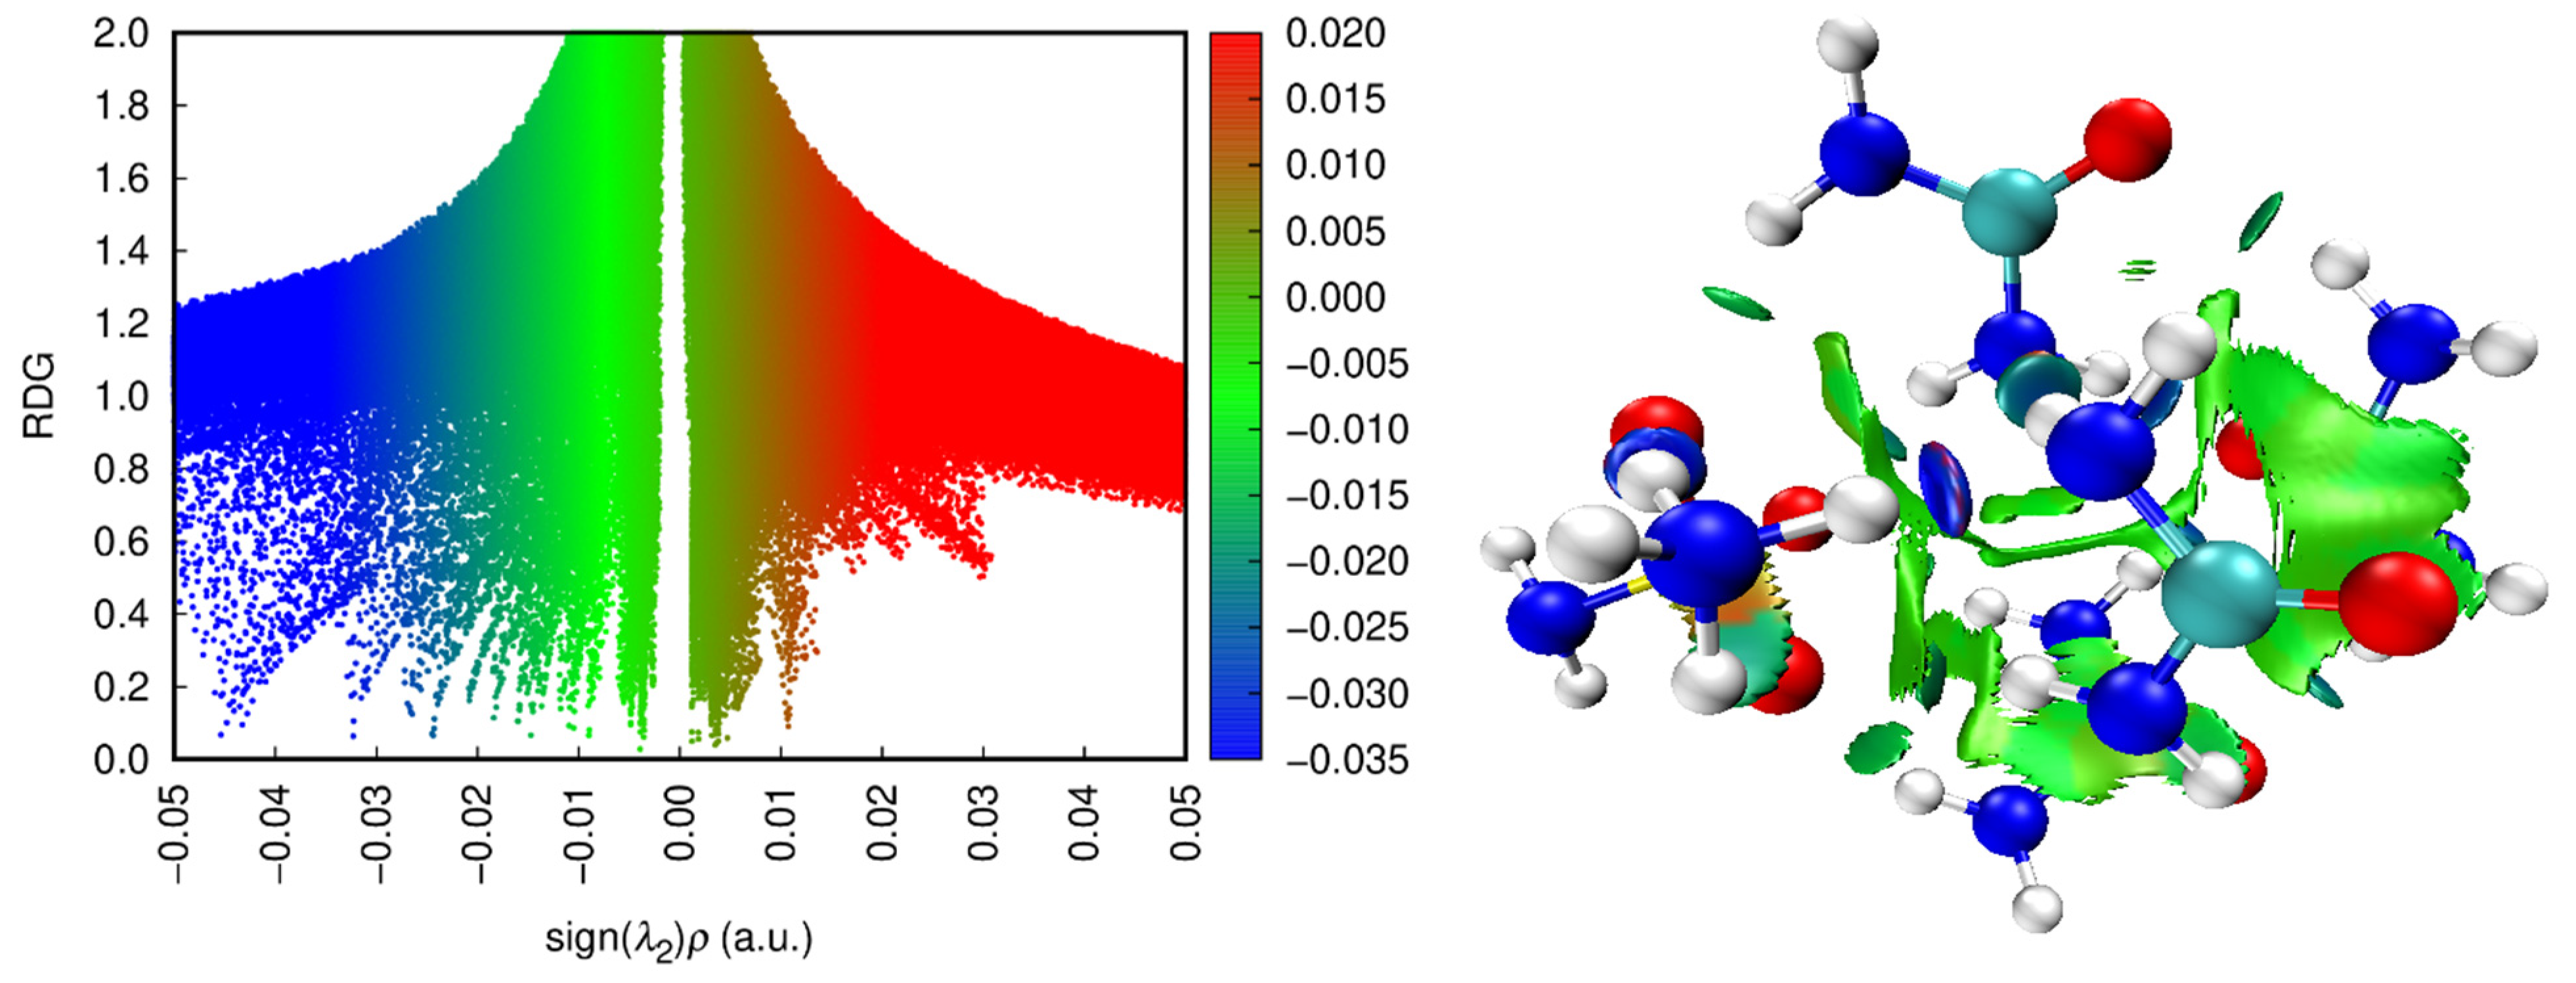
2.2.3. QTAIM, ELF, and RDG Analysis
2.3. Theoretical Spectroscopy Analysis
2.3.1. NH Bond Vibrations
2.3.2. SO Bond Vibrations
2.3.3. CO Bond Vibrations
2.3.4. SN and CN Bond Vibrations
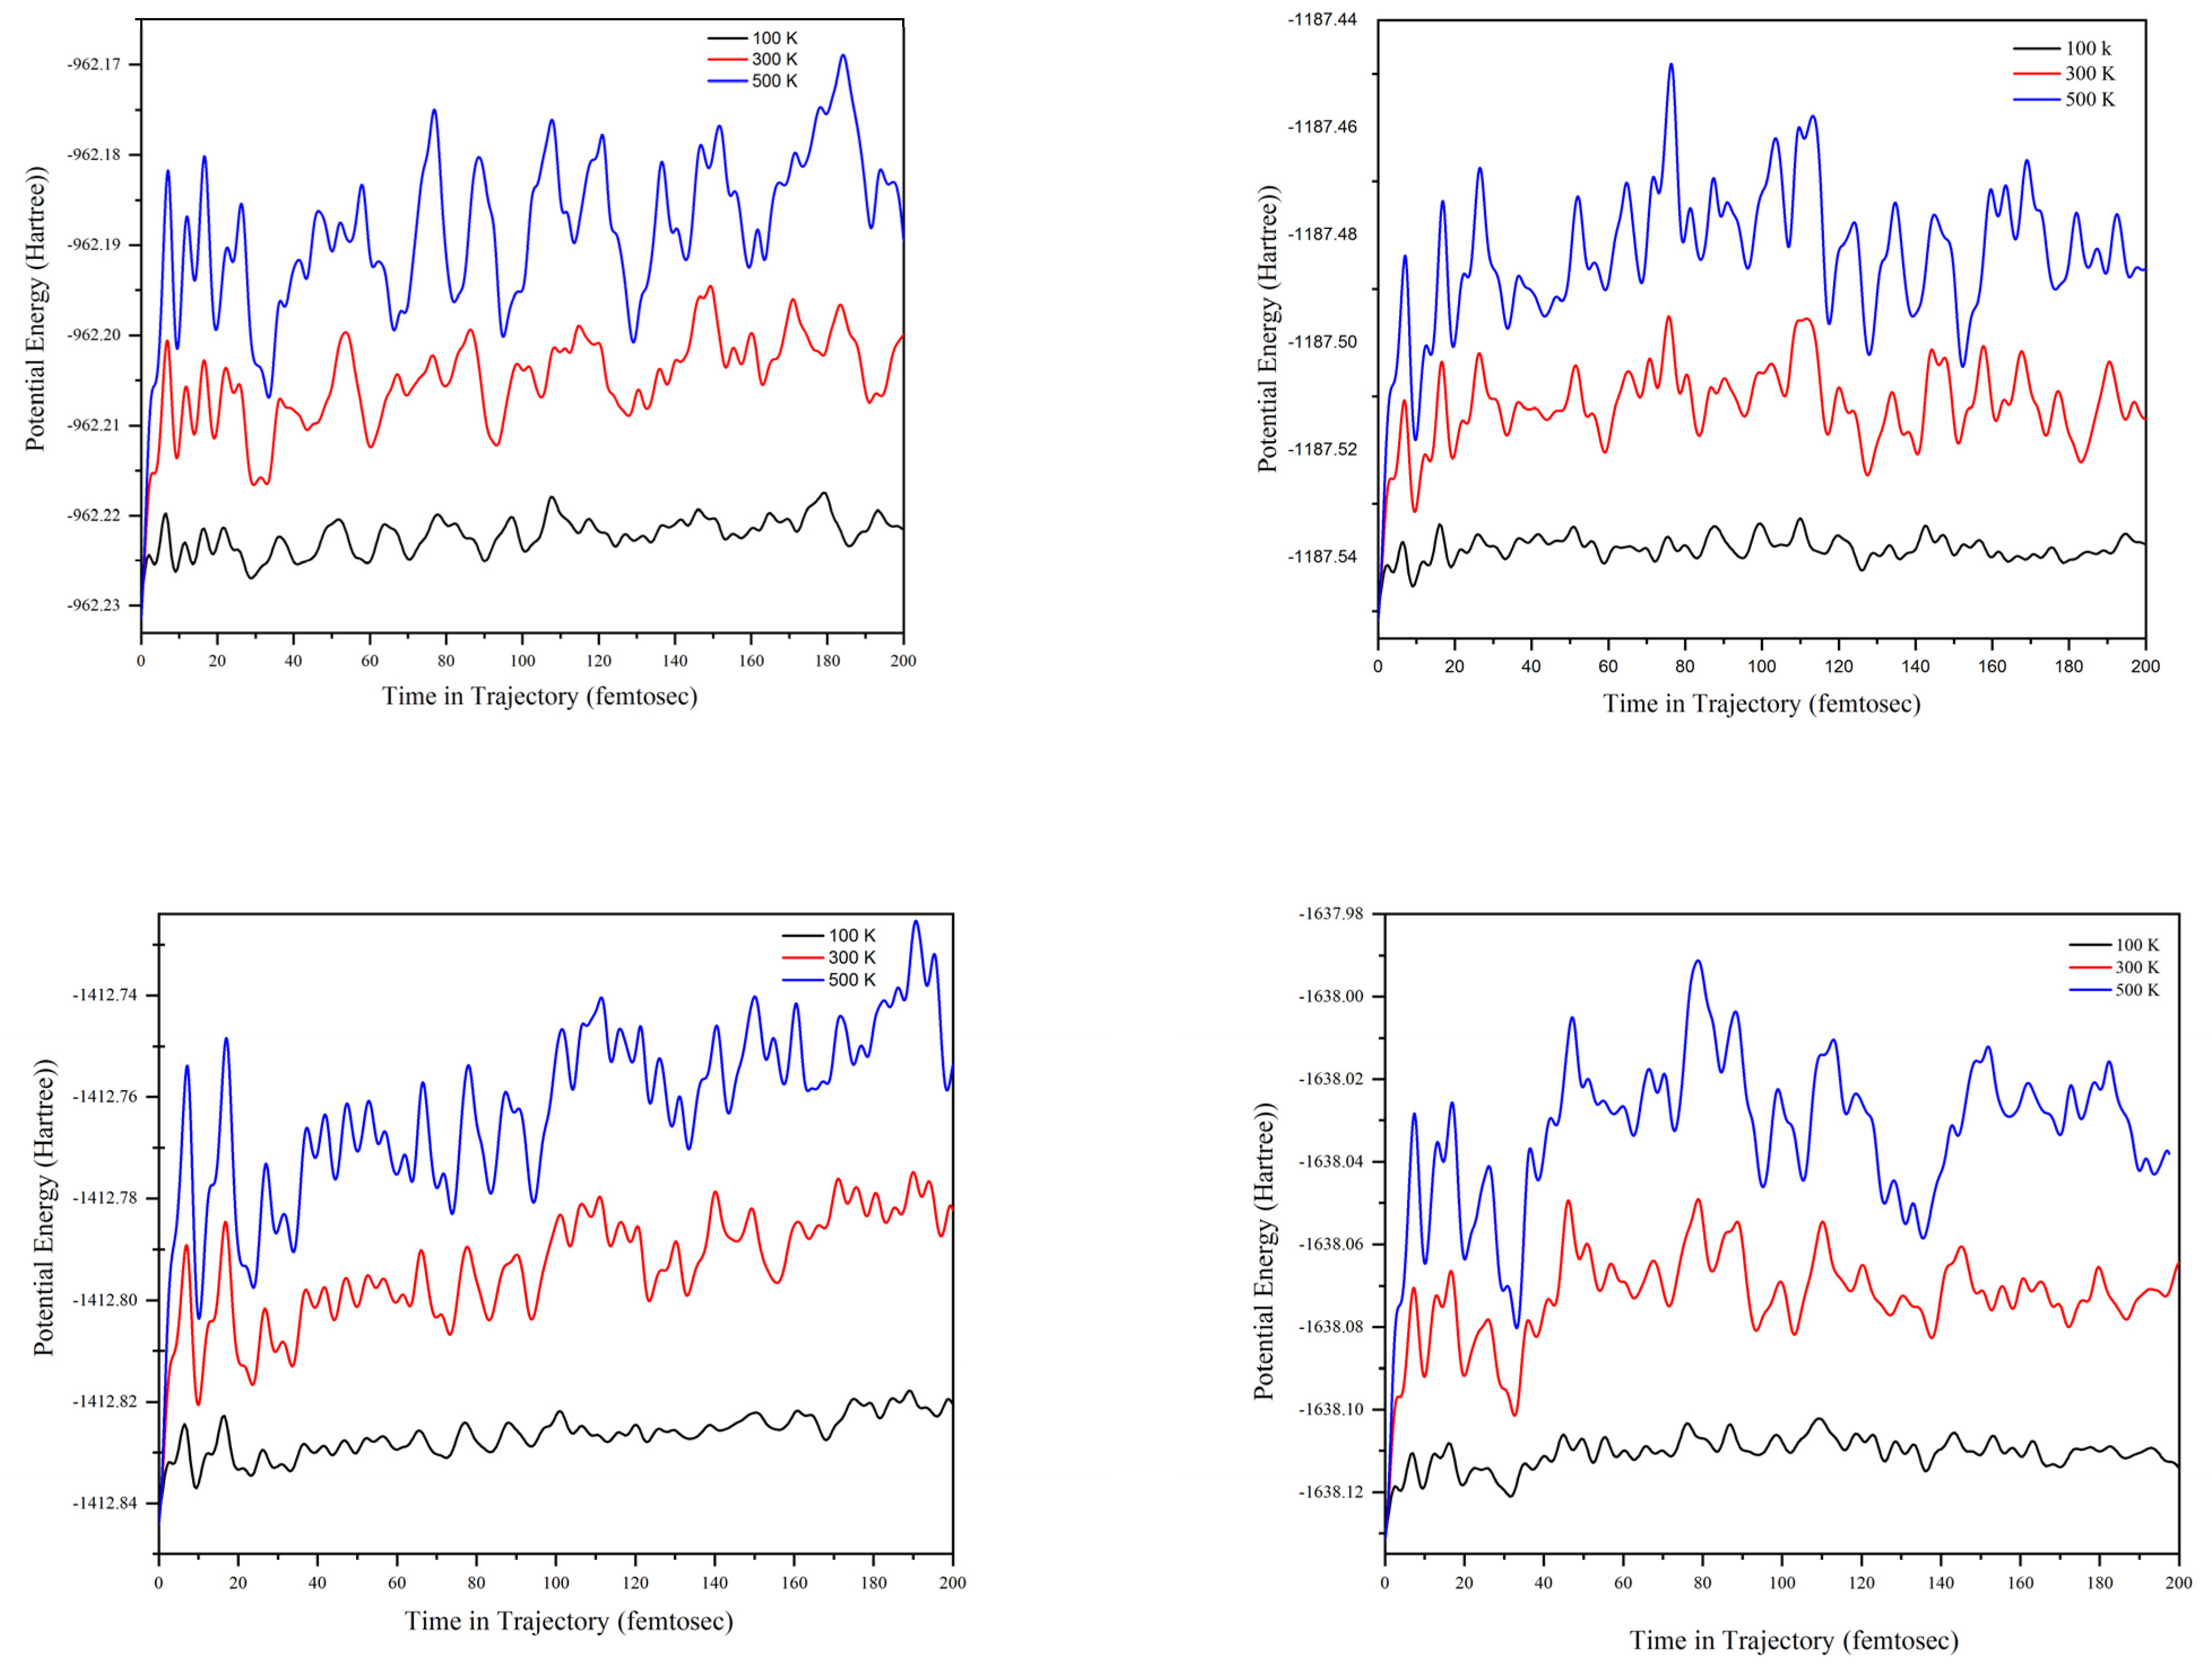
2.4. ADMP Molecular Dynamic Calculations
3. Experimental
3.1. Materials and Methods
3.2. Theoretical Calculation
3.3. Calculation Details
4. Conclusions
Supplementary Materials
Author Contributions
Funding
Institutional Review Board Statement
Informed Consent Statement
Data Availability Statement
Acknowledgments
Conflicts of Interest
References
- Piquero-Casals, J.; Morgado-Carrasco, D.; Granger, C.; Trullàs, C.; Jesús-Silva, A.; Krutmann, J. Urea in Dermatology: A Review of its Emollient, Moisturizing, Keratolytic, Skin Barrier Enhancing and Antimicrobial Properties. Dermatol. Ther. 2021, 11, 1905–1915. [Google Scholar] [CrossRef] [PubMed]
- Scheinfeld, N.S. Urea: A review of scientific and clinical data. Skinmed 2010, 8, 102–106. [Google Scholar] [PubMed]
- Kurzer, F.; Sanderson, P.M. Urea in the history of organic chemistry: Isolation from natural sources. J. Chem. Educ. 1956, 33, 452. [Google Scholar] [CrossRef]
- Bremner, J.M. Recent research on problems in the use of urea as a nitrogen fertilizer. Fertil. Res. 1995, 42, 321–329. [Google Scholar] [CrossRef]
- Azeem, B.; KuShaari, K.; Man, Z.B.; Basit, A.; Thanh, T.H. Review on materials & methods to produce controlled release coated urea fertilizer. J. Control. Release 2014, 181, 11–21. [Google Scholar] [CrossRef] [PubMed]
- Liang, J.; Li, T.; Cao, M.; Du, G. Urea-formaldehyde resin structure formation under alkaline condition: A quantitative 13C-NMR study. J. Adhes. Sci. Technol. 2018, 32, 439–447. [Google Scholar] [CrossRef]
- Gonçalves, C.; Pereira, J.; Paiva, N.; Ferra, J.; Martins, J.; Magalhães, F.; Barros-Timmons, A.; Carvalho, L. Impact of the Synthesis Procedure on Urea-Formaldehyde Resins Prepared by Alkaline–Acid Process. Ind. Eng. Chem. Res. 2019, 58, 5665–5676. [Google Scholar] [CrossRef]
- Chakraborty, T.K.; Mani, V.S. The Fate of Substituted Urea Herbicides in Plants and Soils—A Review. Int. J. Pest Manag. C 1968, 14, 364–374. [Google Scholar] [CrossRef]
- Sheets, T.J. Metabolism of Herbicides, Review of Disappearance of Substituted Urea Herbicides from Soil. J. Agric. Food Chem. 1964, 12, 30–33. [Google Scholar] [CrossRef]
- Krysiak, Z.J.; Stachewicz, U. Urea-Based Patches with Controlled Release for Potential Atopic Dermatitis Treatment. Pharmaceutics 2022, 14, 1494. [Google Scholar] [CrossRef]
- Markarian, S.A.; Gabrielyan, L.S.; Grigoryan, K.R. FT IR ATR Study of Molecular Interactions in the Urea/Dimethyl Sulfoxide and Urea/Diethyl Sulfoxide Binary Systems. J. Solut. Chem. 2004, 33, 1005–1015. [Google Scholar] [CrossRef]
- Babkina, T.S.; Kuznetsov, A.V. Phase equilibria in binary subsystems of urea–biuret–water system. J. Therm. Anal. Calorim. 2010, 101, 33–40. [Google Scholar] [CrossRef]
- Han, S.; Xu, J.; Meng, L.; Du, C.B.; Xu, R.J.; Wang, J.; Zhao, H.K. Determination and modeling of binary and ternary solid–liquid phase equilibrium for the systems formed by adipic acid, urea and diethylene glycol. Fluid Phase Equilibria 2016, 412, 1–8. [Google Scholar] [CrossRef]
- Spillane, W.; Malaubier, J.-B. Sulfamic Acid and Its N- and O-Substituted Derivatives. Chem. Rev. 2014, 114, 2507–2586. [Google Scholar] [CrossRef]
- Hallenbeck, W.H.; Cunningham-Burns, K.M. Ammonium Sulfamate. In Pesticides and Human Health; Springer: New York, NY, USA, 1985. [Google Scholar]
- Samanta, A.K.; Bagchi, A.; Chowdhuri, R. Chowdhuri. Statistical Optimization of Ammonium Sulfamate and Urea-Based Fire Protective Finishing of Jute Fabric. In Functional Textiles and Clothing; Springer: Singapore, 2020. [Google Scholar]
- Michelson, I.; Rathkamp, G. Composition of Cigarette Smoke: Effects of Ammonium Sulfamate in Cigarette Paper. Beiträge Zur Tab./Contrib. Tob. Res. 1974, 7, 212–216. [Google Scholar] [CrossRef] [Green Version]
- Kosova, D.A.; Voskov, A.L.; Kovalenko, N.A.; Uspenskaya, I.A. A Water–Urea–Ammonium Sulfamate system: Experimental investigation and thermodynamic modelling. Fluid Phase Equilibria 2016, 425, 312–323. [Google Scholar] [CrossRef]
- Kosova, D.A.; Druzhinina, A.I.; Tiflova, L.A.; Monayenkova, A.S.; Belyaeva, E.V.; Uspenskaya, I.A. Thermodynamic properties of ammonium sulfamate. J. Chem. Thermodyn. 2019, 132, 432–438. [Google Scholar] [CrossRef]
- Kosova, D.A.; Emelina, A.L.; Bykov, M.A. Phase transitions of some sulfur-containing ammonium salts. Thermochim. Acta 2014, 595, 61–66. [Google Scholar] [CrossRef]
- Taylor, E.G.; Desch, R.P.; Catotti, A.J. The Conductance of Sulfamic Acid and Some Sulfamates in Water at 25° and Conductance Measurements of Some Long Chain Sulfamates in Water and in Water-Acetone Mixtures at 25°. J. Am. Chem. Soc. 1951, 73, 74–77. [Google Scholar] [CrossRef]
- Kazachenko, A.S.; Akman, F.; Abdelmoulahi, H.; Issaoui, N.; Malyar, Y.N.; Al-Dossary, O.; Wojcik, M.J. Intermolecular hydrogen bonds interactions in water clusters of ammonium sulfamate: FTIR, X-ray diffraction, AIM, DFT, RDG, ELF, NBO analysis. J. Mol. Liq. 2021, 342, 117475. [Google Scholar] [CrossRef]
- Kosova, D.A.; Voskov, A.L.; Uspenskaya, I.A. Volumetric Properties of Binary and Ternary Solutions in the Water–Urea–Ammonium Sulfamate System. J. Solut. Chem. 2016, 45, 1182–1194. [Google Scholar] [CrossRef]
- Kumar, R.; Vijayan, N.; Khan, N.; Sonia; Kumari, M.; Jewariya, M.; Srivastava, R. Sulphamic acid: Potential single crystal for nonlinear optical applications. J. Mater. Sci. Mater. Electron. 2020, 31, 14271–14278. [Google Scholar] [CrossRef]
- Piasek, Z.; Urbanski, T. The Infra-red Absorption Spectrum and Structure of Urea. Bull. L’academie Pol. Sci. Serle Sci. Chimlques 1962, X, 113–120. [Google Scholar]
- Holder, C.F.; Schaak, R.E. Tutorial on Powder X-ray Diffraction for Characterizing Nanoscale Materials. ACS Nano 2019, 13, 7359–7365. [Google Scholar] [CrossRef] [Green Version]
- Ali, A.; Chiang, Y.W.; Santos, R.M. X-ray Diffraction Techniques for Mineral Characterization: A Review for Engineers of the Fundamentals, Applications, and Research Directions. Minerals 2022, 12, 205. [Google Scholar] [CrossRef]
- Stradella, L.; Argentero, M. A study of the thermal decomposition of urea, of related compounds and thiourea using DSC and TG-EGA. Thermochim. Acta 1993, 219, 315–323. [Google Scholar] [CrossRef]
- Ebrahimi-Kahrizsangi, R.; Abbasi, M.H. Evaluation of reliability of Coats-Redfern method for kinetic analysis of non-isothermal TGA. Trans. Nonferrous Met. Soc. China 2008, 18, 217–221. [Google Scholar] [CrossRef]
- Kazachenko, A.S.; Issaoui, N.; Medimagh, M.; Yu. Fetisova, O.; Berezhnaya, Y.D.; Elsuf’ev, E.V.; Al-Dossary, O.M.; Wojcik, M.J.; Xiang, Z.; Bousiakou, L.G. Experimental and theoretical study of the sulfamic acid-urea deep eutectic solvent. J. Mol. Liq. 2022, 363, 119859. [Google Scholar] [CrossRef]
- Perlovich, G. Melting points of one- and two-component molecular crystals as effective characteristics for rational design of pharmaceutical systems. Acta Crystallogr. Sect. B 2020, 76, 696–706. [Google Scholar] [CrossRef]
- Kollau, L.J.B.M.; Vis, M.; van den Bruinhorst, A.; Esteves, A.C.C.; Tuinier, R. Quantification of the liquid window of deep eutectic solvents. Chem. Commun. 2018, 54, 13351–13354. [Google Scholar] [CrossRef] [Green Version]
- Fan, L.; Shen, C.; Hu, K.; Liu, H.; Zhang, H. DFT Calculations and Thermodynamic Re-Assessment of the Fe-Y Binary System. J. Phase Equilibria Diffus. 2021, 42, 348–362. [Google Scholar] [CrossRef]
- Losetty, V.; Sandhya, M.S.; Yadav, C.H.; Pandiyan, V.; Sivakumar, K. Experimental and theoretical investigation of thermodynamic properties and hydrogen bonding strength of binary mixtures: Insights from FTIR and DFT calculation. Chem. Data Collect. 2022, 41, 100913. [Google Scholar] [CrossRef]
- Belletti, G.D.; Schulte, E.; Colombo, E.; Schmickler, W.; Quaino, P. Development of force fields for binary systems: Application to a dimethylsulfoxide (DMSO)—Oxygen mixture. Chem. Phys. Lett. 2019, 735, 136778. [Google Scholar] [CrossRef]
- Almandoz, M.C.; Sancho, M.I.; Duchowicz, P.R.; Blanco, S.E. UV–Vis spectroscopic study and DFT calculation on the solvent effect of trimethoprim in neat solvents and aqueous mixtures. Spectrochim. Acta Part A Mol. Biomol. Spectrosc. 2014, 129, 52–60. [Google Scholar] [CrossRef]
- Kazachenko, A.S.; Vasilieva, N.Y.; Malyar, Y.N.; Karacharov, A.A.; Kondrasenko, A.A.; Levdanskiy, A.V.; Borovkova, V.S.; Miroshnikova, A.V.; Issaoui, N.; Kazachenko, A.S.; et al. Sulfation of arabinogalactan with ammonium sulfamate. Biomass Convers. Biorefinery 2022, 1–13. [Google Scholar] [CrossRef]
- Vasil’eva, N.Y.; Levdansky, A.V.; Kuznetsov, B.N.; Skvortsova, G.P.; Kazachenko, A.S.; Djakovitch, L.; Pinel, C. Sulfation of arabinogalactan by sulfamic acid in dioxane. Russ. J. Bioorganic Chem. 2015, 41, 725–731. [Google Scholar] [CrossRef]
- Choudhary, V.; Bhatt, A.; Dash, D.; Sharma, N. DFT calculations on molecular structures, HOMO–LUMO study, reactivity descriptors and spectral analyses of newly synthesized diorganotin(IV) 2-chloridophenylacetohydroxamate complexes. J. Comput. Chem. 2019, 40, 2354–2363. [Google Scholar] [CrossRef]
- El-Gammal, O.A.; Abu El-Reash, G.M.; Ghazy, S.E.; Radwan, A.H. Synthesis, characterization, molecular modeling and antioxidant activity of (1E,5E)-1,5-bis(1-(pyridin-2-yl)ethylidene)carbonohydrazide (H2APC) and its zinc(II), cadmium(II) and mercury(II) complexes. J. Mol. Struct. 2012, 1020, 6–15. [Google Scholar] [CrossRef]
- Abu El-Reash, G.M.; El-Gammal, O.A.; Ghazy, S.E.; Radwan, A.H. Characterization and biological studies on Co(II), Ni(II) and Cu(II) complexes of carbohydrazones ending by pyridyl ring. Spectrochim. Acta Part A Mol. Biomol. Spectrosc. 2013, 104, 26–34. [Google Scholar] [CrossRef]
- Kazachenko, A.; Akman, F.; Medimagh, M.; Issaoui, N.; Vasilieva, N.; Malyar, Y.N.; Sudakova, I.G.; Karacharov, A.; Miroshnikova, A.; Al-Dossary, O.M. Sulfation of Diethylaminoethyl-Cellulose: QTAIM Topological Analysis and Experimental and DFT Studies of the Properties. ACS Omega 2021, 6, 22603–22615. [Google Scholar] [CrossRef]
- Arjunan, V.; Devi, L.; Subbalakshmi, R.; Rani, T.; Mohan, S. Synthesis, vibrational, NMR, quantum chemical and structure-activity relation studies of 2-hydroxy-4-methoxyacetophenone. Spectrochim. Acta Part A Mol. Biomol. Spectrosc. 2014, 130, 164–177. [Google Scholar] [CrossRef] [PubMed]
- Fukui, K. Role of Frontier Orbitals in Chemical Reactions. Science 1982, 218, 747–754. [Google Scholar] [CrossRef] [PubMed] [Green Version]
- Bahnasawy, R.; Shereafy, E.; Kashar, T. Thermal and temperature dependence of electrical conductivity studies on Zn, Cd and Hg hydrazone complexes. J. Therm. Anal. Calorim. 1993, 39, 65–74. [Google Scholar] [CrossRef]
- Akman, F.; Kazachenko, A.; Malyar, Y. A density functional theory study of sulfated monolignols: P-Coumaril and coniferyl alcohols. Cellul. Chem. Technol. 2021, 55, 41–54. [Google Scholar] [CrossRef]
- Ramalingam, A.; Sambandam, S.; Medimagh, M.; Al-Dossary, O.; Issaoui, N.; Wojcik, M.J. Study of a new piperidone as an anti-Alzheimer agent: Molecular docking, electronic and intermolecular interaction investigations by DFT method. J. King Saud Univ.-Sci. 2021, 33, 101632. [Google Scholar] [CrossRef]
- Kazachenko, A.S.; Medimagh, M.; Issaoui, N.; Al-Dossary, O.; Wojcik, M.J.; Kazachenko, A.S.; Miroshnokova, A.V.; Malyar, Y.N. Sulfamic acid/water complexes (SAA-H2O(1-8)) intermolecular hydrogen bond interactions: FTIR, X-ray, DFT and AIM analysis. J. Mol. Struct. 2022, 1265, 133394. [Google Scholar] [CrossRef]
- Akman, F.; Issaoui, N.; Kazachenko, A.S. Intermolecular hydrogen bond interactions in the thiourea/water complexes (Thio-(H2O)n) (n = 1, …, 5): X-ray, DFT, NBO, AIM, and RDG analyses. J. Mol. Model. 2020, 26, 161. [Google Scholar] [CrossRef]
- Politzer, P.; Murray, J.S. The fundamental nature and role of the electrostatic potential in atoms and molecules. Theor. Chem. Acc. 2002, 108, 134–142. [Google Scholar] [CrossRef]
- Murray, J.S.; Lane, P.; Politzer, P. Expansion of the σ-hole concept. J. Mol. Model. 2009, 15, 723–729. [Google Scholar] [CrossRef]
- Politzer, P.; Murray, J.S.; Peralta-Inga, Z. Molecular surface electrostatic potentials in relation to noncovalent interactions in biological systems. Int. J. Quantum Chem. 2001, 85, 676–684. [Google Scholar] [CrossRef]
- Muthu, S.; Renuga, S. Vibrational spectra and normal coordinate analysis of 2-hydroxy-3-(2-methoxyphenoxy) propyl carbamate. Spectrochim. Acta Part A Mol. Biomol. Spectrosc. 2014, 132, 313–325. [Google Scholar] [CrossRef] [PubMed]
- Akman, F. A comparative study based on molecular structure, spectroscopic, electronic, thermodynamic and NBO analysis of some nitrogen-containing monomers. Polym. Bull. 2021, 78, 663–693. [Google Scholar] [CrossRef]
- Medimagh, M.; Issaoui, N.; Gatfaoui, S.; Al-Dossary, O.; Kazachenko, A.S.; Marouani, H.; Wojcik, M.J. Molecular modeling and biological activity analysis of new organic-inorganic hybrid: 2-(3,4-dihydroxyphenyl) ethanaminium nitrate. J. King Saud Univ.-Sci. 2021, 33, 101616. [Google Scholar] [CrossRef]
- Bader, R.F.W. Atoms in Molecules A Quantum Theory; Oxford University Press: Oxford, UK, 1990. [Google Scholar]
- Bader, R.F.W. Atoms in molecules in external fields. J. Chem. Phys. 1989, 91, 6989–7001. [Google Scholar] [CrossRef]
- Rodríguez, J.I. An efficient method for computing the QTAIM topology of a scalar field: The electron density case. J. Comput. Chem. 2013, 34, 681–686. [Google Scholar] [CrossRef]
- Chiter, C.; Bouchama, A.; Mouas, T.N.; Allal, H.; Yahiaoui, M.; Warad, I.; Zarrouk, A.; Djedouani, A. Synthesis, crystal structure, spectroscopic and hirshfeld surface analysis, NCI-RDG, DFT computations and antibacterial activity of new asymmetrical azines. J. Mol. Struct. 2020, 1217, 128376. [Google Scholar] [CrossRef]
- Contreras-García, J.; Boto, R.A.; Izquierdo-Ruiz, F.; Reva, I.; Woller, T.; Alonso, M. A benchmark for the non-covalent interaction (NCI) index or… is it really all in the geometry? Theor. Chem. Acc. Theory Comput. Model. 2016, 135, 242. [Google Scholar] [CrossRef] [Green Version]
- Johnson, E.R.; Keinan, S.; Mori-Sánchez, P.; Contreras-García, J.; Cohen, A.J.; Yang, W. Revealing Noncovalent Interactions. J. Am. Chem. Soc. 2010, 132, 6498–6506. [Google Scholar] [CrossRef] [Green Version]
- Dexlin, X.D.D.; Tarika, J.D.D.; Kumar, S.M.; Mariappan, A.; Beaula, T.J. Synthesis and DFT computations on structural, electronic and vibrational spectra, RDG analysis and molecular docking of novel Anti COVID-19 molecule 3, 5 Dimethyl Pyrazolium 3, 5 Dichloro Salicylate. J. Mol. Struct. 2021, 1246, 131165. [Google Scholar] [CrossRef]
- Becke, A.D. Density-functional exchange-energy approximation with correct asymptotic behavior. Phys. Rev. A 1988, 38, 3098–3100. [Google Scholar] [CrossRef]
- Becke, A.D. Density-functional thermochemistry. III. The role of exact exchange. J. Chem. Phys. 1993, 98, 5648–5652. [Google Scholar] [CrossRef]
- Raja, M.; Raj Muhamed, R.; Muthu, S.; Suresh, M.; Muthu, K. Synthesis, spectroscopic (FT-IR, FT-Raman, NMR, UV–Visible), Fukui function, antimicrobial and molecular docking study of (E)-1-(3-bromobenzylidene)semicarbazide by DFT method. J. Mol. Struct. 2017, 1130, 374–384. [Google Scholar] [CrossRef]
- Orlando, A.; Franceschini, F.; Muscas, C.; Pidkova, S.; Bartoli, M.; Rovere, M.; Tagliaferro, A. A Comprehensive Review on Raman Spectroscopy Applications. Chemosensors 2021, 9, 262. [Google Scholar] [CrossRef]
- Tohm, C.; Bheemasetti, T.; Diwakar, P. Spectroscopy framework and review of characterization of energy resource sites. Energy Geosci. 2022, 3, 147–159. [Google Scholar] [CrossRef]
- Rohman, A.; Ghazali, M.A.I.B.; Windarsih, A.; Irnawati; Riyanto, S.; Yusof, F.M.; Mustafa, S. Comprehensive Review on Application of FTIR Spectroscopy Coupled with Chemometrics for Authentication Analysis of Fats and Oils in the Food Products. Molecules 2020, 25, 5485. [Google Scholar] [CrossRef]
- Vuagnat, A.M.; Wagner, E.L. Vibrational Spectra and Structure of Solid Sulfamic Acid and the Sulfamate Ion. J. Chem. Phys. 1957, 26, 77–82. [Google Scholar] [CrossRef]
- Vaughan, P.; Donohue, J. The structure of urea. Interatomic distances and resonance in urea and related compounds. Acta Crystallogr. 1952, 5, 530–535. [Google Scholar] [CrossRef]
- Vrabec, J.; Huang, Y.-l.; Hasse, H. Molecular models for 267 binary mixtures validated by vapor–liquid equilibria: A systematic approach. Fluid Phase Equilibria 2009, 279, 120–135. [Google Scholar] [CrossRef]
- Rodríguez-Guadarrama, L.A.; Ramanathan, S.; Mohanty, K.K.; Vasquez, V. Molecular modeling of binary mixtures of amphiphiles in a lattice solution. Fluid Phase Equilibria 2004, 226, 27–36. [Google Scholar] [CrossRef]
- Slama, M.; Habli, H.; Laajimi, M.; Ghalla, H.; Ben El Hadj Rhouma, M. Microsolvation of lithium cation in xenon clusters: An octahedral growth pattern. J. Mol. Graph. Model. 2022, 116, 108229. [Google Scholar] [CrossRef]
- Iyengar, S.S.; Schlegel, H.B.; Voth, G.A. Atom-Centered Density Matrix Propagation (ADMP): Generalizations Using Bohmian Mechanics. J. Phys. Chem. A 2003, 107, 7269–7277. [Google Scholar] [CrossRef]
- Schlegel, H.B.; Iyengar, S.S.; Li, X.; Millam, J.M.; Voth, G.A.; Scuseria, G.E.; Frisch, M.J. Ab initio molecular dynamics: Propagating the density matrix with Gaussian orbitals. III. Comparison with Born–Oppenheimer dynamics. J. Chem. Phys. 2002, 117, 8694–8704. [Google Scholar] [CrossRef] [Green Version]
- Andrys, J.; Heider, J.; Borowski, T. Comparison of different approaches to derive classical bonded force-field parameters for a transition metal cofactor: A case study for non-heme iron site of ectoine synthase. Theor. Chem. Acc. 2021, 140, 115. [Google Scholar] [CrossRef]
- Iyengar, S.S.; Schlegel, H.B.; Voth, G.A.; Millam, J.M.; Scuseria, G.E.; Frisch, M.J. Ab initio molecular dynamics: Propagating the density matrix with gaussian orbitals. IV. Formal analysis of the deviations from born-oppenheimer dynamics. Isr. J. Chem. 2002, 42, 191–202. [Google Scholar] [CrossRef]
- Iyengar, S.S.; Petersen, M.K.; Day, T.J.F.; Burnham, C.J.; Teige, V.E.; Voth, G.A. The properties of ion-water clusters. I. The protonated 21-water cluster. J. Chem. Phys. 2005, 123, 084309. [Google Scholar] [CrossRef]
- Iyengar, S.S.; Schlegel, H.B.; Millam, J.M.; Voth, G.A.; Scuseria, G.E.; Frisch, M.J. Ab initio molecular dynamics: Propagating the density matrix with Gaussian orbitals. II. Generalizations based on mass-weighting, idempotency, energy conservation and choice of initial conditions. J. Chem. Phys. 2001, 115, 10291–10302. [Google Scholar] [CrossRef]
- Hildebrand, J.H.; Scott, R.L. The Solubility of Non-Electrolytes; Rheinhold: New York, NY, USA, 1949. [Google Scholar]
- Frisch, M.J.; Trucks, G.W.; Schlegel, H.B.; Scuseria, G.E.; Robb, M.A.; Cheeseman, J.R.; Scalmani, G.; Barone, V.; Mennucci, B.; Petersson, G.A.; et al. Gaussian 09, Revision C.01; Gaussian, Inc.: Wallingford, UK, 2009. [Google Scholar]
- GaussView; Guassian, Inc.; Semichem. Inc.:: Pittsburgh, PA, USA, 2000–2003.
- Todd, A.; Keith, T.K. AIMAll (Version 19.10.12); Gristmill Software: Overland Park, KS, USA, 2019. [Google Scholar]
- Lu, T.; Chen, F. Multiwfn: A multifunctional wavefunction analyzer. J. Comput. Chem. 2012, 33, 580–592. [Google Scholar] [CrossRef]
- Humphrey, W.; Dalke, A.; Schulten, K. VMD: Visual molecular dynamics. J. Mol. Graph. 1996, 14, 33–38. [Google Scholar] [CrossRef]


| Sample | Temperature Range, °C | Activation Energy (Ea), kJ/mol | Preexponential Multiplier (A), s−1 |
|---|---|---|---|
| U | 162–247 | 97.0 | 1.9 × 10⁹ |
| ASA | 217–467 | 49.6 | 7.2 × 10⁶ |
| ASA:U 1:1 | 175–256 | 54.7 | 3.0 × 10⁵ |
| ASA:U 1:2 | 175–415 | 48.5 | 1.6 × 10⁶ |
| ASA:U 1:3 | 160–395 | 45.5 | 2.3 × 10⁶ |
| ASA:U 1:4 | 146–376 | 45.4 | 2.1 × 10⁶ |
| Sample | Melting Point, °C |
|---|---|
| Urea (U) | 133 |
| Ammonium sulfamate (ASA) | 131 |
| ASA:U 1:1 | 84 |
| ASA:U 1:2 | 87 |
| ASA:U 1:3 | 90 |
| ASA:U 1:4 | 96 |
| Sample | Solid | Liquid | Gas |
|---|---|---|---|
| ASA:U 1:1 | <83 | 84–175 | >176 |
| ASA:U 1:2 | <86 | 87–175 | >175 |
| ASA:U 1:3 | <89 | 90–165 | >165 |
| ASA:U 1:4 | <95 | 96–146 | >146 |
| Sample | ΔμiT (ASA), kJ/mol | ΔμiT (U), kJ/mol |
|---|---|---|
| ASA:U 1:1 | −2.06 | −2.06 |
| ASA:U 1:2 | −3.32 | −1.20 |
| ASA:U 1:3 | −4.18 | −0.87 |
| ASA:U 1:4 | −4.94 | −0.68 |
| Sample | χ (ASA) | χ (U) | χ (ASA:U) |
|---|---|---|---|
| ASA:U 1:1 | −2.77 | −2.77 | −2.77 |
| ASA:U 1:2 | −2.47 | −3.67 | −3.28 |
| ASA:U 1:3 | −2.46 | −4.60 | −4.06 |
| ASA:U 1:4 | −2.51 | −5.57 | v4.96 |
| Parameter (eV) | N = 1 | N = 2 | N = 3 | N = 4 |
|---|---|---|---|---|
| EHOMO | −7.1300 | −7.1600 | −7.0700 | −7.0400 |
| ELUMO | −0.7100 | −0.6600 | −0.9000 | −1.2600 |
| Energy gap | 6.4200 | 6.5000 | 6.1700 | 5.7800 |
| Ionization potential | 7.1300 | 7.1600 | 7.0700 | 7.0400 |
| Electron affinity | 0.7100 | 0.6600 | 0.9000 | 1.2600 |
| Electronegativity | 3.9200 | 3.9100 | 3.9850 | 4.1500 |
| Chemical potential | −3.9200 | −3.9100 | −3.9850 | −4.1500 |
| Chemical hardness | 3.2100 | 3.2500 | 3.0850 | 2.8900 |
| Chemical softness | 0.3115 | 0.3077 | 0.3241 | 0.3460 |
| Global electrophilicity index | 2.3935 | 2.3520 | 2.5738 | 2.9797 |
| Maximum charge transfer index | 1.2212 | 1.2031 | 1.2917 | 1.4360 |
| Nucleophilicity index | 0.4178 | 0.4252 | 0.3885 | 0.3356 |
| Optical softness | 0.1558 | 0.1538 | 0.1621 | 0.1730 |
| Parameter | N = 1 | N = 2 | N = 3 | N = 4 |
|---|---|---|---|---|
| E(RB3LYP) (a.u.) | −962.23145 | −1187.5518 | −1412.844 | −1638.1316 |
| Dipole Moment (Debye) | 7.6544727 | 5.3019744 | 7.6456568 | 11.870975 |
| Polarizability (a.u.) | 86.585041 | 121.01455 | 155.60431 | 188.86192 |
| Hyperpolarizability (a.u) | 106.25774 | 141.08799 | 173.68145 | 248.69445 |
| Electronic Energy (EE) (a.u.) | −962.23145 | −1187.5518 | −1412.844 | −1638.1316 |
| Zero-Point Energy Correction (a.u.) | 0.15438 | 0.223065 | 0.289022 | 0.354993 |
| Thermal Energy Correction (a.u.) | 0.168616 | 0.242165 | 0.313932 | 0.385602 |
| Thermal Enthalpy Correction (a.u.) | 0.16956 | 0.243109 | 0.314876 | 0.386546 |
| Thermal Free Energy Correction (a.u.) | 0.11061 | 0.174478 | 0.230917 | 0.291085 |
| EE + Zero-Point Energy (a.u.) | −962.07707 | −1187.3288 | −1412.555 | −1637.7766 |
| EE + Thermal Energy Correction (a.u.) | −962.06283 | −1187.3097 | −1412.53 | −1637.746 |
| EE + Thermal Enthalpy Correction (a.u.) | −962.06189 | −1187.3087 | −1412.5291 | −1637.745 |
| EE + Thermal Free Energy Correction (a.u.) | −962.12084 | −1187.3773 | −1412.6131 | −1637.8405 |
| E (Thermal) (kcal/mol) | 105.808 | 151.961 | 196.995 | 241.969 |
| Heat Capacity (Cv) (cal/mol-kelvin) | 47.822 | 66.847 | 86.688 | 106.05 |
| Entropy (S) (cal/mol-kelvin) | 124.071 | 144.447 | 176.708 | 200.914 |
Disclaimer/Publisher’s Note: The statements, opinions and data contained in all publications are solely those of the individual author(s) and contributor(s) and not of MDPI and/or the editor(s). MDPI and/or the editor(s) disclaim responsibility for any injury to people or property resulting from any ideas, methods, instructions or products referred to in the content. |
© 2023 by the authors. Licensee MDPI, Basel, Switzerland. This article is an open access article distributed under the terms and conditions of the Creative Commons Attribution (CC BY) license (https://creativecommons.org/licenses/by/4.0/).
Share and Cite
Kazachenko, A.S.; Issaoui, N.; Fetisova, O.Y.; Berezhnaya, Y.D.; Al-Dossary, O.M.; Akman, F.; Kumar, N.; Bousiakou, L.G.; Kazachenko, A.S.; Ionin, V.A.; et al. Comprehensive Study of the Ammonium Sulfamate–Urea Binary System. Molecules 2023, 28, 470. https://doi.org/10.3390/molecules28020470
Kazachenko AS, Issaoui N, Fetisova OY, Berezhnaya YD, Al-Dossary OM, Akman F, Kumar N, Bousiakou LG, Kazachenko AS, Ionin VA, et al. Comprehensive Study of the Ammonium Sulfamate–Urea Binary System. Molecules. 2023; 28(2):470. https://doi.org/10.3390/molecules28020470
Chicago/Turabian StyleKazachenko, Aleksandr S., Noureddine Issaoui, Olga Yu. Fetisova, Yaroslava D. Berezhnaya, Omar M. Al-Dossary, Feride Akman, Naveen Kumar, Leda G. Bousiakou, Anna S. Kazachenko, Vladislav A. Ionin, and et al. 2023. "Comprehensive Study of the Ammonium Sulfamate–Urea Binary System" Molecules 28, no. 2: 470. https://doi.org/10.3390/molecules28020470