
Basic Chemical Composition, Antioxidant Activity and Selected Polyphenolic Compounds Profile in Garlic Leaves and Bulbs Collected at Various Stages of Development

Abstract
:1. Introduction
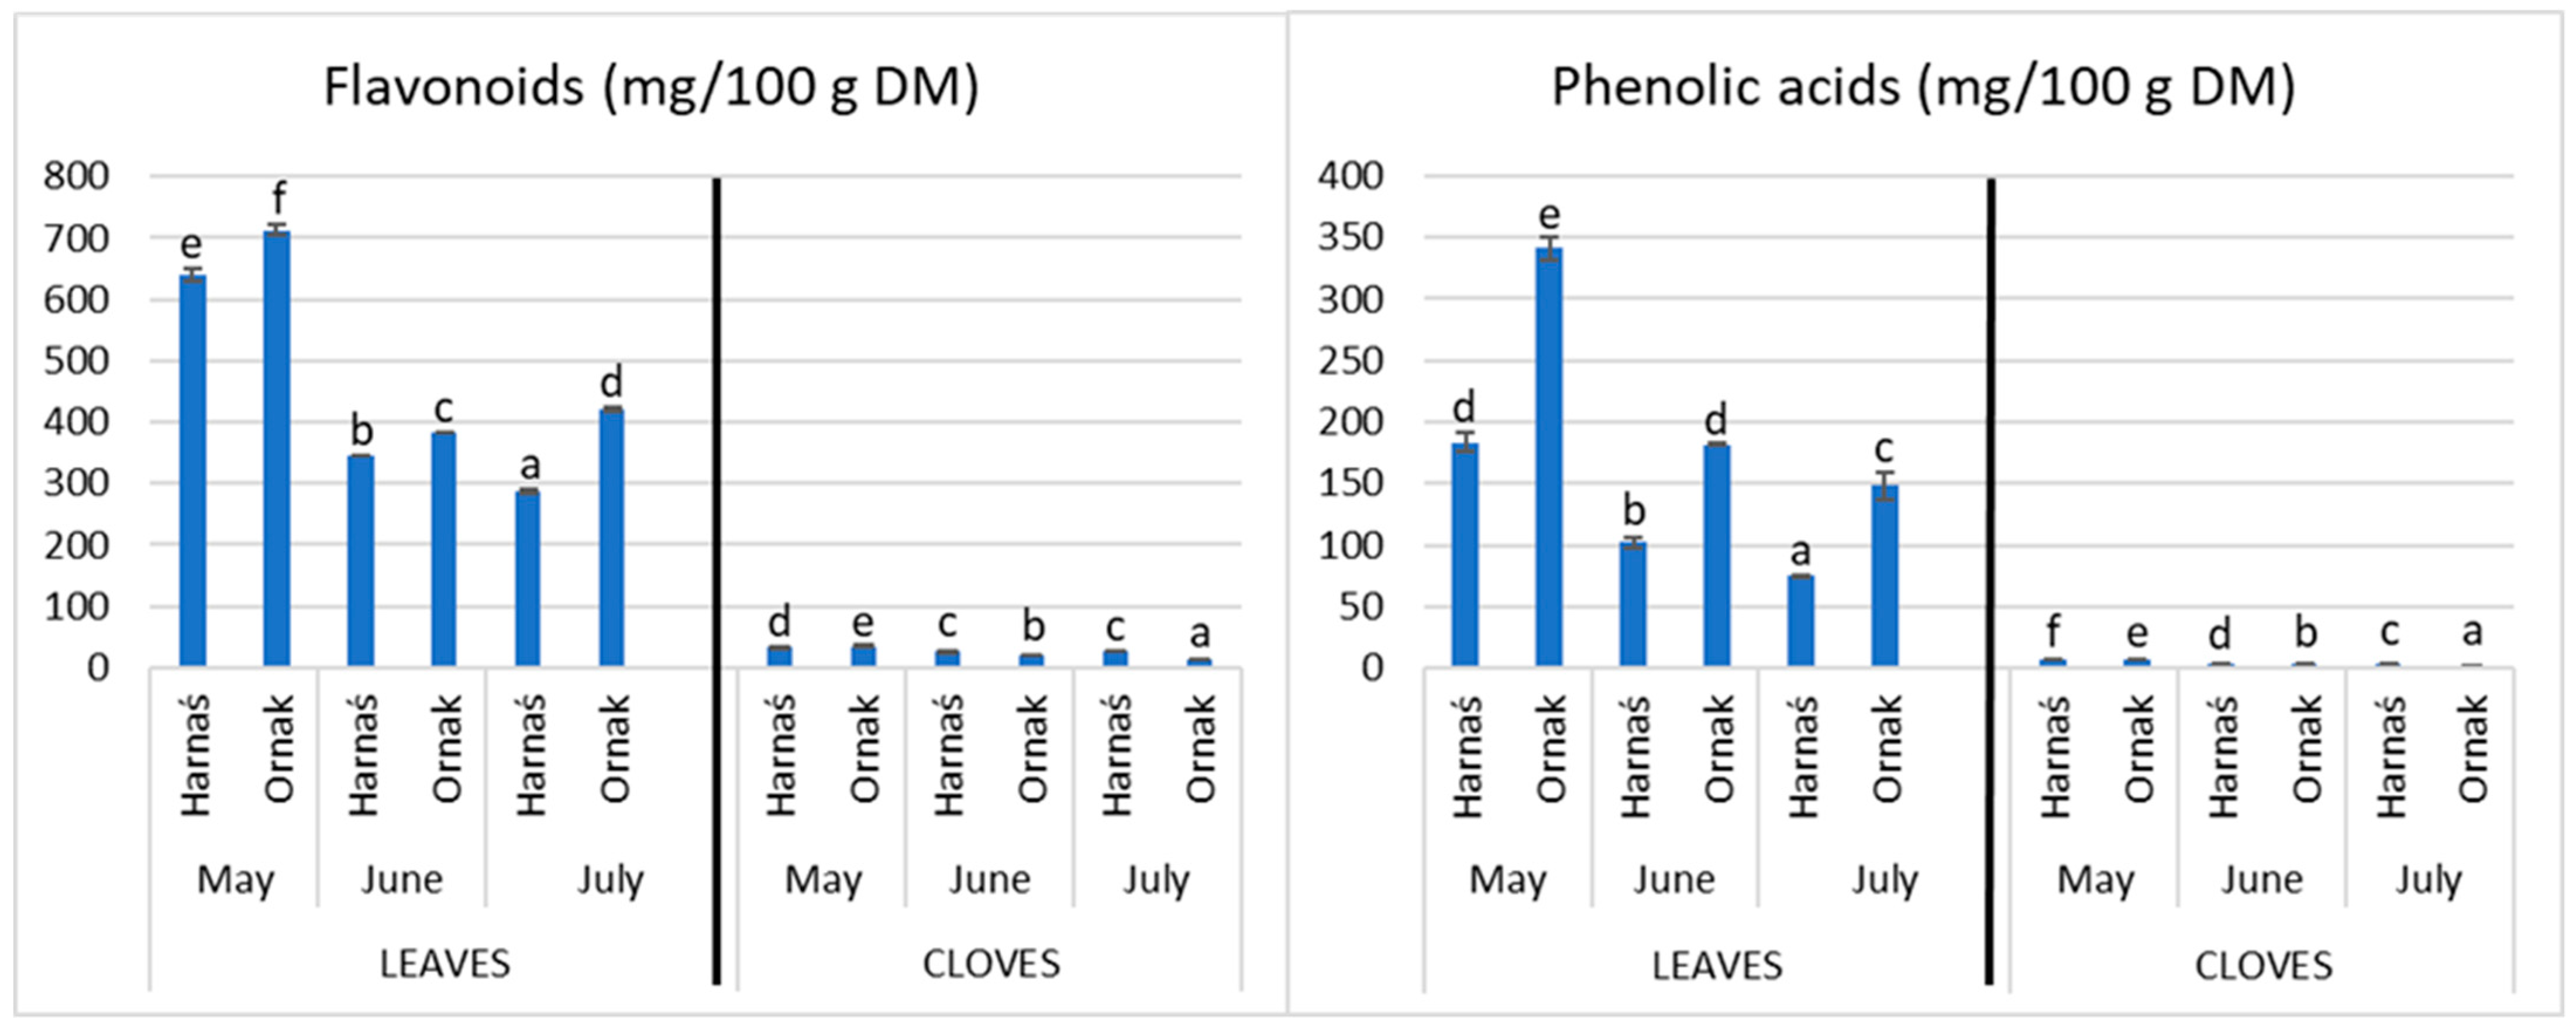
2. Results
3. Discussion
4. Materials and Methods
4.1. Plant Material
4.2. Proximate Analysis of Plant Material
4.3. Vitamin C, Total Phenolic Compounds Content and Antioxidant Activity
4.4. HPLC Analysis of Plant Material
4.5. Statistical Analysis
5. Conclusions
Author Contributions
Funding
Institutional Review Board Statement
Informed Consent Statement
Data Availability Statement
Conflicts of Interest
Sample Availability
References
- Cardelle-Cobas, A.; Soria, A.C.; Corzo, N.; Villamiel, M. A Comprehensive Survey of Garlic Functionality. In Garlic Consumption and Health; Pacurar, M., Krejci, G., Eds.; Nova Science Publishers, Inc.: Hauppauge, NY, USA, 2010; pp. 1–60. [Google Scholar] [CrossRef]
- Arzanlou, M.; Bohlooli, S. Introducing of green garlic plant as a new source of allicin. Food Chem. 2010, 120, 179–183. [Google Scholar] [CrossRef]
- Dyduch, J.; Najda, A. Yielding and quality of garlic leaves. Part I. Yield and its structure. EJPAU 2010, 13, 19. [Google Scholar]
- González, R.E.; Sance, M.M.; Soto, V.C.; Galmarini, C.R. Garlic scape, an alternative food with human health benefits. In VI International Symposium on Edible Alliaceae; Acta Horticulturae: Fukuoka, Japan, 2012; pp. 233–237. [Google Scholar] [CrossRef]
- Oosthuizen, C.B.; Reid, A.M.; Lall, N. Chapter 9––Garlic (Allium sativum) and its associated molecules, as medicine. In Medicinal Plants for Holistic Health and Well-Being; Academic Press: London, UK, 2018; pp. 277–295. [Google Scholar]
- Tavares, L.; Santos, L.; Pelayo, C.; Noreña, Z. Bioactive compounds of garlic: A comprehensive review of encapsulation technologies, characterization of the encapsulated garlic compounds and their industrial applicability. Trends Food Sci. Technol. 2021, 114, 232–244. [Google Scholar] [CrossRef]
- Przygoda, B.; Kunachowicz, H.; Nadolna, I.; Iwanow, K. Nutritional Value of Selected Foods and Typical Dishes, VII ed.; PZWL Wydawnictwo Lekarskie: Warsaw, Poland, 2020; ISBN 978-83-200-5586-3. [Google Scholar]
- Ciuba, M.; Dziadek, K.; Kukiełka, E.; Oczkowicz, J.; Piątkowska, E.; Leszczyńska, T.; Kopeć, A. Comparing basic chemical composition and content of bioactive components in selected cultivars of garlic. Zywn-Nauk. Technol. Jakość 2016, 5, 107–115. (In Polish) [Google Scholar]
- Ayaz, E.; Alpsoy, H.C. Garlic (Allium sativum) and traditional medicine. Turk. Parazitolojii Dergisi. 2007, 31, 145–149. [Google Scholar]
- Martins, N.; Petropoulos, S.; Ferreira, I.C. Chemical composition and bioactive compounds of garlic (Allium sativum L.) as affected by pre- and post-harvest conditions. Food Chem. 2016, 211, 41–50. [Google Scholar] [CrossRef] [PubMed]
- Jędrszczyk, E.; Kopeć, A.; Bucki, P.; Ambroszczyk, A.M.; Skowera, B. The enhancing effect of plants growth biostimulants in garlic cultivation on the chemical composition and level of bioactive compounds in the garlic leaves, stems and bulbs. Not. Bot. Horti Agrobot. 2019, 47, 81–91. [Google Scholar] [CrossRef]
- Piątkowska, E.; Kopeć, A.; Leszczyńska, T. Basic Chemical Composition, Content Of Micro and Macroelements And Antioxidant Activity Of Different Varieties Of Garlic’s Leaves Polish Origin. Zywn-Nauk. Technol. Jakość 2015, 1, 181–192. [Google Scholar] [CrossRef]
- Kuttan, G. Immunomodulatory effect of some naturally occurring sulphur-containing compounds. J. Ethnopharmacol. 2000, 72, 93–99. [Google Scholar] [CrossRef]
- Ruhee, R.T.; Roberts, L.A.; Ma, S.; Suzuki, K. Organosulfur Compounds: A Review of Their Anti-inflammatory Effects in Human Health. Front. Nutr. 2020, 7, 64. [Google Scholar] [CrossRef]
- Bastaki, S.M.A.; Ojha, S.; Kalasz, H.; Adeghate, E. Chemical constituents and medicinal properties of Allium species. Mol. Cell Biochem. 2021, 476, 4301–4321. [Google Scholar] [CrossRef] [PubMed]
- Sobenin, I.A.; Myasoedov, V.A.; Iltchuk, M.I.; Zhang, D.W.; Orekhovbe, A.N. Therapeutic effects of garlic in cardiovascular atherosclerotic disease. Chin. J. Nat. Med. 2019, 17, 721–728. [Google Scholar] [CrossRef]
- Gao, X.; Xue, Z.; Ma, Q.; Guo, Q.; Xing, L.; Kumar Santhanam, R.; Zhang, M.; Chen, H. Antioxidant and antihypertensive effects of garlic protein and its hydrolysates and the related mechanism. J. Food Biochem. 2019, 44, 13126. [Google Scholar] [CrossRef] [PubMed]
- Ansary, J.; Forbes-Hernández, T.Y.; Gil, E.; Cianciosi, D.; Zhang, J.; Elexpuru-Zabaleta, M.; Simal-Gandara, J.; Giampieri, F.; Battino, M. Potential Health Benefit of Garlic Based on Human Intervention Studies: A Brief Overview. Antioxidants 2020, 9, 619. [Google Scholar] [CrossRef]
- Donma, M.M.; Donma, O. The effects of allium sativum on immunity within the scope of COVID-19 infection. Med. Hypotheses 2020, 144, 109934. [Google Scholar] [CrossRef]
- Torres, K.A.M.; Lima, S.M.R.R.; Torres, L.M.B.; Gamberini, M.T.; Silva Junior, P.I.D. Garlic: An Alternative Treatment for Group B Streptococcus. Microbiol. Spectr. 2021, 9, e0017021. [Google Scholar] [CrossRef] [PubMed]
- Padiya, R.; Khatua, T.N.; Bagul, P.K.; Kuncha, M.; Banerjee, S.K. Garlic improves insulin sensitivity and associated metabolic syndromes in fructose fed rats. Nutr. Metab. 2011, 8, 53. [Google Scholar] [CrossRef]
- Kaur, G.; Padiya, R.; Adela, R.; Putcha, U.K.; Reddy, G.S.; Reddy, B.R.; Kumar, K.P.; Chakravarty, S.; Banerjee, S.K. Garlic and Resveratrol Attenuate Diabetic Complications, Loss of β-Cells, Pancreatic and Hepatic Oxidative Stress in Streptozotocin-Induced Diabetic Rats. Front. Pharmacol. 2016, 7, 360. [Google Scholar] [CrossRef]
- Ashfaq, F.; Ali, Q.; Haider, M.A.; Hafeez, M.M.; Malik, A. Therapeutic activities of garlic constituent phytochemicals. Biol. Clin. Sci. Res. J. 2021, 2021, 7. [Google Scholar] [CrossRef]
- Cahayani, A.W.; Tanuwijaya, C.; Xiao Chi, L.; Mulyastuti, Y. Antibacterial activity of garlic (Allium sativum) extract and molecular docking studies of allicin. AIP Conf. Proc. 2019, 2108, 020045. [Google Scholar] [CrossRef]
- Hamal, S.; Cherukuri, L.; Birudaraju, D.; Matsumoto, S.; Kinninger, A.; Chaganti, B.T.; Flores, F.; Shaikh, K.; Roy, S.K.; Budoff, M.J. Short-term impact of aged garlic extract on endothelial function in diabetes: A randomized, double-blind, placebo-controlled trial. Exp. Ther. Med. 2020, 19, 1485–1489. [Google Scholar] [CrossRef]
- Ghyasi, R.; Mohaddes, G.; Naderi, R. Combination effect of voluntary exercise and garlic (Allium sativum) on oxidative stress, cholesterol level and histopathology of heart tissue in type 1 diabetic rats. J. Cardiovasc. Thorac. Res. 2019, 11, 61–67. [Google Scholar] [CrossRef] [PubMed]
- Oboh, G.; Ademiluyi, A.O.; Agunloye, O.M.; Ademosun, A.O.; Ogunsakin, B.G. Inhibitory Effect of Garlic, Purple Onion, and White Onion on Key Enzymes Linked with Type 2 Diabetes and Hypertension. J. Diet Suppl. 2019, 16, 105–118. [Google Scholar] [CrossRef] [PubMed]
- Zhang, Y.; Liua, X.; Ruan, J.; Zhuang, X.; Zhang, X.; Li, Z. Phytochemicals of garlic: Promising candidates for cancer therapy. Biomed. Pharmacother. 2020, 123, 109730. [Google Scholar] [CrossRef] [PubMed]
- Silva, L.A.; Oliveira, A.S.; Melo, F.L.; Ardisson-Araújo, D.M.P.; Resende, F.V.; Resende, R.O.; Ribeiro, B.M. A new virus found in garlic virus complex is a member of possible novel genus of the family Betaflexiviridae (order Tymovirales). PeerJ 2019, 7, e6285. [Google Scholar] [CrossRef]
- Rekowska, E.; Skupień, K. The influence of selected agronomic practices on the yield and chemical composition of winter garlic. Veg. Crops Res. Bull. 2009, 70, 173–182. [Google Scholar] [CrossRef]
- Kosiorek, A.; Oszmiański, J.; Golański, J. Rationale for the use of plant polyphenols as antiplatelet nutraceuticals. Post Fitoter. 2013, 2, 108–117. (In Polish) [Google Scholar]
- Haciseferoĝullari, H.; Őzcan, M.; Demir, F.; Calișir, S. Some nutritional and technological properties of garlic (Allium sativum L.). J. Food Eng. 2005, 68, 463–469. [Google Scholar] [CrossRef]
- Sajid, M.; Butt, M.S.; Shehzad, A.; Tanweer, S. Chemical and mineral analysis of garlic: A golden herb. Pak. J. Food Sci. 2014, 24, 108–110. [Google Scholar]
- Marciniec, K.; Włodarczyk-Marciniec, B. Anticancer properties of garlic. Post. Fitoter 2008, 2, 90–95. (In Polish) [Google Scholar]
- Boonpeng, S.; Siripongvutikorn, S.; Sae-wong, C.; Sutthirak, P. The antioxidant and anti-cadmium toxicity properties of garlic extracts. Food Sci. Nutr. 2014, 2, 792–801. [Google Scholar] [CrossRef]
- Suleria, H.A.; Butt, M.S.; Khalid, N.; Sultan, S.; Raza, A.; Aleem, M.; Abbas, M. Garlic (Allium sativum): Diet based therapy of 21st century: A review. Asian Pac. J. Trop. Dis. 2015, 5, 271–278. [Google Scholar] [CrossRef]
- Yusuf, A.; Fagbuaro, S.S.; Fajemilehin, S.O.K. Chemical composition, phytochemical and mineral profile of garlic (Allium sativum). J. Biosci. Biotechnol. Discov. 2018, 3, 105–109. [Google Scholar] [CrossRef]
- Różańska, D.; Regulska-Ilow, B.; Ilow, R. Influence of selected culinary processes on the antioxidant capacity and polyphenol content in food. Probl. Hig. Epidemiol. 2014, 95, 215–222. (In Polish) [Google Scholar]
- Mnayer, D.; Fabiano-Tixier, A.; Petitcolas, E.; Hamieh, T.; Nehme, N.; Ferrant, C.; Fernandez, X.; Chemat, F. Chemical composition, antibacterial and antioxidant activities of six essentials oils from the Alliaceae family. Molecules 2014, 19, 20034–20053. [Google Scholar] [CrossRef] [PubMed]
- Leelarungrayub, N.; Rattanapanone, V.; Chanarat, N.; Gebicki, J.M. Quantitative evaluation of the antioxidant properties of garlic and shallot preparations. Nutrition 2006, 22, 266–274. [Google Scholar] [CrossRef]
- Queiroz, Y.S.; Ishimoto, E.Y.; Bastos, D.H.M.; Sampaio, G.R.; Torres, E.A.F.S. Garlic (Allium sativum L.) and ready-to-eat garlic products: In vitro antioxidant activity. Food Chem. 2009, 115, 371–374. [Google Scholar] [CrossRef]
- Kim, J.; Pälijärvi, M.; Karonen, M.; Salminen, J.P. Distribution of enzymatic and alkaline oxidative activities of phenolic compounds in plants. Phytochemistry 2020, 179, 112501. [Google Scholar] [CrossRef]
- Kim, J.S.; Kang, O.J.; Gweon, O.C. Comparison of phenolic acids and flavonoids in black garlic at different thermal processing steps. J. Funct. Foods 2013, 5, 80–86. [Google Scholar] [CrossRef]
- Miean, K.H.; Mohamed, S. Flavonoid (myricetin, quercetin, kaempferol, luteolin, and apigenin) content of edible tropical plants. J. Agric. Food Chem. 2001, 49, 3106–3112. [Google Scholar] [CrossRef]
- Gorinstein, S.; Leontowicz, H.; Leontowicz, M.; Namiesnik, J.; Najman, K.; Drzewiecki, J.; Cvikrova, M.; Martincova, O.; Katrich, E.; Trakhtenberg, S. Comparison of the main bioactive compounds and antioxidant activities in garlic and white and red bulbs after treatment protocols. J. Agric. Food Chem. 2008, 56, 4418–4426. [Google Scholar] [CrossRef]
- Strugała, P.; Gabrielska, J. Biological activity and stability in vitro of polyphenolic extracts as potential dietary supplements. Postepy. Hig. Med. Dosw. 2014, 68, 1028–1035. (In Polish) [Google Scholar] [CrossRef]
- Callemien, D.; Collin, S. Structure, organoleptic properties, quantification methods, and stability of phenolic compounds in beer—A Review. Food Rev. Int. 2009, 26, 1–84. [Google Scholar] [CrossRef]
- Palma, M.; Piñeiro, Z.; Barroso, C.G. Stability of phenolic compounds during extraction with superheated solvents. J. Chromatog. A 2001, 2, 169–174. [Google Scholar] [CrossRef]
- Ghareaghajlou, N.; Hallaj-Nezhadi, S.; Ghasempour, Z. Red cabbage anthocyanins: Stability, extraction, biological activities and applications in food systems. Food Chem. 2021, 365, 130482. [Google Scholar] [CrossRef]
- Patras, A.; Brunton, N.P.; O’Donnell, C.; Tiwari, B.K. Effect of thermal processing on anthocyanin stability in foods; mechanisms and kinetics of degradation. Trends Food Sci. Technol. 2010, 21, 3–11. [Google Scholar] [CrossRef]
- Nenadis, N.; Wang, L.F.; Tsimidou, M.; Zhang, H.Y. Estimation of scavenging activity of phenolic compounds using the ABTS(*+) assay. J. Agric. Food Chem. 2004, 52, 4669–4674. [Google Scholar] [CrossRef] [PubMed]
- Al-Qudah, M.A.; Migdadi, R.S.; Mayyas, A.S.; Al-Zereini, W.A.; Al-Dalahmeh, Y.; Abu Orabi, F.M.; Bataineh, T.T.; Abu-Orabi, S.T. Chemical Composition, Cytotoxicity and Antioxidant Activity of the Essential Oil from Flower Buds and Leaves of the Pulicariaincisa (Lam.) DC and Pulicaria crispa (Forskel) Oliver. J. Essent. Oil Bear. Plants 2022, 25, 758–772. [Google Scholar] [CrossRef]
- Arnao, M.B. Some methodological problems in the determination of antioxidant activity using chromogen radicals: A practical case. Trends Food Sci. Technol. 2000, 11, 419–421. [Google Scholar] [CrossRef]
- AOAC International. AOAC International: Official Methods of Analysis, 17th ed.; AOAC International: Gaithesburg, MD, USA, 2006. [Google Scholar]
- Metzger, L.E.; Nielsen, S.S. Nutrition labeling in food analysis. In Food Analysis, 5th ed.; Nielsen, S.S., Ed.; Springer: Cham, Switzerland, 2017; pp. 35–43. [Google Scholar]
- Rutkowska, U. (Ed.) Selected Methods in Measuremnts of Chemical Composition and Nutritional Value of Food Products; Wydawnictwo PZWL: Warszawa, Poland, 1981. (In Polish) [Google Scholar]
- Swain, P.; Hillis, W.E. The phenolic constituents of Prunus domestica (L.). The quantity of analisys of phenolic constituents. J. Sci. Food Agric. 1959, 10, 63–68. [Google Scholar] [CrossRef]
- Re, R.; Pellegrini, N.; Proteggente, A.; Pannala, A.; Yang, M.; Rice-Evans, C. Antioxidant activity applying an improved ABTS radical cation decolorization assay. Free Radic. Biol. Med. 1999, 26, 1231–1237. [Google Scholar] [CrossRef] [PubMed]
- Pekkarinen, S.S.; Stockmann, H.; Schwarz, K.; Heinonen, I.M.; Hopia, A.I. Antoxidant activity and partitioning of phenolic acids in bulk and emulsifed methyl linoleate. J. Agric. Food Chem. 1999, 8, 3036–3043. [Google Scholar] [CrossRef] [PubMed]
- Benzie, I.F.F.; Strain, J.J. The Ferric Reducing Ability of Plasma (FRAP) as a Measure of “Antioxidant Power”: The FRAP Assay. Anal. Biochem. 1996, 239, 70–76. [Google Scholar] [CrossRef] [PubMed]
- Dziadek, K.; Kopeć, A.; Tabaszewska, M. Potential of sweet cherry (Prunus avium L.) by-products: Bioactive compounds and antioxidant activity of leaves and petioles. Eur. Food Res. Technol. 2019, 245, 763–772. [Google Scholar] [CrossRef]
- Wallock-Richards, D.; Doherty, C.J.; Doherty, L.; Clarke, D.J.; Place, M.; Govan, J.R.W.; Campopano, D.J. Garlic revisited: Antimicrobial activity of allicin-containing garlic extracts against Burkholderia cepacia complex. PLoS ONE 2014, 9, e112726. [Google Scholar] [CrossRef] [PubMed]
- Sadowska, U.; Jewiarz, K.; Kopak, M.; Dziadek, K.; Francik, R.; Kopeć, A. Proximate analysis and antioxidant properties and of young plants of Sinapis alba L. depend on the time of harvest and variety. Appl. Sci. 2023, 13, 7980. [Google Scholar] [CrossRef]
- Jolliffe, I.T. Principal Component Analysis; Springer: New York, NY, USA, 2002. [Google Scholar]
- Catell, R.B. The Scree Test for the Number of Factors. Multivar. Behav. Res. 1996, 1, 245–276. [Google Scholar] [CrossRef]


| Cultivar and Time of Harvest # | Dry matter ** | Proteins *** | Crude Fat *** | Ash *** | Total Carbohydrates *** |
|---|---|---|---|---|---|
| HL * May | 13.65 ± 0.45 a | 19.86 ± 0.13 c | 2.45 ± 0.13 d | 8.30 ± 0.10 de | 69.38 ± 0.20 a |
| HC * May | 18.50 ± 0.74 a | 12.33 ± 0.35 abc | 1.23 ± 0.02 c | 5.18 ± 0.08 bcd | 81.26 ± 0.37 cd |
| OL * May | 14.23 ± 1.10 a | 15.21 ± 0.10 c | 2.43 ± 0.28 d | 9.18 ± 0.22 d | 73.17 ± 0.43 ab |
| OC * May | 16.81 ± 0.52 a | 14.03 ± 0.31 abc | 0.83 ± 0.03 abc | 5.08 ± 0.06 bcd | 80.06 ± 0.32 cd |
| HL * June | 14.44 ± 0.53 a | 14.38 ± 0.14 bc | 2.14 ± 0.25 d | 7.17 ± 0.13 bcde | 76.31 ± 0.14 bc |
| HC * June | 23.98 ± 1.23 b | 10.45 ± 0.15 a | 0.65 ± 0.21 abc | 4.21 ± 0.15 abc | 84.69 ± 0.36 d |
| OL * June | 15.34 ± 0.33 a | 13.29 ± 0.12 abc | 1.26 ± 0.13 c | 7.31 ± 0.28 cde | 78.13 ± 0.19 bc |
| OC * June | 25.08 ± 0.93 b | 10.74 ± 0.13 ab | 0.52 ± 0.05 ab | 3.70 ± 0.10 ab | 85.04 ± 0.13 d |
| HL * July | 12.77 ± 0.50 a | 13.79 ± 0.21 abc | 1.16 ± 0.12 bc | 9.46 ± 0.15 d | 75.59 ± 0.30 bc |
| HC * July | 34.84 ± 0.85 c | 10.19 ± 0.13 a | 0.29 ± 0.03 a | 3.13 ± 0.10 a | 86.39 ± 0.16 d |
| OL * July | 15.39 ± 0.30 a | 10.82 ± 0.13 ab | 1.06 ± 0.03 bc | 10.26 ± 0.16 d | 77.85 ± 0.15 bc |
| OC * July | 34.80 ± 0.80 c | 10.68 ± 0.27 ab | 0.32 ± 0.04 a | 2.38 ± 0.06 a | 86.61 ± 0.29 d |
| L average ## | 14.30 ± 0.53 A | 14.56 ± 0.14 B | 1.75 ± 0.16 B | 8.60 ± 0.17 B | 75.07 ± 0.24 A |
| C average ### | 26.30 ± 0.84 B | 11.40 ± 0.22 A | 0.64 ± 0.06 A | 3.39 ± 0.09 A | 84.01 ± 0.27 B |
| Cultivar and Time of Harvest # | Vitamin C | Total Polyphenols | ABTS | DPPH | FRAP |
|---|---|---|---|---|---|
| HL * May | 736.14 ± 25.51 c | 1344.73 ± 41.61 bc | 170.78 ± 5.74 cd | 31.26 ± 0.93 bc | 101.40 ± 3.05 c |
| HC * May | 239.38 ± 11.11 ab | 373.08 ± 8.52 a | 35.74 ± 1.73 a | 6.46 ± 0.23 a | 23.30 ± 0.24 a |
| OL * May | 732.55 ± 59.72 c | 1581.87 ± 103.09 c | 204.44 ± 14.09 d | 38.3 ± 1.99 c | 115.09 ± 7.53 c |
| OC * May | 216.09 ± 12.47 ab | 385.77 ± 7.45 a | 39.42 ± 1.65 a | 6.67 ± 0.11 a | 20.99 ± 0.70 a |
| HL * June | 426.71 ± 1.14 b | 1513.50 ± 37.93 c | 123.05 ± 2.20 b | 22.44 ± 0.43 b | 72.15 ± 1.80 b |
| HC * June | 95.29 ± 3.82 a | 419.24 ± 13.58 a | 43.75 ± 1.60 a | 4.53 ± 0.15 a | 16.98 ± 0.74 a |
| OL * June | 402.61 ± 8.04 b | 1095.63 ± 13.53 b | 129.07 ± 2.96 bc | 23.95 ± 0.39 b | 70.54 ± 0.68 b |
| OC * June | 95.29 ± 2.30 a | 303.54 ± 16.84 a | 22.58 ± 0.96 a | 3.36 ± 0.06 a | 9.29 ± 0.21 a |
| HL * July | 434.18 ± 23.72 b | 1345.12 ± 50.43 bc | 150.95 ± 5.77 bc | 26.89 ± 1.08 b | 75.37 ± 2.31 b |
| HC * July | 31.40 ± 3.65 a | 251.28 ± 1.87 a | 27.97 ± 0.40 a | 4.02 ± 0.04 a | 10.41 ± 0.15 a |
| OL * July | 201.38 ± 9.10 ab | 1401.95 ± 22.04 bc | 141.84 ± 2.13 bc | 28.77 ± 0.19 bc | 78.13 ± 0.81 b |
| OC * July | 23.60 ± 4.22 a | 197.89 ± 4.45 a | 19.86 ± 0.36 a | 3.07 ± 0.02 a | 7.59 ± 0.10 a |
| L average ## | 488.93 ± 2.20 B | 156.07 ± 44.70 B | 153.35 ± 4.74 B | 28.60 ± 0.83 B | 85.45 ± 2.70 B |
| C average ### | 116.84 ± 6.26 A | 321.8 ± 8.78 A | 31.55 ± 11 A | 4.68 ± 0.10 A | 14.76 ± 0.35 A |
| Cultivar and Time of Harvest # | Catechin | Epicatechnin | Naringin | Hesperidin | Myricetin | Quercetin | Luteolin | Kaempferol | Apigenin | Rutin |
|---|---|---|---|---|---|---|---|---|---|---|
| HL* May | 491.2 ± 9.81 a | 94.26 ± 3.72 e | 7.36 ± 0.15 a | 9.94 ± 0.09 ab | 10.12 ± 0.06 bcd | 2.60 ± 0.00 cde | 2.04 ± 0.01 a | 1.97 ± 0.73 abcd | 2.42 ± 0.03 a | 17.42 ± 3.77 a |
| HC * May | 2.71 ± 0.19 a | 10.35 ± 0.60 a | 4.61 ± 0.17 a | 0.33 ± 0.22 a | 10.94 ± 0.05 bd | ND | 0.90 ± 0.02 abc | 1.56 ± 0.62 abcd | 1.98 ± 0.00 ab | |
| OL * May | 578.06 ± 4.51 c | 88.94 ± 2.92 de | 7.93 ± 0.20 ab | 7.01 ± 0.13 a | 10.53 ± 0.12 bd | 0.60 ± 0.00 abc | 0.93 ± 0.00 abc | 0.79 ± 0.71 ab | 2.43 ± 0.01 a | 6.49 ± 0.02 a |
| OC * May | 2.78 ± 0.39 b | 5.78 ± 0.01 a | 7.04 ± 0.01 a | 0.22 ± 0.00 a | 13.95 ± 0.08 d | ND | 1.00 ± 0.02 abc | 2.39 ± 0.01 cd | 2.32 ± 0.01 a | ND |
| HL * June | 204.22 ± 0.93 a | 82.97 ± 0.58 cde | 14.94 ± 0.10 b | 10.03 ± 0.02 ab | 9.30 ± 0.04 bd | 4.54 ± 0.02 de | 1.87 ± 0.01 bc | 2.35 ± 0.00 cd | 2.02 ± 0.00 a | 13.90 ± 0.95 a |
| HC * June | 2.37 ± 0.19 a | 8.06 ± 0.04 a | 2.55 ± 0.09 a | 0.83 ± 0.00 a | 8.68 ± 0.00 bcd | 0.41 ± 0.00 ab | 0.42 ± 0.01 a | 1.34 ± 0.01 abcd | 1.31 ± 0.01 abc | ND |
| OL * June | 285.62 ± 2.13 b | 54.28 ± 0.53 b | 9.33 ± 0.04 b | 5.88 ± 0.06 a | 8.14 ± 0.16 bc | 3.98 ± 0.02 de | 0.94 ± 0.01 abc | 1.40 ± 0.00 abcd | 1.95 ± 0.00 ab | 10.63 ± 1.07 a |
| OC * June | 1.58 ± 0.01 a | 5.59 ± 0.04 a | 3.06 ± 0.01 a | ND | 8.31 ± 0.03 bc | ND | ND | 0.88 ± 0.00 abc | 1.24 ± 0.00 abc | ND |
| HL * July | 72.50 ± 1.20 a | 49.08 ± 0.91 b | 22.17 ± 0.13 c | 47.28 ± 0.06 c | 9.68 ± 0.31 bd | 6.28 ± 0.06 e | 4.67 ± 0.07 d | 2.66 ± 0.01 d | 3.88 ± 0.03 d | 68.78 ± 0.53 c |
| HC * July | 4.01 ± 0.02 a | 10.02 ± 0.01 b | 3.76 ± 0.02 a | 0.77 ± 0.01 a | 4.79 ± 0.02 ab | 0.33 ± 0.00 ab | 0.66 ± 0.01 ac | 1.19 ± 0.00 abcd | 1.11 ± 0.00 bc | 0.33 ± 0.02 a |
| OL *July | 274.20 ± 1.12 b | 59.38 ± 0.34 bcd | 8.22 ± 0.14 a | 21.19 ± 2.70 b | 9.15 ± 0.05 bcd | 2.21 ± 0.03 bcd | 2.15 ± 0.03 b | 1.95 ± 0.15 bcd | 1.79 ± 0.03 abc | 41.12 ± 0.15 d |
| OC * July | 2.02 ± 0.01 a | 3.72 ± 0.01 a | 2.23 ± 0.01 a | ND | 3.08 ± 0.00 a | ND | 0.21 ± 0.00 a | 0.28 ± 0.00 ad | 0.75 ± 0.30 c | ND |
| L average ## | 317 ± 22 B | 7.3 ± 2.0 A | 11.6 ± 2.4 B | 16.1 ± 1.5 B | 9.5 ± 3.3 A | 3.4 ± 1.3 B | 2.1 ± 1.5 B | 1.85 ± 1.2 B | 2.41 ± 1.1 B | 24.1 ± 11.8 B |
| C average ### | 2.6 ± 0.3 A | 71.5 ± 3.9 B | 3.9 ± 0.8 A | 0.35 ± 0.08 A | 8.3 ± 5.6 A | 0.13 ± 0.09 A | 0.53 ± 0.2 A | 1.27 ± 1.1 A | 1.45 ± 0.8 A | 3.02 ± 1.2 A |
| Cultivar and Time of Harvest # | Chlorogenic Acid | 4-Hydroxybenzoic Acid | Coffee Acid | Vanillic Acid | p-coumaric Acid | Ferulic Acid | Sinapic Acid |
|---|---|---|---|---|---|---|---|
| HL * May | 52.55 ± 0.07 cd | 44.21 ± 0.25 d | 2.52 ± 0.09 cd | 3.38 ± 0.19 b | 5.45 ± 2.38 b | 13.85 ± 0.08 d | 15.14 ± 0.34 b |
| HC * May | 1.35 ± 0.00 a | 1.34 ± 0.03 a | 0.87 ± 0.00 abc | 0.13 ± 0.00 a | 0.59 ± 0.00 a | 1.00 ± 0.00 a | 0.54 ± 0.00 a |
| OL * May | 106.87 ± 0.32 d | 91.48 ± 0.09 e | 3.67 ± 0.02 d | 6.48 ± 0.07 c | 10.60 ± 0.14 c | 12.56 ± 0.27 c | 23.39 ± 0.15 c |
| OC * May | 1.32 ± 0.01 a | 1.36 ± 0.01 a | 1.07 ± 0.01 abc | 0.11 ± 0.00 a | 1.20 ± 0.00 ab | 1.16 ± 0.01 a | 0.12 ± 0.00 a |
| HL * June | 29.05 ± 0.25 abc | 21.66 ± 4.99 abc | 1.80 ± 0.00 abc | 2.26 ± 0.04 b | 3.63 ± 0.05 ab | 6.66 ± 0.07 c | 16.98 ± 0.09 bc |
| HC * June | 0.69 ± 0.00 a | 0.76 ± 0.00 a | 0.46 ± 0.00 ab | 0.31 ± 0.00 a | 1.08 ± 0.00 ab | 0.62 ± 0.00 a | 0.41 ± 0.00 a |
| OL * June | 63.29 ± 0.01 jd | 40.79 ± 0.15 cd | 1.48 ± 0.01 abc | 3.25 ± 0.07 b | 4.83 ± 0.00 ab | 4.37 ± 0.06 bc | 15.58 ± 0.14 b |
| OC * June | 1.00 ± 0.01 a | 0.45 ± 0.00 a | 0.33 ± 0.00 ab | ND | 0.32 ± 0.00 a | 0.19 ± 0.00 a | 0.25 ± 0.00 a |
| HL * July | 13.33 ± 0.14 ab | 12.55 ± 0.10 ab | 2.23 ± 0.04 cd | 3.06 ± 0.26 b | 3.36 ± 0.04 a | 3.10 ± 0.14 ab | 13.96 ± 0.08 b |
| HC *July | 0.47 ± 0.00 a | 0.46 ± 0.01 ab | 0.45 ± 0.00 ab | 0.14 ± 0.00 a | 2.28 ± 0.00 ab | 0.42 ± 0.00 ca | 0.48 ± 0.00 a |
| OL * July | 32.49 ± 0.17 bc | 33.08 ± 1.60 bcd | 2.02 ± 0.00 a | 3.40 ± 0.04 ab | 2.95 ± 0.00 ab | 4.18 ± 0.00 bc | 20.23 ± 0.08 bc |
| OC * July | 0.21 ± 0.00 a | 0.35 ± 0.00 a | 0.16 ± 0.00 a | 0.32 ± 0.00 a | 0.37 ± 0.00 a | 0.25 ± 0.00 a | 0.10 ± 0.00 a |
| L average ## | 49.6 ± 42 B | 40.6 ± 37.7 B | 0.55 ± 0.4 A | 3.64 ± 2.26 B | 4.85 ± 2.21 B | 7.45 ± 4.6 B | 17.55 ± 8.3 B |
| C average ## | 0.85 ± 0.52 A | 0.78 ± 0.51 A | 2.28 ± 1.77 B | 0.17 ± 0.01 A | 1.22 ± 0.8 A | 0.60 ± 0.33 A | 0.132 ± 0.01 A |
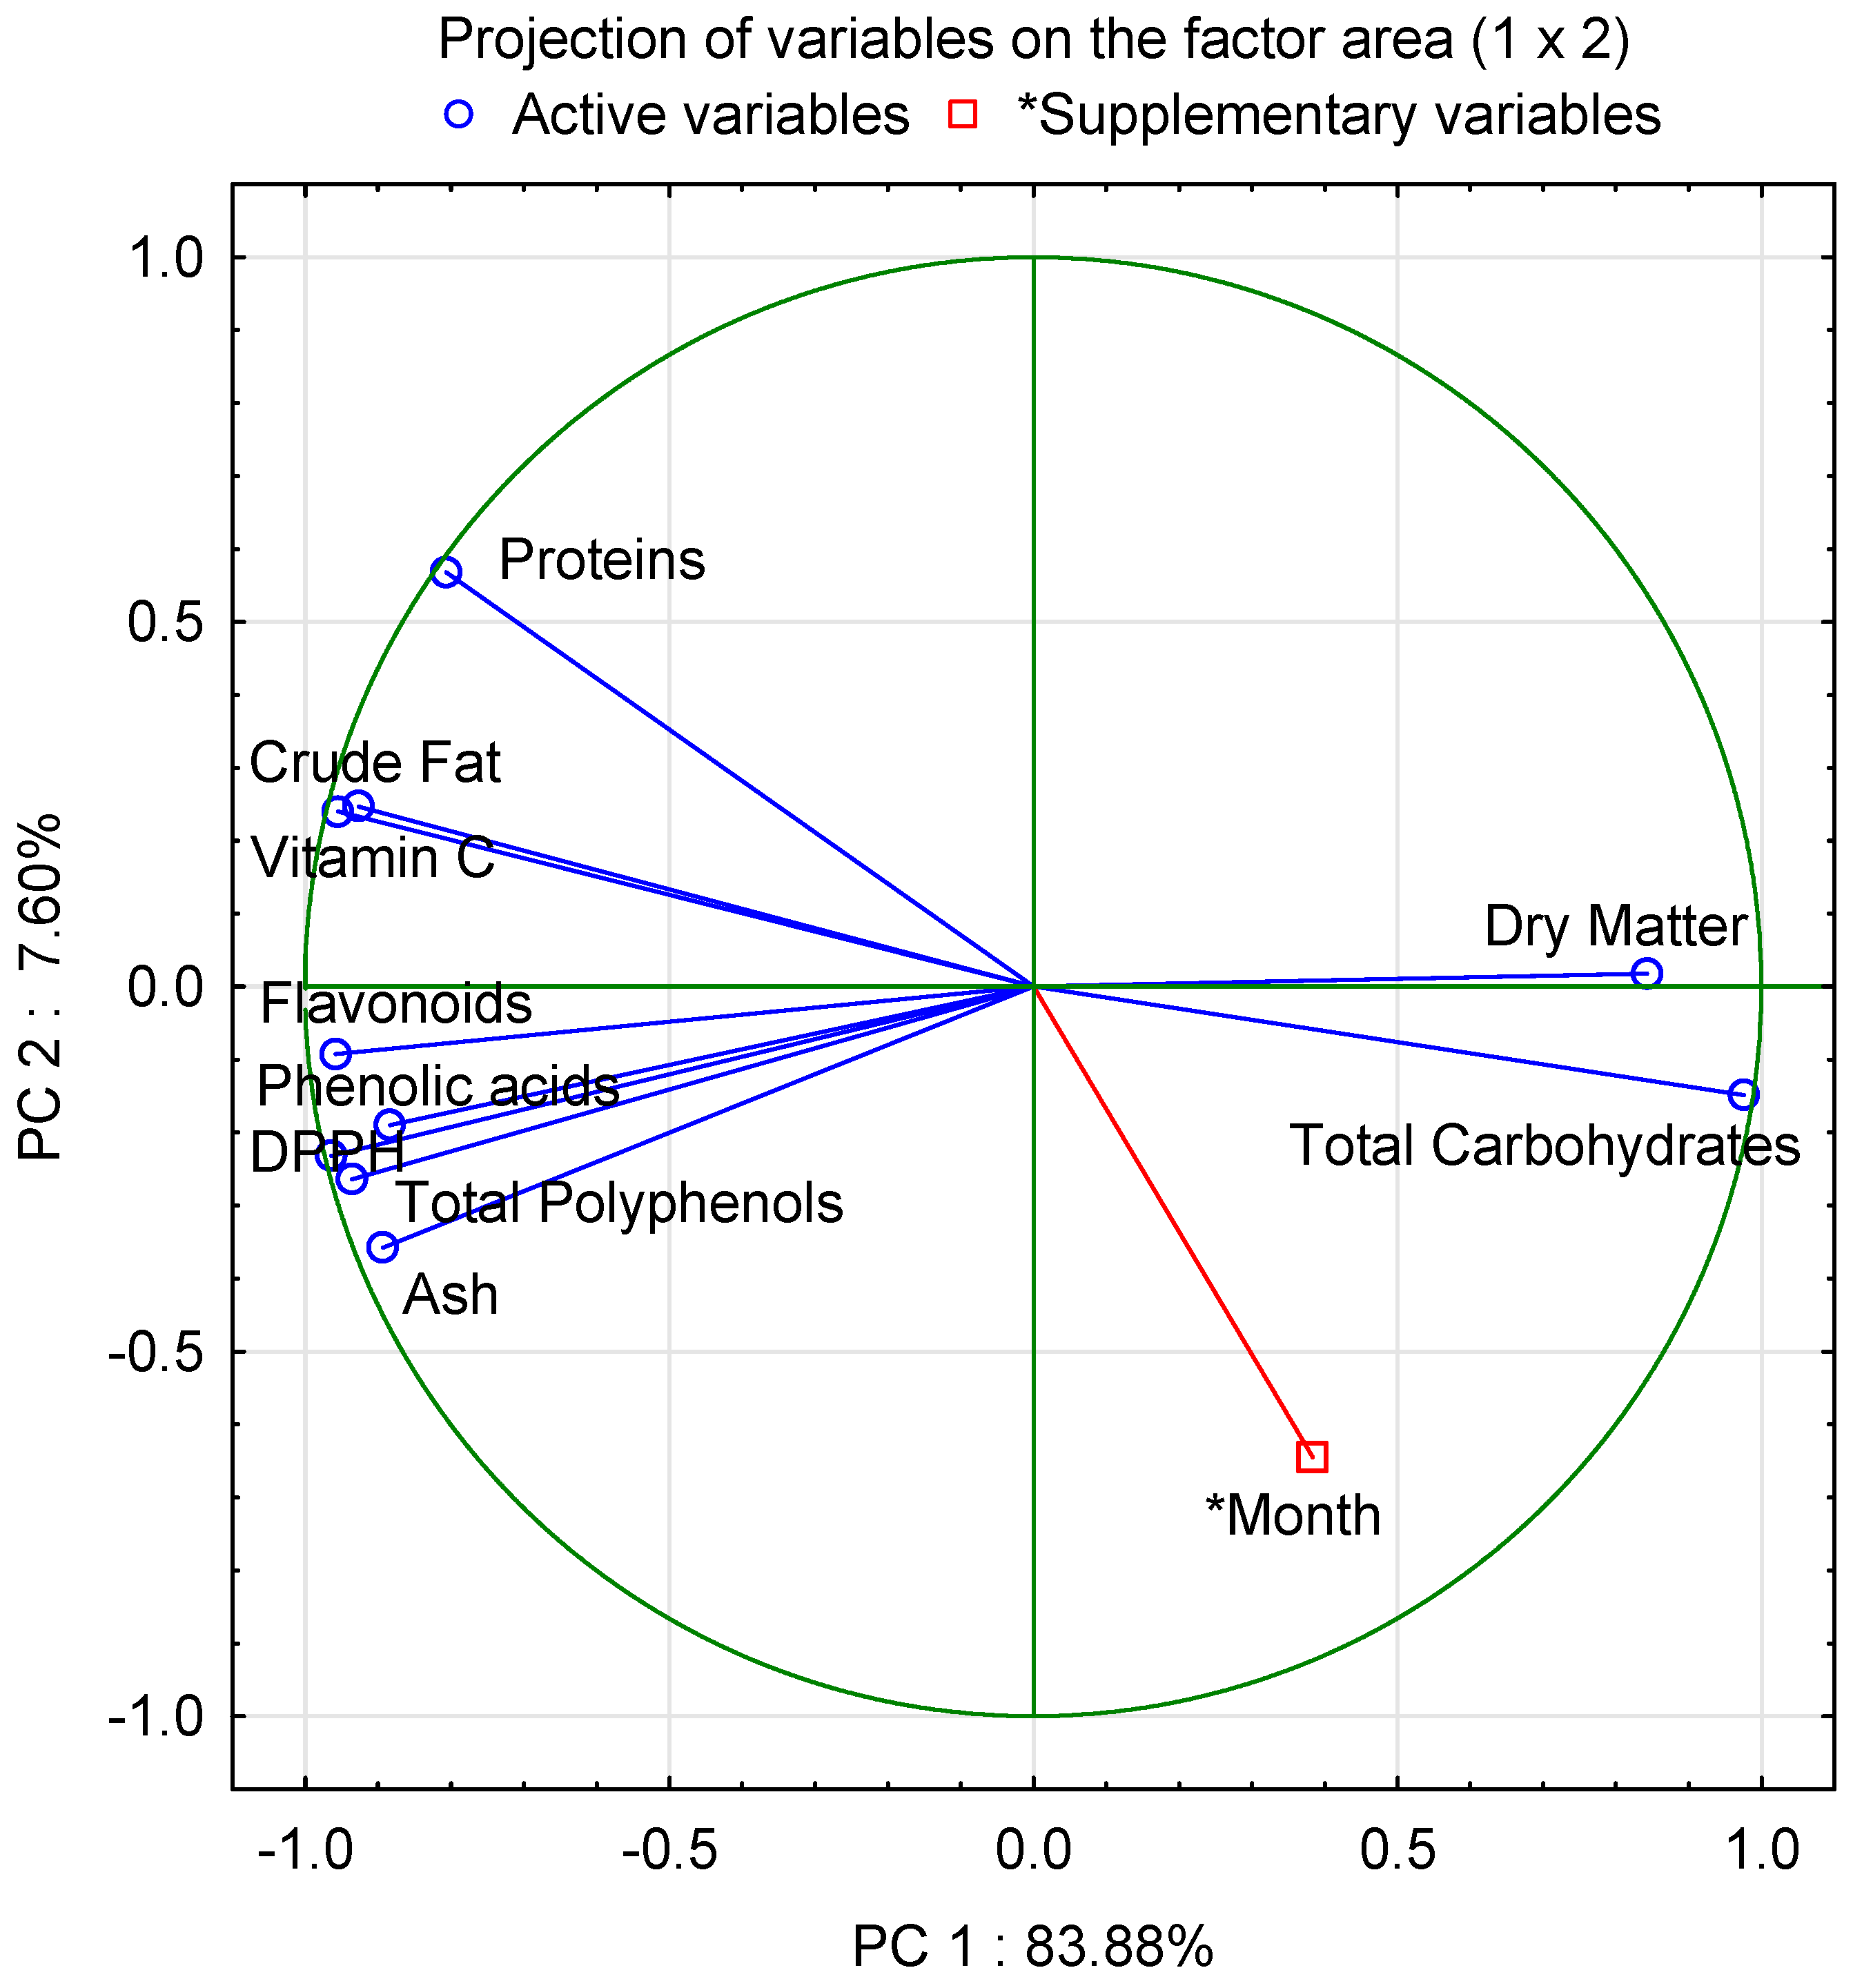
| Principal Component (PC) | PC 1 | PC 2 |
|---|---|---|
| Eigenvalue | 8.39 | 0.76 |
| % variance | 83.88 | 7.60 |
| % cumulative variance | 83.88 | 91.48 |
| Variables | PC 1 | PC 2 |
|---|---|---|
| Dry Matter | 0.84 | 0.02 |
| Proteins | −0.81 | 0.6 |
| Crude Fat | −0.93 | 0.25 |
| Ash | −0.89 | −0.36 |
| Total Carbohydrates | 0.98 | −0.15 |
| Vitamin C | −0.96 | 0.24 |
| Total Polyphenols | −0.94 | −0.26 |
| DPPH | −0.96 | −0.23 |
| Flavonoids | −0.96 | −0.09 |
| Phenolic acids | −0.88 | −0.19 |
| * Month | 0.38 | −0.64 |
Disclaimer/Publisher’s Note: The statements, opinions and data contained in all publications are solely those of the individual author(s) and contributor(s) and not of MDPI and/or the editor(s). MDPI and/or the editor(s) disclaim responsibility for any injury to people or property resulting from any ideas, methods, instructions or products referred to in the content. |
© 2023 by the authors. Licensee MDPI, Basel, Switzerland. This article is an open access article distributed under the terms and conditions of the Creative Commons Attribution (CC BY) license (https://creativecommons.org/licenses/by/4.0/).
Share and Cite
Skoczylas, J.; Jędrszczyk, E.; Dziadek, K.; Dacewicz, E.; Kopeć, A. Basic Chemical Composition, Antioxidant Activity and Selected Polyphenolic Compounds Profile in Garlic Leaves and Bulbs Collected at Various Stages of Development. Molecules 2023, 28, 6653. https://doi.org/10.3390/molecules28186653
Skoczylas J, Jędrszczyk E, Dziadek K, Dacewicz E, Kopeć A. Basic Chemical Composition, Antioxidant Activity and Selected Polyphenolic Compounds Profile in Garlic Leaves and Bulbs Collected at Various Stages of Development. Molecules. 2023; 28(18):6653. https://doi.org/10.3390/molecules28186653
Chicago/Turabian StyleSkoczylas, Joanna, Elżbieta Jędrszczyk, Kinga Dziadek, Ewa Dacewicz, and Aneta Kopeć. 2023. "Basic Chemical Composition, Antioxidant Activity and Selected Polyphenolic Compounds Profile in Garlic Leaves and Bulbs Collected at Various Stages of Development" Molecules 28, no. 18: 6653. https://doi.org/10.3390/molecules28186653