Article

Determination of Flavonoid Compounds in Shanxi Aged Vinegars Based on Hydrophobic Deep Eutectic Solvent VALLME-HPLC Method: Assessment of the Environmental Impact of the Developed Method

1
School of Life Science, Shanxi University, Taiyuan 030006, China
2
Shanxi Key Laboratory for Research and Development of Regional Plants, Shanxi University, Taiyuan 030006, China
3
Key Laboratory of Chemical Biology and Molecular Engineering of Ministry of Education, Institute of Biotechnology, Shanxi University, Taiyuan 030006, China
*
Authors to whom correspondence should be addressed.
Molecules 2023, 28(14), 5619; https://doi.org/10.3390/molecules28145619
Submission received: 27 June 2023 / Revised: 12 July 2023 / Accepted: 14 July 2023 / Published: 24 July 2023
(This article belongs to the Special Issue Advanced Research on Natural Deep Eutectic Solvents)

Abstract

:
This research presents a novel, eco-friendly, vortex-assisted liquid–liquid microextraction (VALLME) approach, integrating hydrophobic deep eutectic solvents (DESs) with HPLC for the identification and quantification of nine specific flavonoids in Shanxi aged vinegar (SAV). The parameters of DES-VALLME, including the ratio of trioctylmethylammonium chloride to 1,4-butanediol (1:6), DES volume (150 μL), vortex duration (5 min), the concentration of NaCl (0.40 g), and centrifugation time (10 min), were optimized to achieve the maximum extraction efficiency of target substances. Under these optimal conditions, quantitative analyses performed via HPLC demonstrated a broad linear range of 0.20–50.00 μg/mL and correlation coefficients (r2) greater than 0.9944 for all nine calibration curves. The limits of detection (LOD) and limits of quantitation (LOQ) were 0.09–0.18 μg/mL and 0.30–0.60 μg/mL, respectively, ensuring high sensitivity. The relative standard deviations for intra-day and inter-day variability were within the acceptable range, 2.34–3.77% and 3.04–4.96%, respectively, demonstrating the method’s reliability. The recovery rates ranged from 85.97% to 108.11%, underscoring the method’s precision. This technique exhibited a significant enrichment effect (enrichment factor: 43 to 296) on SAV flavonoids. Notably, the eco-friendliness of this procedure was evaluated using the Analytical Eco-Scale, Green Analytical Procedure Index, and Analytical Greenness Metric. The results suggested that this technique is a viable green alternative to traditional flavonoid determination methods in SAV. In summary, this novel method provides a theoretical basis for assessing flavonoid content in SAV samples and tracing SAV products. This contribution has significant implications for enhancing analytical techniques in food chemistry and environmental science and the sustainable development of the food industry.

1. Introduction

Vinegar, a ubiquitous acidic condiment, is cherished globally for its ability to impart a unique tartness to foods [1]. In China, the main raw materials for vinegar production include sorghum, millet, glutinous rice and other grains. Prominent among these are Shanxi aged vinegar (SAV), Zhenjiang aromatic vinegar (ZAV), Sichuan bran vinegar (SBV) and Fujian Monascus vinegar (FMV). Among these, SAV holds a special place as one of the four traditional fermented vinegars in China. It is renowned for its nutritional richness, including amino acids, organic acids, sugars, vitamins, ligustrazine, total flavonoids and a myriad of volatile flavor substances [2]. Recent medical research has highlighted the high antioxidant properties of flavonoids, a group of bioactive ingredients found in relatively high concentrations in SAV [3]. In addition to their antioxidant properties, flavonoids exhibit a broad spectrum of health-promoting effects, such as antimicrobial activity [4], immune system enhancement [5], anticancer properties [6] and cholesterol-lowering effects [7]. Despite their crucial role in health and nutrition, most studies on flavonoids in SAV have primarily been limited to determining total flavonoids [8]. However, the comprehensive quantitative analysis of flavonoids with high content in SAV has not been extensively explored.
At present, a variety of methods are utilized to identify flavonoids, including ultraviolet-visible (UV-Vis) spectrophotometry [9], thin layer chromatography (TLC) [10], nuclear magnetic resonance spectroscopy (NMR) [11] and high performance liquid chromatography (HPLC). However, these procedures are often hampered by the complex matrices involved, making the direct quantification of flavonoids in actual samples a time-intensive process [12]. Therefore, it is necessary to prepare samples before instrumental analysis [13]. Conventional sample preparation methods encompass solvent extraction [14], microwave-assisted extraction [15], ultrasonic-assisted extraction [16,17], supercritical extraction [18,19] and the resin method [20]. Traditional solvent extraction, though effective, involves the extensive use of organic solvents during extraction, leading to notable environmental concerns. From the perspective of green analytical chemistry (GAC), it is crucial to minimize the utilization of organic solvents to reduce their environmental footprint. In recent years, the vortex-assisted liquid–liquid microextraction (VALLME) method has gained increased attention from researchers due to its numerous advantages, including reduced extraction time, lower solvent consumption and energy efficiency [21]. As a result, this method has found broad applications in analytical chemistry research. Nonetheless, selecting appropriate dispersion and extraction solvents remains a significant challenge. Conventional liquid–liquid extraction methods often use relatively toxic organic solvents, such as chloroform, carbon tetrachloride and chlorobenzene [22]. These solvents pose potential threats to both human health and the environment.
Deep eutectic solvents (DESs) have recently gained substantial interest as an eco-friendly substitute for traditional organic solvents. These solvents are synthesized via the interaction of organic compounds and ionic compounds via hydrogen bonds [23]. They are characterized by their environmentally friendliness, biodegradability, low vapor pressure, high conductivity and stable chemical properties [24]. In recent years, the expanding field of material science has further broadened the application prospects of DESs. Indeed, they have become a focal point of analytical chemistry research. For instance, Funda et al. [25] developed a novel DES-LLME method by employing choline chloride as a hydrogen bond acceptor and phenol as a hydrogen bond donor. They successfully used this method, in conjunction with a UV-Vis spectrophotometer to analyze and determine the target analytes, to separate and preconcentrate curcumin in food and herbal tea samples. Zhu et al. [26] proposed a novel technique for determining quantities of eight synthetic pigments in beverage samples by utilizing hydrophobic DES as microextraction solvent in LLME coupled with HPLC.
In this work, a novel approach was devised for the extraction of flavonoids from SAV by employing hydrophobic deep eutectic solvents in combination with vortex-assisted liquid–liquid microextraction and high-performance liquid chromatography (DES-VALLME-HPLC). Not only were the key parameters influencing the extraction efficiency thoroughly examined, but the method also demonstrated the capability to rapidly and efficiently analyze the contents of nine flavonoids across 40 SAV samples. Additionally, the “greenness” or eco-friendliness of the DES-VALLME-HPLC method was assessed using three specific evaluation tools: the Analytical Eco-Scale, Green Analytical Procedure Index and Analytical Greenness Metric. This comprehensive evaluation underscores our commitment to developing greener methodologies in analytical chemistry in line with the broader scientific community’s increasing focus on sustainable practices.

2. Results and Discussion

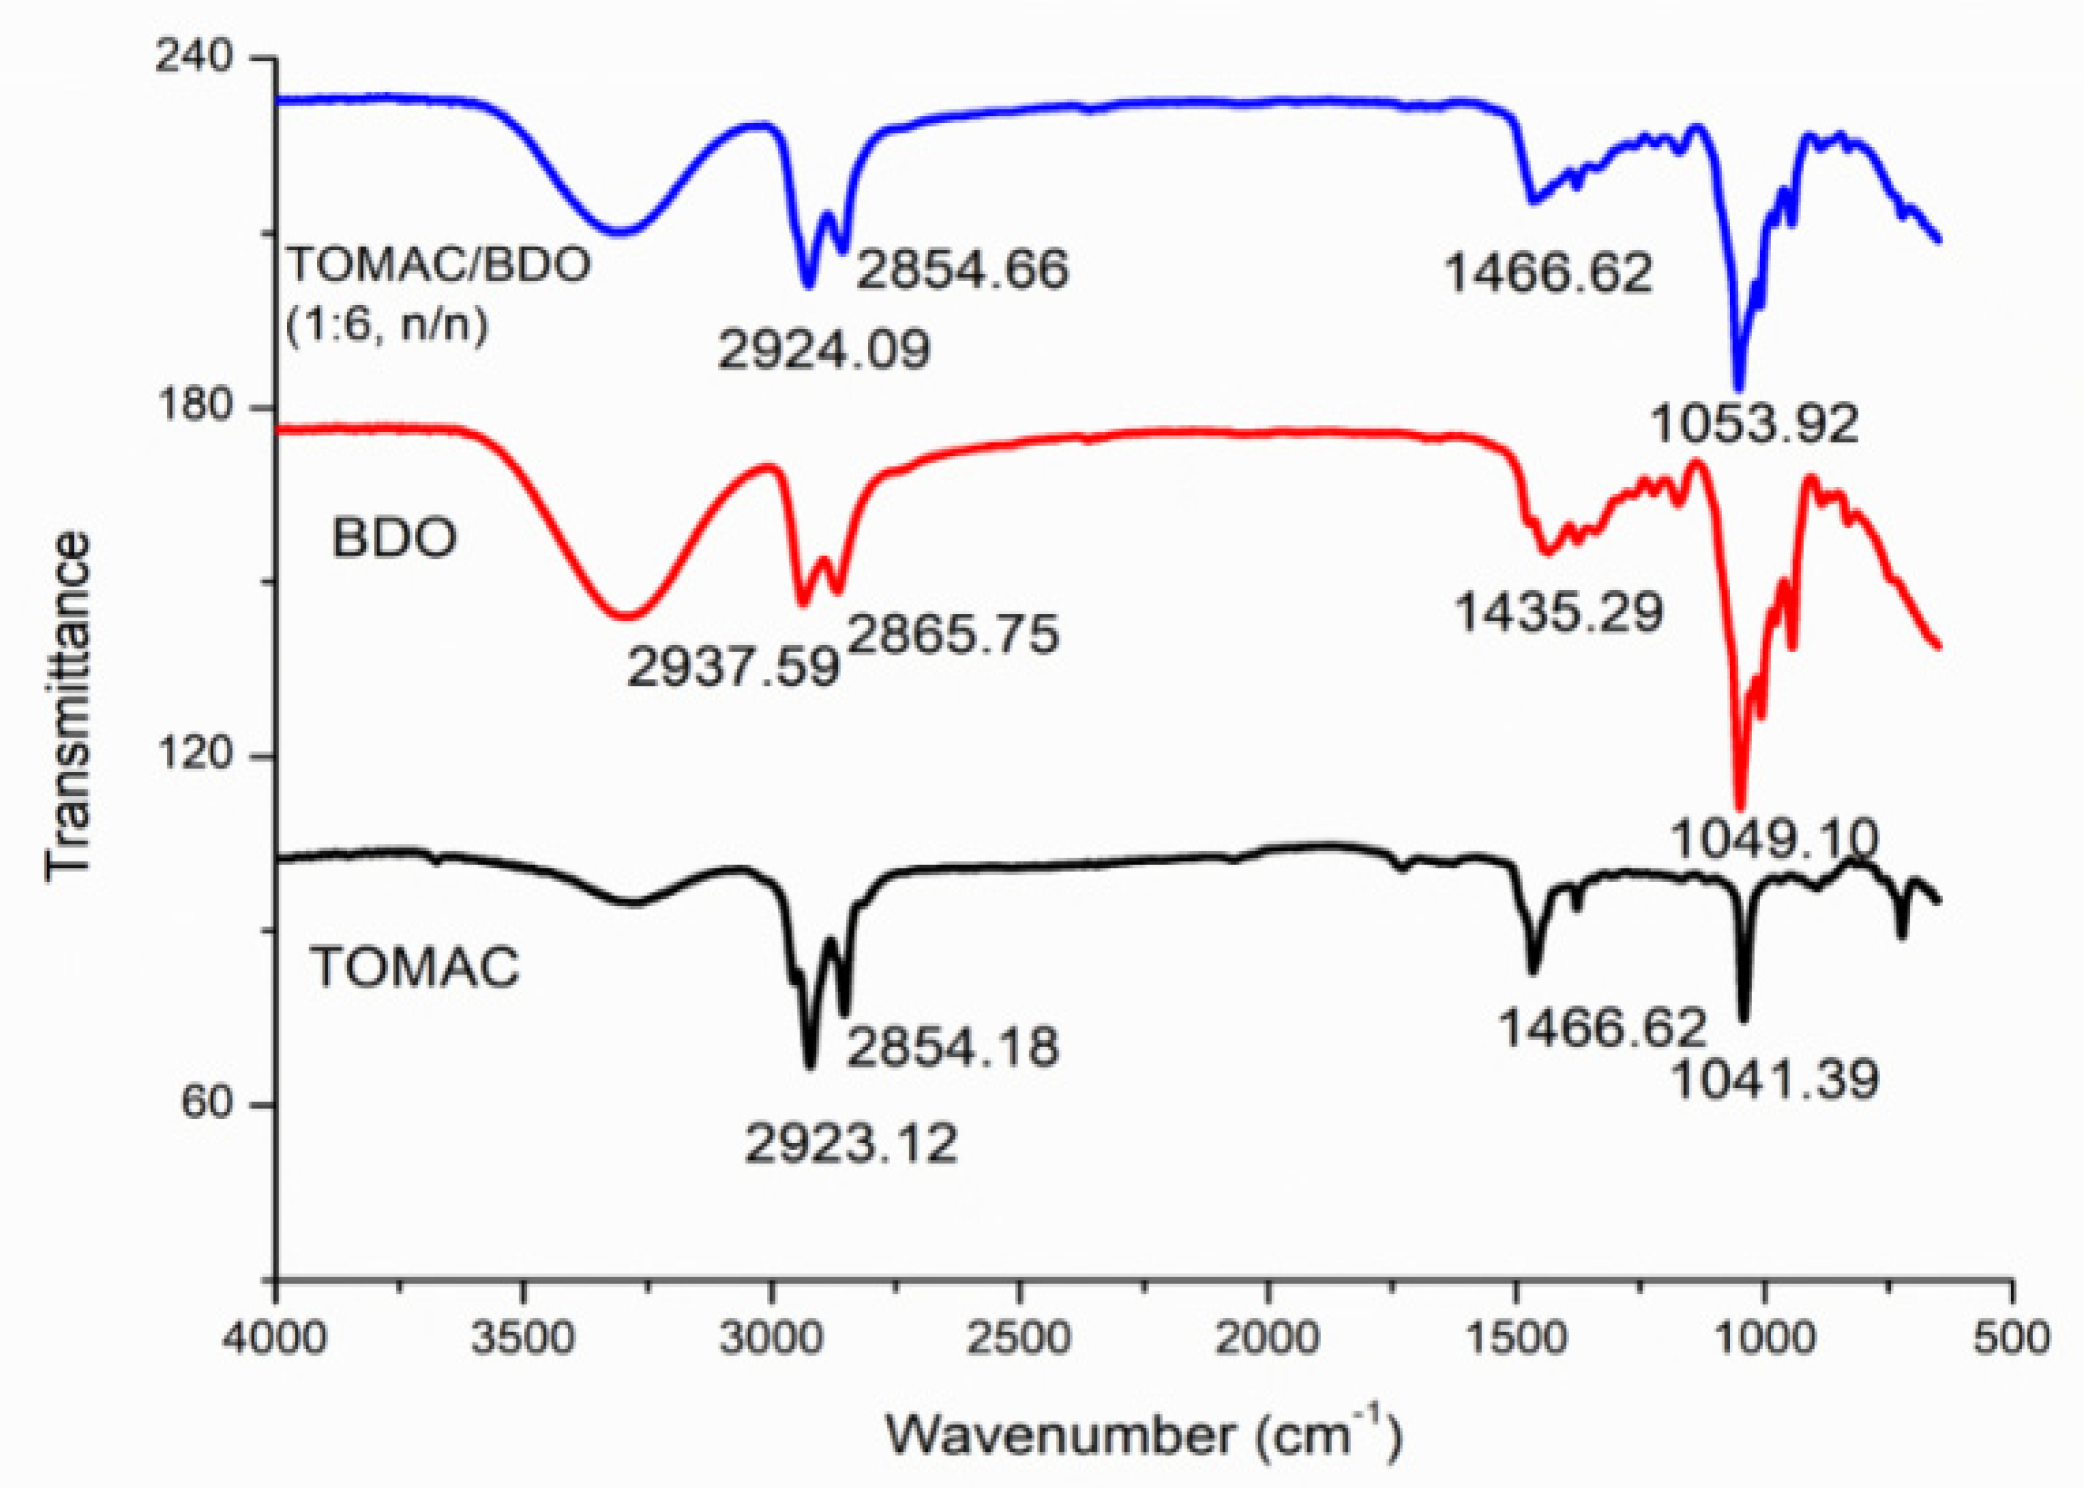
2.1. Characterization

The Fourier transform infrared (FT−IR) spectra of trioctylmethylammonium chloride, 1,4-butanediol and DES5 are shown in Figure 1. The C-H stretching vibrations observed within the range of 2845–3007 cm−1 are attributable to an alkane found between the methyl and methylene groups [27]. The -CH2 in trioctylmethylammonium chloride peaked at 1466.62 cm−1 with a pronounced and sharp peak. However, the corresponding peak in DES5 exhibited a broader shape and diminished intensity at the same wavenumber, indicating a significant transformation. Moreover, C-OH absorption in 1,4-butanediol was prominently visible at 1049.10 cm−1, exhibiting a sharp peak with pronounced intensity. However, in the DES5 spectrum, the C-OH peak was recorded at a slightly higher wavenumber, 1053.92 cm−1, suggesting a redshift of the C-OH peak. This shift could be attributed to changes in the force constant prompted by a reduction in electron cloud density. This modification, in turn, reduces the stretching vibration frequency and substantially shifts the absorption peak of the proton donor towards a lower position [28]. The FT−IR data collectively validated the successful formation of hydrogen bonds in DES.

2.2. Optimization of the Extraction Procedure

2.2.1. Effect of the Types of DES

In this study, we examined five distinct types of deep eutectic solvents (DESs) (Figure 2a). Among these, the tricaprylylmethylammonium chloride served as the HBA. At the same time, n-caprylic acid, ethylene glycol, 2,3-butanediol, 1,3-butanediol and 1,4-butanediol performed the role of HBD. Our findings indicated that DES5 extracted the highest peak areas for catechin protocatechin, rutin, hyperoside, naringin, naringenin, kaempferol and hesperetin. This likely occurred because of the fact that DES5 has the lowest viscosity and is more highly permeable to the pores in the matrix [29]. Based on these results, DES5 was selected as an extraction solvent for the subsequent procedures due to its superior extraction performance.

2.2.2. Effect of the Molar Ratio of HBA and HBD

The extraction efficiency of the target compounds is significantly influenced by the molar ratio of the DES. Observations indicated that as the molar ratio of 1,4-butanediol increases from 1:1 to 1:6, the peak areas of the target compounds progressively increase. The peak areas reached their maximum value when the molar ratio was 1:6. Upon further increasing the molar ratio, the peak areas started to decline (Figure 2b). The phenomenon can be postulated to occur due to the enhanced dispersibility of DESs in water with the addition of 1,4-butanediol, thus enhancing the peak area [30]. Besides that, the molar ratio of DES influences the viscosity of DESs, which, in turn, affects the mass transfer rate [31]. During this experiment, it was noted that tricaprylylmethylammonium chloride exhibited greater viscosity compared to 1,4-butanediol. Consequently, as the proportion of 1,4-butanediol increased, the DES’s viscosity gradually diminished, presumably boosting the extraction effect of the DES [32]. In summary, the molar ratio of tricaprylylmethylammonium chloride and 1,4-butanediol was determined to be 1:6.

2.2.3. Effect of the Volume of the DES

As shown in Figure 2c, the peak area of the target compounds increased when the volume of DES5 increased from 100 μL to 150 μL. This surge can likely be attributed to the previous inadequacy of the target compound’s extraction due to the limited volume of DES5 [22]. Upon the DES5 reaching a volume of 150 μL, the peak areas reached their maximum, suggesting that an equilibrium between the volume of DES5 and the extraction effect had been achieved [33]. Conversely, when the volume of DES5 exceeded 150 μL, a decline in the peak areas was observed. This reduction may have resulted from the excessive volume of the extractant, causing a decrease in the enrichment effect [34]. Therefore, considering both the extraction efficacy and the economic implications, a volume of 150 μL was selected as the optimal volume for DES5.

2.2.4. Effect of Vortex Time

Figure 2d illustrates a notable trend in the peak areas of the targets, which initially increased and then decreased as the vortex time varied from 2 min to 7 min. A positive correlation was observed between the peak areas and vortex duration when the former was between 2 and 5 min. This likely occurred because an extended extraction period facilitates a higher yield of analytes into the extractant [35]. However, when the vortex time was extended from 5 to 7 min, the peak area negatively correlated with the vortex duration. The likely explanation is that excessively long extraction times may lead to a loss of extractant, thereby reducing extraction efficiency [36]. In light of these observations, we selected a vortex duration of 5 min for further investigation.

2.2.5. Effect of the Addition Amount of NaCl

The amount of NaCl added is another parameter that influences the extraction efficiency of the analyte. The salting-out effect can reduce the solubility of the target in the sample solution, facilitating the isolation of target molecules [37]. As shown in Figure 2e, the peak area gradually increased when the NaCl content was increased from 0.15 g to 0.40 g. This is because the ion concentration in the sample solution increased, decreasing the solubility of the target substance and promoting its transfer to the extractant solution [38]. However, when the NaCl content further increased from 0.40 to 0.45 g, the peak areas of the target compounds decreased. This may be due to the fact that when the solution reaches saturation at a NaCl content of 0.40 g, continued addition of salt increases the viscosity and density of the solution, which hinders the transfer of the target from the aqueous matrix to the extraction solvent [35]. Therefore, the optimal amount of NaCl was determined to be 0.40 g.

2.2.6. Effect of Centrifugation Time

The selection of centrifugation time also plays a crucial role in the extraction process by eliminating emulsification via high-speed centrifugal separation, effectively separating the organic phase from the aqueous phase [39]. In this study, we examined five levels of centrifugation time (5 min, 10 min, 15 min, 20 min and 25 min). Our results showed that increasing the centrifugation time from 5 to 10 min slightly increased extraction efficiency. However, further increases in centrifugation time beyond 10 min did not result in significant changes in extraction efficiency (Figure 2f). Based on these findings, we set the optimal centrifugation time at 10 min.

2.3. Analysis of Box-Behnken Design Results

Response surface design was constructed based on the above single factor test using Design-Expert 8.0.6. This experiment focused on exploring four key factors: the volume of the DES (A), vortex time (B), addition amount of NaCl (C) and centrifugation time (D). Each factor was assigned three levels, designated as high level (1), middle level (0) and low level (−1). The levels of every factor were shown in Table 1.
After analyzing 29 groups of experiments, the fitted quadratic multiple regression equations were as follows,
Y1 = 569.38 + 54.35A − 12.06B − 5.43C − 12.09D − 9.38AB + 13.30AC + 4.37AD − 53.47BC − 4.58BD + 1.13CD − 170.26A2 − 57.22B2 − 45.04C2 − 77.40D2;
Y2 = 537.88 + 40.94A − 8.85B − 19.39C − 16.69 − 6.63AB + 22.23AC + 8.97AD − 24.74BC − 3.45BD + 16.10CD − 167.31A2 − 51.62B2 − 10.97C2 − 63.84D2;
Y3 = 810.80 + 72.26A − 20.95 − 20.50C − 18.99D − 29.50AB + 32.90AC + 2.34AD − 30.88BC + 0.31BD + 27.71CD − 263.43A2 − 54.80B2 − 8.11C2 − 46.48D2;
Y4 = 1116.56 + 105.48A − 66.74B − 49.18C + 0.27D + 4.60AB − 25.30AC + 14.90AD − 85.87BC − 42.45BD + 8.24CD − 363.04A2 − 77.50B2 − 31.62C2 − 43.90D2;
Y5 = 1106.36 + 101.41A − 64.70B − 51.18C + 1.21D + 4.34AB − 23.23AC + 14.76AD − 87.09BC − 41.90BD + 8.33CD − 356.14A2 − 78.98B2 − 30.19C2 − 48.19D2;
Y6 = 1277.22 − 156.08A + 12.92B + 4.70C − 14.10D − 59.90AB + 1.15AC + 33.88AD − 60.85BC + 6.11BD − 70.02CD − 171.07A2 − 81.47B2 + 38.76C2 − 169.47D2;
Y7 = 2767.68 − 416.75A − 152.45B + 26.91C − 126.58D + 76.95AB + 13.76AC − 107.30AD − 169.24BC + 148.01BD + 333.61CD − 266.94A2 − 390.86B2 − 134.38C2 − 145.99D2;
Y8 = 2065.82 − 286.61A + 102.73B − 95.16C − 80.41D + 34.85AB−95.53AC + 375.59AD − 7.68BC − 59.54BD − 11.73CD − 428.40A2 − 458.51B2 − 390.12C2 − 41.32D2;
Y9 = 2567.10 − 363.00A + 92.03B + 422.19C + 18.26D + 29.18AB − 27.15AC + 91.23AD − 236.62BC − 36.95BD − 67.85CD − 550.05A2 − 281.97B2 − 461.11C2 − 1379.23D2.
In the above equations, Y1, Y2, Y3, Y4, Y5, Y6, Y7, Y8 and Y9 represented the peak areas of catechin, protocatechin, rutin, hyperside, naringin, hesperidin, naringenin, kaempferol and hesperetin. According to Table 2, the relative importance of the four factors varied among these nine flavonoids in descending order and was as follows: A > D > B > C, A > C > D > B, A > B > C > D, A > B > C > D, A > D > B > C, A > D > B > C, A > B > D > C, A > B > C > D and C > A > B > D.
Figure 3a–i depicts the response surface plots’ interplay between the volume of the DES (A) and the vortex time (B) on the peak areas of nine flavonoids. When the slope of the response surface was steep and the contour line was elliptical, a significant interaction between the two factors was suggested. On the other hand, a gentle slope with a contour line leaning towards a circular shape indicated a less significant interaction. The steep changing trend in Figure 3 indicated a significant interaction between the volume of the DES and vortex time.

2.4. Method Validation

The experimental analysis confirmed that the concentration range of each flavonoid, from 0.20–50.00 μg/mL, exhibited correlation coefficients between 0.9944–0.9990. This strong correlation suggests that the linear equation fits the data well. Then, an extensive set of tests were executed to validate this newly proposed method further, yielding interesting findings as elucidated below. The observed enrichment factors varied between 43 and 296, while the limits of detection (LODs) ranged from 0.09 μg/mL to 0.18 μg/mL. The limits of quantitation (LOQs) were established within the scope of 0.30 μg/mL to 0.60 μg/mL. Regarding precision, RSD values ranged between 2.34 and 3.77% for intra-day precision and between 3.04 to 4.96% for inter-day (n = 3) precision (Table 3). The ranges of recovery rate were 85.97–108.11%. When the spiked concentration of 9 flavonoids was set at 20 μg/mL, the spiked recoveries of 9 flavonoids in real vinegar samples (W3, D3, C2, YN1 and Z3) fluctuated between 85.97% and 108.11% (Table 4). Therefore, the method had good reliability and could be used for the subsequent determination of real samples.

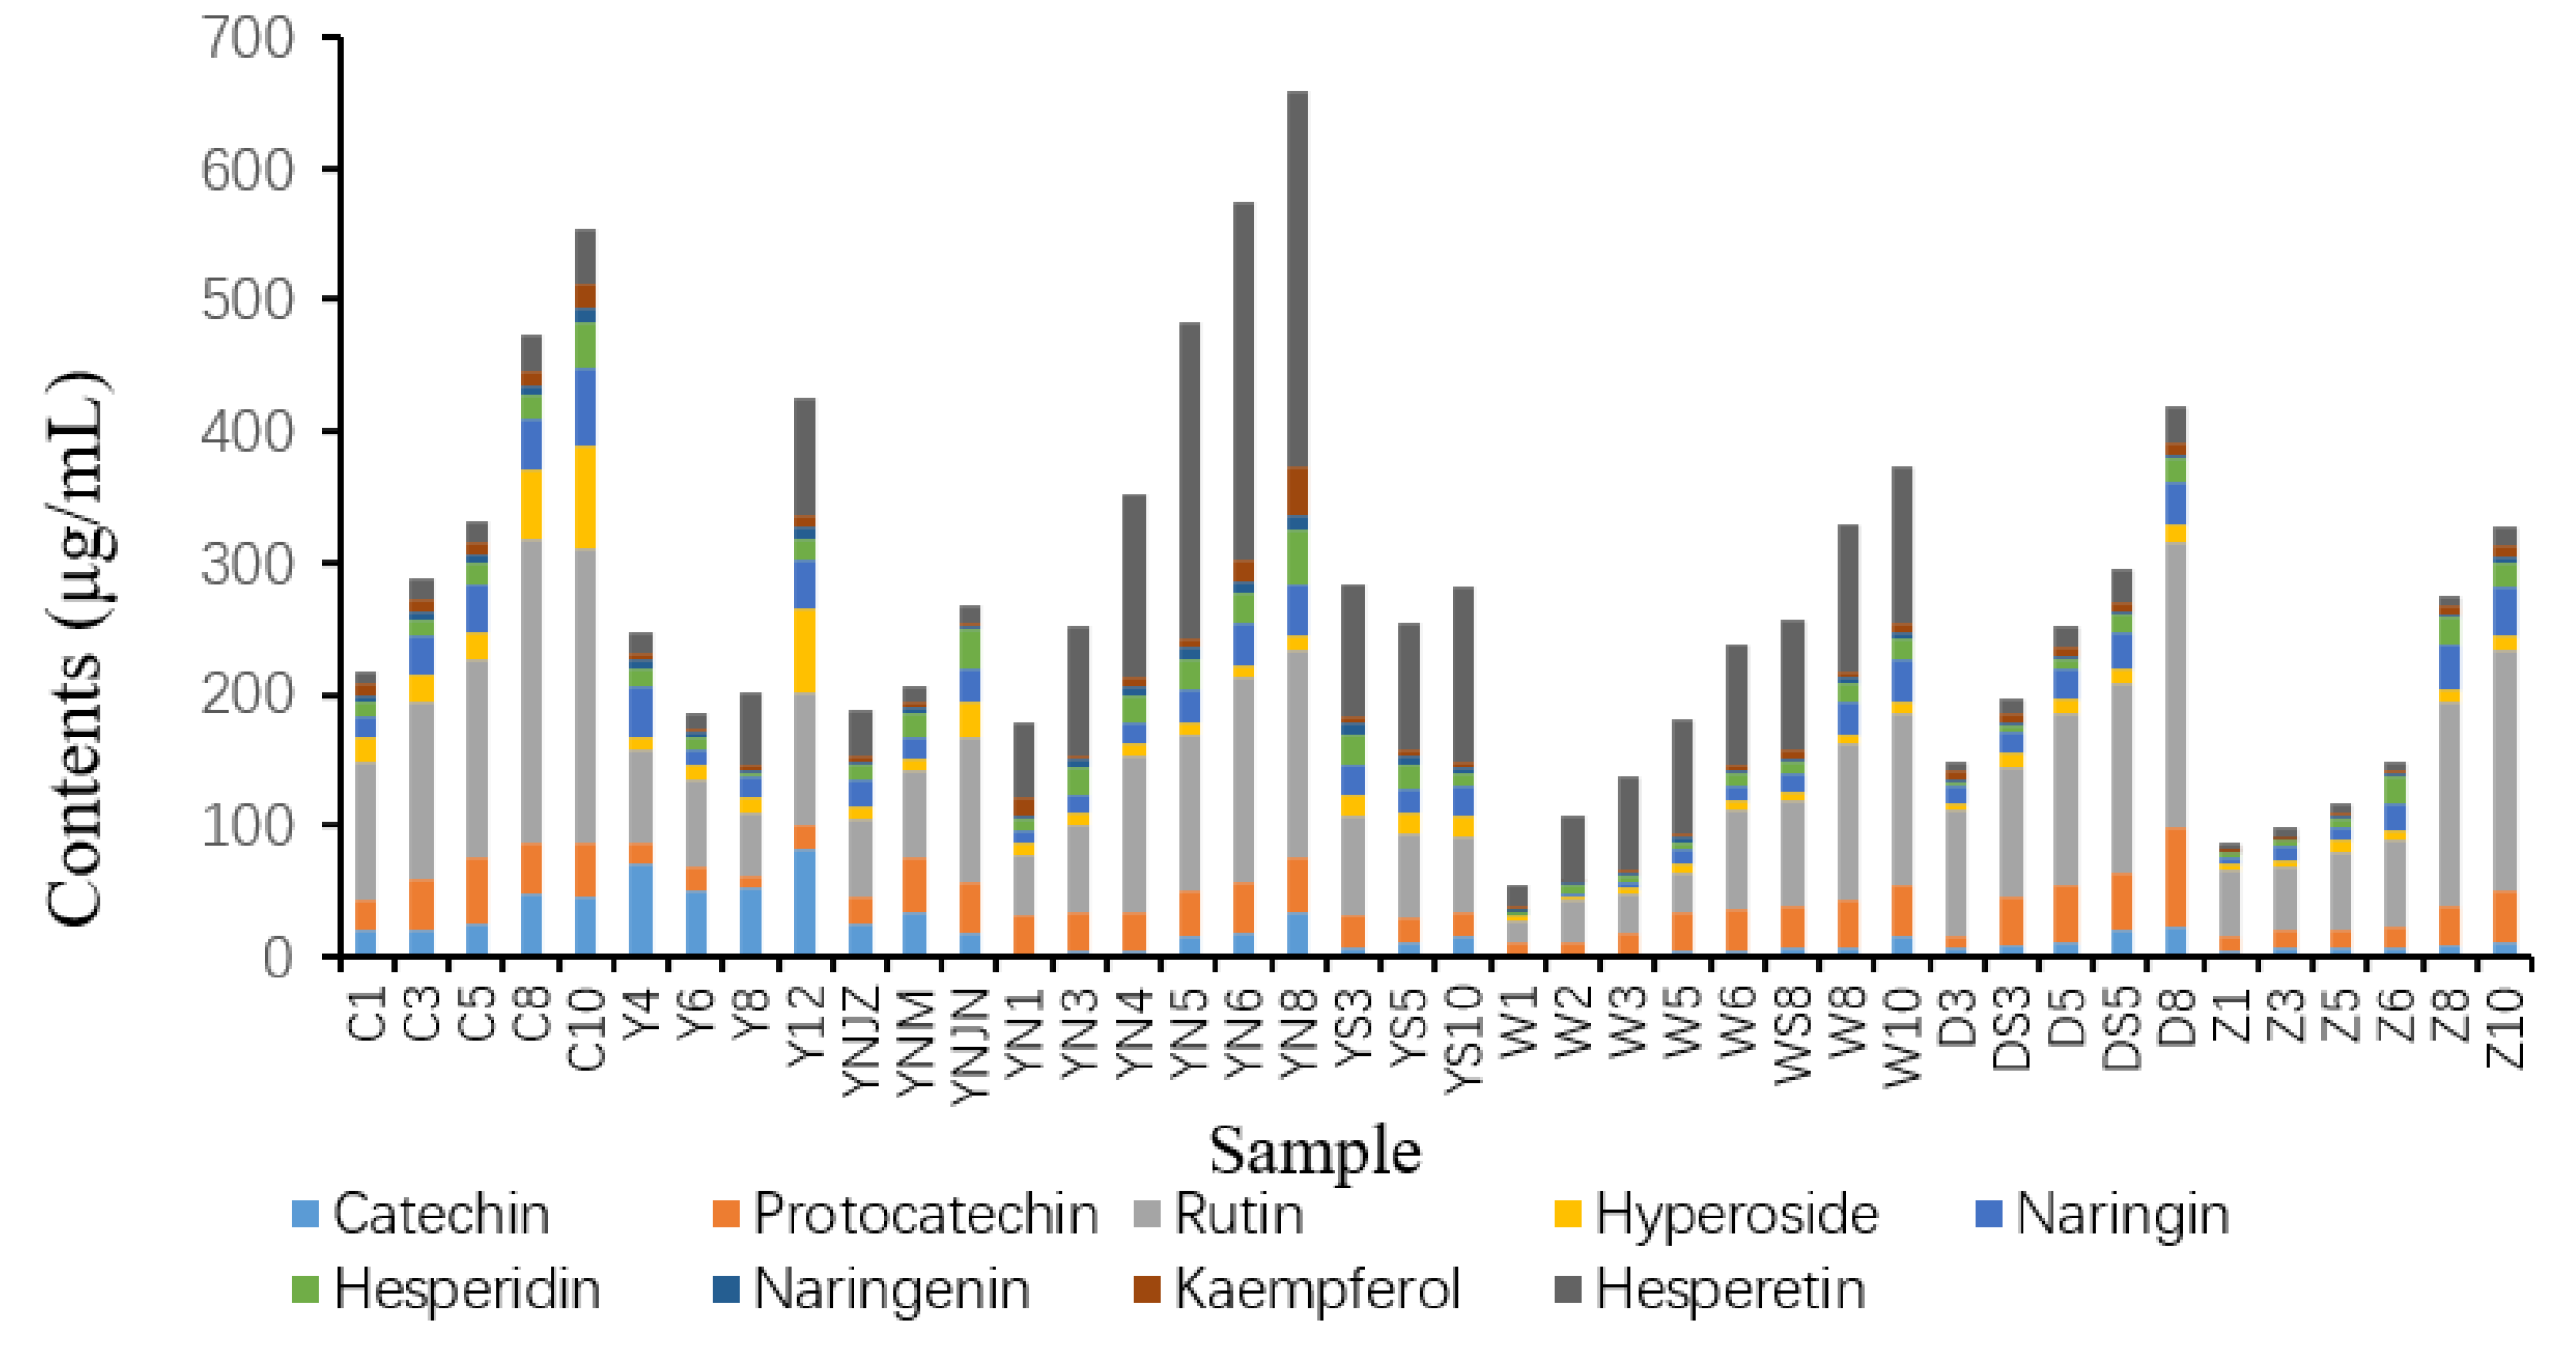
2.5. Targeted Metabolomic Analysis of Flavonoids in Actual Vinegar Samples

The composition of 9 flavonoids in 40 vinegar samples of 5 brands was analyzed. The examined flavonoids included catechin, protocatechin, rutin, hyperin, naringin, hesperidin, hesperidin, kaempferol and hesperidin. Variations in the dominant flavonoids among the test samples could be attributed to the dissimilarities in raw materials, acidity levels and production processes (Figure 4). Insights into brand-specific trends showed increased flavonoid contents corresponding with the rise in Shanxi aged vinegar’s (SAV) aging time. Brands Y and C, notably, demonstrated higher flavonoid content than the other brands. A comparative analysis between Brands Y and C revealed a similar concentration of catechin, procatechin and naringenin. However, Brand C exhibited a clear dominance in rutin, hyperoside and naringin concentrations over Brand Y. In contrast, the content of hesperidin, hesperetin and kaempferol was markedly elevated in Brand Y compared to Brand C. Further, the content of hesperetin was the highest in brand Y, followed by brand D, with significantly higher levels than the remaining brands. With the progressive increase in SAV’s aging years, a concurrent rise in hesperetin content was recorded across all five brands. Similarly, brand C displayed the highest rutin content, which was also relatively high in the other four brands. A decreasing trend in rutin content was noticed with the reduction in brand C’s ageing year, a pattern also reflected in the other brands. The graphical representation via column histograms (Figure 4) highlighted the peak flavone content in YN8 at approximately 657.95 μg/mL. Compared with other samples, the W1 sample demonstrated significantly lower total flavonoid content, measuring 54.77 μg/mL. As an individual flavonoid, rutin exhibited exceptionally high content across all samples, ranging between 16.32 μg/mL to 232.068 μg/mL.

2.6. Heat Map Analysis

In Figure 5, a comparison of the contents of nine flavonoids in 40 samples is presented using a heat map. Each row within the graphic denotes a unique sample of SAV, and each column corresponds to a distinct flavonoid compound. High and low levels are depicted by red and green hues, respectively. The heat map facilitates a detailed analysis of the variations in flavonoid compounds across different brands and maturity levels of vinegar samples. The significant clustering suggests a high degree of similarity in flavonoid expression patterns amongst specific samples. Notably, the YN8, YN6 and YN5 samples displayed pronounced clustering, signifying an exceptionally high hesperetin content. Likewise, samples C10 and C8 manifested a distinct clustering pattern with a notably elevated rutin content. Upon close examination of Figure 5, it was observed that the concentrations of naringenin and kaempferol were generally lower across all samples. Broadly, samples from the same brand tended to cluster together, implying a relative consistency in the expression characteristics of flavonoids within each brand. This observation further substantiated the hypothesis that the characteristic flavonoids in a sample are influenced by the raw materials used, the processing methods employed and the sample’s acidity.

2.7. Assessment of Method’s Environmental Impact

In order to assess the environmental sustainability of the method developed in this study, three distinct evaluation metrics were employed. The first of these is the Analytical Ecology Scale (AES), which analyzes the environmental impact of the analytical process based on the assignment of penalty points (PPs) to various parameters. This method system principally penalizes the usage of harmful reagents, instruments and waste. The penalty associated with a reagent is determined by its hazard and quantity, with the penalty points calculated as the product of these two factors [40]. The hazard value of the reagent, in turn, is computed as the product of the number of associated hazard pictograms and signal words. The final score is determined by subtracting the total penalty points from 100, with scores ≥75, ≥50 and <50 corresponding to ‘excellent’, ‘acceptable’ and ‘inadequate’ environmental impact, respectively. In the context of this study, the total penalty points amounted to 20, yielding an AES score of 80. This score indicates that the method developed in this study has a commendable environmental profile (Table 5).
The Green Analytical Procedure Index (GAPI) constitutes the second evaluation metric used in this study. It comprehensively assesses the entire analytical process from sample collection to final determination. The GAPI encompasses five key aspects: sample collection, sample preparation, solvents and reagents, instrumentation use and waste generation. The environmental impact of each stage is visually represented via a three-tiered color-coded pictogram system, spanning from green (low environmental impact) to red (high environmental impact) [41]. As depicted in Table 6, our method is predominantly represented by green sections (six in total), with only five red sections. This pictogram indicates that our method is environmentally friendly, posing minimal hazards to human health and the environment.
The third and final assessment tool is the Analytical Greenness Metric (AGREE). This metric evaluates the environmental sustainability of an analytical method by deploying a set of tools grounded in the 12 principles of Green Analytical Chemistry) [42]. The environmental friendliness of a method is quantified on a scale from 0 to 1 using pictograms. Comparing our approach with similar recent reports (Table 7). Due to the lack of information about SAV, we chose to have the report focus on extraction flavonoids. Indeed, the proposed procedure is the greenest methodology (0.71 versus 0.59, 0.5 and 0.6) due to the replacement of organic solvents such as 60% ethanol, CHCl3 or chloroform with DES (TOMAC: BDO). Sample usages and extractant volumes also lead to better and more sustainable analytical methods. Therefore, the method can be classified as environmentally friendly. The amalgamation of the above three evaluation tools provides a holistic assessment of our method’s overall environmental impact, encompassing all stages from sample preparation to chromatographic analysis [43].

2.8. Comparison of the Optimized Method with Other Procedures

The developed hydrophobic DES-VALLME-HPLC method was compared with other previously established methodologies for the determination of various flavonoids in different samples, as listed in Table 8. A precise observation indicates that the current method showcases similar LOD values and RSD comparable to those reported in prior studies, confirming its efficacy for the quantitative analysis of target analytes across an extensive linear range. Our findings highlight the eco-friendly nature of the proposed method based on hydrophobic DESs, emphasizing their sensitivity and successful performance in extracting and determining target analytes in authentic vinegar samples.

2.9. Comprehensive Analysis of the Potential of DES-VALLME Based Programs

As far as we know, flavonoid extraction technologies include alcohol extraction, microwave extraction (MAE), supercritical fluid extraction (SFE), ultrasonic-assisted extraction (UAE), vortex-assisted extraction (VAE) and solid phase extraction (SPE). Among these, supercritical fluid extraction technology is considered a sustainable extraction method, as supercritical fluid can be combined with other conventional non-toxic/low toxic solvents [53,54]. However, the expensive equipment used in SFE hinders its wider application. In contrast, DES-VALLME is an efficient extraction technology that is more economical and simpler to operate than SFE [55,56]. Therefore, DES-VALLME is expected to show great potential in the analysis of various bioactive substances and contribute to the construction of more green and environmentally friendly chemical analysis methods in the future.

3. Experimental

3.1. Materials and Reagents

Ultrapure water was procured from Hangzhou Wahaha Group Co., Ltd. (Zhejiang, China). Various flavonoid standards were acquired, each adhering to high purity constraints. These included catechin (≥99%), protocatechin (≥98%), rutin (≥99%), hyperoside (≥99%), naringin (≥99%), hesperidin (≥99%), naringenin (≥99%), kaempferol (≥99%) and hesperetin (≥99%), which were obtained from Shanghai Winherb Medical Science Co., Ltd. (Shanghai, China).
A standard reserve solution with a concentration of 1 mg/mL was prepared by accurately weighing 10 mg of each standard flavonoid, which was then dissolved in 10 mL chromatography-grade methanol. This solution served as a ready-to-use stock solution for the experiments. Whenever a standard substance was needed, this stock solution was diluted to form a concentration gradient ranging from 50.00 μg/mL to 0.20 μg/mL.

3.2. Instruments and Analytical Conditions

The equipment utilized in this study encompassed an SB-5200DT ultrasonic cleaner supplied by Ningbo Scientz Biotechnology Co., Ltd. (Zhejiang, China) and a high-speed TG16A-WS centrifuge procured from Hunan Saitexiangyi centrifuge instrument Co., Ltd. (Hunan, China). A WH260-R hotplate stirrer was acquired from Wiggens Technology Co., Ltd. (Straubenhardt, Germany).
The chromatographic analyses were carried out using an Agilent 1260 HPLC system (Agilent Technologies, USA). Chromatographic separation was conducted on a C18 column (250 mm × 4.6 mm, 5 µm) sourced from Waters Technologies (Ireland), whose temperature was consistently maintained at 40 °C. The injection volume used for each run was set at 20 μL. The flow rate of the column was standardized to 1.0 mL/min. An analytical wavelength of 280 nm was selected for the detection of flavonoid compounds. The mobile phase comprised a phosphoric acid solution with concentration of 0.1% (Phase A) and acetonitrile (Phase B). The gradient elution procedure was performed as follows: the percentage of Phase A was reduced from 90% to 65% over 0–30 min. Subsequently, at the 30-min mark, the percentage of Phase A was increased from 65% to 90% over a 15-min duration until the 45-min mark. For the final 10 min of the procedure, Phase A was maintained at a constant 90%.

3.3. Real Samples Collection

We collected five brands of Shanxi aged vinegar from local supermarket, factories and network. Sample information was as follows: brand C contained C1, C3, C5, C8, C10; brand Y contained Y4, Y6, Y8, Y12, YNJZ, YNM, YNJN, YN1, YN3, YN4, YN5, YN6, YN8, YS3, YS5, YS10; brand W contained W1, W2, W3, W5, W6, WS8, W8, W10; brand D contained DS3, D3, DS5, D5, D8; and brand Z contained Z1, Z3, Z5, Z6, Z8, Z10.

3.4. Preparation of Hydrophobic Deep Eutectic Solvent

The DESs were prepared using the tricaprylylmethylammonium chloride as HBA and ethylene glycol, n-caprylic acid, 1,4-butanediol, 2,3-butanediol, 1,3-butanediol as HBD. These components were mixed in specific molar ratios and placed in a centrifuge. The mixture was then heated in a boiling water bath until the liquid became clear and transparent. The resulting DESs were labeled as DES1, DES2, DES3, DES4 and DES5 (Table 9).

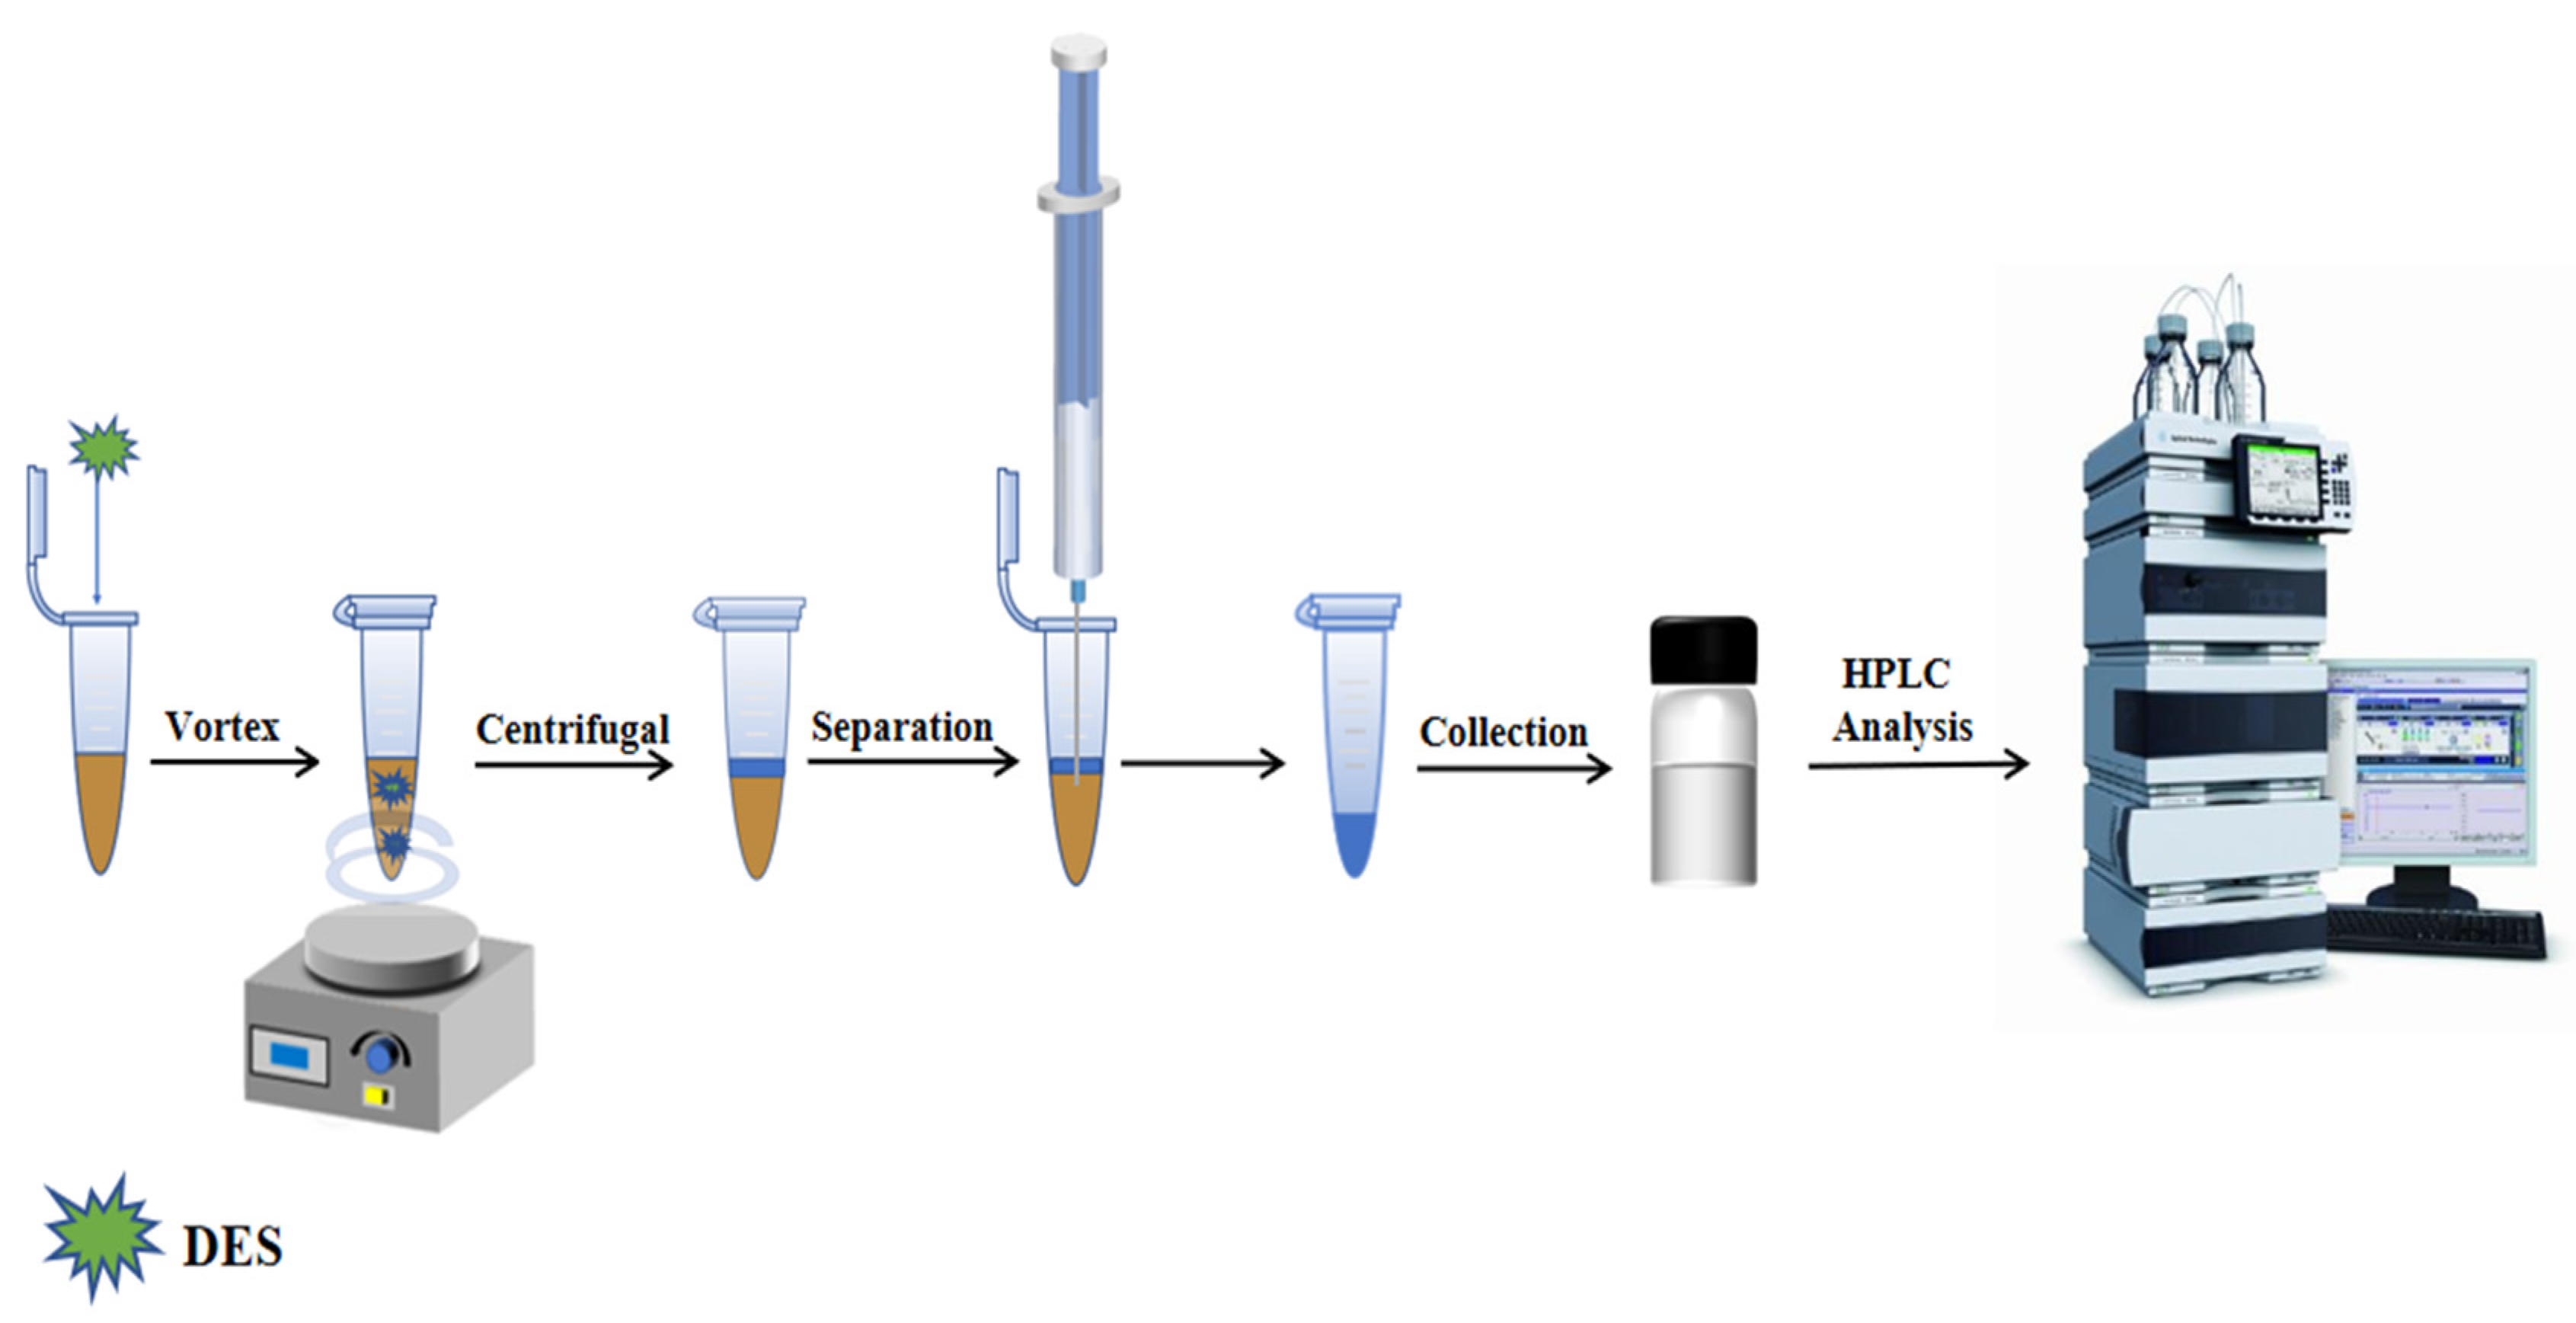
3.5. Vortex Assisted Liquid–liquid Microextraction Procedure

We accurately measured 3.5 mL of the diluted sample solution and transferred it into a 10 mL centrifuge tube. Then, 150 μL DES5 and 0.40 g NaCl were added to the solution. The tube was placed in a vortex mixer for 5 min to reach extraction equilibrium. Afterwards, the tube was centrifuged at 5000 r/min for 10 min. The lower aqueous phase was extracted and discarded using a syringe, while the organic phase was collected using a long needle and passed through a 0.22 μm organic filter membrane. The resulting organic solution was analyzed using HPLC. The VALLME-HPLC procedure is illustrated in Figure 6.

3.6. Optimization of Extraction Conditions

In this part, we investigated six factors that affect the extraction effect: the type of DES (DES1, DES2, DES3, DES4, DES5), the molar ratio of HBA to HBD (1:1, 1:2, 1:3, 1:4, 1:5, 1:6, 1:7), the volume of the DES (100 μL, 150 μL, 200 μL, 250 μL, 300 μL), vortex time (2 min, 3 min, 4 min, 5 min, 6 min, 7 min), the amount of NaCl added (0.15 g, 0.20 g, 0.25 g, 0.30 g, 0.35 g, 0.40 g, 0.45 g), and centrifugation time (5 min, 10 min, 15 min, 20 min, 25 min). While investigating one factor, we kept the other five factors constant and conducted three parallel experiments for each group.

4. Conclusions

In this study, hydrophobic DES-VALLAME-HPLC was used to determine the quantities of nine flavonoids found in SAV. The analysis utilized a hydrophobic deep eutectic solvent (DES) as an eco-friendly extraction medium during the sample processing phase. Among the five synthesized DESs, DES5 (tricaprylylmethylammonium chloride and 1,4-butanediol, 1:6) had the highest extraction efficiency. This can be attributed to the hydrogen bonding between the target analytes and the solvent. The parameters for the DES-VALLAME-HPLC method were optimized using single factor optimization and BBD design, resulting in good methodological information. The method was subsequently validated validated through matrix-matched calibration, and by evaluating LODs, LOQs and precision. The procedure resulted in satisfactory recoveries (ranging from 85.97% to 108.11%) and low LODs (varying between 0.09–0.18 μg/mL). Furthermore, the greenness of the developed procedure was assessed via AES, GAPI and AGREE, all of which indicated excellent environmental friendliness. The proposed method is fast, cost-effective and sustainable and can be applied to the quality control analysis of flavonoids in SAV without harmful effects on human health or the environment.

Author Contributions

Methodology, investigation, writing—original draft, B.B.; conceptualization, writing—original draft, Y.G.; investigation, S.M.; project administration, S.C.; formal analysis, T.B.; project administration, J.Z.; supervision, D.S.; conceptualization, Y.L.; writing—review and editing, project administration and funding acquisition, Y.Y.; writing—review and editing, S.F. All authors have read and agreed to the published version of the manuscript.

Funding

This work was supported by National Natural Science Foundation of China (No. 32072301), Excellent Youth Cultivation Project of Shanxi (No. 20210302122004); Key R&D Plan of Shanxi (Agricultural Field, No. 202102140601018, 202202140601018); the Open Project Program of Xinghuacun College of Shanxi University (Shanxi Institute of Brewing Technology and Industry) (No. XCSXU-KF-202205, XCSXU-KF-202211).

Institutional Review Board Statement

Not applicable.

Informed Consent Statement

Informed consent was obtained from all subjects involved in the study.

Data Availability Statement

All data, tables, and figures are originals.

Conflicts of Interest

The authors declare no conflict of interest.

Sample Availability

Samples of the compounds are not available from the authors.

References

  1. Hutchinson, U.F.; Jolly, N.P.; Chidi, B.S.; Ngongang, M.M.; Ntwampe, S.K.O. Vinegar Engineering: A Bioprocess Perspective. Food Eng. Rev. 2019, 11, 290–305. [Google Scholar] [CrossRef]
  2. Hu, Y.; Zheng, C.; Chen, H.; Wang, C.; Ren, X.; Fu, S.; Xu, N.; Li, P.; Song, J.; Wang, C. Characteristics and Discrimination of the Commercial Chinese Four Famous Vinegars Based on Flavor Compositions. Foods 2023, 12, 1865. [Google Scholar] [CrossRef] [PubMed]
  3. Ávila, S.; Zalamanski, S.; Tanikawa, L.M.; Kruger, C.C.H.; Ferreira, S.M.R. Influence of Cooking Methods on in Vitro Bioaccessibility of Phenolics, Flavonoids, and Antioxidant Activity of Red Cabbage. Plant Foods Hum. Nutr. 2023, 78, 124–131. [Google Scholar] [CrossRef] [PubMed]
  4. Al Aboody, M.S.; Mickymaray, S. Anti-Fungal Efficacy and Mechanisms of Flavonoids. Antibiotics 2020, 9, 45. [Google Scholar] [CrossRef] [Green Version]
  5. Ożarowski, M.; Karpiński, T.M. Extracts and Flavonoids of Passiflora Species as Promising Anti-Inflammatory and Antioxidant Substances. Curr. Pharm. Des. 2021, 27, 2582–2604. [Google Scholar] [CrossRef]
  6. Motallebi, M.; Bhia, M.; Rajani, H.F.; Bhia, I.; Tabarraei, H.; Mohammadkhani, N.; Pereira-Silva, M.; Kasaii, M.S.; Nouri-Majd, S.; Mueller, A.-L.; et al. Naringenin: A Potential Flavonoid Phytochemical for Cancer Therapy. Life Sci. 2022, 305, 120752. [Google Scholar] [CrossRef]
  7. Oliveira, A.K.d.S.; de Oliveira e Silva, A.M.; Pereira, R.O.; Santos, A.S.; Barbosa Junior, E.V.; Bezerra, M.T.; Barreto, R.S.; Quintans-Junior, L.J.; Quintans, J.S. Anti-Obesity Properties and Mechanism of Action of Flavonoids: A Review. Crit. Rev. Food Sci. Nutr. 2022, 62, 7827–7848. [Google Scholar] [CrossRef]
  8. Shahidi, F.; McDonald, J.; Chandrasekara, A.; Zhong, Y. Phytochemicals of Foods, Beverages and Fruit Vinegars: Chemistry and Health Effects. Asia Pac. J. Clin. Nutr. 2008, 17 (Suppl. S1), 380–382. [Google Scholar]
  9. Tošović, J.; Marković, S. Reproduction and Interpretation of the UV–Vis Spectra of Some Flavonoids. Chem. Pap. 2017, 71, 543–552. [Google Scholar] [CrossRef]
  10. Jasprica, I.; Smolčić-Bubalo, A.; Mornar, A.; Medić-Šarić, M. Investigation of the Flavonoids in Croatian Propolis by Thin-Layer Chromatography. JPC J. Planar Chromatogr. Mod. TLC 2004, 17, 95–101. [Google Scholar] [CrossRef]
  11. Kontogianni, V.G.; Primikyri, A.; Sakka, M.; Gerothanassis, I.P. Simultaneous Determination of Artemisinin and Its Analogs and Flavonoids in Artemisia Annua Crude Extracts with the Use of NMR Spectroscopy. Magn. Reson. Chem. 2020, 58, 232–244. [Google Scholar] [CrossRef]
  12. Hu, J.; Zhang, Z. Application of Electrochemical Sensors Based on Carbon Nanomaterials for Detection of Flavonoids. Nanomaterials 2020, 10, 2020. [Google Scholar] [CrossRef]
  13. Sammani, M.S.; Clavijo, S.; Cerdà, V. Recent, Advanced Sample Pretreatments and Analytical Methods for Flavonoids Determination in Different Samples. TrAC Trends Anal. Chem. 2021, 138, 116220. [Google Scholar] [CrossRef]
  14. Tan, L.; Ji, T.; Jiang, G.; Hu, F. Simultaneous Identification and Quantification of Five Flavonoids in the Seeds of Rheum Palmatum L. by Using Accelerated Solvent Extraction and HPLC–PDA–ESI/MSn. Arab. J. Chem. 2019, 12, 1345–1352. [Google Scholar] [CrossRef] [Green Version]
  15. Hao, H.; Lin, L.; Liu, S.; Kang, Y.; Wang, Y.; Huang, J.; Weng, W. Deep Eutectic Solvent-Based Microwave-Assisted Extraction for the Chromatographic Analysis of Bioactive Flavonoids in Spirodela Polyrrhiza. J. Chromatogr. Sci. 2022, 60, 501–510. [Google Scholar] [CrossRef]
  16. Wang, Y.; Xiong, X.; Huang, G. Ultrasound-Assisted Extraction and Analysis of Maidenhairtree Polysaccharides. Ultrason. Sonochemistry 2023, 95, 106395. [Google Scholar] [CrossRef]
  17. Albero, B.; Tadeo, J.L.; Pérez, R.A. Ultrasound-Assisted Extraction of Organic Contaminants. TrAC Trends Anal. Chem. 2019, 118, 739–750. [Google Scholar] [CrossRef]
  18. Kavoura, D.; Kyriakopoulou, K.; Papaefstathiou, G.; Spanidi, E.; Gardikis, K.; Louli, V.; Aligiannis, N.; Krokida, M.; Magoulas, K. Supercritical CO2 Extraction of Salvia Fruticosa. J. Supercrit. Fluids 2019, 146, 159–164. [Google Scholar] [CrossRef]
  19. Tomai, P.; Dal Bosco, C.; D’Orazio, G.; Scuto, F.R.; Felli, N.; Gentili, A. Supercritical Fluid Chromatography for Vitamin and Carotenoid Analysis: An Update Covering 2011–2021. J. Chromatogr. Open 2022, 2, 100027. [Google Scholar] [CrossRef]
  20. He, X.; Guo, F.; Liu, B. Oolong Tea and LR-White Resin: A New Method of Plant Sample Preparation for Transmission Electron Microscopy. J. Microsc. 2018, 270, 244–251. [Google Scholar] [CrossRef]
  21. Jia, C.; Zhu, X.; Wang, J.; Zhao, E.; He, M.; Chen, L.; Yu, P. Extraction of Pesticides in Water Samples Using Vortex-Assisted Liquid–Liquid Microextraction. J. Chromatogr. A 2010, 1217, 5868–5871. [Google Scholar] [CrossRef] [PubMed]
  22. Xue, J.; Yang, L.; Chen, X.; Bai, X.-H.; Hu, S. Vortex-Assisted Dispersive Liquid-Phase Microextraction for the Analysis of Main Active Compounds from Zi-Cao-Cheng-Qi Decoction Based on a Hydrophobic Deep Eutectic Solvent. J. Sep. Sci. 2021, 44, 4376–4383. [Google Scholar] [CrossRef]
  23. Prabhune, A.; Dey, R. Green and Sustainable Solvents of the Future: Deep Eutectic Solvents. J. Mol. Liq. 2023, 379, 121676. [Google Scholar] [CrossRef]
  24. Płotka-Wasylka, J.; De la Guardia, M.; Andruch, V.; Vilková, M. Deep Eutectic Solvents vs Ionic Liquids: Similarities and Differences. Microchem. J. 2020, 159, 105539. [Google Scholar] [CrossRef]
  25. Aydin, F.; Yilmaz, E.; Soylak, M. Vortex Assisted Deep Eutectic Solvent (DES)-Emulsification Liquid-Liquid Microextraction of Trace Curcumin in Food and Herbal Tea Samples. Food Chem. 2018, 243, 442–447. [Google Scholar] [CrossRef] [PubMed]
  26. Zhu, S.; Zhou, J.; Jia, H.; Zhang, H. Liquid–Liquid Microextraction of Synthetic Pigments in Beverages Using a Hydrophobic Deep Eutectic Solvent. Food Chem. 2018, 243, 351–356. [Google Scholar] [CrossRef]
  27. Surapong, N.; Pongpinyo, P.; Santaladchaiyakit, Y.; Burakham, R. A Biobased Magnetic Dual-Dummy-Template Molecularly Imprinted Polymer Using a Deep Eutectic Solvent as a Coporogen for Highly Selective Enrichment of Organophosphates. Food Chem. 2023, 418, 136045. [Google Scholar] [CrossRef]
  28. Tâme Parreira, R.L.; Galembeck, S.E.; Hobza, P. On the Origin of Red and Blue Shifts of X—H and C—H Stretching Vibrations in Formic Acid (Formate Ion) and Proton Donor Complexes. ChemPhysChem 2007, 8, 87–92. [Google Scholar] [CrossRef]
  29. Cui, Q.; Liu, J.-Z.; Wang, L.-T.; Kang, Y.-F.; Meng, Y.; Jiao, J.; Fu, Y.-J. Sustainable Deep Eutectic Solvents Preparation and Their Efficiency in Extraction and Enrichment of Main Bioactive Flavonoids from Sea Buckthorn Leaves. J. Clean. Prod. 2018, 184, 826–835. [Google Scholar] [CrossRef]
  30. Cao, J.; Yang, M.; Cao, F.; Wang, J.; Su, E. Well-Designed Hydrophobic Deep Eutectic Solvents as Green and Efficient Media for the Extraction of Artemisinin from Artemisia Annua Leaves. ACS Sustain. Chem. Eng. 2017, 5, 3270–3278. [Google Scholar] [CrossRef]
  31. Cao, J.; Yang, M.; Cao, F.; Wang, J.; Su, E. Tailor-Made Hydrophobic Deep Eutectic Solvents for Cleaner Extraction of Polyprenyl Acetates from Ginkgo Biloba Leaves. J. Clean. Prod. 2017, 152, 399–405. [Google Scholar] [CrossRef]
  32. Hou, J.; Lin, S.; Zhang, M. Ionic-Liquid-Enhanced Solvent Extraction Mechanism: A Novel Concept. J. Environ. Chem. Eng. 2022, 10, 107899. [Google Scholar] [CrossRef]
  33. Fan, Y.; Luo, H.; Zhu, C.; Li, W.; Wu, D.; Wu, H. Hydrophobic Natural Alcohols Based Deep Eutectic Solvents: Effective Solvents for the Extraction of Quinine. Sep. Purif. Technol. 2021, 275, 119112. [Google Scholar] [CrossRef]
  34. Zhao, L.; Wang, M.; Wang, J.; Wu, J.; Zhang, Z.; Jing, X.; Wang, X. Deep Eutectic Solvent-Based Dispersive Liquid–Liquid Microextraction Followed by Smartphone Digital Image Colorimetry for the Determination of Carbofuran in Water Samples. Anal. Methods 2023, 15, 648–654. [Google Scholar] [CrossRef] [PubMed]
  35. Elencovan, V.; Joseph, J.; Yahaya, N.; Samad, N.A.; Raoov, M.; Lim, V.; Zain, N.N.M. Exploring a Novel Deep Eutectic Solvents Combined with Vortex Assisted Dispersive Liquid–Liquid Microextraction and Its Toxicity for Organophosphorus Pesticides Analysis from Honey and Fruit Samples. Food Chem. 2022, 368, 130835. [Google Scholar] [CrossRef] [PubMed]
  36. Zhang, L.; Chen, F.; Liu, S.; Chen, B.; Pan, C. Ionic Liquid-Based Vortex-Assisted Dispersive Liquid–Liquid Microextraction of Organophosphorus Pesticides in Apple and Pear. J. Sep. Sci. 2012, 35, 2514–2519. [Google Scholar] [CrossRef] [PubMed]
  37. Rykowska, I.; Ziemblińska, J.; Nowak, I. Modern Approaches in Dispersive Liquid-Liquid Microextraction (DLLME) Based on Ionic Liquids: A Review. J. Mol. Liq. 2018, 259, 319–339. [Google Scholar] [CrossRef]
  38. Khoubnasabjafari, M.; Jouyban, A.; Hosseini, M.; Farajzadeh, M.A.; Saboohi, R.; Nemati, M.; Khosrowshahi, E.M.; Mogaddam, M.R.A. A Mixed Deep Eutectic Solvents-Based Air-Assisted Liquid–Liquid Microextraction of Surfactants from Exhaled Breath Condensate Samples Prior to HPLC-MS/MS Analysis. J. Chromatogr. B 2022, 1204, 123289. [Google Scholar] [CrossRef]
  39. Gila, A.; Aguilera, M.P.; Sánchez-Ortíz, A.; Jiménez, A.; Beltrán, G. Effect of Centrifugal Force (G) on Stability of Natural Emulsions (Water/Oil) Present in Fresh Virgin Olive Oils. J. Food Eng. 2022, 334, 111169. [Google Scholar] [CrossRef]
  40. Gałuszka, A.; Migaszewski, Z.M.; Konieczka, P.; Namieśnik, J. Analytical Eco-Scale for Assessing the Greenness of Analytical Procedures. TrAC Trends Anal. Chem. 2012, 37, 61–72. [Google Scholar] [CrossRef]
  41. Płotka-Wasylka, J. A New Tool for the Evaluation of the Analytical Procedure: Green Analytical Procedure Index. Talanta 2018, 181, 204–209. [Google Scholar] [CrossRef]
  42. Wojnowski, W.; Tobiszewski, M.; Pena-Pereira, F.; Psillakis, E. AGREEprep–Analytical Greenness Metric for Sample Preparation. TrAC Trends Anal. Chem. 2022, 149, 116553. [Google Scholar] [CrossRef]
  43. Shaaban, H. Sustainable Dispersive Liquid–Liquid Microextraction Method Utilizing a Natural Deep Eutectic Solvent for Determination of Chloramphenicol in Honey: Assessment of the Environmental Impact of the Developed Method. RSC Adv. 2023, 13, 5058–5069. [Google Scholar] [CrossRef]
  44. Yu, M.; Wang, B.; Qi, Z.; Xin, G.; Li, W. Response Surface Method Was Used to Optimize the Ultrasonic Assisted Extraction of Flavonoids from Crinum Asiaticum. Saudi J. Biol. Sci. 2019, 26, 2079–2084. [Google Scholar] [CrossRef]
  45. Campone, L.; Piccinelli, A.L.; Pagano, I.; Carabetta, S.; Di Sanzo, R.; Russo, M.; Rastrelli, L. Determination of Phenolic Compounds in Honey Using Dispersive Liquid–Liquid Microextraction. J. Chromatogr. A 2014, 1334, 9–15. [Google Scholar] [CrossRef]
  46. Campillo, N.; Viñas, P.; Férez-Melgarejo, G.; Hernández-Córdoba, M. Dispersive Liquid–Liquid Microextraction for the Determination of Flavonoid Aglycone Compounds in Honey Using Liquid Chromatography with Diode Array Detection and Time-of-Flight Mass Spectrometry. Talanta 2015, 131, 185–191. [Google Scholar] [CrossRef] [PubMed]
  47. Wang, Y.; Yang, L.; Xing, R.; Wang, R.; Chen, X.; Hu, S. A Switchable Deep Eutectic Solvent for the Homogeneous Liquid-Liquid Microextraction of Flavonoids from “Scutellariae Radix”. J. Chromatogr. A 2023, 1688, 463712. [Google Scholar] [CrossRef] [PubMed]
  48. Zhao, X.; Zhang, S.; Liu, D.; Yang, M.; Wei, J. Analysis of Flavonoids in Dalbergia Odorifera by Ultra-Performance Liquid Chromatography with Tandem Mass Spectrometry. Molecules 2020, 25, 389. [Google Scholar] [CrossRef] [PubMed] [Green Version]
  49. Ma, M.; Wang, L.; Lu, X.; Wang, S.; Guo, Y.; Liang, X. One-Step Fabrication of Hydrophobic Metal-Organic Framework@covalent Organic Framework Hybrid as Sorbent for High-Performance Solid-Phase Extraction of Flavonoids. J. Chromatogr. A 2023, 1691, 463814. [Google Scholar] [CrossRef]
  50. Xiao, X.; Xu, L.; Hu, H.; Yang, Y.; Zhang, X.; Peng, Y.; Xiao, P. DPPH Radical Scavenging and Postprandial Hyperglycemia Inhibition Activities and Flavonoid Composition Analysis of Hawk Tea by UPLC-DAD and UPLC-Q/TOF MSE. Molecules 2017, 22, 1622. [Google Scholar] [CrossRef]
  51. Hai, X.; Shi, F.; Zhu, Y.; Ma, L.; Wang, L.; Yin, J.; Li, X.; Yang, Z.; Yuan, M.; Xiong, H.; et al. Development of Magnetic Dispersive Micro-Solid Phase Extraction of Four Phenolic Compounds from Food Samples Based on Magnetic Chitosan Nanoparticles and a Deep Eutectic Supramolecular Solvent. Food Chem. 2023, 410, 135338. [Google Scholar] [CrossRef] [PubMed]
  52. Li, J.; Xu, D.; Wang, Z.; Wang, R.; Yang, L.; Hu, S.; Du, L.; Chen, X. Crystal Film Accelerated Solvent Microextraction (CF-ASME) for Determination of Flavonoids in Natural Products Combined with High Performance Liquid Chromatography. J. Chromatogr. A 2022, 1676, 463286. [Google Scholar] [CrossRef] [PubMed]
  53. Li, Z.; Yan, L.; Yu, X.; Ruan, X.; Liu, B.; Wang, Q. Optimization of Supercritical Fluid Extraction of Total Flavonoids and Monomer Compositions from Taxus Remainder Extracts Free of Taxoids. Zhong Yao Cai = Zhongyaocai = J. Chin. Med. Mater. 2016, 39, 2062–2067. [Google Scholar]
  54. Bernal-Millán, M.d.J.; Carrasco-Portugal, M.d.C.; Heredia, J.B.; Bastidas-Bastidas, P.d.J.; Gutiérrez-Grijalva, E.P.; León-Félix, J.; Angulo-Escalante, M.Á. Green Extracts and UPLC-TQS-MS/MS Profiling of Flavonoids from Mexican Oregano (Lippia Graveolens) Using Natural Deep Eutectic Solvents/Ultrasound-Assisted and Supercritical Fluids. Plants 2023, 12, 1692. [Google Scholar] [CrossRef]
  55. Picot-Allain, C.; Mahomoodally, M.F.; Ak, G.; Zengin, G. Conventional versus Green Extraction Techniques—A Comparative Perspective. Curr. Opin. Food Sci. 2021, 40, 144–156. [Google Scholar] [CrossRef]
  56. Xue, H.; Li, J.; Wang, G.; Zuo, W.; Zeng, Y.; Liu, L. Ultrasound-Assisted Extraction of Flavonoids from Potentilla Fruticosa L. Using Natural Deep Eutectic Solvents. Molecules 2022, 27, 5794. [Google Scholar] [CrossRef]
Figure 1. FT–IR spectra of tricaprylylmethylammonium chloride, 1,4-butanediol and DES5.
Molecules 28 05619 g001
Figure 2. The results of the effect of the types of DES (a), the molar ratio of HBA and HBD (b), the volume of the DES (c), vortex time (d), the addition amount of NaCl (e) and centrifugation time (f).
Molecules 28 05619 g002
Figure 3. (ai) Response surface plots for the influence of the volume of the DES and vortex time on the peak areas of the catechin, protocatechin, rutin, hyperside, naringin, hesperidin, naringenin, kaempferol and hesperetin.
Molecules 28 05619 g003
Figure 4. The contents of nine flavonoids in actual samples.
Molecules 28 05619 g004
Figure 5. Hierarchical cluster analysis (HCA) of tested samples.
Molecules 28 05619 g005
Figure 6. Vortex assisted liquid–liquid microextraction process.
Molecules 28 05619 g006
Table 1. Factors and levels used in the response surface design.
FactorsLevels
−101
The volume of the DES/μL (A)100150200
Vortex time/min (B)456
Addition amount of NaCl/g (C)0.350.400.45
Centrifugation time/min (D)51015
Table 2. Experimental design and results for response surface design.
CatechinProtocatechinRutinHyperosideNaringin
FpFpFpFpFp
Model14.84<0.000128.71<0.000118.27<0.00019.94<0.000110.85<0.0001
A28.77<0.000135.09<0.000128.89<0.000116.510.001216.540.0012
B1.420.25381.640.22142.430.14146.610.02220.850.3710
C0.290.60027.870.01402.330.14953.590.07900.00240.9613
D1.420.25265.830.03001.990.17970.00010.99181.130.3063
AB0.290.60160.310.58871.610.22580.0100.92000.0510.8239
AC0.570.46113.450.08462.000.17950.320.58251.800.2016
AD0.0620.80680.560.46590.0100.92150.110.74530.310.5851
BC9.280.00874.270.05781.760.20613.650.07691.210.2904
BD0.0680.79810.0830.77740.00020.98950.890.36110.0280.8695
CD0.00410.94981.810.20011.420.25380.0340.85730.0880.7708
A2152.62<0.0001316.73<0.0001207.56<0.0001105.71<0.000146.63<0.0001
B217.240.001030.15<0.00018.980.00964.820.045523.930.0002
C210.680.00561.360.26280.200.66410.800.385721.860.0004
D231.54<0.000146.11<0.00016.460.02351.550.234195.55<0.0001
Lack of fit0.370.91051.630.33702.770.16890.590.77563.740.1078
R20.93690.96630.94810.90860.9156
Adjusted R20.87380.93270.89620.81720.8312
HesperidinNaringeninKaempferolHesperetin
FpFpFpFp
Model9.99<0.000111.09<0.000111.45<0.00019.29<0.0001
A55.40<0.000171.28<0.000134.18<0.000111.960.0038
B0.380.54779.540.00804.390.05480.770.3953
C0.0500.82590.300.59423.770.072716.180.0013
D0.450.51246.580.02252.690.12320.0300.8644
AB2.720.12140.810.38330.170.68770.0260.8748
AC0.00100.97520.0260.87441.270.27950.0220.8834
AD0.870.36681.570.230019.560.00060.250.6236
BC2.810.11603.920.06780.00820.92931.690.2140
BD0.0280.86883.000.10540.490.49470.0410.8419
CD3.720.074415.230.00160.0190.89210.140.7146
A235.97<0.000115.810.001441.27<0.000114.850.0018
B28.160.012733.89<0.000147.28<0.00013.900.0683
C21.850.19574.010.065134.23<0.000110.430.0060
D235.31<0.00014.730.04730.380.545593.35<0.0001
Lack of fit1.670.32903.180.13832.620.18313.220.1356
R20.90900.91730.91970.9028
Adjusted R20.81800.83460.83930.8057
Table 3. The figures of merit of the developed DES-VALLME-HPLC of nine flavonoids.
AnalytesStandard CurveLR aR2 bLOD cLOQ dEF eRSD f (%)
Intra-DayInter-Day
CatechinY = 23.954x − 2.15980.2–500.99890.090.30582.904.01
ProtocatechinY = 24.978x − 10.2490.2–500.99900.090.301562.493.04
RutinY = 34.627x + 20.3520.2–500.99680.140.452962.883.72
HyperosideY = 44.449x + 21.9510.2–500.99730.120.40542.994.24
NaringinY = 47.103x + 52.24100.2–500.99460.140.45623.774.53
HesperidinY = 50.146x + 43.73600.2–500.99440.180.60872.343.11
NaringeninY = 144.3x − 15.6440.2–500.99640.150.50833.303.98
KaempferolY = 145.1x − 13.070.2–500.99900.150.501443.354.30
HesperetinY = 47.795x − 32.5460.2–500.99840.120.40432.554.96
a Linear range (μg/mL). b Correlation coefficients (R2). c Limit of detection (μg/mL). d Limit of quantitation (μg/mL). e Enrichment factor. f Relative standard deviation.
Table 4. The recovery rates of nine kinds of flavonoids in real samples.
AnalytesSampleAmount Added (μg/mL)Recovery (%)AnalytesSampleAmount Added (μg/mL)Recovery (%)
CatechinW320104.97HesperidinW320103.88
D320103.71D32098.26
C22099.54C22099.34
YN120102.75YN12090.73
Z32097.73Z32089.10
ProtocatechinW32099.74NaringeninW32098.72
D320107.20D32096.87
C22094.99C22095.86
YN12098.28YN12091.33
Z320108.11Z32093.28
RutinW32093.48KaempferolW32088.19
D32094.70D32090.86
C22096.77C22086.34
YN12098.60YN12087.27
Z320104.15Z32085.97
HyperosideW32096.19HesperetinW32094.54
D32091.53D32093.64
C22093.33C22099.31
YN12097.02YN120104.32
Z320101.46Z320103.22
NaringinW32093.29
D32094.84
C22089.10
YN12091.84
Z32095.61
Table 5. The greenness profile of the proposed method using the eco-scale tool.
Items PPs
1. Reagent
Tricaprylylmethylammonium chlorideAmount<10 mL1
Hazard typeSignal word: warning1
Hazard amount1 pictogram1
Total PPs = 1
1,4-ButanediolAmount<10 mL1
Hazard typeSignal word: warning1
Hazard amount1 pictogram1
Total PPs = 1
methanolAmount<10 mL1
Hazard typeSignal word: danger2
Hazard amount3 pictograms3
Total PPs = 6
phosphoric acidAmount<10 mL1
Hazard typeSignal word: danger2
Hazard amount1 pictogram1
Total PPs = 2
acetonitrileAmount<10 mL1
Hazard typeSignal word: danger2
Hazard amount2 pictograms2
Total PPs = 2
2. Instruments
2.1. Energy (kW/h per sample)HPLC≤0.1 kWh per sample0
2.2. Occupational hazard Emission of vapors and gases to the air0
3.Waste
3.1. Waste amount >10 mL5
3.2. Waste treatment No treatment3
Total PPs = 8
Total penalty points = 20
Eco-scale score 100 − 20 = 80
Table 6. The greenness profile of the developed method using the GAPI.
GAPI Pictograms
Sample preparation Molecules 28 05619 i001
Collection (1)Off line (red)
Preservation (2) None (green)
Transport (3)Required (yellow)
Storage (4)Simple treatment (yellow)
Type of method
Direct or indirect (5)Extraction required (red)
Scale of extraction (6)Micro-extraction (yellow)
Solvents/reagents used (7)Green solvents for extraction (yellow)
Additional treatments (8)No additional treatment (green)
Reagent and solvents
Amount (9)<10 mL (green)
Health hazard (10)NFPA = 1; slightly toxicity(green)
Safety hazard (11)NFPA = 3; high flammability (yellow)
Instrumentation
Energy (12)≤0.1 kw h per sample (green)
Occupational hazard (13)Hermetic sealing of analytical procedure (green)
Waste (14)>10 mL (>10 g)
Waste treatment (15)No treatment (red)
Table 7. AGREE results of reported studies for determining flavonoids in SAV.
ReferenceActual Work[44][45][46]
Sample Preparation VALLMEUAEDLLMEDLLME
Extraction solventTOMAC: BDO, 1:6 (150 μL)60% Ethanol (33.6 mL)CHCl3 (450 μL)chloroform (150 µL)
Sample (g/mL)3.5 mL2 g10 mL10 g
DetectionHPLCUVUHPLC–UV analysisLC-DAD-ESI-ToFMS
AGREE plotMolecules 28 05619 i002Molecules 28 05619 i003Molecules 28 05619 i004Molecules 28 05619 i005
Table 8. Comparison of the developed method with other methods for the analysis of the flavonoids.
MethodSampleAnalytesAnalytical TechniqueLRLODRSD (%)Ref.
Intra-DayInter-Day
DES-HLLMEScutellariae Radix6 kinds of flavonoidsHPLC-UV0.0022–8.65
mg/L
≤8.0 g/L0.1–7.80.2–9.2[47]
Ultrasonic extractionDalbergia odorifera17 kinds of flavonoidsUHPLC-MS/MS0.516–5652
ng/mL
0.085–1.790
g/mL
0.45–3.511.26–4.94[48]
SPEChinese wolfberry, orange juice and wine samples4 kinds of flavonoidsHPLC1–500
ng/mL
0.15–0.41
ng/mL
2.64–4.563.64–4.20[49]
UAEHawk tea3 kinds of flavonoidsUPLC-DAD0.36–880
μg/mL
0.086–0.308 μg/mL1.16–4.181.63–4.26[50]
MSPE-DESorange, apple, onion and green tea4 kinds of flavonoidsHPLC-UV0.03–0.14
μg/L
0.1–0.5
ng/mL
≤5.4≤5.6[51]
CF-ASMEGinkgo biloba and Platycladus orientalis5 kinds of flavonoidsHPLC-UV0.01–5
μg/mL
0.5–30
ng/mL
1.8–12.63.3–12.8[52]
DES-VALLMEShanxi aged vinegar9 kinds of flavonoidsHPLC0.20–50.00 μg/mL0.09–0.18
μg/mL
2.34–3.773.04–4.96This work
Table 9. Types of different DES.
DESHBAHBDMolar Ratio
DES1Tricaprylylmethylammonium chloriden-Caprylic acid1:2
DES2Tricaprylylmethylammonium chlorideEthylene glycol1:3
DES3Tricaprylylmethylammonium chloride2,3-Butanediol1:2
DES4Tricaprylylmethylammonium chloride1,3-Butanediol1:3
DES5Tricaprylylmethylammonium chloride1,4-Butanediol1:6
Disclaimer/Publisher’s Note: The statements, opinions and data contained in all publications are solely those of the individual author(s) and contributor(s) and not of MDPI and/or the editor(s). MDPI and/or the editor(s) disclaim responsibility for any injury to people or property resulting from any ideas, methods, instructions or products referred to in the content.

