
Quality Marker Discovery and Quality Evaluation of Eucommia ulmoides Pollen Using UPLC-QTOF-MS Combined with a DPPH-HPLC Antioxidant Activity Screening Method
 ,
,
Abstract
:1. Introduction
2. Results
2.1. UPLC-ESI-TOF/MS Analysis
2.1.1. Identification of Lignins
2.1.2. Identification of Iridoids
2.1.3. Identification of Phenylpropanoids
2.1.4. Identification of Flavonoids
2.2. HPLC-DPPH Analysis
2.3. Preparation and Identification of the Target Antioxidants
2.3.1. Preparation of Q-Markers by Semi-Prep-HPLC
2.3.2. Structural Identification
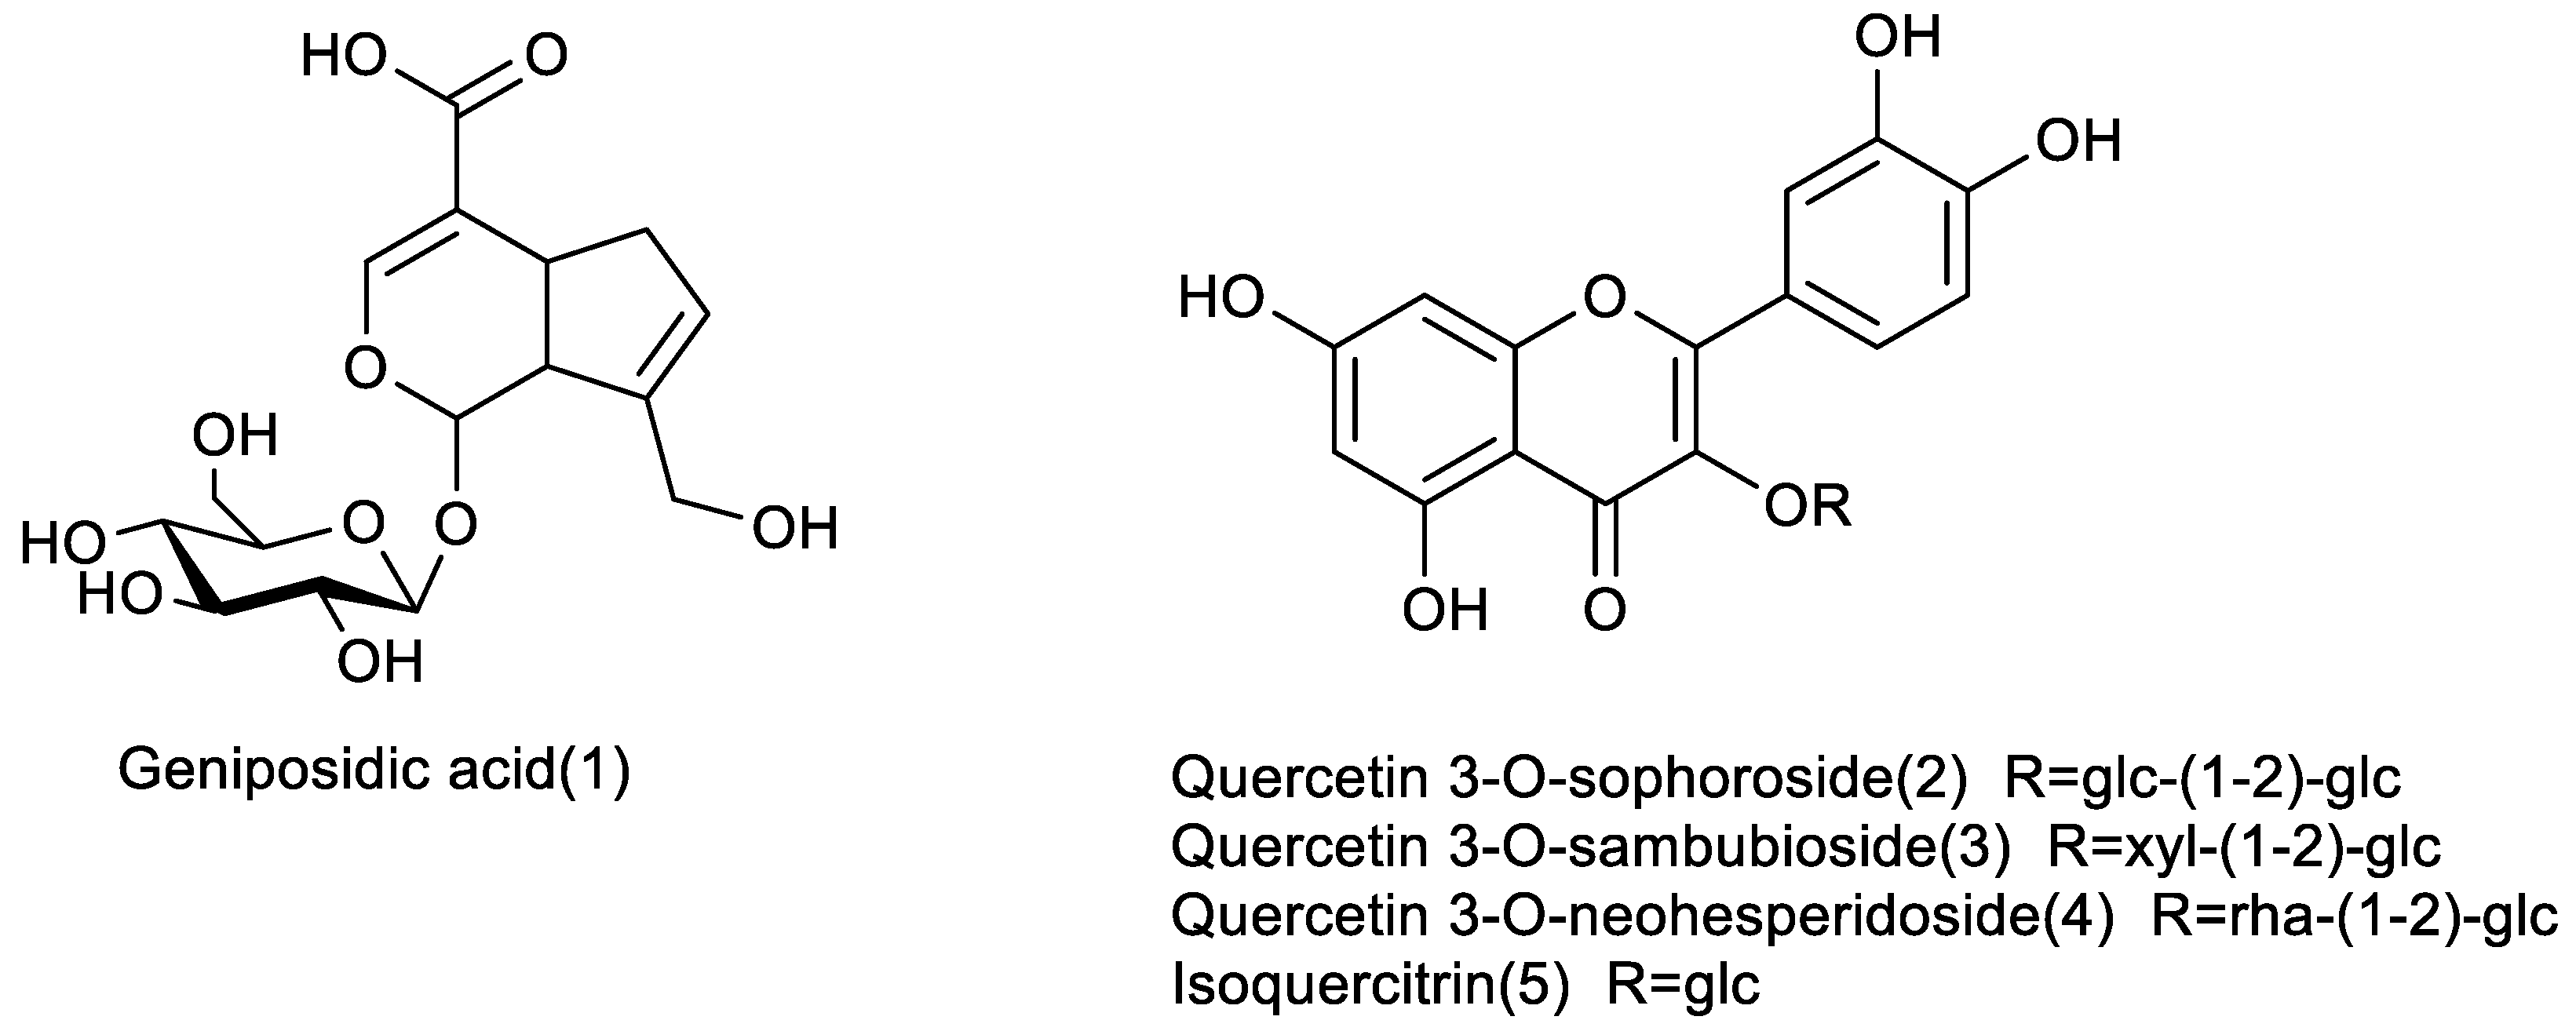
- Compound 2: yellow powder. ESI-MS (m/z): 627.1585 [M + H]+ (positive), 625.1428 [M − H]− (negative), C27H30O17 (Cal: 626.1483). Compound 2 was identified as 5,7,3′,4′-tetrahydroxyflavone, known as quercetin-3-O-sophoroside, by an analysis of the 1H-1H correlation spectroscopy (COSY), heteronuclear multiple-quantum correlation (HMQC), and heteronuclear multiple-bond correlation (HMBC) spectra (Figures S3 and S4). A large coupling constant (J = 7.3 Hz, 7.9 Hz) for the anomeric proton (δH 5.70, δH 4.60) of the glucose in the 1H-NMR spectrum suggested a β-configuration in glucose. In the HMBC spectrum, δH 5.70 (H-1 of 3-O-Glc) correlated with δC 133.4 (C-3), δC 76.97(C-3″), and δC 98.46(C-1″), and δH 4.60 (H-1 of Glc) correlated with δC 83.14(C-2″) and δC 74.82(C-3‴). The glucose C-2″ signal appeared at δC 83.14, while that of C-2‴ appeared at δC 74.82, suggesting that the inter glycosidic linkage was glucose-(1→2)-glucose. The obtained NMR data are consistent with those of previous research [37,38]. QSH was isolated from EUP for the first time.
- Compound 3: light yellow powder. ESI-MS (m/z): 597.1471 [M + H]+ (positive), 595.1340 [M − H]− (negative), C26H28O16 (Cal: 596.1378). Compound 3 was also identified as 5,7,3′,4’-tetrahydroxyflavone, known as quercetin-3-O-sambubioside, by comparison with previously reported spectral data [39]. The β-configuration of the glucopyranosyl group was indicated based on the large coupling constants (J1,3 = 7.7 Hz) of the anomeric protons. In the HMBC spectrum (Figures S2 and S4), the correlation of δH 5.68 (H-1 of 3-O-glc) with δC 133.31 (C-3) and the correlation of δH 4.55 (H-1 of Xyl) with δC 82.25 (C-2″) were observed, which indicated that the sequence of the saccharide chain of C-3 was xylosyl-(1→2)-glucopyranosyl-(1→3). QSB was also isolated from EUP for the first time.
- Compound 4: light yellow powder. ESI-MS (m/z): 611.1620 [M + H]+ (positive), 609.1487 [M − H]− (negative), C27H30O16 (Cal: 610.1534). Compound 4 was identified as quercetin 3-O-neohesperidoside (QNH) by comparison with previously reported spectral data [40,41]. The β-configuration of the glucopyranosyl group was indicated based on the large coupling constants (J1,3 > 7.0 Hz) of the anomeric protons. In the HMBC spectrum (Figures S3 and S6), the correlation of δH 5.64 (H-1 of 3-O-Glc) with δC 133.30 (C-3) and δC 77.74 (C-3″) and the correlation of δH 5.07 (H-1, Rha) with δC 77.84 (C-2″) were observed, which indicated that the sequence of the saccharide chain of C-3 was rhamnopyranosyl-(1→2)-glucopyranosyl-(1→3). QNH was isolated from EU for the first time.
2.4. Results of the Molecular Docking
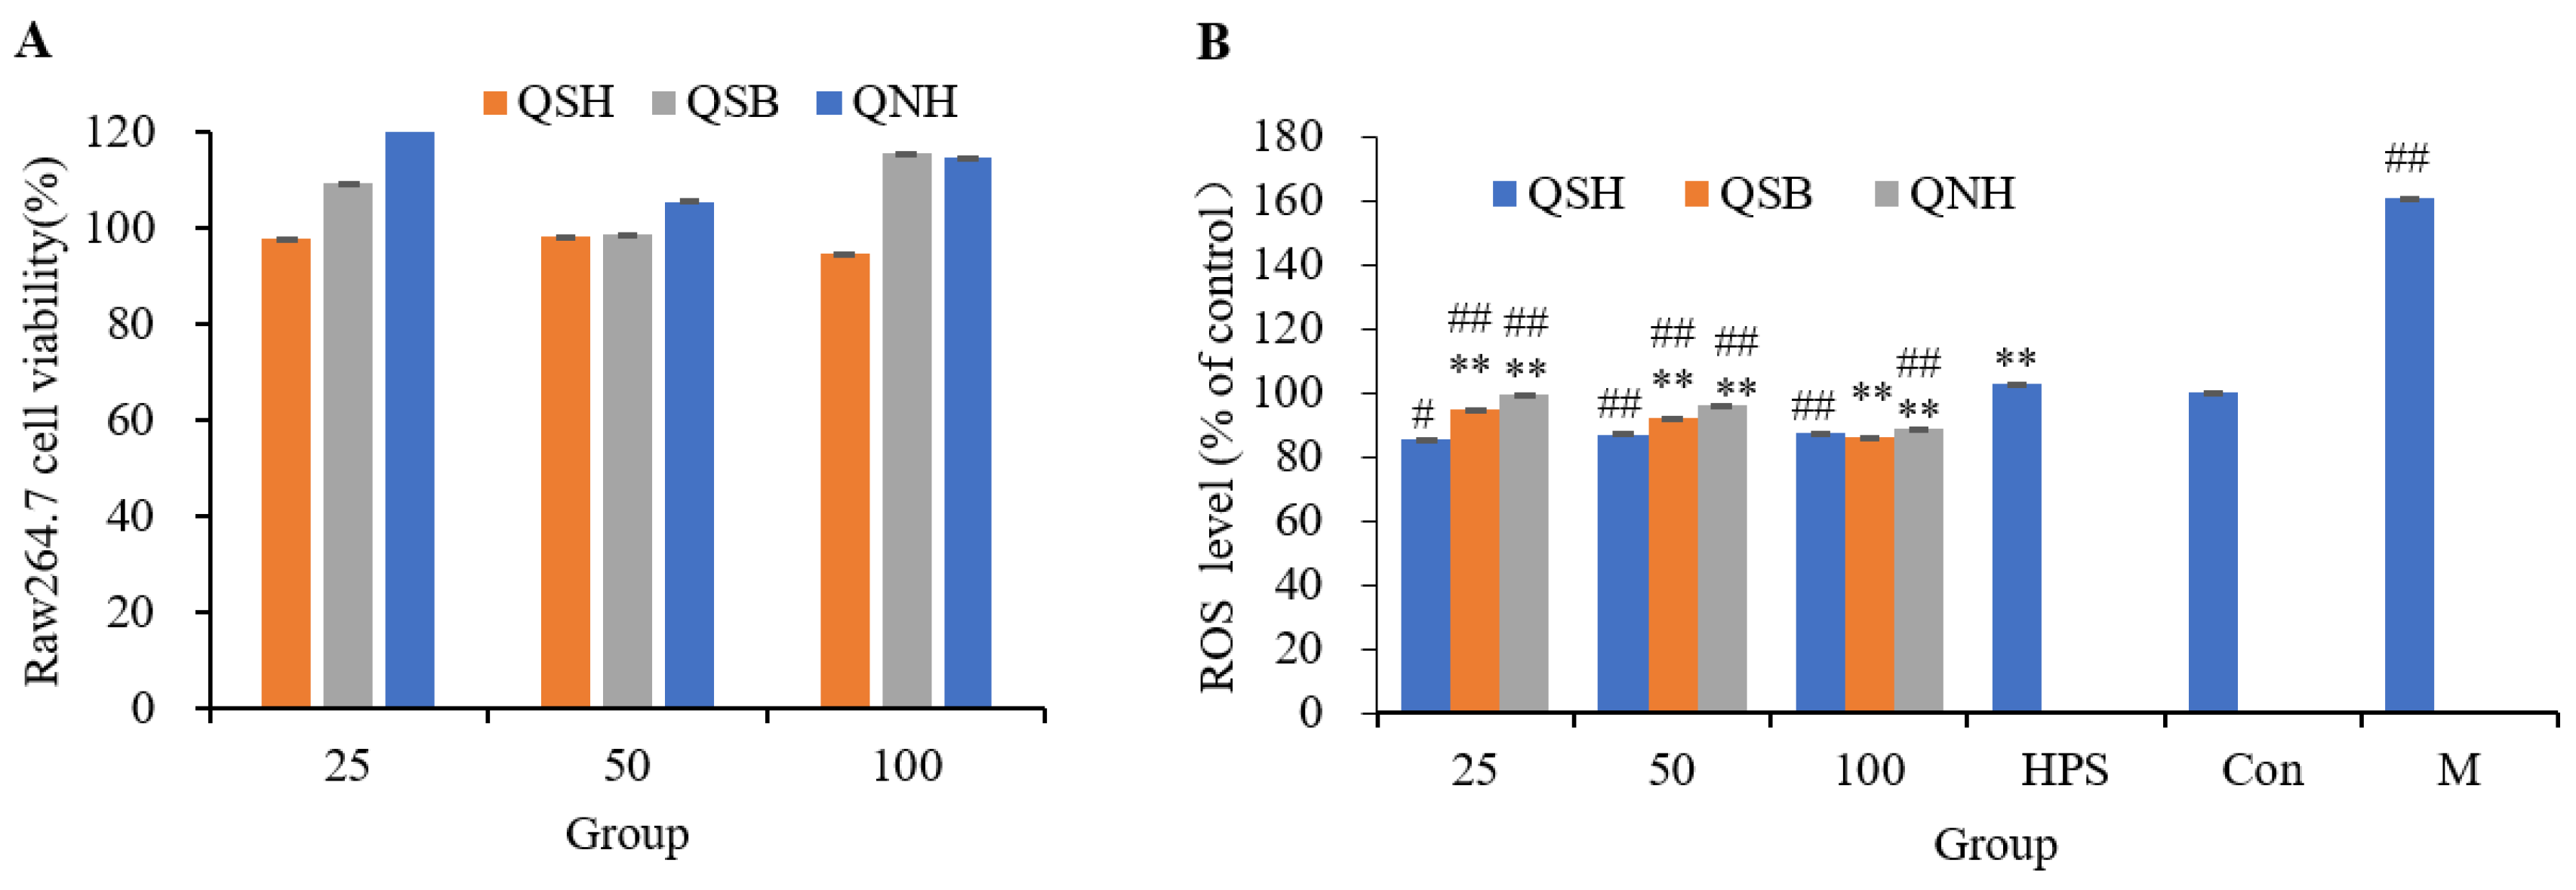
2.5. Cytotoxicity Assay and the Antioxidant Effect
2.6. Development and Validation of the Quality Standard
2.6.1. Optimization of the Extraction
2.6.2. Optimization of Chromatographic Conditions
2.6.3. Validation of the Analytical Method
2.6.4. Sample Analysis
3. Discussion
4. Materials and Methods
4.1. Materials and Apparatus
4.2. Preparation of Sample
4.3. UPLC-ESI-TOF/MS Analysis
4.4. Screening Active Compounds by HPLC-DPPH
4.5. Preparation and Characterization of the Main Active Components
4.5.1. Analytical Condition
4.5.2. The Derivatization Procedures of Quercetin Di-Glycoside
4.5.3. Nuclear Magnetic Resonance Spectroscopy (NMR)
4.6. Molecular Docking
4.7. Antioxidant Activity Evaluation of Each Compound
4.7.1. Cell Culture and Cell Viability Assay
4.7.2. Detection of Intracellular ROS Generation
4.8. Development and Validation of the Quality Standard
4.8.1. Chromatographic Conditions
4.8.2. Validation of the Method
4.9. Statistical Analysis
5. Conclusions
Supplementary Materials
Author Contributions
Funding
Institutional Review Board Statement
Informed Consent Statement
Data Availability Statement
Conflicts of Interest
Sample Availability
Abbreviations
| EU | Eucommia ulmoides Oliver |
| EUP | the pollen of Eucommia ulmoides Oliver |
| EUF | Male flowers of Eucommia ulmoides Oliver |
| DPPH | 2,2-Diphenyl-1-picrylhydrazyl |
| HPLC | high-performance liquid chromatography |
| NMR | nuclear magnetic resonance |
| QSH | quercetin-3-O-sophoroside |
| QSB | quercetin-3-O-sambubioside |
| QNH | quercetin 3-O-neohesperidoside |
| NHC | the National Health Commission |
References
- Zhao, Y.; Tan, D.C.; Peng, B.; Yang, L.; Zhang, S.Y.; Shi, R.P.; Chong, C.M.; Zhong, Z.F.; Wang, S.P.; Liang, Q.L.; et al. Neuroendocrine-Immune Regulatory Network of Eucommia ulmoides Oliver. Molecules 2022, 27, 3697. [Google Scholar] [CrossRef]
- Wang, C.Y.; Tang, L.; He, J.W.; Li, J.; Wang, Y.Z. Ethnobotany, Phytochemistry and Pharmacological Properties of Eucommia ulmoides: A Review. Am. J. Chin. Med. 2019, 47, 259–300. [Google Scholar] [CrossRef] [PubMed]
- Hung, M.-Y.; Fu, T.Y.-C.; Shih, P.-H.; Lee, C.-P.; Yen, G.-C. Du-Zhong (Eucommia ulmoides Oliv.) leaves inhibits CCl4-induced hepatic damage in rats. Food Chem. Toxicol. 2006, 44, 1424–1431. [Google Scholar] [CrossRef] [PubMed]
- Hosoo, S.; Koyama, M.; Kato, M.; Hirata, T.; Yamaguchi, Y.; Yamasaki, H.; Wada, A.; Wada, K.; Nishibe, S.; Nakamura, K. The Restorative Effects of Eucommia ulmoides Oliver Leaf Extract on Vascular Function in Spontaneously Hypertensive Rats. Molecules 2015, 20, 21971–21981. [Google Scholar] [CrossRef] [PubMed] [Green Version]
- Liu, B.; Li, C.P.; Wang, W.Q.; Song, S.G.; Liu, X.M. Lignans Extracted from Eucommia Ulmoides Oliv. Protects Against AGEs-Induced Retinal Endothelial Cell Injury. Cell. Physiol. Biochem. Int. J. Exp. Cell. Physiol. Biochem. Pharmacol. 2016, 39, 2044–2054. [Google Scholar] [CrossRef]
- Xiao, D.; Yuan, D.; Tan, B.; Wang, J.; Liu, Y.; Tan, B. The Role of Nrf2 Signaling Pathway in Eucommia ulmoides Flavones Regulating Oxidative Stress in the Intestine of Piglets. Oxid Med. Cell Longev. 2019, 2019, 9719618. [Google Scholar] [CrossRef] [Green Version]
- Park, S.A.; Choi, M.S.; Jung, U.J.; Kim, M.J.; Kim, D.J.; Park, H.M.; Park, Y.B.; Lee, M.K. Eucommia ulmoides Oliver leaf extract increases endogenous antioxidant activity in type 2 diabetic mice. J. Med. Food 2006, 9, 474–479. [Google Scholar] [CrossRef]
- Shi, S.; Guo, K.; Tong, R.; Liu, Y.; Tong, C.; Peng, M. Online extraction-HPLC-FRAP system for direct identification of antioxidants from solid Du-zhong brick tea. Food Chem. 2019, 288, 215–220. [Google Scholar] [CrossRef]
- Jia, C.-F.; Yu, W.-N.; Zhang, B.-L. Manufacture and antibacterial characteristics of Eucommia ulmoides leaves vinegar. Food Sci. Biotechnol. 2020, 29, 657–665. [Google Scholar] [CrossRef]
- Wang, J.-Y.; Yuan, Y.; Chen, X.-J.; Fu, S.-G.; Zhang, L.; Hong, Y.-L.; You, S.-F.; Yang, Y.-Q. Extract from Eucommia ulmoides Oliv. ameliorates arthritis via regulation of inflammation, synoviocyte proliferation and osteoclastogenesis in vitro and in vivo. J. Ethnopharmacol. 2016, 194, 609–616. [Google Scholar] [CrossRef] [Green Version]
- Xie, G.-P.; Jiang, N.; Wang, S.-N.; Qi, R.-Z.; Wang, L.; Zhao, P.-R.; Liang, L.; Yu, B. Eucommia ulmoides Oliv. bark aqueous extract inhibits osteoarthritis in a rat model of osteoarthritis. J. Ethnopharmacol. 2015, 162, 148–154. [Google Scholar] [CrossRef] [PubMed]
- Sun, Y.; Huang, K.; Mo, L.; Ahmad, A.; Wang, D.; Rong, Z.; Peng, H.; Cai, H.; Liu, G. Eucommia ulmoides Polysaccharides Attenuate Rabbit Osteoarthritis by Regulating the Function of Macrophages. Front. Pharmacol. 2021, 12, 730557. [Google Scholar] [CrossRef] [PubMed]
- Han, R.; Yu, Y.; Zhao, K.; Wei, J.; Hui, Y.; Gao, J.M. Lignans from Eucommia ulmoides Oliver leaves exhibit neuroprotective effects via activation of the PI3K/Akt/GSK-3β/Nrf2 signaling pathways in H(2)O(2)-treated PC-12 cells. Phytomed. Int. J. Phytother. Phytopharm. 2022, 101, 154124. [Google Scholar] [CrossRef]
- Hu, W.; Wang, G.; Li, P.; Wang, Y.; Si, C.L.; He, J.; Long, W.; Bai, Y.; Feng, Z.; Wang, X. Neuroprotective effects of macranthoin G from Eucommia ulmoides against hydrogen peroxide-induced apoptosis in PC12 cells via inhibiting NF-κB activation. Chem. Biol. Interact. 2014, 224, 108–116. [Google Scholar] [CrossRef]
- Kobayashi, Y.; Hiroi, T.; Araki, M.; Hirokawa, T.; Miyazawa, M.; Aoki, N.; Kojima, T.; Ohsawa, T. Facilitative effects of Eucommia ulmoides on fatty acid oxidation in hypertriglyceridaemic rats. J. Sci. Food Agric. 2012, 92, 358–365. [Google Scholar] [CrossRef] [PubMed]
- Park, S.A.; Choi, M.S.; Kim, M.J.; Jung, U.J.; Kim, H.J.; Park, K.K.; Noh, H.J.; Park, H.M.; Park, Y.B.; Lee, J.S.; et al. Hypoglycemic and hypolipidemic action of Du-zhong (Eucommia ulmoides Oliver) leaves water extract in C57BL/KsJ-db/db mice. J. Ethnopharmacol. 2006, 107, 412–417. [Google Scholar] [CrossRef]
- Ishimitsu, A.; Tojo, A.; Satonaka, H.; Ishimitsu, T. Eucommia ulmoides (Tochu) and its extract geniposidic acid reduced blood pressure and improved renal hemodynamics. Biomed. Pharmacother. Biomed. Pharmacother. 2021, 141, 111901. [Google Scholar] [CrossRef]
- Yan, D.; Si, W.; Zhou, X.; Yang, M.; Chen, Y.; Chang, Y.; Lu, Y.; Liu, J.; Wang, K.; Yan, M.; et al. Eucommia ulmoides bark extract reduces blood pressure and inflammation by regulating the gut microbiota and enriching the Parabacteroides strain in high-salt diet and N(omega)-nitro-l-arginine methyl ester induced mice. Front. Microbiol. 2022, 13, 967649. [Google Scholar] [CrossRef] [PubMed]
- Luo, L.-F.; Wu, W.-H.; Zhou, Y.-J.; Yan, J.; Yang, G.-P.; Ouyang, D.-S. Antihypertensive effect of Eucommia ulmoides Oliv. extracts in spontaneously hypertensive rats. J. Ethnopharmacol. 2010, 129, 238–243. [Google Scholar] [CrossRef] [PubMed]
- Feng, H.; Fan, J.; Song, Z.; Du, X.; Chen, Y.; Wang, J.; Song, G. Characterization and immunoenhancement activities of Eucommia ulmoides polysaccharides. Carbohydr. Polym. 2016, 136, 803–811. [Google Scholar] [CrossRef]
- He, X.; Wang, J.; Li, M.; Hao, D.; Yang, Y.; Zhang, C.; He, R.; Tao, R. Eucommia ulmoides Oliv.: Ethnopharmacology, phytochemistry and pharmacology of an important traditional Chinese medicine. J. Ethnopharmacol. 2014, 151, 78–92. [Google Scholar] [CrossRef]
- Kostić, A.; Milinčić, D.D.; Barać, M.B.; Shariati, M.A.; Tešić, Ž.L.; Pešić, M.B. The Application of Pollen as a Functional Food and Feed Ingredient-The Present and Perspectives. Biomolecules 2020, 10, 84. [Google Scholar] [CrossRef] [PubMed] [Green Version]
- Khalifa, S.A.M.; Elashal, M.H.; Yosri, N.; Du, M.; Musharraf, S.G.; Nahar, L.; Sarker, S.D.; Guo, Z.; Cao, W.; Zou, X.; et al. Bee Pollen: Current Status and Therapeutic Potential. Nutrients 2021, 13, 1876. [Google Scholar] [CrossRef]
- Laaroussi, H.; Ferreira-Santos, P.; Genisheva, Z.; Bakour, M.; Ousaaid, D.; El Ghouizi, A.; Teixeira, J.A.; Lyoussi, B. Unveiling the techno-functional and bioactive properties of bee pollen as an added-value food ingredient. Food Chem. 2023, 405, 134958. [Google Scholar] [CrossRef]
- Mărgăoan, R.; Stranț, M.; Varadi, A.; Topal, E.; Yücel, B.; Cornea-Cipcigan, M.; Campos, M.G.; Vodnar, D.C. Bee Collected Pollen and Bee Bread: Bioactive Constituents and Health Benefits. Antioxidants 2019, 8, 568. [Google Scholar] [CrossRef] [Green Version]
- Zhang, H.; Liu, R.; Lu, Q. Separation and Characterization of Phenolamines and Flavonoids from Rape Bee Pollen, and Comparison of Their Antioxidant Activities and Protective Effects against Oxidative Stress. Molecules 2020, 25, 1264. [Google Scholar] [CrossRef] [PubMed] [Green Version]
- Zhou, W.; Zhao, Y.; Yan, Y.; Mi, J.; Lu, L.; Luo, Q.; Li, X.; Zeng, X.; Cao, Y. Antioxidant and immunomodulatory activities in vitro of polysaccharides from bee collected pollen of Chinese wolfberry. Int. J. Biol. Macromol. 2020, 163, 190–199. [Google Scholar] [CrossRef] [PubMed]
- Ma, R. Study on the PRIMARY Metabolites and Secondary Metabolites in Pollen of Eucommia ulmoides Oliv. Master’s Thesis, Northwest A&F University, Xianyang, China, 2008. [Google Scholar]
- Ding, Z. The Study of Eucommia Pollen on Blood Pressure Reduction and Its Mechanism in Spontaneously Hypertensive Rats. Master’s Thesis, Henan University, Zhengzhou, China, 2019. [Google Scholar]
- Chen, B. Hypolipidemic Effects of Eucommia ulmoides Oliver Pollen in a High-Fat Dietinducel Rat Model of Hyperlipidemia. Master’s Thesis, Henan University, Zhengzhou, China, 2020. [Google Scholar]
- Xu, Y.; Cao, X.; Zhao, H.; Yang, E.; Wang, Y.; Cheng, N.; Cao, W. Impact of Camellia japonica Bee Pollen Polyphenols on Hyperuricemia and Gut Microbiota in Potassium Oxonate-Induced Mice. Nutrients 2021, 13, 2665. [Google Scholar] [CrossRef]
- Cheng, N.; Ren, N.; Gao, H.; Lei, X.; Zheng, J.; Cao, W. Antioxidant and hepatoprotective effects of Schisandra chinensis pollen extract on CCl4-induced acute liver damage in mice. Food Chem. Toxicol. Int. J. Publ. Br. Ind. Biol. Res. Assoc. 2013, 55, 234–240. [Google Scholar] [CrossRef]
- Hu, F.; An, J.; Li, W.; Zhang, Z.; Chen, W.; Wang, C.; Wang, Z. UPLC-MS/MS determination and gender-related pharmacokinetic study of five active ingredients in rat plasma after oral administration of Eucommia cortex extract. J. Ethnopharmacol. 2015, 169, 145–155. [Google Scholar] [CrossRef]
- He, M.; Jia, J.; Li, J.; Wu, B.; Huang, W.; Liu, M.; Li, Y.; Yang, S.; Ouyang, H.; Feng, Y. Application of characteristic ion filtering with ultra-high performance liquid chromatography quadrupole time of flight tandem mass spectrometry for rapid detection and identification of chemical profiling in Eucommia ulmoides Oliv. J. Chromatogr. A 2018, 1554, 81–91. [Google Scholar] [CrossRef]
- Huang, Q.; Zhang, F.; Liu, S.; Jiang, Y.; Ouyang, D. Systematic investigation of the pharmacological mechanism for renal protection by the leaves of Eucommia ulmoides Oliver using UPLC-Q-TOF/MS combined with network pharmacology analysis. Biomed. Pharmacother. 2021, 140, 111735. [Google Scholar] [CrossRef] [PubMed]
- Chai, X.; Wang, Y.; Su, Y.; Bah, A.J.; Hu, L.; Gao, Y.; Gao, X. A rapid ultra performance liquid chromatography-tandem mass spectrometric method for the qualitative and quantitative analysis of ten compounds in Eucommia ulmodies Oliv. J. Pharm. Biomed. Anal. 2012, 57, 52–61. [Google Scholar] [CrossRef]
- Sun, C.; Nile, S.H.; Zhang, Y.; Qin, L.; El-Seedi, H.R.; Daglia, M.; Kai, G. Novel Insight into Utilization of Flavonoid Glycosides and Biological Properties of Saffron (Crocus sativus L.) Flower Byproducts. J. Agric. Food Chem. 2020, 68, 10685–10696. [Google Scholar] [CrossRef]
- Wang, Y.; Berhow, M.A.; Black, M.; Jeffery, E.H. A comparison of the absorption and metabolism of the major quercetin in brassica, quercetin-3-O-sophoroside, to that of quercetin aglycone, in rats. Food Chem. 2020, 311, 125880. [Google Scholar] [CrossRef] [PubMed]
- Dai, X.; Huang, Q.; Zhou, B.; Gong, Z.; Liu, Z.; Shi, S. Preparative isolation and purification of seven main antioxidants from Eucommia ulmoides Oliv. (Du-zhong) leaves using HSCCC guided by DPPH-HPLC experiment. Food Chem. 2013, 139, 563–570. [Google Scholar] [CrossRef] [PubMed]
- Zhou, X.; Peng, J.; Fan, G.; Wu, Y. Isolation and purification of flavonoid glycosides from Trollius ledebouri using high-speed counter-current chromatography by stepwise increasing the flow-rate of the mobile phase. J. Chromatogr. A 2005, 1092, 216–221. [Google Scholar] [CrossRef]
- Abdelhameed, R.F.A.; Ibrahim, A.K.; Elfaky, M.A.; Habib, E.S.; Mahamed, M.I.; Mehanna, E.T.; Darwish, K.M.; Khodeer, D.M.; Ahmed, S.A.; Elhady, S.S. Antioxidant and Anti-Inflammatory Activity of Cynanchum acutum L. Isolated Flavonoids Using Experimentally Induced Type 2 Diabetes Mellitus: Biological and In Silico Investigation for NF-κB Pathway/miR-146a Expression Modulation. Antioxidants 2021, 10, 1713. [Google Scholar] [CrossRef]
- Teven, S.; Frenis, K.; Oelze, M.; Kalinovic, S.; Kuntic, M.; Bayo Jimenez, M.T.; Vujacic-Mirski, K.; Helmstädter, J.; Kröller-Schön, S.; Münzel, T.; et al. Vascular Inflammation and Oxidative Stress: Major Triggers for Cardiovascular Disease. Oxid. Med. Cell Longev. 2019, 2019, 7092151. [Google Scholar]
- Bai, R.; Guo, J.; Ye, X.-Y.; Xie, Y.; Xie, T. Oxidative stress: The core pathogenesis and mechanism of Alzheimer’s disease. Ageing Res. Rev. 2022, 77, 101619. [Google Scholar] [CrossRef]
- Bisht, S.; Faiq, M.; Tolahunase, M.; Dada, R. Oxidative stress and male infertility. Nat. Rev. Urol. 2017, 14, 470–485. [Google Scholar] [CrossRef]
- Evans, E.P.; Scholten, J.T.; Mzyk, A.; Reyes-San-Martin, C.; Llumbet, A.E.; Hamoh, T.; Arts, E.G.; Schirhagl, R.; Cantineau, A.E. Male subfertility and oxidative stress. Redox Biol. 2021, 46, 102071. [Google Scholar] [CrossRef]
- Sosa, V.; Moliné, T.; Somoza, R.; Paciucci, R.; Kondoh, H.; Lleonart, M.E. Oxidative stress and cancer: An overview. Ageing Res. Rev. 2013, 12, 376–390. [Google Scholar] [CrossRef] [PubMed]
- Flieger, J.; Flieger, M. The [DPPH·/DPPH-H]-HPLC-DAD Method on Tracking the Antioxidant Activity of Pure Antioxidants and Goutweed (Aegopodium podagraria L.) Hydroalcoholic Extracts. Molecules 2020, 25, 6005. [Google Scholar] [CrossRef]
- Boudier, A.; Tournebize, J.; Bartosz, G.; El Hani, S.; Bengueddour, R.; Sapin-Minet, A.; Leroy, P. High-performance liquid chromatographic method to evaluate the hydrogen atom transfer during reaction between 1,1-diphenyl-2-picryl-hydrazyl radical and antioxidants. Anal. Chim. Acta 2012, 711, 97–106. [Google Scholar] [CrossRef]
- Pedan, V.; Fischer, N.; Bernath, K.; Hühn, T.; Rohn, S. Determination of oligomeric proanthocyanidins and their antioxidant capacity from different chocolate manufacturing stages using the NP-HPLC-online-DPPH methodology. Food Chem. 2017, 214, 523–532. [Google Scholar] [CrossRef]
- Arora, R.; Sawney, S.; Saini, V.; Steffi, C.; Tiwari, M.; Saluja, D. Esculetin induces antiproliferative and apoptotic response in pancreatic cancer cells by directly binding to KEAP1. Mol. Cancer 2016, 15, 64. [Google Scholar] [CrossRef] [PubMed] [Green Version]
- Chen, H.; Nguyen, N.H.; Magtoto, C.M.; Cobbold, S.A.; Bidgood, G.M.; Guzman, L.G.M.; Richardson, L.W.; Corbin, J.; Au, A.E.; Lechtenberg, B.C.; et al. Design and characterization of a heterobifunctional degrader of KEAP1. Redox Biol. 2023, 59, 102552. [Google Scholar] [CrossRef] [PubMed]
- Zhu, L.; He, S.; Huang, L.; Ren, D.; Nie, T.; Tao, K.; Xia, L.; Lu, F.; Mao, Z.; Yang, Q. Chaperone-mediated autophagy degrades Keap1 and promotes Nrf2-mediated antioxidative response. Aging Cell 2022, 21, e13616. [Google Scholar] [CrossRef] [PubMed]
- Rubio-Senent, F.; Lama-Muñoz, A.; Rodríguez-Gutiérrez, G.; Fernández-Bolaños, J. Isolation and identification of phenolic glucosides from thermally treated olive oil byproducts. J. Agric. Food Chem. 2013, 61, 1235–1248. [Google Scholar] [CrossRef] [PubMed]
- Bai, M.-M.; Shi, W.; Tian, J.-M.; Lei, M.; Kim, J.H.; Sun, Y.N.; Kim, Y.H.; Gao, J.-M. Soluble Epoxide Hydrolase Inhibitory and Anti-inflammatory Components from the Leaves of Eucommia ulmoides Oliver (Duzhong). J. Agric. Food Chem. 2015, 63, 2198–2205. [Google Scholar] [CrossRef] [PubMed]


| Peak Number | tR/(min) | Molecular Weight | [M + H]+/[M + Na]+/[M + NH4]+ (Error, ppm) | [M − H]−/[M + HCOO]− (Error, ppm) | MS/MS Fragments (P) | MS/MS Fragments (N) | Molecular Formula | Compound | Part |
|---|---|---|---|---|---|---|---|---|---|
| 1 | 0.85 | 342.1162 | 365.1049 (−1.4) | 387.1140 (0.35) | 163.0633, 119.0341, 225.0872, 164.0695 | 191.0561, 195.0515, 129.0197, 101.0244 | C12H22O11 | Isomaltose | EUB, EUL, EUF, EUP |
| 2 | 0.91 | 164.0473 | 182.0802 (−2.7) | 145.0482, 131.0497, 119.0479, 149.0592 | C9H8O3 | p-coumaric acid | EUL, EUF, EUP | ||
| 3 | 2.61 | 350.1577 | 373.1462 (−1.9) | 395.1553 (−0.1) | 135.0785, 153.0897 | 195.0287, 153.0540, 149.0614 | C15H26O9 | Eucommiol II | EUB, EUL |
| 4 | 2.80 | 350.1577 | 373.146 (−2.4) | 395.1556 (0.7) | 135.0785, 153.0897 | 195.0287, 153.0540, 149.0614 | C15H26O9 | Eucommiol II isomer | EUB, EUL |
| 5 | 3.44 | 346.1264 | 369.1149 (3.3) | 311.1122, 149.0590, 131.0484 | C15H22O9 | Aucubin * | EUL, EUF, EUP | ||
| 6 | 3.44 | 392.1319 | 391.124 (−0.1) | 295.1032, 345.1188, 227.0565, 183.0664 | C16H24O11 | Reptoside | EUB, EUL, EUF, EUP | ||
| 7 | 3.74 | 390.1162 | 413.1052 (−1.9) | 389.1078 (−1.5) | 193.0480, 175.0373, 147.0429 | 371.0977, 227.0510, 165.0563 | C16H22O11 | Scandoside | EUB, EUL, EUF, EUP |
| 8 | 4.07 | 154.0266 | 155.0339 (−3.4) | 153.0192 (2.7) | 137.0238 | 109.0312 | C7H6O4 | Protocatechuic acid | EUB, EUL, EUF, EUP |
| 9 | 6.75 | 212.0685 | 213.0756 (−3.3) | 211.0613 (3.09) | 195.0647, 177.0538 | 149.0613, 193.0501 | C10H12O5 | C-veratroylglycol | EUB, EUL, EUF, EUP |
| 10 | 6.98 | 374.1213 | 397.1092 (−4.7) | 373.1132 (−0.7) | 357.1173, 177.0544, 149.0593, 195.0649 | 211.0606, 193.0627, 167.0706, 149.0600, 123.0443 | C16H22O10 | Geniposidic acid * | EUB, EUL, EUF, EUP |
| 11 | 6.99 | 404.1319 | 449.1295 (−0.0) | 353.0863, 211.0611, 149.0608, 373.1136, 353.0863 | C17H24O11 | Deacetyl asperulosidic acid methyl ester | EUB, EUL, EUF, EUP | ||
| 12 | 8.56 | 290.079 | 291.0855 (−4.7) | 147.0428, 139.0374, 131.0479 | C15H14O6 | Catechin | EUL, EUF, EUP | ||
| 13 | 8.72 | 432.1268 | 450.1606 (−1.22) | 431.1179 (−2.4) | 175.0388, 147.0435, 119.0485, 193.0522 | 373.1125, 257.1029, 211.0611, 251.0562 | C18H24O12 | Asperuloside acid * | EUL, EUF, EUP |
| 14 | 8.77 | 354.0951 | 353.0854 (−2.4) | 191.0565, 173.0457, 307.0816, 133.0295 | C16H18O9 | Chlorogenic acid * | EUB, EUL, EUF | ||
| 15 | 8.79 | 332.1107 | 355.1018 (3.7) | 181.0477, 179.0325 | C14H20O9 | Koaburaside | EUB, EUL, EUF, EUP | ||
| 16 | 8.87 | 700.2579 | 718.2905 (−2.4) | 745.2551 (1.2) | 341.1376, 323.1269, 217.0853, 137.0584 | 699.2483, 583.1983, 537.1973, 375.1438, 341.1375, 359.1476, 195.0661, 137.0586 | C32H44O17 | Olivil 4,4″-di-O-b-d-glucopyranoside | EUB, EUF |
| 17 | 8.93 | 180.0423 | 181.0499 (−1.0) | 179.0344 (−0.2) | 163.1225 | 135.0445, 161.0405, 117.0338 | C9H8O4 | Caffeic acid * | EUB, EUL, EUF, EUP |
| 18 | 9.45 | 414.1162 | 437.1047 (−2.9) | 459.1142 (−0.7) | 175.0375, 163.0736, 131.0478 | 353.0867, 251.0597 | C18H22O11 | Asperuloside * | EUL, EUF, EUP |
| 19 | 9.45 | 368.1107 | 391.0988 (−4.3) | 413.1072 (−2.9) | 353.0867, 147.0453 | C17H20O9 | Methyl chlorogenate | EUL, EUF, EUP | |
| 20 | 9.60 | 536.1894 | 537.1969 (−0.6) | 535.1795 (0.7) | 357.1323, 375.1438, 323.0546 | 373.1265, 343.1180, 285.1060, 520.1627 | C26H32O12 | (+)-1-Hydroxypinoresinol 4′-O-b-d-glucopyranoside | EUB, EUL |
| 21 | 9.85 | 538.205 | 556.2395 (−0.2) | 583.2031 (0.7) | 341.1374, 345.1319, 137.0583, 311.0537 | 375.1444, 337.0927, 345.1324 | C26H34O12 | (−)-Olivil 4′-O-b-d-glucopyranoside | EUB, EUL, EUF, EUP |
| 22 | 9.95 | 698.2422 | 699.2481 (−2.7) | 743.2379 (−2.6) | 519.1858, 375.1422, 327.1207 | 535.1737, 373.1261, 343.1265, 325.1095 | C32H42O17 | (+)-1-Hydroxypinoresinol 4′,4″-di-O-b-d-glucopyranoside | EUB |
| 23 | 9.99 | 388.1369 | 433.1347 (−0.2) | 375.1310, 207.0664, 175.0360, 371.0965 | C17H24O10 | Geniposide * | EUB, EUF, EUP | ||
| 24 | 9.99 | 342.1315 | 387.1294 (−0.7) | 165.0559, 123.0445, 147.0444 | C16H22O8 | (E)-Coniferin | EUB, EUF, EUP | ||
| 25 | 9.99 | 180.0786 | 181.0862 (−1.5) | 225.0765 (0.9) | 149.0593, 163.0743, 131.0480 | 147.0460, 123.0454, 103.0151 | C10H12O3 | Pinusolidic acid | EUP, EUF |
| 26 | 10.06 | 536.1894 | 537.1959 (−2.4) | 375.1430, 357.1324, 519.1857 | C26H32O12 | (+)-1-Hydroxypinoresinol 4″-O-b-d-glucopyranoside | EUB | ||
| 27 | 10.21 | 538.205 | 556.2386 (−1.4) | 583.2023 (−0.6) | 341.1373, 297.1113, 165.0677, 137.0585 | 375.1412, 277.1275, 507.1518, 123.0449 | C26H34O12 | (−)-Olivil 4″-O-b-d-glucopyranoside | EUB |
| 28 | 10.31 | 342.1315 | 387.1288 (−0.8) | 179.0518, 297.1067, 147.0453 | C16H22O8 | Coniferin | EUB, EUF, EUP | ||
| 29 | 10.44 | 626.1483 | 627.1556 (−0.8) | 625.1404 (−0.1) | 465.1027, 303.0501, 285.0387, 247.0596, 153.0175 | 463.0869, 445.0765, 300.0279, 301.0325, 271.0241 | C27H30O17 | Baimaside * | EUL, EUF, EUP |
| 30 | 10.55 | 682.2473 | 700.2802 (−2.1) | 727.2450 (0.1) | 357.1324, 235.0955 | 681.2398, 519.1866, 357.1339, 342.1103, 151.0398, 136.162 | C32H42O16 | (+)-Pinoresinol di-O-b-d-glucopyranoside * | EUB |
| 31 | 10.55 | 682.2473 | 700.2796 (−2.9) | 727.2444 (−0.7) | 341.1380, 175.0742, 187.0725, 323.1268 | 519.1871, 357.1338, 327.1210 | C32H42O16 | (+)Dehydrodiconiferyl 4,γ-di-O-b-d-glucopyranoside | EUL, EUB, EUF |
| 32 | 10.59 | 372.142 | 417.1399 (0.7) | 179.0567, 162.0322 | C17H24O9 | Syringin | EUL, EUF, EUP | ||
| 33 | 10.67 | 1086.996 | 1085.336 (0.2) | 669.2391, 505.1715, 413.1081, 207.0661, 195.0657, 179.0563 | C48H62O28 | Ulmoidoside A | EUB, EUL | ||
| 34 | 10.71 | 682.2473 | 700.2815 (−0.2) | 727.2444 (−0.7) | 311.1260, 323.0528, 571.1435 | 339.1228, 519.1867, 501.1761, 309.1124 | C32H42O16 | (+)Dehydrodiconiferyl 4,γ-di-O-b-d-glucopyranoside | EUL, EUB, EUF |
| 35 | 10.8 | 712.2579 | 730.2915 (−1.0) | 757.2547 (−1.1) | 713.2574, 151.0378, 519.1867, 235.0946 | 491.1912, 545.1787, 387.1438, 372.1197 | C33H44O17 | (+)-Medioresinol di-O-β-d-glucopyranoside | EUB, EUL, EUF |
| 36 | 10.83 | 226.0841 | 249.0732 (−2.8) | 225.0767 (1.8) | 209.0804, 163.0743, 149.0948, 227.0906 | 211.0611, 207.0662, 179.0350 | C11H14O5 | Genipin * | EUB, EUF |
| 37 | 10.83 | 596.1378 | 597.1473 (2.7) | 595.1305 (1.0) | 303.0500, 153.0178, 465.1030 | 463.0869, 445.0771, 301.0322, 271.0247, 243.0295 | C26H28O16 | Quercetin 3-O-sambubioside * | EUL, EUF, EUP |
| 38 | 10.89 | 568.2156 | 586.2477 (−3.9) | 613.2128 (−0.7) | 533.2036, 341.1376, 167.0690, 191.0697 | 405.1723, 537.2082, 371.1327, 531.1871, 207.0664 | C27H36O13 | Citrusin B | EUL, EUB, EUF |
| 39 | 10.96 | 610.1534 | 611.1624 (−2.0) | 609.1456 (0.1) | 465.1025, 303.0501, 153.0177, 285.0384 | 463.0876, 445.0754, 301.0319, 151.0036 | C27H30O16 | Quercetin 3-O-neohesperidoside * | EUF, EUP |
| 40 | 11.04 | 418.1628 | 419.1685 (−5.0) | 417.1545 (−1.1) | 401.1592, 371.1122 | 403.1431, 387.1094 | C22H26O8 | (+)-Syringaresinol | EUB, EUL |
| 41 | 11.04 | 742.2684 | 760.3028 (0.0) | 787.2652 (−1.1) | 401.1591, 265.1058, 151.0375 | 579.2074, 417.1550, 551.1768, 403.1431, 387.1077 | C34H46O18 | Liriodendrin | EUL, EUB, EUF |
| 42 | 11.27 | 610.1534 | 611.1618 (1.0) | 609.1461 (0.9) | 303.0496, 465.1016, 245.0456 | 301.0320, 271.0241, 255.0297, 243.0295, 227.0342, 151.0031 | C27H30O16 | Rutin * | EUL, EUF, EUP |
| 43 | 11.45 | 258.0258 | 259.0599 (−2.9) | 303.0508 (−1.1) | 260.0669 | C14H10O5 | Alternariol | EUF, EUP, EUL | |
| 44 | 11.51 | 580.1792 | 581.1516 (1.7) | 579.1355 (−0.9) | 449.1081, 287.0601, 153.0118 | 463.0932, 284.0333, 255.0316, 227.0357 | C26H28O15 | Kaempherol-3-O-sambubioside | EUL, EUF, EUP |
| 45 | 11.52 | 464.0955 | 465.1021 (−2.6) | 463.0879 (0.5) | 301.0335, 271.0299, 151.0038, 145.0291 | C21H20O12 | Isoquercitrin * | EUL, EUF, EUP | |
| 46 | 11.55 | 375.1438 | 421.1497 (−1.9) | 360.1202, 227.0345, 271.0247, 345.1341 | C24H20O7 | (+) Cyclo-olivil | EUL, EUF, EUP | ||
| 47 | 11.78 | 376.1522 | 375.1432 (−3.1) | 225.0763, 308.1137, 327.1245, 357.1348, 343.1181 | C20H24O7 | (−)-olivil | EUB, EUL | ||
| 48 | 11.79 | 550.205 | 568.2383 (−1.1) | 595.2026 (−0.14) | 435.1639, 329.1002, 321.1070 | 373.1267, 467.1566, 195.0661 | C27H34O12 | Eucommia A | EUL, EUB, EUF |
| 49 | 11.88 | 908.3314 | 926.3583 (−2.9) | 953.3279 (−1.8) | 549.1991, 387.1425, 181.0482 | 745.2667, 583.2174, 387.1436, 195.0660 | C43H56O21 | Hedyotol C-4″,4‴-di-O-b-d-glucopyranoside | EUB, EUL, EUF |
| 50 | 11.91 | 460.1006 | 505.0981 (−0.2) | 445.0748, 443.0583, 177.0163, 145.0291, 151.0037 | C22H20O11 | Wogonoside | EUL, EUF, EUP | ||
| 51 | 12.20 | 968.3525 | 986.3816 (−3.7) | 1013.347 (−3.7) | 775.2781, 549.1991, 417.1506, 417.1527 | 745.2667, 643.2385, 353.0870, 805.2880, 893.2989 | C45H60O23 | Guaiacylglycerol-b-syringaresinol ether-4″,4″-di-O-b-d-glucopyranoside | EUB, EUL |
| 52 | 12.22 | 516.1628 | 517.1329 (−3.3) | 515.1186 (−0.7) | 499.1232, 287.0548, 135.0430 | 353.0876, 191.0557 | C25H24O12 | Isochlorogenic acid A * | EUB, EUL, EUF |
| 53 | 12.24 | 448.1006 | 447.0927 (−0.1) | 285.0390, 151.0032, 227.0347 | C21H20O11 | Astragalin * | EUL, EUF, EUP | ||
| 54 | 12.34 | 520.1945 | 538.2272 (−3.0) | 519.1864 (−0.5) | 357.1323, 165.0685 | 357.1335, 342.1096, 136.0161 | C26H32O11 | (+)-Medioresinol di-O-b-d-glucopyranoside | EUB, EUL, EUF |
| 55 | 12.54 | 580.2156 | 598.2487 (−2.1) | 579.2074 (0.6) | 417.1513, 247.0657 | 417.1551, 387.1456, 551.1286 | C28H36O13 | (−)-Syringaresinol-O-b-d-glucopyranoside | EUB, EUL, EUF |
| 56 | 12.69 | 516.1628 | 517.1328 (−3.5) | 515.1193 (−0.7) | 499.1225, 163.0384, 179.0892, 135.0422 | 353.0886, 191.0561, 161.0237 | C25H24O12 | Isochlorogenic acid C * | EUB, EUL, EUF, EUP |
| 57 | 12.81 | 188.1049 | 211.0942 (−2.0) | 187.0973 (0.0) | 135.0794, 153.0897, 107.0840 | 125.0973, 169.0862, 141.0919, 123.0813 | C9H16O4 | Eucommiol | EUB, EUF, EUP |
| 58 | 13.16 | 374.1366 | 375.1433 (−2.9) | 373.1286 (−0.3) | 339.1217, 233.0795, | 358.1068, 327.0871, 313.1084, 345.0982 | C20H22O7 | (+)-1-Hydroxypinoresinol | EUB, EUL |
| 59 | 13.28 | 284.0685 | 302.1025 (0.6) | 283.0606 (−2.1) | 193.0478, 183.0309 | 147.0442, 136.0165, 125.0234 | C16H12O5 | Oroxylin A | EUF, EUP |
| 60 | 13.55 | 196.1099 | 219.1001 (4.1) | 241.1082 (2.5) | 161.0595, 149.0576, 163.0358 | 163.0386, 145.0274 | C11H16O3 | Loliolide | EUB, EUL, EUF, EUP |
| 61 | 14.32 | 302.0427 | 303.0498 (−2.2) | 301.0345 (−1.1) | 153.0171, 285.0373, 195.0272 | 151.0038, 285.0397, 271.0232 | C15H10O7 | Quercetin * | EUL, EUF, EUP |
| 62 | 15.52 | 272.0685 | 271.0607 (−0.2) | 151.0072, 119.0528, 93.0365, 177.0216, 227.0727 | C15H12O5 | Naringenin | EUL, EUF, EUP | ||
| 63 | 15.53 | 270.0528 | 271.0597 (−3.5) | 269.0453 (−1.1) | 145.0630, 179.0329 | 177.0193, 145.0536 | C15H10O5 | Baicalein | EUL, EUF, EUP |
| 64 | 15.76 | 286.0477 | 287.0558 (0.7) | 285.0396 (−1.1) | 153.0180, 179.0321 | 227.0337, 151.0026, 145.9311 | C15H10O6 | Kaempferol | EUL, EUF, EUP |
| 65 | 21.27 | 172.1099 | 195.0999 (1.0) | 95.0472, 121.0259 | C9H16O3 | 1-Deoxyeucommiol | EUL, EUF, EUP | ||
| 66 | 25.83 | 278.1518 | 301.1405 (−3.6) | 277.1444 (1.5) | 149.0217, 121.0270 | 121.0289 | C16H22O4 | 1,2-benzenedicarboxylic acid bis(2-methylpropyl) ester | EUB, EUL, EUF, EUP |
| 67 | 28.17 | 392.1471 | 410.1811 (−1.0) | 313.0743, 185.0803 | C20H24O8 | Erythro-dihydroxydehydrodiconiferyl | EUB, EUL, EUF, EUP | ||
| 68 | 28.17 | 184.0736 | 185.0810 (−2.1) | 111.0070, 113.0218 | C9H12O4 | Eucommidiol | EUB, EUL, EUF, EUP | ||
| 69 | 29.24 | 456.3604 | 457.3662 (−4.3) | 455.3526 (0.2) | 411.3613, 393.3506 | 277.2171, 407.1728, 377.1420 | C30H48O3 | Betulinic acid | EUB, EUL, EUF, EUP |
| 70 | 29.32 | 456.3604 | 457.3699 (3.8) | 455.3531 (−1.3) | 439.3572, 393.3507, 411.3617, 203.1787 | 277.2171, 407.3311 | C30H48O3 | Ursolic acid * | EUL, EUF, EUP |
| 71 | 30.83 | 256.2402 | 257.2474 (−2.6) | 239.2364 | C16H32O2 | Palmitic acid | EUB, EUL, EUF, EUP | ||
| 72 | 32.21 | 426.3862 | 427.3927 (3.0) | 409.3821, 191.1783, 203.1777, 149.1315 | C30H50O | Ulmoprenol | EUB, EUF, EUP | ||
| 73 | 32.76 | 282.2559 | 283.263 (−2.5) | 281.2484 (1.2) | 265.2521, 137.1313, 123.1159 | 181.1241, 163.1133 | C18H34O2 | Oleic acid | EUB, EUL, EUF, EUP |
| 74 | 36.14 | 576.439 | 599.4269 (−3.1) | 621.4368 (0.3) | 397.3818, 423.3231, 175.1460 | 473.2820, 283.1105 | C35H60O6 | Daucosterol | EUL, EUF, EUP |
| Peak Number | tR (min) | Compound | Molecular Formula | Molecular Weight | [M + H]+/ [M + Na]+/[M + NH4]+ (Error, ppm) | [M − H]−/[M + HCOO]− (Error, ppm) | MS/MS Fragments (P) | MS/MS Fragments (N) |
|---|---|---|---|---|---|---|---|---|
| 1 | 20.72 | Geniposidic acid * | C16H22O10 | 374.1213 | 397.1111 (0.1) | 373.1131 (−1.0) | 353.0553, 293.0344, 217.0472 | 211.0602, 149.0606, 123.0446 |
| 2 | 48.65 | Quercetin 3-O-sophoroside * | C27H30O17 | 626.1483 | 627.1556 (−0.8) | 625.1406 (0.2) | 303.0506, 465.1033, 285.0383 | 271.0370, 301.0448, 463.0997 |
| 3 | 52.75 | Quercetin 3-O-sambubioside * | C26H28O16 | 596.1378 | 597.1453 (−0.4) | 595.1296 (−0.5) | 303.0551, 465.1052, 285.0411 | 301.0448, 271.0336, 463.1041, 445.0971 |
| 4 | 53.62 | Quercetin 3-O-neohesperidoside * | C27H30O16 | 610.1534 | 611.1602 (−1.7) | 609.1453 (−0.4) | 303.0504, 465.1023, 279.1604 | 300.0720, 301.0319, 271.0251, 445.0784 |
| 5 | 59.24 | Isoquercitrin * | C21H20O12 | 464.0955 | 463.0876 (−0.1) | 300.0259, 301.0337, 271.0238, 191.9362 |
| Position | Compound 2 | Compound 3 | Compound 4 | |||||||||
|---|---|---|---|---|---|---|---|---|---|---|---|---|
| δC | δC Ref. | δH (J in Hz) | δH Ref. | δC | δC Ref. | δH (J in Hz) | δH Ref. | δC | δC Ref. | δH (J in Hz) | δH Ref. | |
| 2 | 156.66 | 157.07 | 155.61 | 156.70 | 156.52 | 156.32 | ||||||
| 3 | 133.44 | 133.69 | 133.31 | 133.90 | 133.3 | 133.50 | ||||||
| 4 | 177.88 | 178.35 | 177.63 | 178.30 | 177.71 | 177.58 | ||||||
| 5 | 161.7 | 161.71 | 5-OH: 12.68 s | 161.64 | 162.30 | 161.68 | 161.42 | 12.66 s | 12.67 s | |||
| 6 | 99.03 | 99.79 | 6.19 d | 6.21 d | 99.32 | 100.10 | 6.11 d | 6.19 d | 99.07 | 98.78 | 6.18 d | 6.19 d |
| 7 | 164.43 | 164.58 | 7-OH: 10.85 s | 165.63 | 165.10 | 164.49 | 164.02 | 10.83 s | 10.84 s | |||
| 8 | 93.85 | 93.27 | 6.40 d | 6.40 d | 93.97 | 95.60 | 6.31 d | 6.40 d | 93.88 | 93.44 | 6.38 d | 6.39 d |
| 9 | 155.99 | 157.43 | 156.74 | 157.50 | 156.68 | 156.74 | ||||||
| 10 | 104.37 | 103.59 | 103.92 | 104.90 | 104.43 | 103.87 | ||||||
| 1′ | 121.57 | 121.63 | 121.5 | 122.10 | 121.62 | 121.96 | ||||||
| 2′ | 115.81 | 114.74 | 7.55 d (2.2) | 7.68 d | 115.67 | 116.20 | 7.51 d (8.4) | 7.56 d | 115.53 | 115.84 | 7.52 d | 7.53 d |
| 3′ | 145.24 | 144.55 | 3′-OH: 9.71 s | 145.41 | 149.50 | 145.27 | 144.95 | 9.72 s | 9.17 s | |||
| 4′ | 148.92 | 148.39 | 4′-OH: 9.21 s | 149.14 | 151.10 | 148.79 | 148.18 | 9.16 s | 9.73 s | |||
| 5′ | 116.5 | 116.34 | 6.87 d (8.5) | 6.90 d | 116.33 | 119.30 | 6.80 d (8.4) | 6.85 d | 116.42 | 116.16 | 6.82 d | 6.83 d |
| 6′ | 122.25 | 121.63 | 7.61 dd (8.5, 2.2) | 7.55 dd | 122.27 | 122.60 | 7.62 d (8.4, 2.2) | 7.66 d | 122.09 | 121.15 | 7.59 dd | 7.60 dd |
| 1″ | 98.46 | 98.45 | 5.70 d (7.3) | 5.37 d | 98.39 | 95.50 | 5.68 d (6.7) | 5.72 d | 98.8 | 98.48 | 5.64 d (7.7) | 5.65 d (7.6) |
| 2″ | 83.14 | 81.49 | 3.46 | 82.25 | 81.70 | 77.91 | 76.76 | |||||
| 3″ | 76.97 | 74.15 | 76.52 | 77.50 | 77.74 | 77.34 | ||||||
| 4″ | 70.07 | 69.53 | 3.03 | 70.04 | 69.40 | 70.7 | 69.86 | |||||
| 5″ | 77.18 | 76.50 | 77.26 | 76.10 | 3.43 | 77.84 | 77.15 | |||||
| 6″ | 61.17 | 60.91 | 61.01 | 60.50 | 3.51 | 61.39 | 60.52 | |||||
| 1‴ | 104.60 | 104.34 | 4.60 d (7.9) | 4.77 d | 104.92 | 104.40 | 4.55 d (7.3) | 4.58 d | 100.92 | 100.76 | 5.01 d | 5.08 |
| 2‴ | 74.82 | 76.49 | 3.50 | 74.3 | 73.80 | 71.01 | 70.36 | |||||
| 3‴ | 76.97 | 76.85 | 3.44 | 76.52 | 76.70 | 71.07 | 70.83 | |||||
| 4‴ | 70.00 | 69.64 | 69.84 | 69.30 | 72.31 | 71.90 | ||||||
| 5‴ | 77.93 | 76.66 | 66.02 | 65.60 | 3.65 | 68.67 | 68.57 | |||||
| 6‴ | 61.09 | 60.99 | 17.63 | 17.41 | 0.76 | 0.77 | ||||||
| Number | Information | QSH (mg/g) | QSB (mg/g) | QNH (mg/g) |
|---|---|---|---|---|
| S1 | HN2021 | 10.51 | 7.42 | 3.2 |
| S2 | 20210323 | 11.26 | 7.76 | 3.76 |
| S3 | 20210328 | 11.96 | 8.06 | 3.59 |
| S4 | 20210331 | 13.53 | 8.84 | 3.21 |
| S5 | 20210324 | 11.54 | 7.89 | 3.86 |
| S6 | 20210325 | 13.88 | 8.94 | 3.00 |
| S7 | 20210327 | 11.33 | 7.9 | 4.05 |
| S8 | 20210404 | 13.25 | 8.77 | 3.49 |
| S9 | 20210328 | 12.17 | 8.16 | 3.53 |
| S10 | 20210410 | 13.62 | 8.84 | 3.64 |
| S11 | 20210411 | 13.96 | 9.06 | 2.82 |
| S12 | 20210413 | 11.42 | 7.85 | 3.08 |
| S13 | 20210409 | 10.12 | 7.29 | 3.13 |
| S14 | Z20210330 | 13.44 | 8.77 | 3.17 |
| S15 | Z20210323 | 12.31 | 8.22 | 3.01 |
| S16 | Z20210325 | 12.95 | 8.58 | 2.88 |
| S17 | Z20210326 | 14.5 | 9.26 | 3.12 |
| S18 | Z20210331 | 13.42 | 8.75 | 3.28 |
| S19 | HNYY20210328 | 12.17 | 8.16 | 3.53 |
| S20 | HNYL202004 | 12.5 | 8.57 | 3.69 |
| S21 | SXLY202004 | 12.17 | 7.7 | 2.48 |
| S22 | GSLN202004 | 9.32 | 7.49 | 2.29 |
| S23 | SXHZ202004 | 10.13 | 8.55 | 2.81 |
| S24 | HNZJJ2022 | 10.43 | 7.84 | 2.86 |
| S25 | SXHZ2022 | 9.13 | 8.72 | 2.64 |
| S26 | 20190430 | 12.67 | 7.77 | 3.80 |
| S27 | 20190407 | 9.12 | 10.52 | 2.95 |
| S28 | 20190404 | 9.95 | 9.13 | 2.66 |
| S29 | H11 | 13.4 | 8.61 | 2.64 |
| S30 | H22 | 13.67 | 8.87 | 2.88 |
| S31 | H23 | 11.61 | 7.93 | 2.12 |
| S32 | H24 | 14.74 | 9.36 | 2.05 |
| S33 * | YHSW221207-1 | 0.00 | 0.00 | 0.00 |
| S34 * | BZXH2022 | 0.00 | 0.00 | 0.00 |
Disclaimer/Publisher’s Note: The statements, opinions and data contained in all publications are solely those of the individual author(s) and contributor(s) and not of MDPI and/or the editor(s). MDPI and/or the editor(s) disclaim responsibility for any injury to people or property resulting from any ideas, methods, instructions or products referred to in the content. |
© 2023 by the authors. Licensee MDPI, Basel, Switzerland. This article is an open access article distributed under the terms and conditions of the Creative Commons Attribution (CC BY) license (https://creativecommons.org/licenses/by/4.0/).
Share and Cite
Guo, F.; Yang, Y.; Duan, Y.; Li, C.; Gao, H.; Liu, H.; Cui, Q.; Guo, Z.; Liu, X.; Wang, Z. Quality Marker Discovery and Quality Evaluation of Eucommia ulmoides Pollen Using UPLC-QTOF-MS Combined with a DPPH-HPLC Antioxidant Activity Screening Method. Molecules 2023, 28, 5288. https://doi.org/10.3390/molecules28135288
Guo F, Yang Y, Duan Y, Li C, Gao H, Liu H, Cui Q, Guo Z, Liu X, Wang Z. Quality Marker Discovery and Quality Evaluation of Eucommia ulmoides Pollen Using UPLC-QTOF-MS Combined with a DPPH-HPLC Antioxidant Activity Screening Method. Molecules. 2023; 28(13):5288. https://doi.org/10.3390/molecules28135288
Chicago/Turabian StyleGuo, Fengqian, Yichun Yang, Yu Duan, Chun Li, Huimin Gao, Hongyu Liu, Qiping Cui, Zhongyuan Guo, Xiaoqian Liu, and Zhimin Wang. 2023. "Quality Marker Discovery and Quality Evaluation of Eucommia ulmoides Pollen Using UPLC-QTOF-MS Combined with a DPPH-HPLC Antioxidant Activity Screening Method" Molecules 28, no. 13: 5288. https://doi.org/10.3390/molecules28135288