
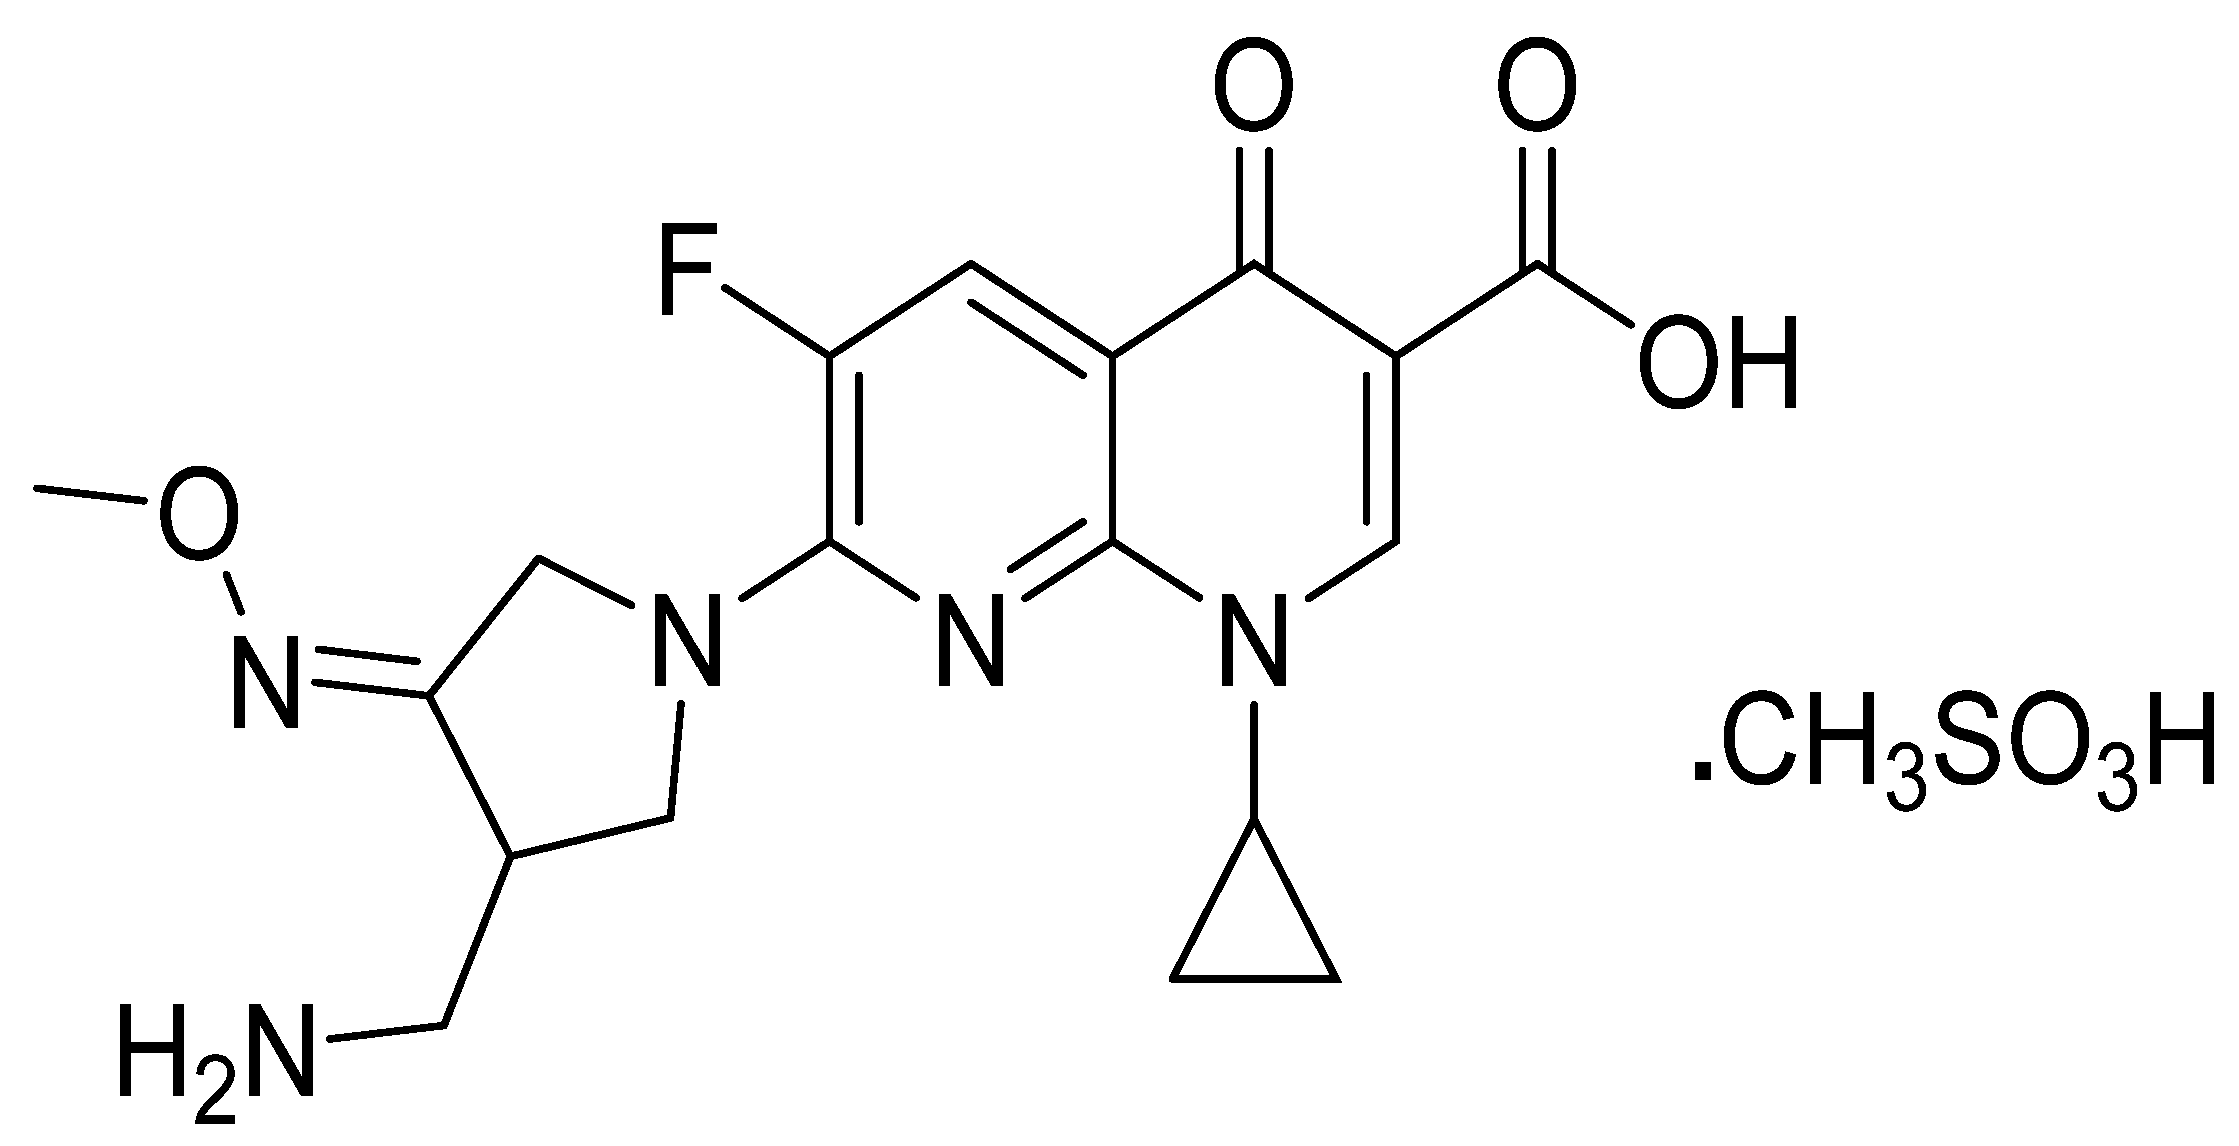
Fabrication and Applications of Potentiometric Membrane Sensors Based on Specific Recognition Sites for the Measurement of the Quinolone Antibacterial Drug Gemifloxacin


Abstract
:
1. Introduction
2. Results and Discussion
2.1. Characterization of the Membrane Sensors
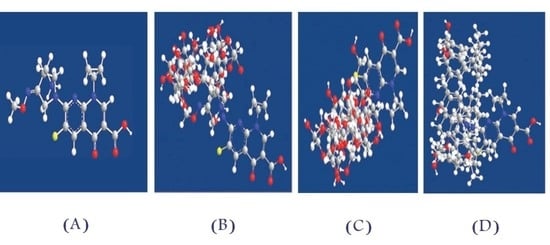
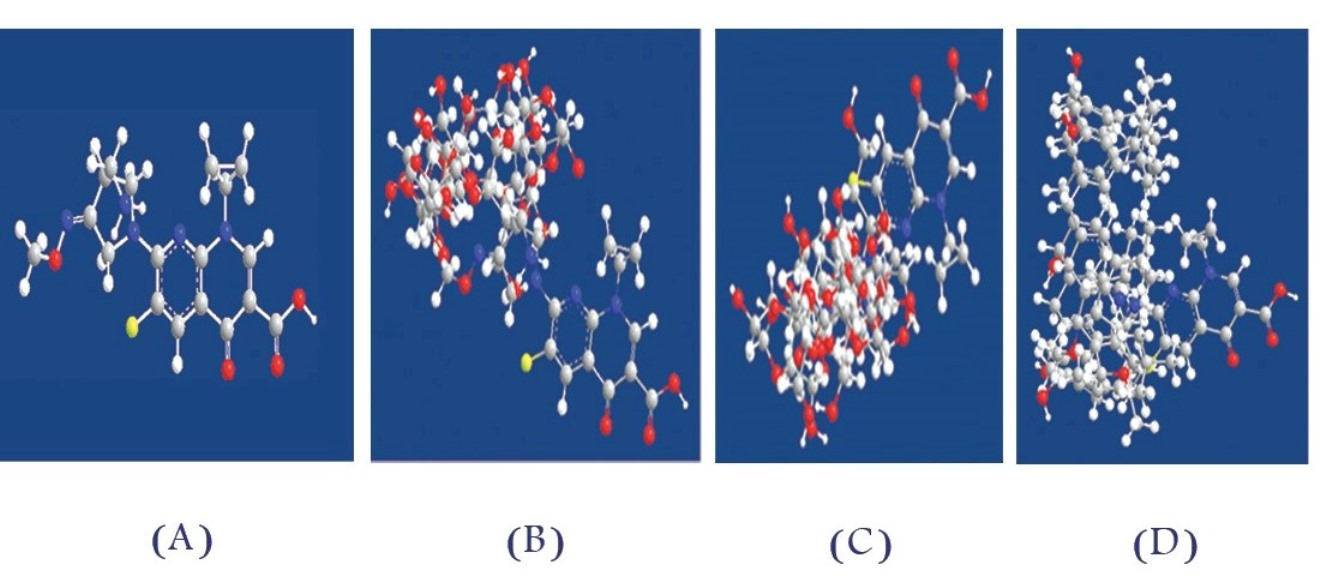
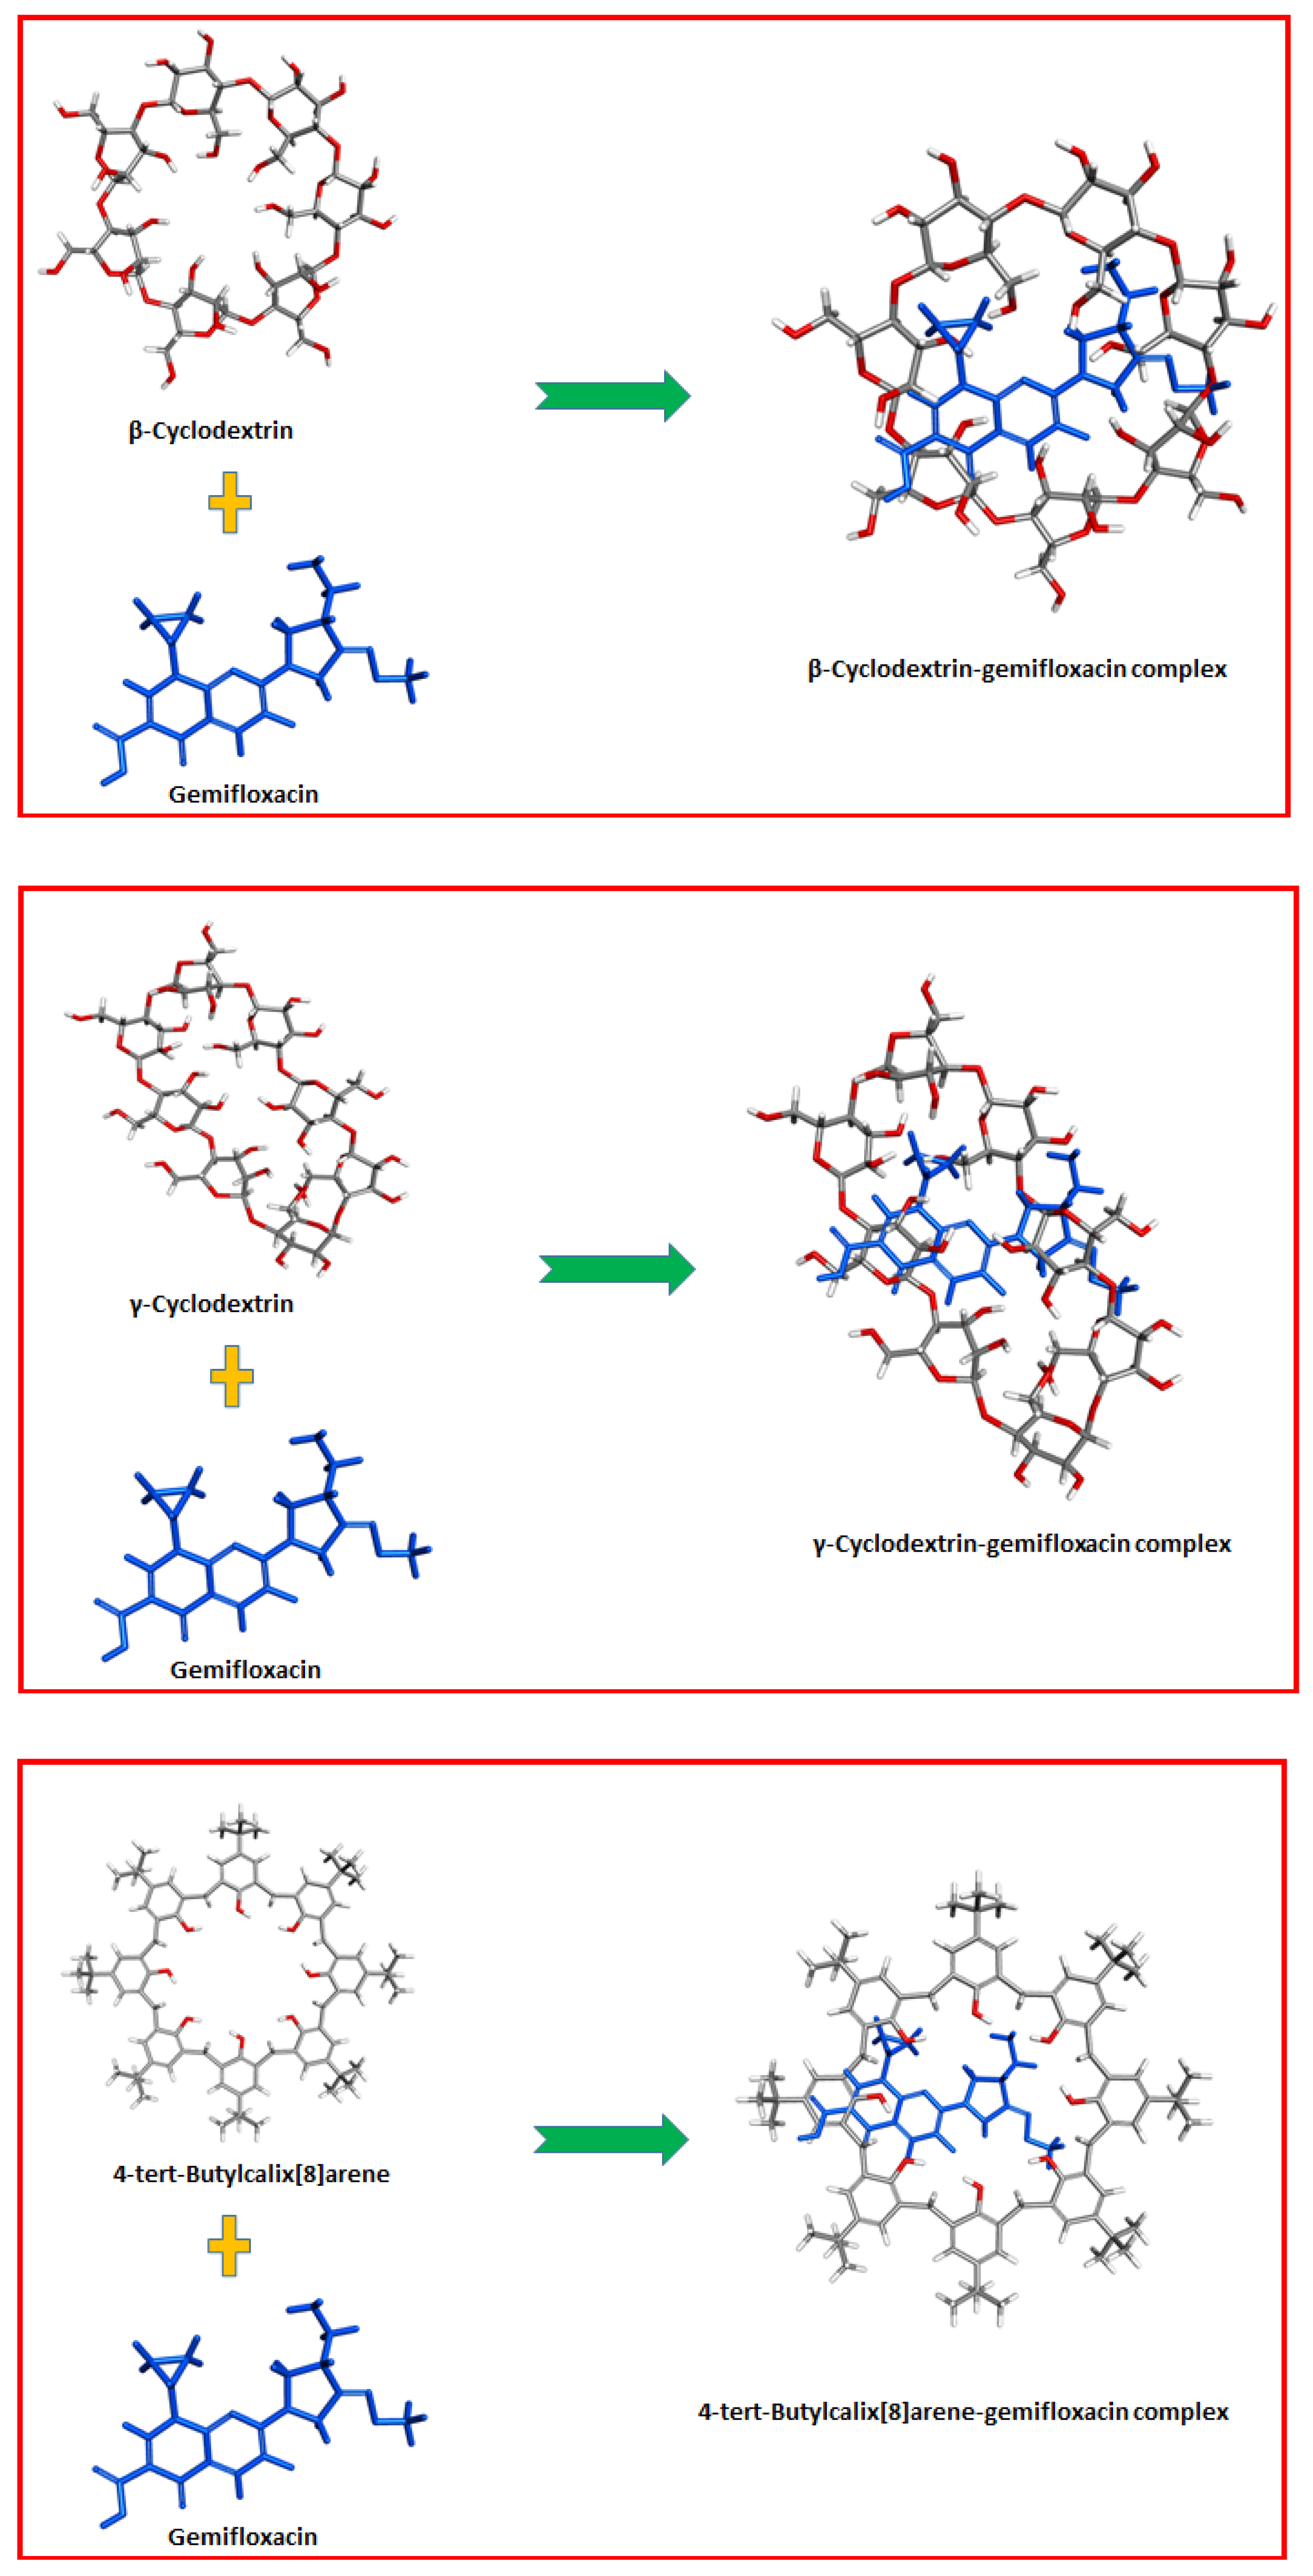
2.1.1. Effect of the Additive and Ionophore
2.1.2. Effect of Plasticizer
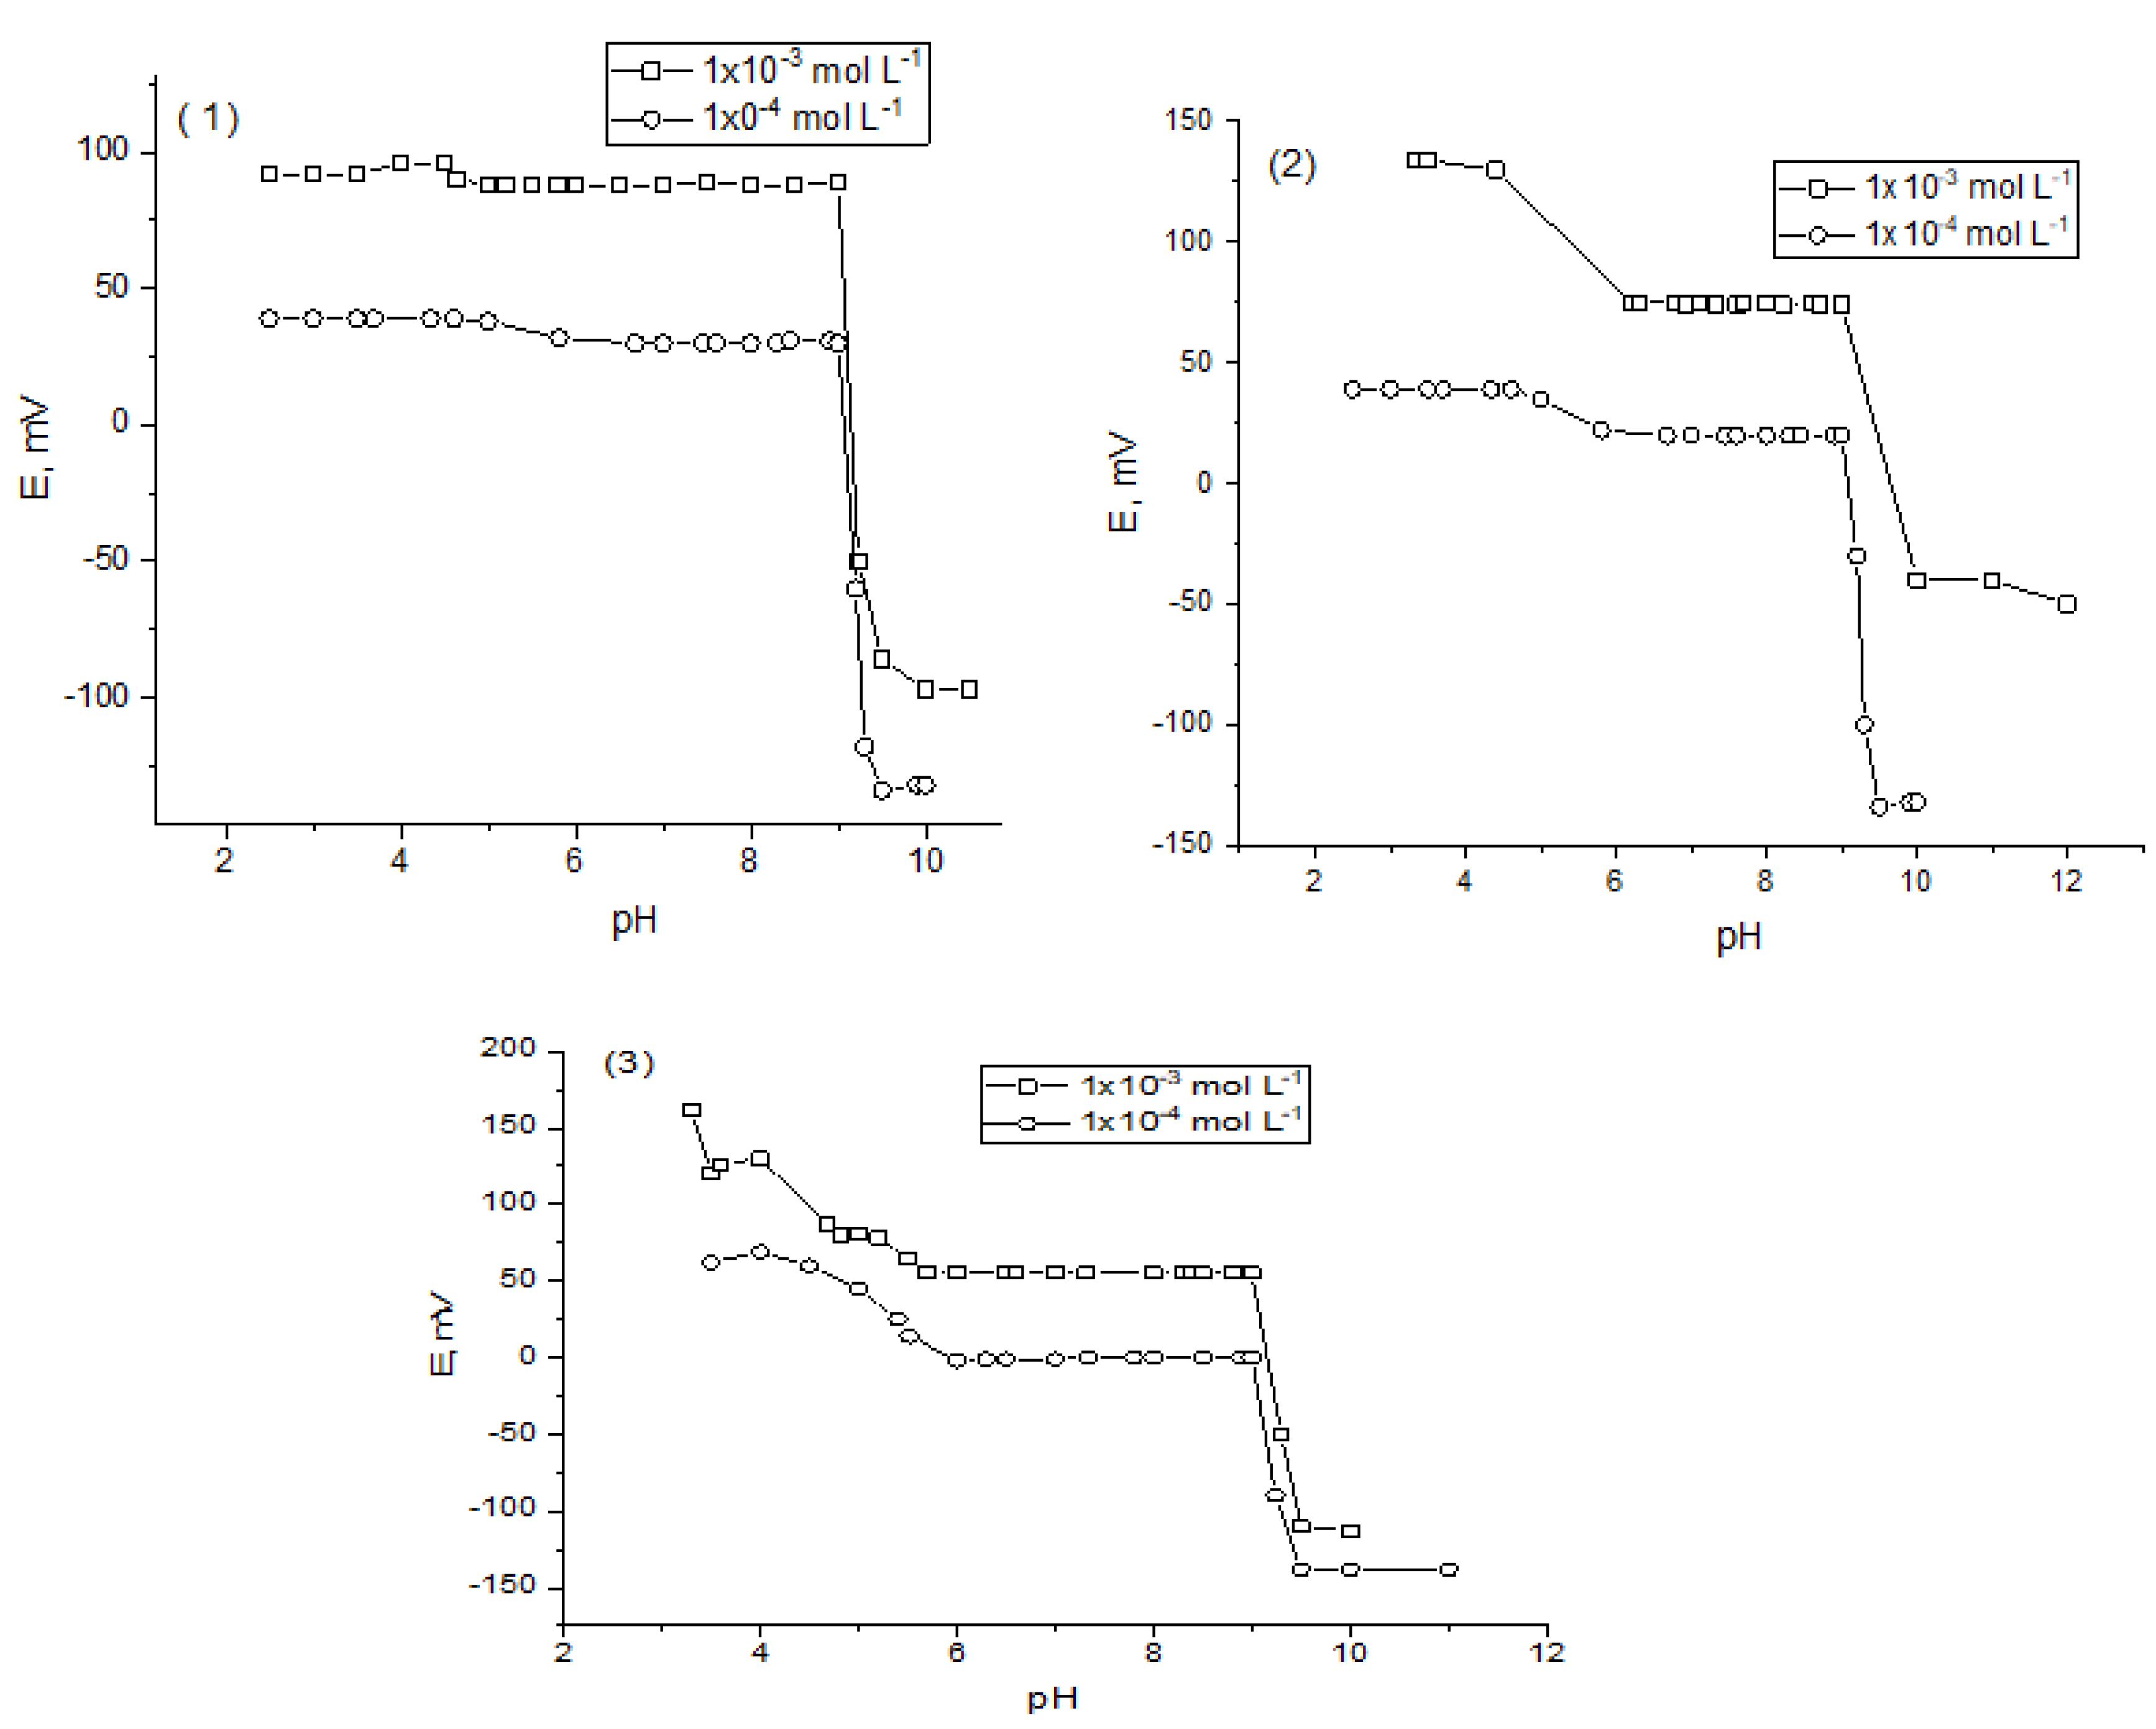
2.2. Effect of pH and Response Time
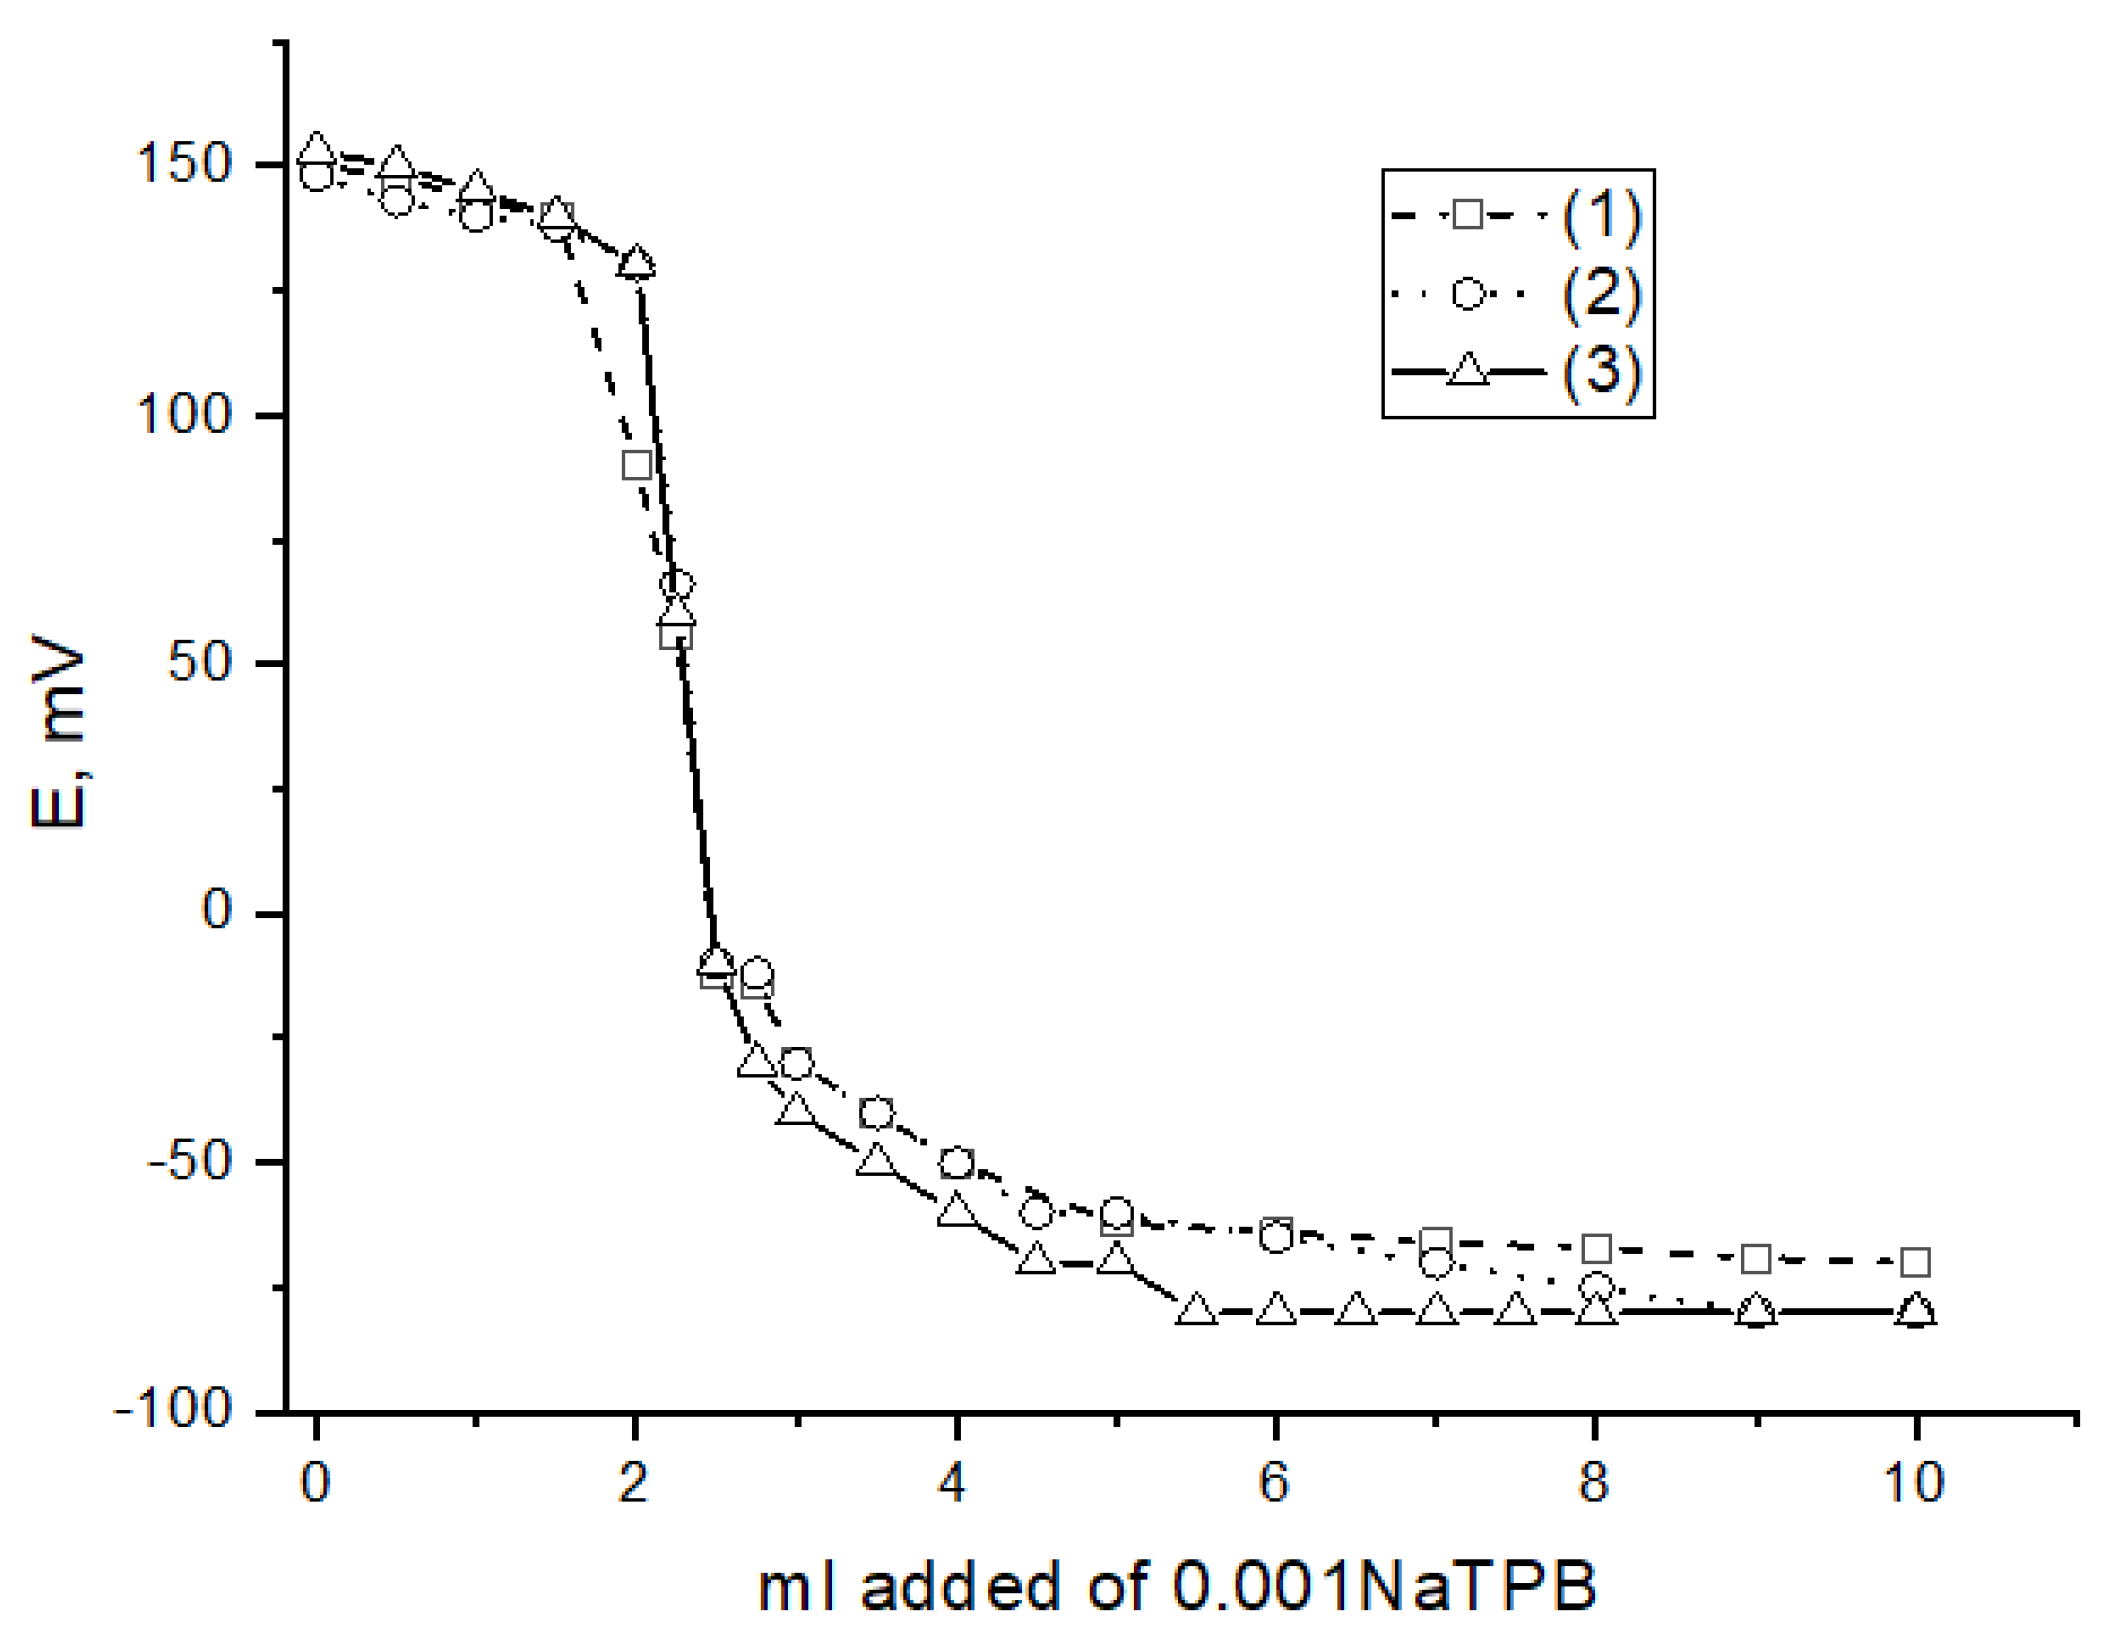
2.3. Interference Studies
2.4. Validation of the Method
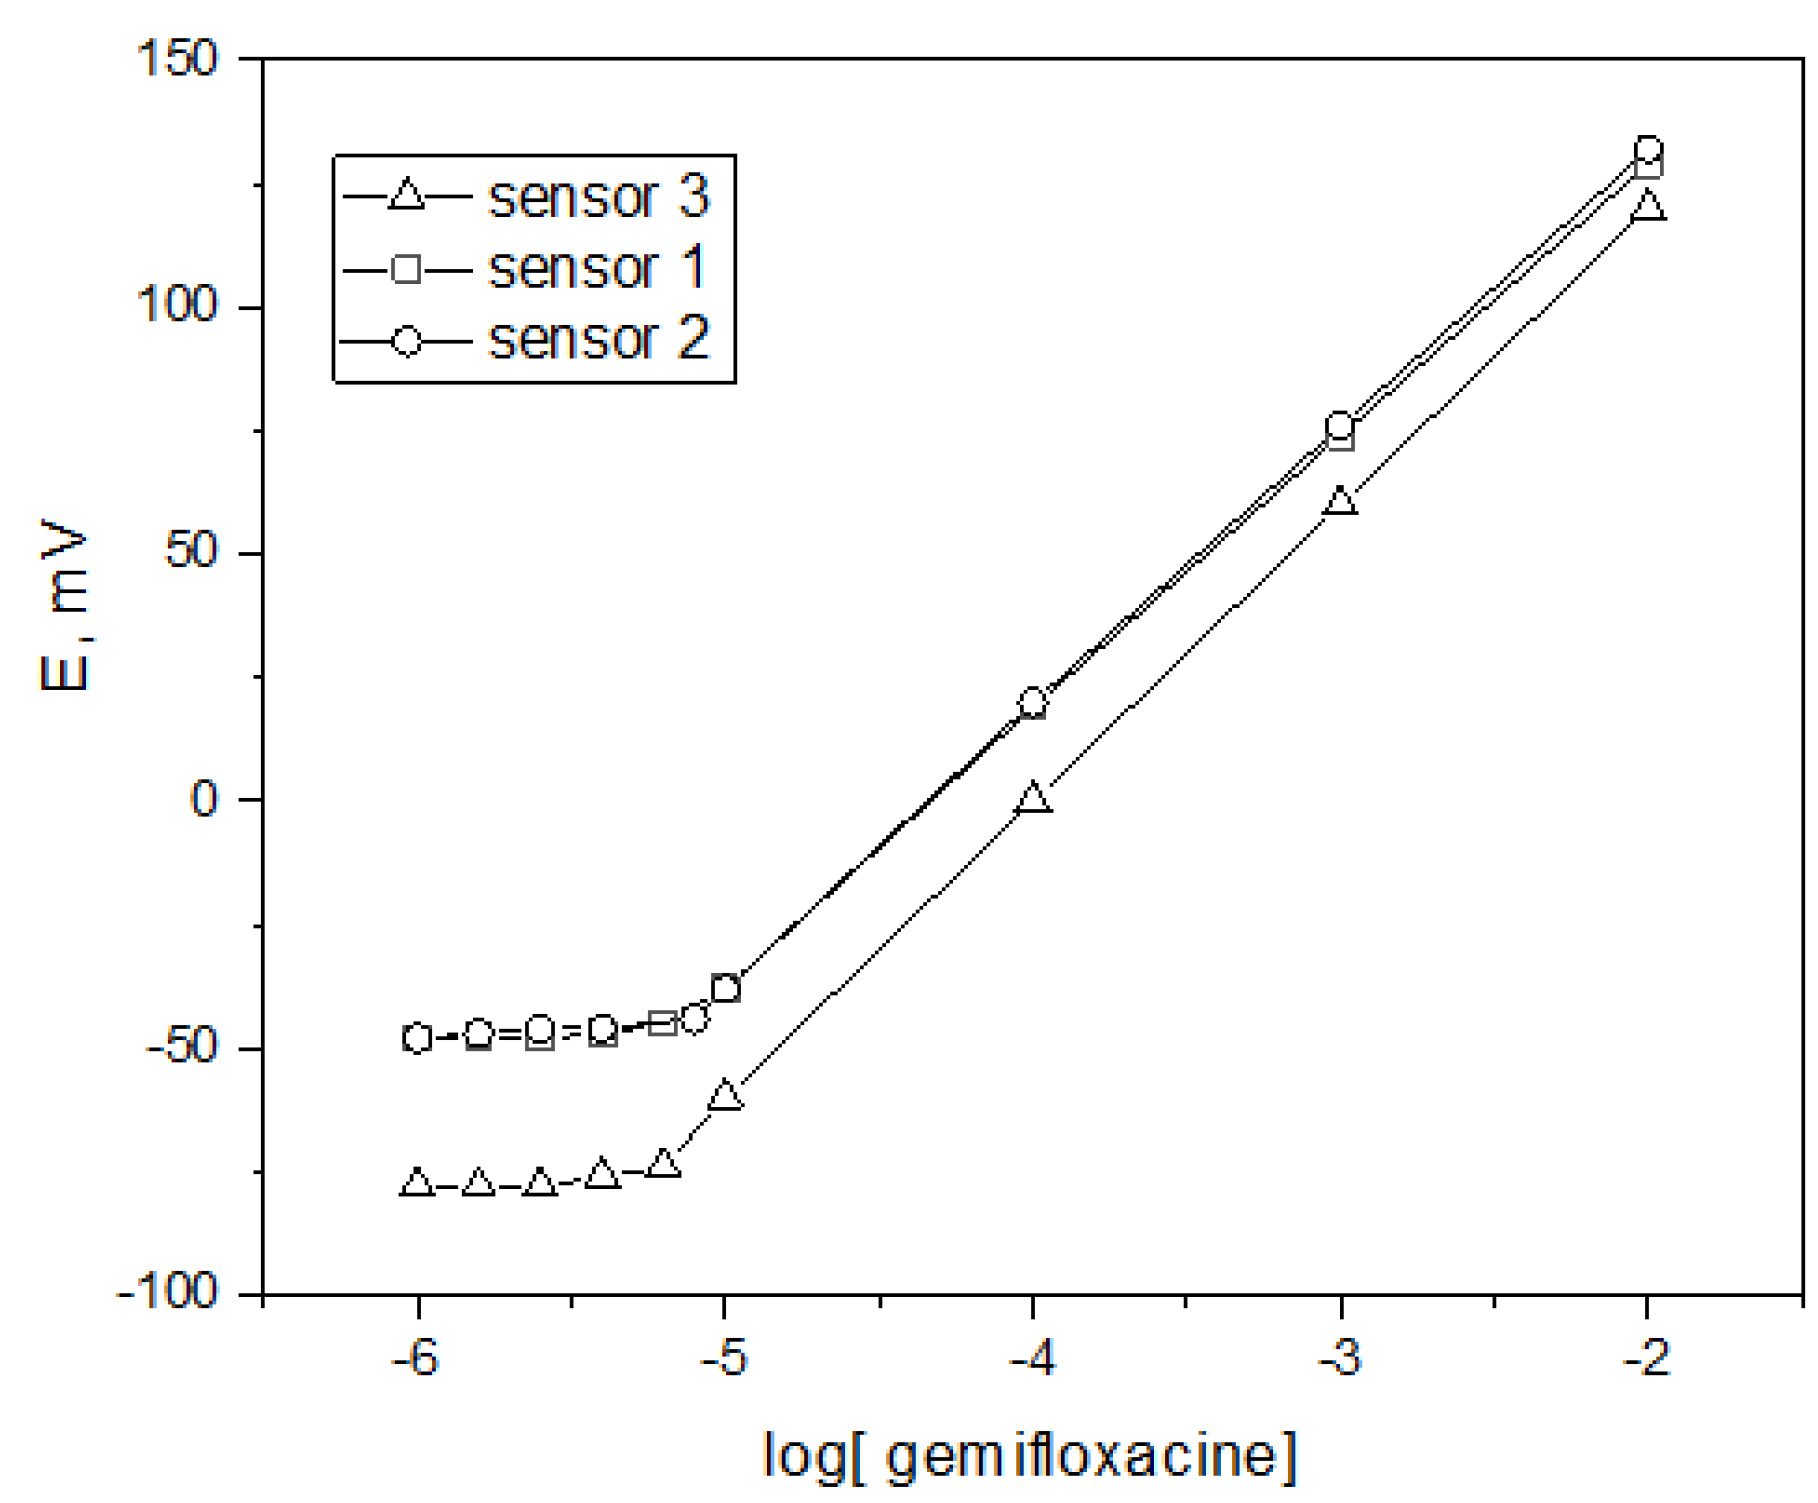
2.4.1. Linearity and Range
2.4.2. Limit of Detection/Quantification
2.4.3. Accuracy
2.4.4. Precision
2.5. Comparison of Ionophore with Ion-Pair Based PVC Sensors
2.6. Application of GF Sensors
Application of GF Sensors as Indictor Electrode
3. Experimental
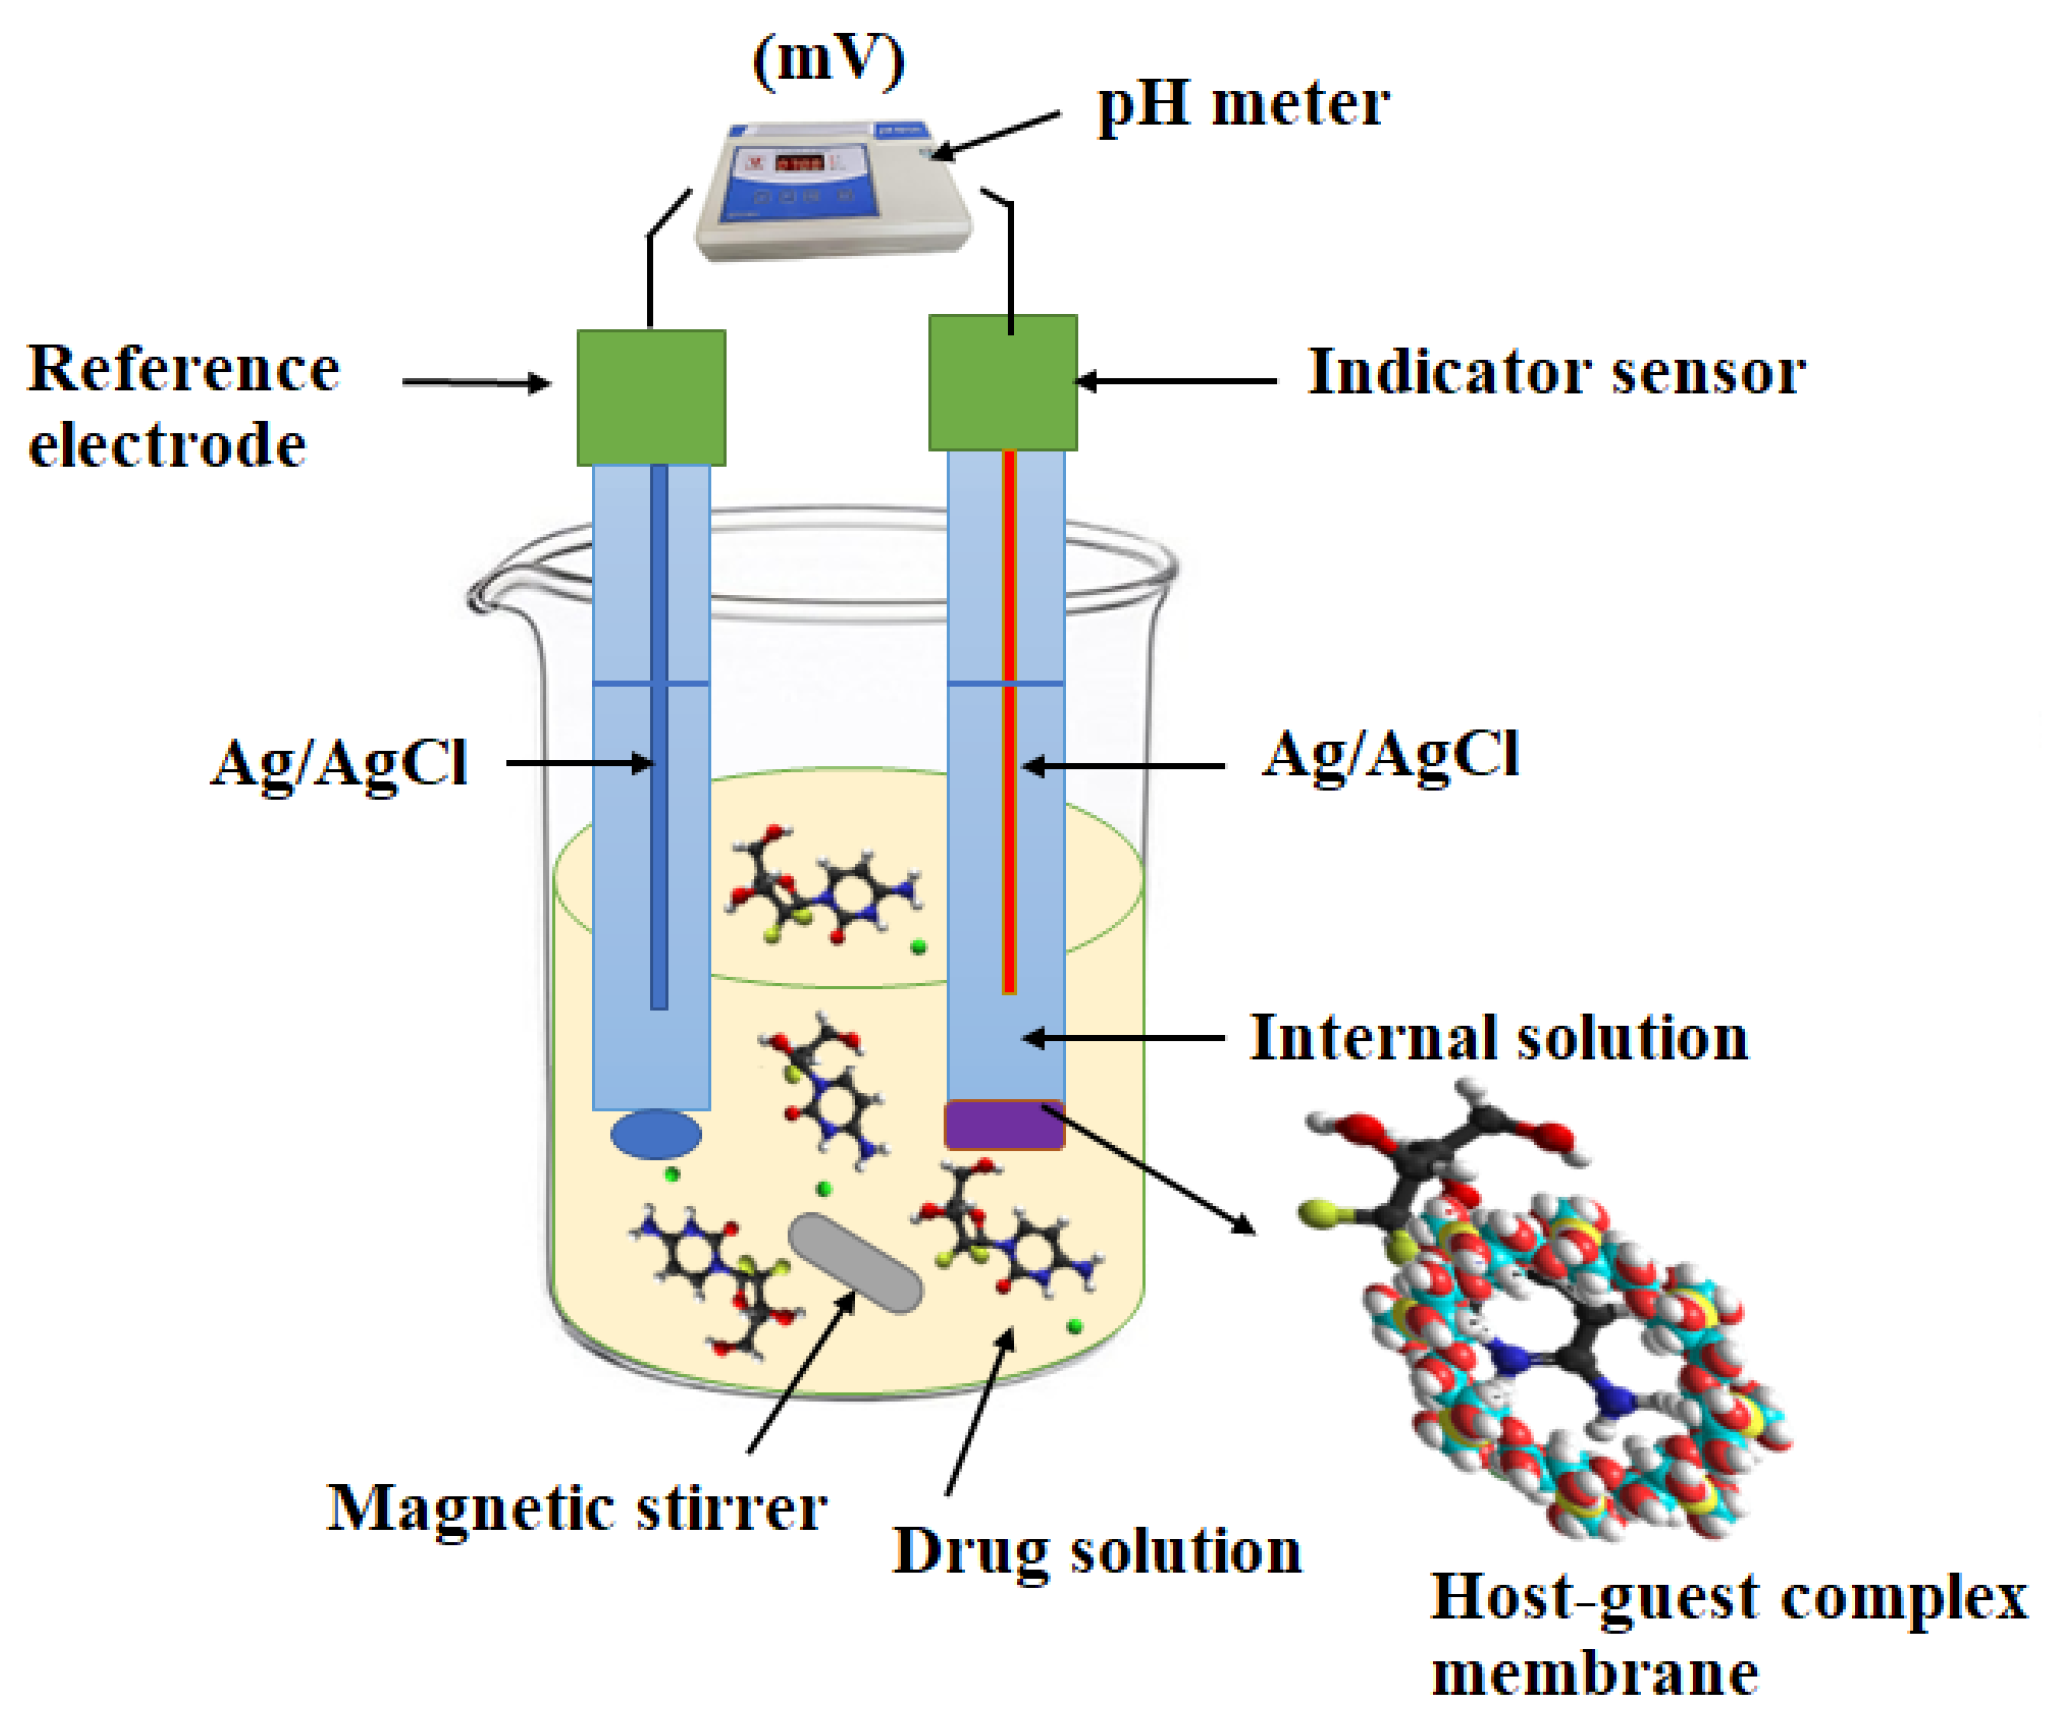
3.1. Apparatus
3.2. Reagents and Materials
3.3. Preparation of the GF Sensors
3.4. Effect of pH and Response Time
3.5. Calibration
3.6. Determination of Gemifloxacin in Dosage Form
4. Conclusions
Author Contributions
Funding
Institutional Review Board Statement
Informed Consent Statement
Data Availability Statement
Acknowledgments
Conflicts of Interest
Sample Availability
References
- Davies, T.A.; Kelly, L.M.; Pankuch, G.A.; Credito, K.L.; Jacobs, M.R.; Appelbaum, P.C. Antipneumococcal activities of gemifloxacin compared to those of nine other agents. Antimicrob. Agents Chemother. 2000, 44, 304. [Google Scholar] [CrossRef] [PubMed] [Green Version]
- Triller, D.M.; Yong, C.S.; Lodise, T.P. Gemifloxacin: A new fluoroquinolone approved for treatment of respiratory infections. Ann. Pharmacother. 2004, 38, 1226. [Google Scholar]
- Calvo, A.; Gimenez, M.J.; Alou, L.; Gómez-Lus, M.L.; Aguilar, L. Ex vivo serum activity (killing rates) after gemifloxacin 320 mg versus trovafloxacin 200 mg single doses against ciprofloxacin-susceptible and-resistant Streptococcus pneumoniae. Int. J. Antimicrob. Agents 2002, 20, 144–146. [Google Scholar] [CrossRef] [PubMed]
- Berry, V.; Page, R.; Satterfield, J.; Singley, C.; Straub, R.; Woodnutt, G. Comparative in vivo activity of gemifloxacin in a rat model of respiratory tract infection. J. Antimicrob. Chemother. 2000, 45, 79–85. [Google Scholar] [CrossRef] [PubMed] [Green Version]
- Johnson, D.M.; Jones, R.N.; Erwin, M.E. Anti-streptococcal activity of SB-265805 (LB20304), a novel fluoronaphthyridone, compared with five other compounds, including quality control guidelines. Diagn. Microbiol. Infect. Dis. 1999, 33, 87–91. [Google Scholar] [CrossRef] [PubMed]
- Zidan, D.; Ismaiel, O.A.; Hassan, W.S.; Shalaby, A. Simple spectrophotometric and conductometric methods for determination of gemifloxacin in pure, pharmaceutical dosage form and human urine. J. Appl. Pharm. Sci. 2016, 6, 136–143. [Google Scholar] [CrossRef] [Green Version]
- Reddy, K.D.; Kumar, B.V.; Sayanna, K.; Venkateshwalu, G. Spectrophotometric determination of drugs based on oxidation by acidic KMnO4. World J. Pharm. Sci. 2014, 3, 812. [Google Scholar]
- Ebraheem, S.A.; Elbashir, A.A.; Aboul-Enein, H.Y. Spectrophotometric methods for the determination of gemifloxacin in pharmaceutical formulations. Acta Pharm. Sin. B 2011, 1, 248. [Google Scholar] [CrossRef] [Green Version]
- Moussa, B.A.; Mahrouse, M.A.; Hassan, M.A.; Fawzy, M.G. Spectrofluorimetric determination of gemifloxacin mesylate and linezolid in pharmaceutical formulations: Application of quinone-based fluorophores and enhanced native fluorescence. Acta Pharm. 2014, 64, 15. [Google Scholar] [CrossRef] [Green Version]
- Al-Tamimi, S.A.; Alarfaj, N.A.; Aly, F.A.; Al-Mohaimeed, A.M. Spectrofluorimetric analysis of gemifloxacin mesylate in pharmaceutical formulations. Luminescence 2014, 29, 127. [Google Scholar] [CrossRef]
- Al-Tamimi, S.A.; Al-Mohaimeed, A.M.; Alarfaj, N.A.; Aly, F.A. Electrochemical determination of gemifloxacin mesylate in commercial tablets and biological fluids by differential pulse polarography. Int. J. Electrochem. Sci. 2020, 15, 8386. [Google Scholar] [CrossRef]
- Ali, S.A.; Hassan, A.; Muhammad, M. Cyclic voltammetric studies of gemifloxacin using gold electrode in presence of Britton-Robinson buffer. Pak. J. Pharm. Sci. 2018, 31, 473–480. [Google Scholar] [PubMed]
- Attia, A.K.; Abd-Elmoety, M.; Badawy, A.M.; Abd-Elaleem, A.E.; Abd-Elhamid, S.G. Electroanalytical determination of gemifloxacin mesylate in bulk, tablets and human urine using gold nanoparticles modified carbon paste electrode. Anal. Bioanal. Chem. Res. 2014, 1, 128–138. [Google Scholar]
- Radi, A.E.; Khafagy, A.; El-Shobaky, A.; El-Mezayen, H. Anodic voltammetric determination of gemifloxacin using screen-printed carbon electrode. J. Pharm. Anal. 2013, 3, 132. [Google Scholar] [CrossRef] [Green Version]
- Mahmoud, A.M.; Atia, N.N.; El-Shabouri, S.R.; El-Koussi, W.M. Development and validation of stability indicating HPTLC assay for determination of gemifloxacin mesylate in dosage forms, American. J. Anal. Chem. 2015, 16, 85. [Google Scholar] [CrossRef] [Green Version]
- Abdallah, N.A. HPLC and densitometric TLC methods for simultaneous determination of gemifloxacin with some co-administered drugs in human plasma. J. Chromatogr. Sep. Tech. 2014, 5, 1. [Google Scholar] [CrossRef] [Green Version]
- Rudrapal, M.; Hussain, N.J. Method development and validation of gemifloxacin in tablet dosage form by RP-HPLC. Drug Deliv. Ther. 2020, 10, 97. [Google Scholar] [CrossRef]
- Yıldırım, S.; Karakoç, H.N.; Yaşar, A.; Köksal, İ. Determination of levofloxacin, ciprofloxacin, moxifloxacin and gemifloxacin in urine and plasma by HPLC–FLD–DAD using pentafluorophenyl core–shell column: Application to drug monitoring. Biomed. Chromatogr. 2020, 34, e4925. [Google Scholar] [CrossRef]
- Wagdy, H.A.; Tarek, M.; Ahmed, A.M.; Gamal, M.; Elmazar, M.A. Validated reverse phase-ultra performance liquid chromatography method for the determination of gemifloxacin mesylate in bulk and its pharmaceutical preparation. Turk. J. Pharm. Sci. 2019, 16, 8. [Google Scholar] [CrossRef]
- Sagirli, O.; Demirci, S.; Önal, A.A. Very simple high-performance liquid chromatographic method with fluorescence detection for the determination of gemifloxacin in human breast milk. Luminescence 2015, 30, 1326–1329. [Google Scholar] [CrossRef]
- Nageswara, R.R.; Naidu, C.G.; Guru, P.K.; Padiya, R.; Agwane, S.B. Determination of gemifloxacin on dried blood spots by hydrophilic interaction liquid chromatography with fluorescence detector: Application to pharmacokinetics in rats. Biomed. Chromatogr. 2012, 26, 1534. [Google Scholar] [CrossRef] [PubMed]
- Kaiser, M.; Grünspan, L.D.; Dalla, C.T.; Tasso, L. Reversed phase liquid chromatography method with fluorescence detection of gemifloxacin in rat plasma and its application to the pharmacokinetic study. J. Chromatogr. B 2011, 79, 3639. [Google Scholar] [CrossRef] [PubMed]
- Omran, N.H.; Wagdy, H.A.; Abdel-Halim, M.; El Nashar, R.M. Validation and application of Molecularly Imprinted Polymers for SPE/UPLC–MS/MS Detection of Gemifloxacin Mesylate. Chromatographia 2019, 82, 1617. [Google Scholar] [CrossRef]
- Denadai, M.; Cass, Q.B. Simultaneous determination of fluoroquinolones in environmental water by liquid chromatography–tandem mass spectrometry with direct injection: A green approach. J. Chromatogr. A 2015, 1418, 177–184. [Google Scholar] [CrossRef]
- Kadi, A.A.; Angawi, R.F.; Attwa, M.W.; Darwish, H.W.; Abdelhameed, A.S. High throughput quantitative bioanalytical LC/MS/MS determination of gemifloxacin in human urine. J. Chem. 2013, 2013, 905704. [Google Scholar] [CrossRef] [Green Version]
- Mohaimeed, A.M.; Al-Tamimi, S.A.; Alarfaj, N.A.; Aly, F.A. New coated wire sensors for potentiometric determination of gemifloxacin in pure form, pharmaceutical formulations and biological fluids. Int. J. Electrochem. Sci. 2012, 7, 12518. [Google Scholar] [CrossRef]
- Abo-Talib, N.F. Ion selective electrodes for stability-indicating determination of gemifloxacin mesylate. Anal. Bioanal. Electrochem. 2013, 5, 74–86. [Google Scholar]
- Elbashir, I.M. Development and validation of potentiometric ZnO nanorods modified ion selective electrode for determination of gemifloxacin in pharmaceutical formulation. Cur. Trends Anal. Bioanal. Chem. 2017, 1, 50–56. [Google Scholar]
- Abdallah, N.A.; Ibhrahim, H.F.; Hegabe, N.H. Comparative study of molecularly imprinted polymer and magnetic molecular imprinted nanoparticles as recognition sites for the potentiometric determination of gemifloxacin mesylate. Int. J. Electrochem. 2017, 2, 10894–10910. [Google Scholar] [CrossRef]
- El-Kosasy, A.M.; Nebsen, M.; Abd El-Rahman, M.K.; Salem, M.Y.; El-Bardicy, M.G. Comparative Study of 2-Hydroxy Propyl 534 Beta Cyclodextrin and Calixarene as Ionophores in Potentiometric Ion-Selective Electrodes for Neostigmine Bromide. Talanta 2011, 85, 913–918. [Google Scholar] [CrossRef]
- AlRabiah, H.; Abounassif, M.; Aljohar, H.I.; Mostafa, G.A. New potentiometric sensors for methylphenidate detection based on host-guest interaction. BMC Chem. 2019, 13, 121 . [Google Scholar] [CrossRef] [Green Version]
- Mokhtari, B.; Pourabdollah, K.; Dalali, N. Analytical Applications of Calixarenes from 2005 Up-to-Date. J. Incl. Phenom. Macrocycl. Chem. 2011, 69, 1–55. [Google Scholar] [CrossRef]
- Mura, P. Analytical Techniques for Characterization of Cyclodextrin Complexes in Aqueous Solution: A Review. J. Pharm. Biomed. Anal. 2014, 101, 238–250. [Google Scholar] [CrossRef] [PubMed]
- Almalik, A.; Alrabiah, H.; Ghabbour, H.; Abounassif, M.; Mostafa, G.A.-H. Beta-and Gamma-Cyclodextrin Ionophores as 513 Electroactive Materials for Construction of New Polyvinyl Chloride Sensors for Eletriptan Based on Host-Guest Recognition. Mater. Express 2018, 8, 182–188. [Google Scholar] [CrossRef]
- Alrabiah, H.; Al-Majed, A.; Abounassif, M.; Mostafa, G.A. Ionophore-based potentiometric PVC membrane sensors for determination of phenobarbitone in its pharmaceutical formulations. Acta Pharm. 2016, 66, 503. [Google Scholar] [CrossRef] [Green Version]
- Urraca, J.; Castellari, M.; Barrios, C.; Moreno-Bondi, M. Multiresidue analysis of fuoroquinolone antimicrobials in chicken meat by molecularly imprinted solid-phase extraction and high-performance liquid chromatography. J. Chromatogr. A 2014, 1343, 1–9. [Google Scholar] [CrossRef]
- Buck, R.P.; Lindner, E. Recommendations for nomenclature of ion selective electrodes. Pure Appl. Chem. 1994, 66, 2527. [Google Scholar] [CrossRef]
- Umezawa, Y.; Bühlmann, P.; Umezawa, K.; Tohda, K.; Amemiya, S. Potentiometric selectivity coefficients of ion-selective electrodes. Part I. Inorganic cations. Pure Appl. Chem. 2000, 72, 185. [Google Scholar] [CrossRef]
- Thompson, M.; Ellison, S.L.; Wood, R. Harmonized guidelines for single-laboratory validation of methods of analysis (IUPAC Technical Report). Pure Appl. Chem. 2002, 74, 835–855. [Google Scholar] [CrossRef]
- Paim, C.S.; Führ, F.; Steppe, M.; Schapoval, E.E. Gemifloxacin mesylate: UV spectrophotometric method for quantitative determination using experimental design for robustness. Quim. Nova 2012, 35, 193. [Google Scholar] [CrossRef] [Green Version]
- Miller, J.N.; Miller, J.C. Statistics and Chemometrics for Analytical, 539 Chemistry; Pearson: London, UK, 2005. [Google Scholar]
- AlRabiah, H.; Ezzeldin, E.; Abounassif, M.; Abdel-Hafiz, M.G. PVC Sensors for Ciprofloxacin Based on Inclusion Complex with β-and γ-Cyclodextrin. Curr. Pharm. Anal. 2018, 14, 382–388. [Google Scholar] [CrossRef]
- Abdel-Hafiz, M.G.; Hefnawy, M.; Abounassif, M.; Alanazi, A.; Al-Majed, A.; Homoda, A. Ion selective electrodes for potentiometric determination of tizanidine in its pharmaceutical dosage form. Curr. Pharm. Anal. 2016, 12, 177–184. [Google Scholar] [CrossRef]


| Concentration, mg | Sensor 1 | Sensor 2 | Sensor 3 | |
|---|---|---|---|---|
| Lipophilic Ion | Carrier | Slope ± SD * | ||
| 2 | 25 | 47 ± 0.4 | 52 ± 0.5 | 52 ± 0.5 |
| 3 | 25 | 52 ± 0.5 | 53 ± 0.4 | 55 ± 0.4 |
| 5 | 25 | 55 ± 0.3 | 56 ± 0.4 | 60 ± 0.3 |
| 7 | 25 | 55 ± 0.3 | 56 ± 0.3 | 60 ± 0.3 |
| 9 | 0 | 43 ± 0.5 | 45 ± 0.5 | 60 ± 0.4 |
| 5 | 5 | 52 ± 0.5 | 52 ± 0.5 | 54 ± 0.5 |
| 5 | 10 | 52 ± 0.5 | 53 ± 0.4 | 55 ± 0.4 |
| 5 | 15 | 53 ± 0.4 | 54 ± 0.4 | 56 ± 0.4 |
| 5 | 20 | 55 ± 0.4 | 56 ± 0.3 | 60 ± 0.3 |
| 5 | 25 | 55 ± 0.4 | 56 ± 0.3 | 60 ± 0.3 |
| 5 | 30 | 55 ± 0.4 | 56 ±0.3 | 60 ± 0.3 |
| Plasticizer | DOP | DBS | o-NPOE |
|---|---|---|---|
| Sensor 1 | |||
| Slope, mV | 55 | 53 | 55 |
| Response time, Sec | 20 | 25 | 20 |
| Calibration range, mol L−1 | 9 × 10⁻⁶–103 | 9 × 10⁻⁶–10−3 | 8 × 10⁻⁶–10−3 |
| Sensor 2 | |||
| Slope, mV | 55 | 53 | 56 |
| Response time, Sec | 20 | 20 | 20 |
| Calibration range, mol L−1 | 8 × 10⁻⁶–10−3 | 9 × 10⁻⁶–10−3 | 8 × 10⁻⁶–10−3 |
| Sensor 3 | |||
| Slope, mV | 58 | 55 | 60 |
| Response time, Sec | 20 | 25 | 20 |
| Calibration range, mol L−1 | 8 × 10⁻⁶–10−3 | 9 × 10⁻⁶–10−3 | 8 × 10⁻⁶–10−3 |
| Interfering Species | |||
|---|---|---|---|
| Na+ | 1.1 × 10⁻³ | 0.9 × 10⁻³ | 1.2 × 10⁻³ |
| K+ | 1.2 × 10⁻² | 1.2 × 10⁻³ | 1.3 × 10⁻³ |
| Ca2+ | 1.1 × 10⁻² | 1.3 × 10⁻³ | 1.2 × 10⁻³ |
| Fe2+ | 1.2 × 10⁻² | 1.4 × 10⁻³ | 1.7 × 10⁻³ |
| Magnesium Stearate | 1.2 × 10⁻³ | 1.5 × 10⁻³ | 1.2 × 10⁻³ |
| Acetate | 1.3 × 10⁻³ | 1.3 × 10⁻³ | 1.3 × 10⁻³ |
| Phosphate | 1.3 × 10⁻³ | 1.3 × 10⁻³ | 1.3 × 10⁻³ |
| Benzoate | 1.2 × 10⁻³ | 1.3 × 10⁻³ | 1.3 × 10⁻³ |
| Caffeine | 1.2 × 10⁻³ | 1.3 × 10⁻³ | 1.3 × 10⁻⁴ |
| Citrate | 1.2 × 10⁻³ | 1.5 × 10⁻³ | 1.2 × 10⁻³ |
| Glucose * | 1.4 × 10⁻³ | 1.5 × 10⁻³ | 1.8 × 10⁻³ |
| Lactose monohydrate * | 1.4 × 10⁻³ | 1.5 × 10⁻³ | 1.8 × 10⁻³ |
| Starch * | 1.4 × 10⁻³ | 1.5 × 10⁻³ | 1.7 × 10⁻³ |
| Microcrystalline cellulose * | 1.4 × 10⁻³ | 1.4 × 10⁻³ | 1.6 × 10⁻³ |
| Parameter | Sensor 1 | Sensor 2 | Sensor 3 |
|---|---|---|---|
| Slope, (mV decade−1) | 55 | 56 | 60 |
| Intercept, mV | 239 ± 0.5 | 244 ± 0.5 | 240 ± 0.5 |
| Correlation Coefficient, (r2) | 0.999 | 0.998 | 0.999 |
| Calibration rang, M | 8 × 10⁻⁶–1 × 10⁻² | 9 × 10⁻⁶–1 × 10⁻² | 8 × 10⁻⁶–1 × 10⁻² |
| LOQ, mol L−1 | 8 ×10⁻⁶ | 9 × 10⁻⁶ | 8 ×10⁻⁶ |
| LOD, mol L−1 | 2.40 × 10⁻⁶ | 2.70 × 10⁻⁶ | 2.42 × 10⁻⁶ |
| Response time, sec | 20 ± 0.5 | 20 ± 0.5 | 20 ± 0.5 |
| pH range | 6–9 | 6–9 | 6–9 |
| Concentration (µg mL−1) | During a Day | ||
|---|---|---|---|
| Sensor 1 | Sensor 2 | Sensor 3 | |
| Recovery, % ± RSD% * | Recovery, %± RSD% | Recovery, % ± RSD% | |
| 5.0 | 97.5 ± 2.7 | 97.5± 2.8 | 97.5 ± 2.8 |
| 25 | 98.0 ± 2.7 | 97.5 ± 2.6 | 97.5 ± 2.7 |
| 100 | 98.5 ± 2.0 | 98.0 ± 1.9 | 98.0 ± 1.9 |
| 200 | 99.0 ± 1.8 | 98.0± 1.8 | 98.0 ± 1.8 |
| 300 | 99.0 ± 1.8 | 98.0 ± 1.7 | 99.0 ± 1.8 |
| 3000 | 99.0 ± 1.7 | 99.0 ± 1.7 | 99.0 ± 1.8 |
| Within-days | |||
| 5 | 97.5 ± 2.9 | 97.5 ± 2.8 | 97.5 ± 2.9 |
| 25 | 97.6 ± 2.8 | 97.5 ± 2.7 | 97.5 ± 2.6 |
| 100 | 98.0 ± 2.6 | 97.5 ± 2.5 | 97.5 ± 2.5 |
| 200 | 98.5 ± 2.3 | 98.0 ± 2.5 | 98.0 ± 2.2 |
| 300 | 98.5 ± 2.3 | 98.0 ± 2.3 | 98.0 ± 2.2 |
| 3000 | 99.0 ± 2.3 | 98.0 ± 2.3 | 99.5 ± 2.3 |
| Ion-Pair | Calibration Range | Matrix | Slope, mV | Measuring Medium | Ref. |
|---|---|---|---|---|---|
| GF-reineckate | 1 × 10⁻⁵–1 × 10⁻² | PVC | 20 | Aqueous | 26 |
| Hydroxypropyl-β-cyclodextrine | 0.5–1000 μM | ZnO nanoroad | 33 | Phosphate buffer | 27 |
| GF-PM GF-PT | 1 × 10⁻⁷–1 × 10⁻² | Coated-wire | 55 | Aqueous | 28 |
| β-CD | 8 × 10⁻⁶–1 × 10⁻² | PVC | 55 | pH 7 | This work |
| γ-CD | 56 | ||||
| Calixarene | 60 |
| Concentration Added (µg mL−1) | Recovery ± RSD Sensor 1 | Recovery ± RSD Sensor 2 | Recovery ± RSD Sensor 3 |
|---|---|---|---|
| 5 | 97.5 ± 2.8 | 97.0 ± 2.8 | 97.5 ± 2.7 |
| 25 | 97.5 ± 2.6 | 97.5 ± 2.5 | 97.5 ± 2.5 |
| 50 | 98.0 ± 2.4 | 98.0 ± 2.4 | 98.0 ± 2.3 |
| 100 | 98.5 ± 2.1 | 98.5 ±2.0 | 98.5 ± 2.0 |
| 200 | 99.5 ± 2.0 | 98.5 ±2.0 | 98.5 ±2.0 |
| 300 | 99.0 ± 1.8 | 99.0 ± 2.0 | 99.0 ± 1.8 |
| 3000 | 99.0 ± 1.8 | 99.0 ± 1.8 | 99.0 ± 1.7 |
| Preparation | Sensor 1 Recovery ± RSD | Sensor 2 Recovery ± RSD | Sensor 3 Recovery ± RSD | Reported Method [40] |
|---|---|---|---|---|
| FACTIVE 320 mg | 98.5 ± 2.9 | 98.0 ± 2.85 | 99 ± 2.80 | 98.5 ± 2.8 |
| t test | 0.10 | 0.098 | 0.163 | |
| F test | 1.10 | 1.12 | 1.56 |
Disclaimer/Publisher’s Note: The statements, opinions and data contained in all publications are solely those of the individual author(s) and contributor(s) and not of MDPI and/or the editor(s). MDPI and/or the editor(s) disclaim responsibility for any injury to people or property resulting from any ideas, methods, instructions or products referred to in the content. |
© 2023 by the authors. Licensee MDPI, Basel, Switzerland. This article is an open access article distributed under the terms and conditions of the Creative Commons Attribution (CC BY) license (https://creativecommons.org/licenses/by/4.0/).
Share and Cite
Mostafa, G.A.E.; Ali, E.A.; Alsalahi, R.A.; Alrabiah, H. Fabrication and Applications of Potentiometric Membrane Sensors Based on Specific Recognition Sites for the Measurement of the Quinolone Antibacterial Drug Gemifloxacin. Molecules 2023, 28, 5144. https://doi.org/10.3390/molecules28135144
Mostafa GAE, Ali EA, Alsalahi RA, Alrabiah H. Fabrication and Applications of Potentiometric Membrane Sensors Based on Specific Recognition Sites for the Measurement of the Quinolone Antibacterial Drug Gemifloxacin. Molecules. 2023; 28(13):5144. https://doi.org/10.3390/molecules28135144
Chicago/Turabian StyleMostafa, Gamal A.E., Essam A. Ali, Rashad A. Alsalahi, and Haitham Alrabiah. 2023. "Fabrication and Applications of Potentiometric Membrane Sensors Based on Specific Recognition Sites for the Measurement of the Quinolone Antibacterial Drug Gemifloxacin" Molecules 28, no. 13: 5144. https://doi.org/10.3390/molecules28135144