Author Contributions
Conceptualization, A.Y.S., G.I.H. and F.K.A.; methodology, A.Y.S., W.Q. and G.I.H.; software, A.Y.S. and G.I.H.; validation, A.Y.S. and G.I.H.; formal analysis, A.Y.S. and A.A.S.; investigation, A.Y.S.; resources, G.I.H. and A.A.S.; data curation, A.Y.S., G.I.H. and A.A.S.; writing—original draft preparation, A.Y.S. and G.I.H.; writing—review and editing, G.I.H., A.A.S. and F.K.A.; visualization, A.Y.S., W.Q. and G.I.H.; software supervision, G.I.H. and F.K.A.; project administration, G.I.H. and F.K.A.; funding acquisition, G.I.H. and F.K.A. All authors have read and agreed to the published version of the manuscript.
Figure 1.
The effect of independent variables, solid lipid: liquid oil ratio and type of liquid oil on the measured responses (A) particle size, (B) PDI, and (C) zeta potential of plain NLC. Red, green, and blue colors represent the curves of a formulation containing LFCA, LCM, and LCT, respectively.
Figure 2.
Graphical representation of the effects of (A) solid lipid: liquid oil ratio and (B) type of liquid oil on droplet size. Red dotted horizontal line and plus sign represent the average value over factor B at the focused point of factor A = 1.665, respectively. Green dotted lines represent 95% CI bands. Red circles and black squares represent design points and predicted values, respectively.
Figure 3.
Graphical representation of the effects of (A) solid lipid: liquid oil ratio and (B) type of liquid oil on PDI. Red dotted horizontal line and plus sign represent the average value over factor B at the focused point of factor A = 1.665, respectively. Green dotted lines represent 95% CI bands. Red circles and black squares represent design points and predicted values, respectively.
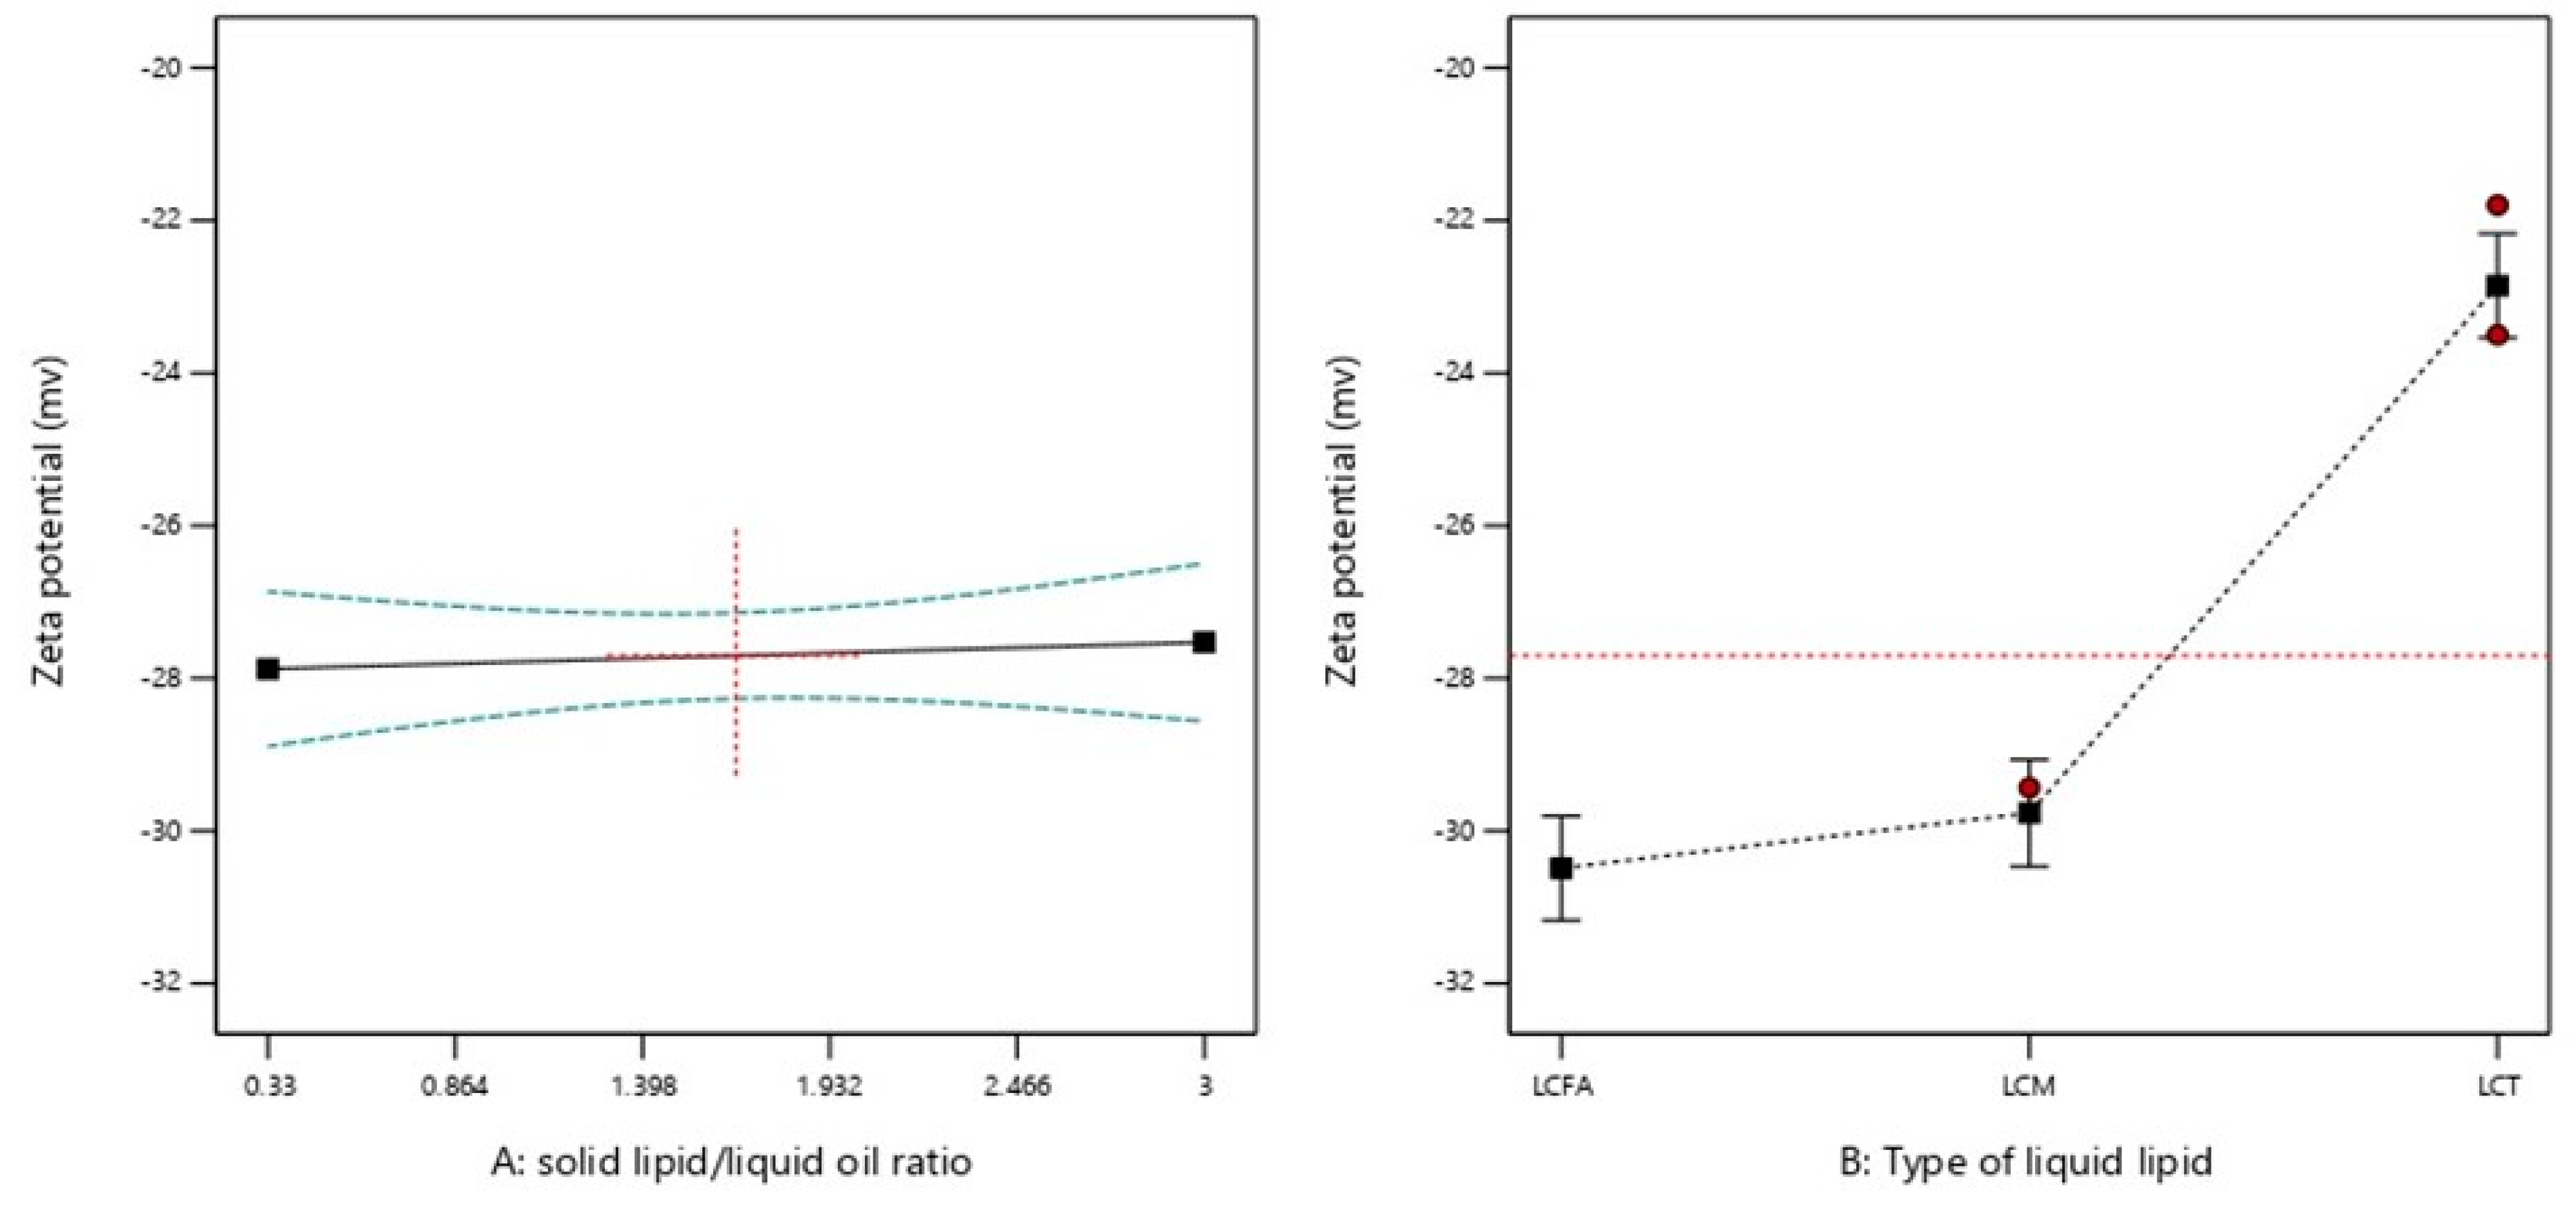
Figure 4.
Graphical representation of the effects of (A) solid lipid: liquid oil ratio and (B) type of liquid oil on zeta-potential value. Red dotted horizontal line and plus sign represent the average value over factor B at the focused point of factor A = 1.665, respectively. Green dotted lines represent 95% CI bands. Red circles and black squares represent design points and predicted values, respectively.
Figure 5.
Influence of GEF loading on (A) PS and (B) ZP of different plain NLC formulations. Data were expressed as the mean ± SD, N = 3, p-value significant at ** 0.01.
Figure 5.
Influence of GEF loading on (A) PS and (B) ZP of different plain NLC formulations. Data were expressed as the mean ± SD, N = 3, p-value significant at ** 0.01.
Figure 6.
Morphological appearance and SEM image of crushed crystals of (A,D) SA, (B,E) SA: LCFA (3:1), and (C,F) SA:LCT (3:1). The agents were physically mixed and heated to obtain a melted lipid mixture and then cooled in the refrigerator.
Figure 6.
Morphological appearance and SEM image of crushed crystals of (A,D) SA, (B,E) SA: LCFA (3:1), and (C,F) SA:LCT (3:1). The agents were physically mixed and heated to obtain a melted lipid mixture and then cooled in the refrigerator.
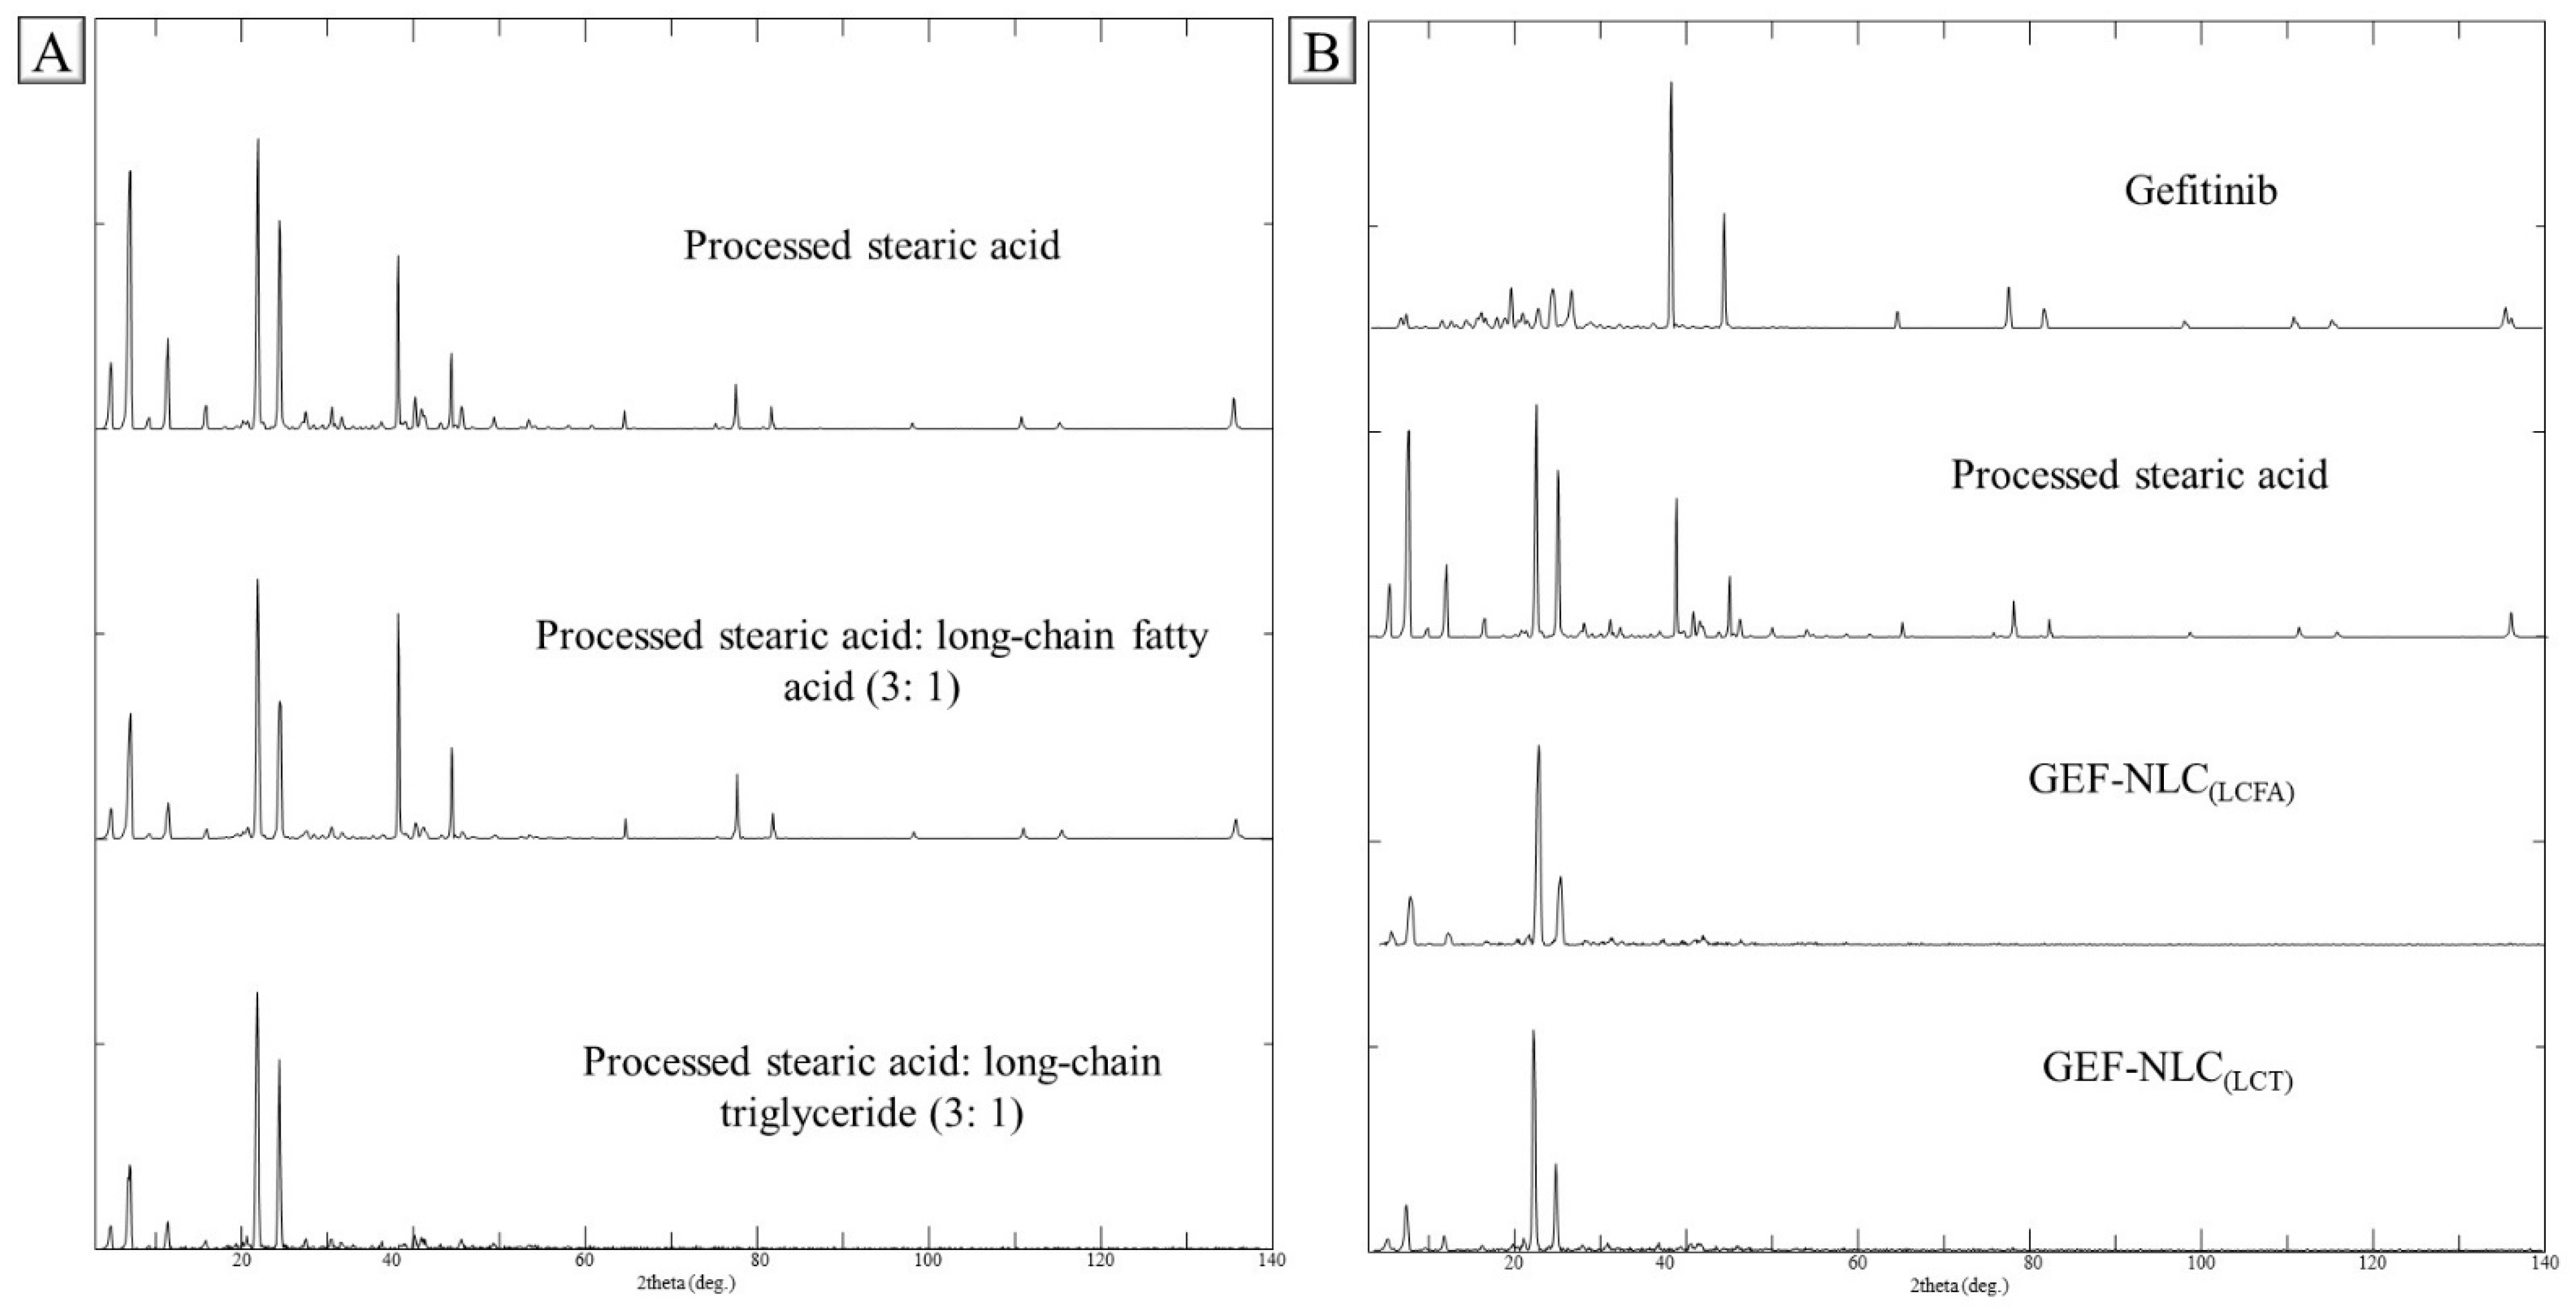
Figure 7.
PXRD of (A) processed SA, processed SA:LCFA (3:1), and processed SA:LCT (3:1), (B) GEF, processed SA, GEF-NLC(LCFA), and GEF-NLC(LCT).
Figure 7.
PXRD of (A) processed SA, processed SA:LCFA (3:1), and processed SA:LCT (3:1), (B) GEF, processed SA, GEF-NLC(LCFA), and GEF-NLC(LCT).
Figure 8.
In vitro release of GEF from GEF-NLC(LCFA) and GEF-NLC(LCT) formulations. Data are expressed as the mean ± SD, N = 3.
Figure 8.
In vitro release of GEF from GEF-NLC(LCFA) and GEF-NLC(LCT) formulations. Data are expressed as the mean ± SD, N = 3.
Figure 9.
Schematic diagram of lipid core distribution of SA, LCT, LCFA, and GEF within GEF-NLC(LCT), GEF-NLC(LCFA), and GEF-SLN. LCT showed limited GEF solubility compared to LCFA.
Figure 9.
Schematic diagram of lipid core distribution of SA, LCT, LCFA, and GEF within GEF-NLC(LCT), GEF-NLC(LCFA), and GEF-SLN. LCT showed limited GEF solubility compared to LCFA.
Figure 10.
(A) Particle size and PDI and (B) zeta potential values of GEF-NLC(LCFA) and GEF-NLC(LCT). Data are expressed as the mean ± SD, N = 3.
Figure 10.
(A) Particle size and PDI and (B) zeta potential values of GEF-NLC(LCFA) and GEF-NLC(LCT). Data are expressed as the mean ± SD, N = 3.
Figure 11.
Effect of plain NLC, pure GEF, and GEF-NLC(LCFA) on A549 cell viability after (A) 24 h, (B) 48 h, and (C) 72 h, respectively. Data are expressed as mean ± SD, N = 3.
Figure 11.
Effect of plain NLC, pure GEF, and GEF-NLC(LCFA) on A549 cell viability after (A) 24 h, (B) 48 h, and (C) 72 h, respectively. Data are expressed as mean ± SD, N = 3.
Figure 12.
IC50 of pure GEF and GEF-NLC(LCFA) following 24, 48, and 72 h incubation. Data are expressed as mean ± SD, N = 3, p-value significant at *** 0.001.
Figure 12.
IC50 of pure GEF and GEF-NLC(LCFA) following 24, 48, and 72 h incubation. Data are expressed as mean ± SD, N = 3, p-value significant at *** 0.001.
Table 1.
Physicochemical properties of suggested plain NLC formulation based on the DOE model.
Table 1.
Physicochemical properties of suggested plain NLC formulation based on the DOE model.
| Formulation Code | Factors | Responses |
|---|
| X1: Solid Lipid: Liquid Lipid Ratio (SL/LO) | X2: Type of Liquid Lipid | Y1: PS (nm) | Y2: PDI | Y3: ZP (mv) | Y4: Aggregation upon Storage |
|---|
| 9 | 0.33 | LCFA | 189.6 | 0.139 | −31.1 | Yes |
| 8 | 0.70 | LCFA | 207.7 | 0.129 | −29.8 | Yes |
| 5 | 1.68 | LCFA | 216.1 | 0.134 | −31.1 | No |
| 12 | 1.68 | LCFA | 229.6 | 0.152 | −28.9 | No |
| 4 | 2.65 | LCFA | 235.3 | 0.162 | −31.7 | No |
| 7 | 2.65 | LCFA | 225.6 | 0.15 | −30.4 | No |
| 1 | 0.68 | LCM | 235.1 | 0.262 | −31.4 | Yes |
| 14 | 0.68 | LCM | 244.5 | 0.248 | −29.5 | Yes |
| 17 | 1.67 | LCM | 375.3 | 0.267 | −29.4 | Yes |
| 3 | 2.63 | LCM | 390.6 | 0.261 | −30.4 | Yes |
| 6 | 2.63 | LCM | 399.1 | 0.349 | −28.1 | Yes |
| 13 | 0.33 | LCT | 220.7 | 0.175 | −22.7 | No |
| 10 | 1.00 | LCT | 219.5 | 0.195 | −23.8 | No |
| 15 | 1.67 | LCT | 292.9 | 0.211 | −23.5 | No |
| 16 | 1.67 | LCT | 215.2 | 0.19 | −21.8 | No |
| 11 | 2.33 | LCT | 318 | 0.215 | −21.9 | No |
| 2 | 3.00 | LCT | 279.9 | 0.211 | −23.4 | No |
Table 2.
ANOVA analysis of the measured responses for the selected models.
Table 2.
ANOVA analysis of the measured responses for the selected models.
| Response | Selected Model | Degree of Freedom | Adjusted R2 | Predicted R2 | F-Value | p-Value |
|---|
| PS | 2FI | 2 | 0.8346 | 0.7771 | 5.97 | 0.0175 |
| PDI | Linear | 3 | 0.8838 | 0.8246 | 35.91 | <0.0001 |
| ZP | Linear | 3 | 0.9184 | 0.8868 | 61.03 | <0.0001 |
Table 3.
ANOVA of the quadratic model presenting the correlation (p-value) between independent formulation variables and measured physicochemical properties (PS, PDI, and ZP).
Table 3.
ANOVA of the quadratic model presenting the correlation (p-value) between independent formulation variables and measured physicochemical properties (PS, PDI, and ZP).
| Response | X1: p-Value of Solid Lipid: Liquid Oil Ratio | X2: p-Value of Type of Liquid Lipid |
|---|
| PS | 0.0003 | 0.0001 |
| PDI | 0.0151 | <0.0001 |
| ZP | 0.6680 | <0.0001 |
Table 4.
Validation of the experimental design model (SL/LO = 3, Plain-NLC(LCFA)).
Table 4.
Validation of the experimental design model (SL/LO = 3, Plain-NLC(LCFA)).
| Response | n | SD | Predicted Mean | SE Pred | 95% PI Low | Data Mean | 95% PI High |
|---|
| PS | 3 | 27.40 | 238.89 | 26.2 | 181.3 | 252.7 | 296.5 |
| PDI | 3 | 0.023 | 0.162634 | 0.018 | 0.123 | 0.183 | 0.202 |
| ZP | 3 | 1.068 | −30.314 | 0.86 | −32.2 | −29.6 | −28.5 |
Table 5.
Validation of the experimental design model (SL/LO = 3, Plain-NLC(LCT)).
Table 5.
Validation of the experimental design model (SL/LO = 3, Plain-NLC(LCT)).
| Response | n | SD | Predicted Mean | SE Pred | 95% PI Low | Data Mean | 95% PI High |
|---|
| PS | 3 | 27.40 | 301.1 | 26.0 | 243.8 | 268.1 | 358.3 |
| PDI | 3 | 0.023 | 0.220 | 0.016 | 0.185 | 0.193 | 0.256 |
| ZP | 3 | 1.068 | −22.68 | 0.85 | −24.5 | −22.3 | −20.8 |
Table 6.
Drug content and EE% of GEF-NLC(LCFA) and GEF-NLC(LCT).
Table 6.
Drug content and EE% of GEF-NLC(LCFA) and GEF-NLC(LCT).
| Formulation | Drug Content (mg/mL) | EE (%) |
|---|
| GEF-NLC(LCFA) | 2.13 ± 0.48 | 94.48 ± 2.14 |
| GEF-NLC(LCT) | 2.09 ± 0.75 | 91.94 ± 3.08 |


 ,
, 


