
Dihydrogen Bonding—Seen through the Eyes of Vibrational Spectroscopy
Abstract
:1. Introduction
2. Results
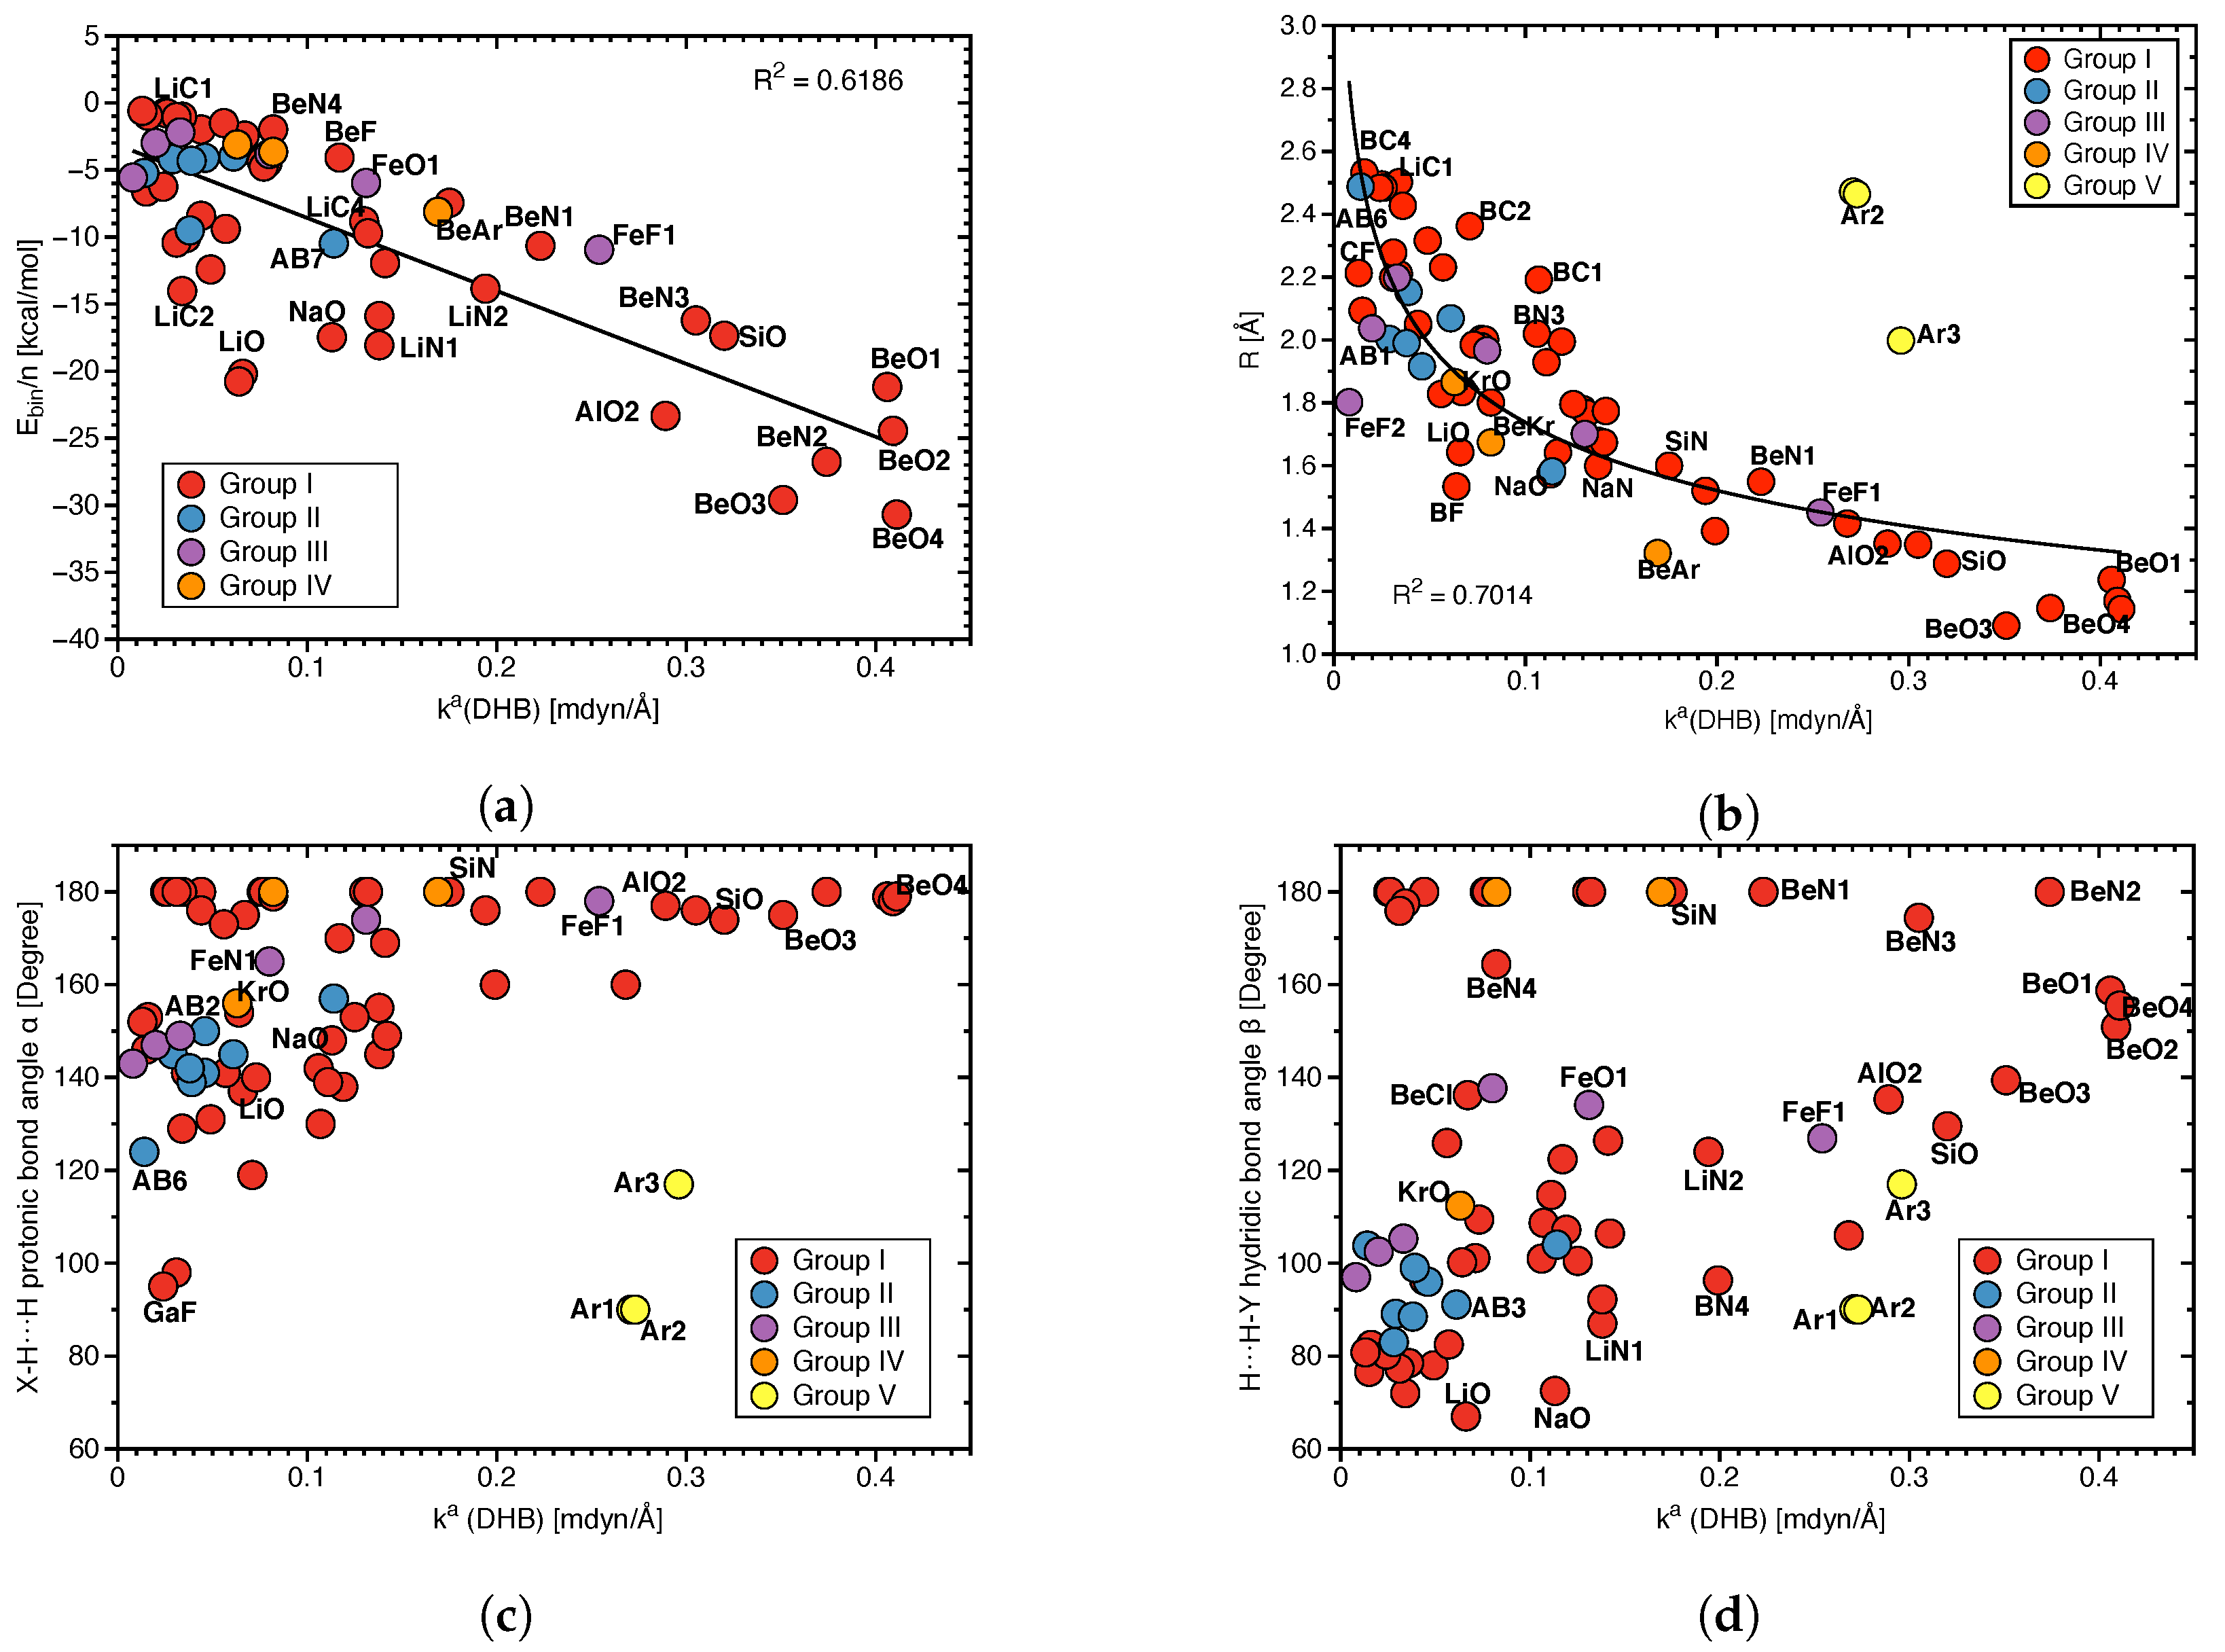
2.1. Overall Trends


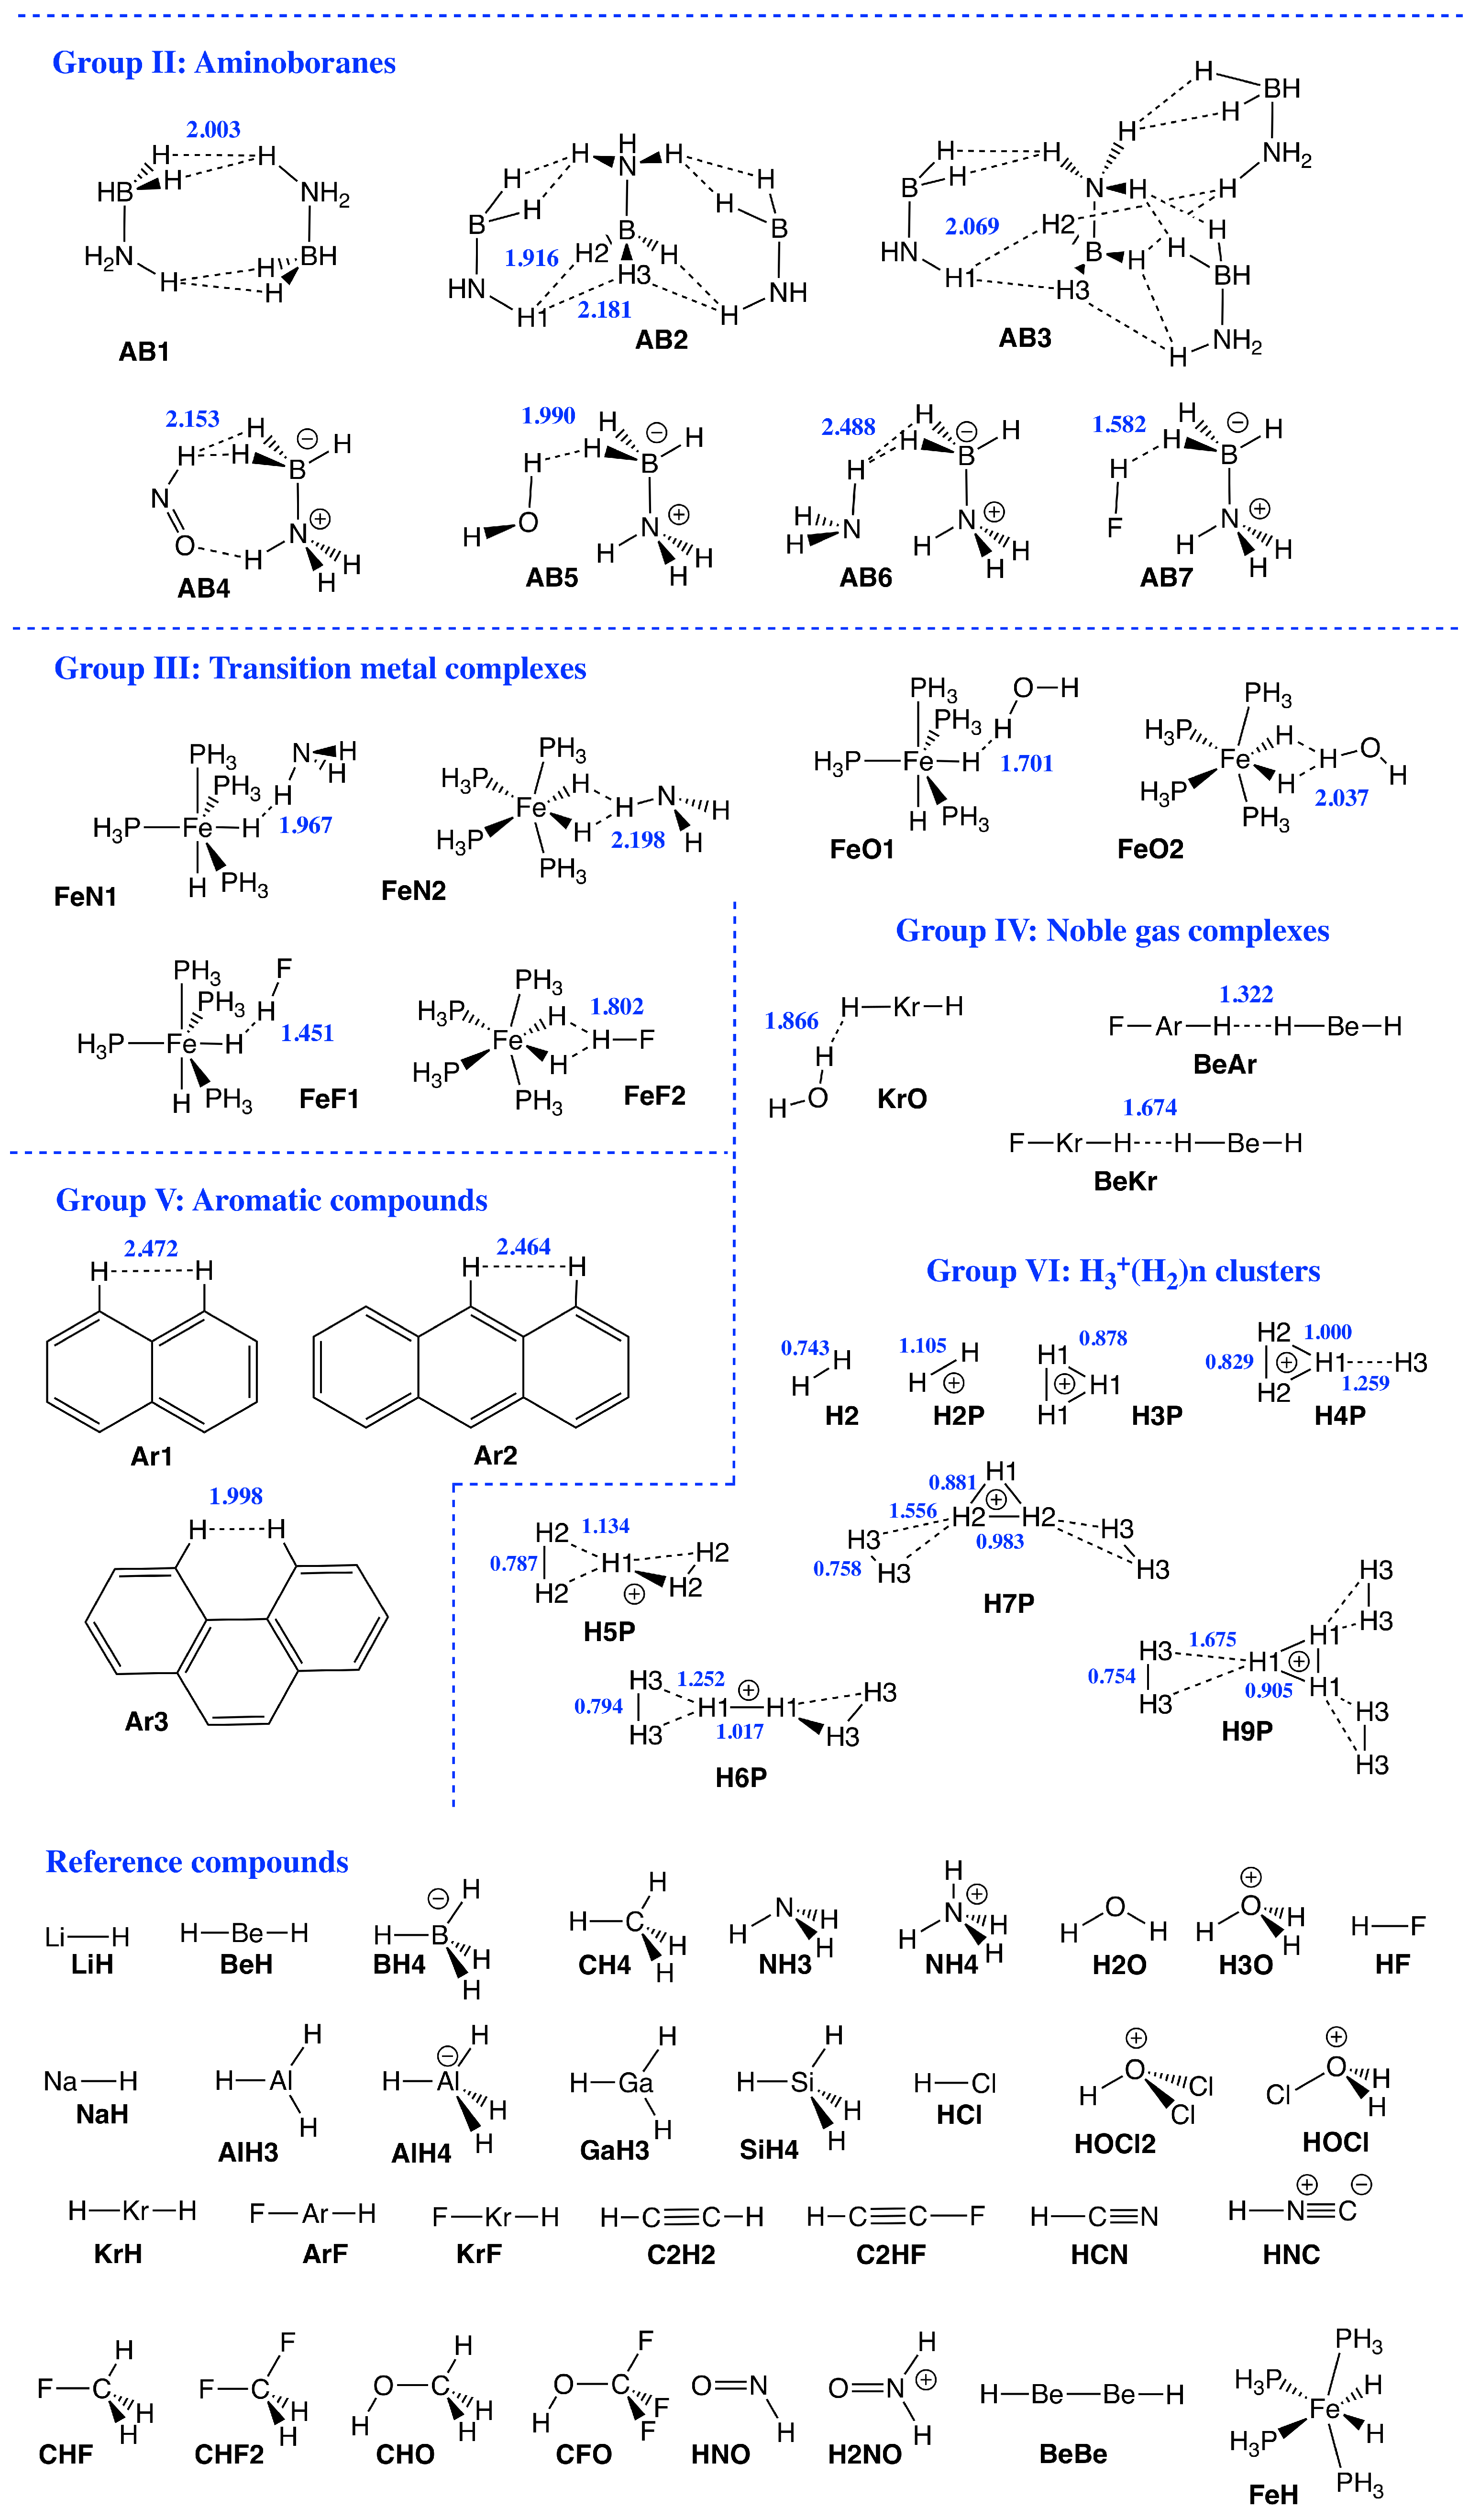
| Complex | q(H) | q(H) | Complex | q(H) | q(H) | Complex | q(H) | q(H) | |||
|---|---|---|---|---|---|---|---|---|---|---|---|
| LiC1 | 0.236 | −0.804 | 1.040 | BeN1 | 0.467 | −0.556 | 1.024 | BN5 | 0.404 | −0.078 | 0.482 |
| LiC2 | 0.213 | −0.769 | 0.982 | BeN2 | 0.418 | −0.530 | 0.948 | BO1 | 0.494 | −0.104 | 0.598 |
| LiC3 | 0.189 | −0.776 | 0.964 | BeN3 | 0.417 | −0.552 | 0.969 | BO2 | 0.491 | −0.104 | 0.595 |
| LiC4 | 0.249 | −0.815 | 1.064 | BeN4 | 0.439 | −0.500 | 0.939 | BS1 | 0.166 | −0.083 | 0.249 |
| LiC5 | 0.258 | −0.816 | 1.074 | BeO1 | 0.505 | −0.537 | 1.042 | BS2 | 0.166 | −0.092 | 0.258 |
| LiC6 | 0.269 | −0.816 | 1.086 | BeO2 | 0.521 | −0.515 | 1.036 | BF | 0.565 | −0.162 | 0.727 |
| LiN1 | 0.326 | −0.740 | 1.066 | BeO3 | 0.497 | −0.467 | 0.964 | SiN | 0.462 | −0.310 | 0.772 |
| LiN2 | 0.428 | −0.769 | 1.197 | BeO4 | 0.558 | −0.484 | 1.042 | SiO | 0.534 | −0.292 | 0.826 |
| LiO | 0.493 | −0.729 | 1.222 | BeF | 0.558 | −0.484 | 1.042 | SiF | 0.552 | −0.229 | 0.781 |
| NaC1 | 0.238 | −0.809 | 1.048 | BeCl | 0.275 | −0.475 | 0.750 | AlO1 | 0.504 | −0.445 | 0.949 |
| NaC2 | 0.214 | −0.814 | 1.028 | BC1 | 0.227 | −0.079 | 0.306 | AlO2 | 0.513 | −0.449 | 0.962 |
| NaC3 | 0.190 | −0.818 | 1.008 | BC2 | 0.218 | −0.088 | 0.306 | AlF | 0.592 | −0.417 | 1.009 |
| NaC4 | 0.246 | −0.812 | 1.059 | BC3 | 0.262 | −0.140 | 0.402 | GaF | 0.575 | −0.323 | 0.898 |
| NaC5 | 0.258 | −0.817 | 1.075 | 0.262 | −0.063 | 0.325 | CF | 0.548 | 0.187 | 0.362 | |
| NaC6 | 0.271 | −0.819 | 1.090 | BC4 | 0.259 | −0.087 | 0.346 | 0.548 | 0.210 | 0.339 | |
| NaN1 | 0.313 | −0.756 | 1.068 | 0.259 | −0.071 | 0.330 | |||||
| NaO | 0.480 | −0.759 | 1.239 | BN1 | 0.380 | −0.093 | 0.474 | ||||
| BeC1 | 0.229 | −0.484 | 0.713 | BN2 | 0.461 | −0.092 | 0.554 | ||||
| BeC3 | 0.244 | −0.465 | 0.709 | BN4 | 0.466 | −0.085 | 0.551 |
| Group | Complex | q(H) | q(H) | Group | Complex | q(H) | q(H) | ||
|---|---|---|---|---|---|---|---|---|---|
| Aminoboranes | AB1 | 0.448 | −0.065 | 0.512 | Transition | FeN1 | 0.370 | 0.106 | 0.264 |
| 0.448 | −0.065 | 0.512 | metals | FeN2 | 0.350 | 0.132 | 0.218 | ||
| AB2 | 0.445 | −0.061 | 0.506 | FeO1 | 0.483 | 0.074 | 0.409 | ||
| 0.445 | −0.064 | 0.509 | FeO2 | 0.490 | 0.133 | 0.357 | |||
| 0.441(H1) | (H2) − 0.052 | 0.493 | FeF1 | 0.567 | 0.047 | 0.519 | |||
| 0.441(H1) | (H3) − 0.062 | 0.503 | FeF2 | 0.592 | 0.130 | 0.462 | |||
| AB3 | 0.443 | −0.058 | 0.502 | Noble gases | KrO | 0.464 | −0.300 | 0.765 | |
| 0.435(H1) | (H2,H3) − 0.056 | 0.491 | BeAr | 0.270 | −0.510 | 0.781 | |||
| AB4 | 0.296 | −0.063 | 0.359 | BeKr | 0.147 | −0.502 | 0.649 | ||
| 0.296 | −0.063 | 0.359 | Aromatic | Ar1 | 0.204 | 0.204 | 0.000 | ||
| AB5 | 0.494 | −0.074 | 0.568 | compounds | Ar2 | 0.204 | 0.193 | 0.011 | |
| AB6 | 0.388 | −0.065 | 0.453 | Ar3 | 0.202 | 0.202 | 0.000 | ||
| AB7 | 0.571 | −0.088 | 0.659 |


2.2. Some Group Specific Highlights

| Complex | Atom | q | Bond | ||
|---|---|---|---|---|---|
| Group VI | H2 | 0.000 | H-H | 0.000 | |
| H2P | 0.500 | H-H | 0.000 | ||
| H3P | 0.333 | H1-H1 | 0.000 | ||
| H4P | H1 | 0.161 | H1-H2 | 0.010 | |
| H2 | 0.171 | H2-H2 | 0.000 | ||
| H3 | 0.496 | H3-H1 | 0.334 | ||
| H5P | H1 | 0.281 | H1-H2 | 0.102 | |
| H2 | 0.180 | H2-H2 | 0.000 | ||
| H6P | H1 | 0.219 | H1-H1 | 0.000 | |
| H3 | 0.141 | H1-H3 | 0.078 | ||
| H7P | H1 | 0.209 | H1-H2 | 0.075 | |
| H2 | 0.284 | H2-H2 | 0.000 | ||
| H3 | 0.056 | H2-H3 | 0.228 | ||
| H3-H3 | 0.000 | ||||
| H9P | H1 | 0.262 | H1-H3 | 0.227 | |
| H3 | 0.035 | H3-H3 | 0.000 |
3. Methods and Computational Details
4. Conclusions
Supplementary Materials
Author Contributions
Funding
Institutional Review Board Statement
Informed Consent Statement
Data Availability Statement
Acknowledgments
Conflicts of Interest
Sample Availability
References
- Karas, L.J.; Wu, C.H.; Das, R.; Wu, J.I.C. Hydrogen bond design principles. Wiley Interdiscip. Rev. Comput. Mol. Sci. 2020, 10, e1477. [Google Scholar] [CrossRef] [PubMed]
- Grabowski, S.J. Understanding Hydrogen Bonds; Theoretical and Computational Chemistry Series; The Royal Society of Chemistry: London, UK, 2021. [Google Scholar]
- Scheiner, S. Understanding noncovalent bonds and their controlling forces. Int. J. Chem. Phys. 2020, 153, 140901. [Google Scholar] [CrossRef] [PubMed]
- Arunan, E. One Hundred Years After The Latimer and Rodebush Paper, Hydrogen Bonding Remains an Elephant! Indian J. Sci. 2020, 100, 249–255. [Google Scholar] [CrossRef] [Green Version]
- Gibb, B.C. The Centenary (maybe) of The Hydrogen Bond. Nat. Chem. 2020, 12, 665–667. [Google Scholar] [CrossRef] [PubMed]
- Mallamace, D.; Fazio, E.; Mallamace, F.; Corsaro, C. The role of hydrogen bonding in the folding/unfolding process of hydrated lysozyme: A review of recent NMR and FTIR results. Int. J. Mol. Sci. 2018, 19, 3825. [Google Scholar] [CrossRef] [Green Version]
- Bulusu, G.; Desiraju, G.R. Strong and Weak Hydrogen Bonds in Protein–Ligand Recognition. J. Indian Inst. Sci. 2019, 100, 31–41. [Google Scholar] [CrossRef]
- Mobika, J.; Rajkumar, M.; Sibi, S.L.; Priya, V.N. Investigation on hydrogen bonds and conformational changes in protein/polysaccharide/ceramic based tri-component system. Spectrochim. Acta A Mol. Biomol. Spectrosc. 2021, 244, 118836. [Google Scholar] [CrossRef]
- Belkova, N.V.; Epstein, L.M.; Filippov, O.A.; Shubina, E.S. Hydrogen and dihydrogen bonds in the reactions of metal hydrides. Chem. Rev. 2016, 116, 8545–8587. [Google Scholar] [CrossRef]
- Gadwal, I. A Brief Overview on Preparation of Self-Healing Polymers and Coatings via Hydrogen Bonding Interactions. Macromol 2021, 1, 18–36. [Google Scholar] [CrossRef]
- Bakhmutov, V.I. Dihydrogen Bonds; John Wiley & Sons: Hobroken, NJ, USA, 2008. [Google Scholar]
- Crabtree, R.H. Dihydrogen complexation. Chem. Rev. 2016, 116, 8750–8769. [Google Scholar] [CrossRef]
- Kubas, G.J. Dihydrogen complexes as prototypes for the coordination chemistry of saturated molecules. Proc. Natl. Acad. Sci. USA 2007, 104, 6901–6907. [Google Scholar] [CrossRef] [PubMed] [Green Version]
- Grabowski, S.J. Molecular Hydrogen as a Lewis Base in Hydrogen Bonds and Other Interactions. Molecules 2021, 25, 3294. [Google Scholar] [CrossRef] [PubMed]
- Richardson, T.; de Gala, S.; Crabtree, R.H.; Siegbahn, P.E.M. Unconventional hydrogen bonds: Intermolecular B-H⋯H-N interactions. J. Am. Chem. Soc. 1995, 117, 12875–12876. [Google Scholar] [CrossRef]
- Custelcean, R.; Jackson, J.E. Dihydrogen bonding: Structures, energetics, and dynamics. Chem. Rev. 2001, 101, 1963–1980. [Google Scholar] [CrossRef]
- Alkorta, I.; Elguero, J. Non-conventional hydrogen bonds. Chem. Soc. Rev. 1998, 27, 163–170. [Google Scholar] [CrossRef]
- Epstein, L.M.; Shubina, E.S. New types of hydrogen bonding in organometallic chemistry. Coord. Chem. Rev. 2002, 231, 165–181. [Google Scholar] [CrossRef]
- Solimannejad, M.; Amlashi, L.M.; Alkorta, I.; Elguero, J. XeH2 as a proton-accepting molecule for dihydrogen bonded systems: A theoretical study. Chem. Phys. Lett. 2006, 422, 226–229. [Google Scholar] [CrossRef]
- Alkorta, I.; Elguero, J.; Mo, O.; Yanez, M.; Del Bene, J.E. Ab Initio study of the structural, energetic, bonding, and IR spectroscopic properties of complexes with dihydrogen bonds. J. Phys. Chem. A 2002, 106, 9325–9330. [Google Scholar] [CrossRef]
- Alkorta, I.; Zborowski, K.; Elguero, J.; Solimannejad, M. Theoretical study of dihydrogen bonds between (XH)2, X = Li, Na, BeH, and MgH, and weak hydrogen bond donors (HCN, HNC, and HCCH). J. Phys. Chem. A 2006, 110, 10279–10286. [Google Scholar] [CrossRef]
- Grabowski, S.J.; Sokalski, W.A.; Leszczynski, J. Wide spectrum of H⋯H interactions: Van der Waals contacts, dihydrogen bonds and covalency. Chem. Phys. 2007, 337, 68–76. [Google Scholar] [CrossRef]
- Castilla-Martinez, C.A.; Moury, R.; Demirci, U.B. Amidoboranes and hydrazinidoboranes: State of the art, potential for hydrogen storage, and other prospects. Int. J. Hydrog. Energy 2020, 45, 30731–30755. [Google Scholar] [CrossRef]
- Magos-Palasyuk, E.; Litwiniuk, A.; Palasyuk, T. Experimental and theoretical evidence of dihydrogen bonds in lithium amidoborane. Sci. Rep. 2020, 10, 17431. [Google Scholar] [CrossRef] [PubMed]
- Zhou, W.; Jin, S.; Dai, W.; Lyon, J.T.; Lu, C. Theoretical study on the structural evolution and hydrogen storage in NbHn (n = 2–15) clusters. Int. J. Hydrog. Energy 2021, 46, 17246–17252. [Google Scholar] [CrossRef]
- Zachariasen, W.H.; Mooney, R.C.L. The structure of the hypophosphite group as determined from the crystal lattice of ammonium hypophosphite. J. Chem. Phys. 1934, 2, 34–38. [Google Scholar] [CrossRef]
- Burg, A.B. Enhancement of P-H bonding in a phosphine monoborane. Inorg. Chem. 1964, 3, 1325–1327. [Google Scholar]
- Brown, M.P.; Heseltine, R.W. Co-ordinated BH3 as a proton acceptor group in hydrogen bonding. Chem. Comm. 1968, 1551–1552. [Google Scholar] [CrossRef]
- Brown, M.P.; Heseltine, R.W.; Sutcliffe, L.H. Studies of aminoboranes. Part II. Pyrolysis of monoalkylamine-boranes: Some aminoborane trimers (1,3,5-trialkylcyclotriborazanes) and dimers. J. Chem. Soc. 1968, 612–616. [Google Scholar] [CrossRef]
- Brown, M.P.; Heseltine, R.W.; Smith, P.A.; Walker, P.J. An infrared study of co-ordinated BH3 and BH2 groups as proton acceptors in hydrogen bonding. J. Chem. Soc. 1970, 410–414. [Google Scholar] [CrossRef]
- Lee, J.C., Jr.; Rheingold, A.L.; Muller, B.; Pregosin, P.S.; Crabtree, R.H. Complexation of an amide to iridium via an iminol tautomer and evidence Ir-H⋯H-O hydrogen bond. J. Chem. Soc. 1994, 1021–1022. [Google Scholar] [CrossRef]
- Lough, A.J.; Park, S.; Ramachandran, R.; Morris, R.H. Switching on and off a new intramolecular hydrogen-hydrogen interaction and the heterolytic splitting of dihydrogen. Crystal and molecular structure. J. Am. Chem. Soc. 1994, 116, 8356–8357. [Google Scholar] [CrossRef]
- Peris, E.; Lee, J.C.; Rambo, J.R.; Eisenstein, O.; Crabtree, R.H. Factors affecting the strength of N-H⋯H-Ir hydrogen bonds. J. Am. Chem. Soc. 1995, 117, 3485–3491. [Google Scholar] [CrossRef]
- Clot, E.; Eisenstein, O.; Crabtree, R.H. How hydrogen bonding affects ligand binding and fluxionality in transition metal complexes: A DFT study on interligand hydrogen bonds involving HF and H2O. New J. Chem. 2001, 25, 66–72. [Google Scholar] [CrossRef]
- Groom, C.R.; Bruno, I.J.; Lightfoot, M.P.; Ward, S.C. The Cambridge Structural Database. Acta Cryst. B 2016, 72, 171–179. [Google Scholar] [CrossRef] [PubMed]
- Crabtree, R.H.; Siegbahn, P.E.M.; Eisenstein, O.; Rheingold, A.L.; Koetzle, T.F. A new intermolecular interaction: Unconventional hydrogen bonds with element hydride bonds as proton acceptor. Acc. Chem. Res. 1996, 29, 348–354. [Google Scholar] [CrossRef] [PubMed]
- Jayaraman, A. 100th Anniversary of Macromolecular Science Viewpoint: Modeling and Simulation of Macromolecules with Hydrogen Bonds: Challenges, Successes, and Opportunities. ACS Macro Lett. 2020, 2, 656–665. [Google Scholar] [CrossRef] [PubMed]
- Bauer, C.A. How to Model Inter- and Intramolecular Hydrogen Bond Strengths with Quantum Chemistry. J. Chem. Inf. Model. 2019, 59, 3735–3743. [Google Scholar] [CrossRef]
- Fanfrlík, J.; Pecina, A.; Řezáč, J.; Lepšík, M.; Sárosi, M.B.; Hnyk, D.; Hobza, P. Benchmark data sets of boron cluster dihydrogen bonding for the validation of approximate computational methods. ChemPhysChem 2020, 21, 2599–2604. [Google Scholar] [CrossRef]
- Van der Lubbe, S.C.C.; Guerra, C.F. The Nature of Hydrogen Bonds: A Delineation of the Role of Different Energy Components on Hydrogen Bond Strengths and Lengths. Chem. Asian J. 2019, 14, 2760–2769. [Google Scholar]
- Karimi, S.; Sanchooli, M.; Shoja-Hormozzah, F. Estimation of resonance assisted hydrogen bond (RAHB) energies using properties of ring critical points in some dihydrogen-bonded complexes. J. Mol. Struct. 2021, 1242, 130710. [Google Scholar] [CrossRef]
- Deshmukh, M.M.; Gadre, S.R. Molecular Tailoring Approach for the Estimation of Intramolecular Hydrogen Bond Energy. Molecules 2021, 26, 2928. [Google Scholar] [CrossRef]
- Uchida, M.; Shimizu, T.; Shibutani, R.; Matsumoto, Y.; Ishikawa, H. A comprehensive infrared spectroscopic and theoretical study on phenol- ethyldimethylsilane dihydrogen-bonded clusters in the S0 and S1 states. J. Chem. Phys. 2020, 153, 104305. [Google Scholar] [CrossRef] [PubMed]
- Matta, C.F.; Huang, L.; Massa, L. Characterization of a trihydrogen bond on the basis of the topology of the electron density. J. Phys. Chem. A 2011, 115, 12451–12458. [Google Scholar] [CrossRef] [PubMed]
- Nakanishi, W.; Hayashi, S.; Narahara, K. Atoms–in–Molecules Dual Parameter Analysis of Weak to Strong Interactions: Behaviors of Electronic Energy Densities versus Laplacian of Electron Densities at Bond Critical Points. J. Phys. Chem. A 2008, 112, 13593–13599. [Google Scholar] [CrossRef] [PubMed]
- Shahbazian, S. Why Bond Critical Points Are Not ‘Bond’ Critical Points. Chem. Eur. J. 2018, 24, 5401–5405. [Google Scholar] [CrossRef] [PubMed]
- Mo, Y. Can QTAIM Topological Parameters Be a Measure of Hydrogen Bonding Strength. J. Phys. Chem. A 2012, 116, 5240–5246. [Google Scholar] [CrossRef] [PubMed]
- Fuster, F.; Grabowski, S.J. Intramolecular Hydrogen Bonds: The QTAIM and ELF Characteristics. J. Phys. Chem. A 2011, 115, 10078–10086. [Google Scholar] [CrossRef]
- Alikhani, M.E.; Fuster, F.; Silvi, B. What Can Tell the Topological Analysis of ELF on Hydrogen Bonding? Struct. Chem. 2005, 16, 204–210. [Google Scholar] [CrossRef]
- Shahbazian, S. A Molecular Electrostatic Potential Analysis of Hydrogen, Halogen and Dihydrogen Bonds. J. Phys. Chem. A 2014, 118, 1697–1705. [Google Scholar]
- Murray, J.S.; Politzer, P. Hydrogen Bonding: A Coulombic σ? Hole Interaction. J. Indian Inst. Sci. 2020, 100, 21–30. [Google Scholar] [CrossRef]
- Murray, J.S.; Politzer, P. The Electrostatic Potential: An Overview. WIREs Comput. Mol. Sci. 2011, 1, 153–163. [Google Scholar] [CrossRef]
- Konkoli, Z.; Cremer, D. A New Way of Analyzing Vibrational Spectra. I. Derivation of Adiabatic Internal Modes. Int. J. Quantum Chem. 1998, 67, 1–9. [Google Scholar] [CrossRef]
- Konkoli, Z.; Larsson, J.A.; Cremer, D. A New Way of Analyzing Vibrational Spectra. II. Comparison of Internal Mode Frequencies. Int. J. Quantum Chem. 1998, 67, 11–27. [Google Scholar] [CrossRef]
- Konkoli, Z.; Cremer, D. A New Way of Analyzing Vibrational Spectra. III. Characterization of Normal Vibrational Modes in terms of Internal Vibrational Modes. Int. J. Quantum Chem. 1998, 67, 29–40. [Google Scholar] [CrossRef]
- Konkoli, Z.; Larsson, J.A.; Cremer, D. A New Way of Analyzing Vibrational Spectra. IV. Application and Testing of Adiabatic Modes within the Concept of the Characterization of Normal Modes. Int. J. Quantum Chem. 1998, 67, 41–55. [Google Scholar] [CrossRef]
- Cremer, D.; Larsson, J.A.; Kraka, E. New Developments in the Analysis of Vibrational Spectra on the Use of Adiabatic Internal Vibrational Modes. In Theoretical and Computational Chemistry; Parkanyi, C., Ed.; Elsevier: Amsterdam, The Netherlands, 1998; pp. 259–327. [Google Scholar]
- Reed, A.; Curtiss, L.; Weinhold, F. Intermolecular Interactions from A Natural Bond Orbital, Donor-Acceptor Viewpoint. Chem. Rev. 1988, 88, 899–926. [Google Scholar] [CrossRef]
- Weinhold, F.; Landis, C.R. Valency and Bonding: A Natural Bond Orbital Donor-Acceptor Perspective; Cambridge University Press: Cambridge, UK, 2005. [Google Scholar]
- Glendening, E.D.; Badenhoop, J.K.; Reed, A.E.; Carpenter, J.E.; Bohmann, J.A.; Morales, C.M.; Landis, C.R.; Weinhold, F. NBO6; Theoretical Chemistry Institute, University of Wisconsin: Madison, WI, USA, 2013. [Google Scholar]
- Bader, R. Atoms in Molecules: A Quantum Theory; Clarendron Press: Oxford, UK, 1995. [Google Scholar]
- Bader, R.F.W. The Quantum Mechanical Basis of Conceptual Chemistry. Monatsh. Chem. 2005, 136, 819–854. [Google Scholar] [CrossRef]
- Popelier, P.L.A. On Quantum Chemical Topology. In Applications of Topological Methods in Molecular Chemistry; Springer International Publishing: Berlin/Heidelberg, Germany, 2016; pp. 23–52. [Google Scholar]
- Matta, C.F.; Boyd, R.J. An Introduction to the Quantum Theory of Atoms in Molecules. In The Quantum Theory of Atoms in Molecules; Wiley-VCH Verlag GmbH & Co., KGaA: Weinheim, Germany, 2007; pp. 1–34. [Google Scholar]
- Matta, C.F.; Hernndez-Trujillo, J.; Tang, T.H.; Bader, R.F.W. Hydrogen hydrogen bonding: A stabilizing interaction in molecules and crystals. Chem. Europ. J. 2003, 9, 1940–1951. [Google Scholar] [CrossRef] [PubMed]
- Kalescky, R.; Kraka, E.; Cremer, D. Description of Aromaticity with the Help of Vibrational Spectroscopy: Anthracene and Phenanthrene. J. Phys. Chem. A 2013, 118, 223–237. [Google Scholar] [CrossRef]
- Freindorf, M.; Kraka, E.; Cremer, D. A Comprehensive Analysis of Hydrogen Bond Interactions Based on Local Vibrational Modes. Int. J. Quantum Chem. 2012, 112, 3174–3187. [Google Scholar] [CrossRef]
- Kalescky, R.; Kraka, E.; Cremer, D. Identification of the Strongest Bonds in Chemistry. J. Phys. Chem. A 2013, 117, 8981–8995. [Google Scholar] [CrossRef]
- Grabowski, S. Halogen bond and its counterparts: Bent’s rule explains the formation of nonbonding interactions. J. Phys. Chem. A 2011, 115, 12340. [Google Scholar] [CrossRef] [PubMed]
- Zhang, X.; Zeng, Y.; Li, X.; Meng, L.; Zheng, S. Comparison in the complexes of oxygen-containing σ-electron donor with hydrogen halide and dihalogen molecules. J. Mol. Struct. THEOCHEM 2010, 950, 27–35. [Google Scholar] [CrossRef]
- De Oliveira, B.G.; Ramos, M.N. Dihydrogen Bonds and Blue–Shifting Hydrogen Bonds. AH⋯CF3 and TH2⋯HCF3 Model Systems with A = Li or Na and T = Be or Mg. Int. J. Quant. Chem. 2010, 110, 307–316. [Google Scholar] [CrossRef]
- Kraka, E.; Zou, W.; Tao, Y. Decoding Chemical Information from Vibrational Spectroscopy Data: Local Vibrational Mode Theory. WIREs: Comput. Mol. Sci. 2020, 10, 1480. [Google Scholar] [CrossRef]
- Li, S.F.; Tang, Z.W.; Tan, Y.B.; Yu, X.B. Polyacrylamide Blending with Ammonia Borane: A Polymer Supported Hydrogen Storage Composite. J. Phys. Chem. C 2012, 116, 1544–1549. [Google Scholar] [CrossRef]
- Jabłoński, M. On the Uselessness of Bond Paths Linking Distant Atoms and on the Violation of the Concept of Privileged Exchange Channels. ChemistryOpen 2019, 8, 497–507. [Google Scholar] [CrossRef] [Green Version]
- Jabłoński, M. Bond paths between distant atoms do not necessarily indicate dominant interactions. J. Comput. Chem. 2018, 39, 2183–2195. [Google Scholar] [CrossRef]
- Wick, C.R.; Clark, T. On bond-critical points in QTAIM and weak interactions. J. Mol. Model. 2018, 24, 142. [Google Scholar] [CrossRef]
- Jabłoński, M. A Critical Overview of Current Theoretical Methods of Estimating the Energy of Intramolecular Interactions. Molecules 2020, 25, 5512. [Google Scholar] [CrossRef]
- Bader, R.F.W. Bond Paths Are Not Chemical Bonds. J. Phys. Chem. A 2009, 113, 10391–10396. [Google Scholar] [CrossRef] [Green Version]
- Stöhr, M.; Voorhis, T.V.; Tkatchenko, A. Theory and practice of modeling van der Waals interactions in electronic–structure calculations. Chem. Soc. Rev. 2019, 48, 4118–4154. [Google Scholar] [CrossRef] [PubMed] [Green Version]
- Hazrah, A.S.; Nanayakkara, S.; Seifert, N.A.; Kraka, E.; Jäger, W. Structural study of 1- and 2-naphthol: New insights into the non-covalent H–H interaction in cis-1-naphthol. Phys. Chem. Chem. Phys. 2022, 24, 3722–3732. [Google Scholar] [CrossRef] [PubMed]
- Barbatti, M.; Nascimento, M.A.C. Does the H5+ hydrogen cluster exist in dense interstellar clouds? Int. J. Quantum Chem. 2012, 112, 3169–3173. [Google Scholar] [CrossRef]
- Kraka, E.; Quintano, M.; Force, H.W.L.; Antonio, J.J.; Freindorf, M. The Local Vibrational Mode Theory and Its Place in the Vibrational Spectroscopy Arena. J. Phys. Chem. A 2022, 126, 8781–8798. [Google Scholar] [CrossRef] [PubMed]
- Wilson, E.B.; Decius, J.C.; Cross, P.C.M. Molecular Vibrations. The Theory of Infrared and Raman Vibrational Spectra; McGraw-Hill: New York, NY, USA, 1955; pp. 59–136. [Google Scholar]
- Califano, S. Vibrational States; Wiley: London, UK, 1976. [Google Scholar]
- Kelley, J.D.; Leventhal, J.J. Problems in Classical and Quantum Mechanics: Normal Modes and Coordinates; Springer: Berlin/Heidelberg, Germany, 2017; pp. 95–117. [Google Scholar]
- Zou, W.; Kalescky, R.; Kraka, E.; Cremer, D. Relating Normal Vibrational Modes to Local Vibrational Modes with the Help of an Adiabatic Connection Scheme. J. Chem. Phys. 2012, 137, 084114. [Google Scholar] [CrossRef] [Green Version]
- Kalescky, R.; Zou, W.; Kraka, E.; Cremer, D. Local Vibrational Modes of the Water Dimer—Comparison of Theory and Experiment. Chem. Phys. Lett. 2012, 554, 243–247. [Google Scholar] [CrossRef]
- Zou, W.; Kalescky, R.; Kraka, E.; Cremer, D. Relating Normal Vibrational Modes to Local Vibrational Modes: Benzene and Naphthalene. J. Mol. Model. 2012, 19, 2865–2877. [Google Scholar] [CrossRef]
- Freindorf, M.; Kraka, E. Critical Assessment of the FeC and CO Bond strength in Carboxymyoglobin—A QM/MM Local Vibrational Mode Study. J. Mol. Model. 2020, 26, 281. [Google Scholar] [CrossRef]
- Yannacone, S.; Freindorf, M.; Tao, Y.; Zou, W.; Kraka, E. Local Vibrational Mode Analysis of π-Hole Interactions between Aryl Donors and Small Molecule Acceptors. Crystals 2020, 10, 556. [Google Scholar] [CrossRef]
- Yannacone, S.; Sayala, K.D.; Freindorf, M.; Tsarevsky, N.V.; Kraka, E. Vibrational Analysis of Benziodoxoles and Benziodazolotetrazoles. PhysChem 2021, 1, 45–68. [Google Scholar] [CrossRef]
- Quintano, M.; Kraka, E. Theoretical insights into the linear relationship between pKa values and vibrational frequencies. Chem. Phys. Lett. 2022, 803, 139746. [Google Scholar] [CrossRef]
- Verma, N.; Tao, Y.; Zou, W.; Chen, X.; Chen, X.; Freindorf, M.; Kraka, E. A Critical Evaluation of Vibrational Stark Effect (VSE) Probes with the Local Vibrational Mode Theory. Sensors 2020, 20, 2358. [Google Scholar] [CrossRef] [PubMed] [Green Version]
- Zou, W.; Cremer, D. C2 in a Box: Determining its Intrinsic Bond Strength for the X1Σ+g Ground State. Chem. Eur. J. 2016, 22, 4087–4097. [Google Scholar] [CrossRef] [PubMed]
- Cremer, D. Stereochemistry of the Ozonolysis of Alkenes: Ozonide-versus Carbonyl Oxide-Control. Angew. Chem. Int. Ed. 1981, 20, 888–889. [Google Scholar] [CrossRef]
- Zou, W.; Zhang, X.; Dai, H.; Yan, H.; Cremer, D.; Kraka, E. Description of an Unusual Hydrogen Bond between Carborane and a Phenyl Group. J. Organometal. Chem. 2018, 856, 114–127. [Google Scholar] [CrossRef]
- Cremer, D. From Configuration Interaction to Coupled Cluster Theory: The Quadratic Configuration Interaction Approach. WIREs Comput. Mol. Sci. 2013, 3, 482–503. [Google Scholar] [CrossRef]
- Kalescky, R.; Zou, W.; Kraka, E.; Cremer, D. Vibrational Properties of the Isotopomers of the Water Dimer Derived from Experiment and Computations. Aust. J. Chem. 2014, 67, 426. [Google Scholar] [CrossRef] [Green Version]
- Tao, Y.; Zou, W.; Jia, J.; Li, W.; Cremer, D. Different Ways of Hydrogen Bonding in Water - Why Does Warm Water Freeze Faster than Cold Water? J. Chem. Theory Comput. 2017, 13, 55–76. [Google Scholar] [CrossRef]
- Tao, Y.; Zou, W.; Kraka, E. Strengthening of Hydrogen Bonding With the Push-Pull Effect. Chem. Phys. Lett. 2017, 685, 251–258. [Google Scholar] [CrossRef]
- Delgado, A.A.A.; Sethio, D.; Kraka, E. Assessing the Intrinsic Strengths of Ion-Solvent and Solvent-Solvent Interactions for Hydrated Mg2+ Clusters. Inorganics 2021, 9, 31. [Google Scholar] [CrossRef]
- Nanayakkara, S.; Tao, Y.; Kraka, E. Capturing Individual Hydrogen Bond Strengths in Ices via Periodic Local Vibrational Mode Theory: Beyond the Lattice Energy Picture. J. Chem. Theory Comput. 2022, 18, 562–579. [Google Scholar] [CrossRef] [PubMed]
- Lyu, S.; Beiranvand, N.; Freindorf, M.; Kraka, E. Interplay of Ring Puckering and Hydrogen Bonding in Deoxyribonucleosides. J. Phys. Chem. A 2019, 123, 7087–7103. [Google Scholar] [CrossRef]
- Yannacone, S.; Sethio, D.; Kraka, E. Quantitative Assessment of Intramolecular Hydrogen Bonds in Neutral Histidine. Theor. Chem. Acc. 2020, 139, 125. [Google Scholar] [CrossRef]
- Verma, N.; Tao, Y.; Kraka, E. Systematic Detection and Characterization of Hydrogen Bonding in Proteins via Local Vibrational Modes. J. Phys. Chem. B 2021, 125, 2551–2565. [Google Scholar] [CrossRef]
- Beiranvand, N.; Freindorf, M.; Kraka, E. Hydrogen Bonding in Natural and Unnatural Base Pairs - Explored with Vibrational Spectroscopy. Molecules 2021, 26, 2268. [Google Scholar] [CrossRef]
- Makoś, M.Z.; Freindorf, M.; Sethio, D.; Kraka, E. New Insights into Fe–H2 and Fe–H- Bonding of a [NiFe] Hydrogenase Mimic—A Local Vibrational Mode Study. Theor. Chem. Acc. 2019, 138, 76. [Google Scholar] [CrossRef]
- Freindorf, M.; Yannacone, S.; Oliveira, V.; Verma, N.; Kraka, E. Halogen Bonding Involving I2 and d8 Transition-Metal Pincer Complexes. Crystals 2021, 11, 373. [Google Scholar] [CrossRef]
- Luo, Y.R. Comprehensive Handbook of Chemical Bond Energies; Taylor and Francis: Boca Raton, FL, USA, 2007. [Google Scholar]
- Moltved, K.A.; Kepp, K.P. Chemical Bond Energies of 3d Transition Metals Studied by Density Functional Theory. J. Chem. Theory Comput. 2018, 14, 3479–3492. [Google Scholar] [CrossRef] [Green Version]
- Morse, M.D. Predissociation measurements of bond dissociation energies. Acc. Chem. Res. 2018, 52, 119–126. [Google Scholar] [CrossRef]
- Stasyuk, O.A.; Sedlak, R.; Guerra, C.F.; Hobza, P. Comparison of the DFT-SAPT and canonical EDA Schemes for the energy decomposition of various types of noncovalent interactions. J. Chem. Theory Comput. 2018, 14, 3440–3450. [Google Scholar] [CrossRef]
- Levine, D.S.; Head-Gordon, M. Energy decomposition analysis of single bonds within Kohn-Sham density functional theory. Proc. Natl. Acad. Sci. USA 2017, 114, 12649–12656. [Google Scholar] [CrossRef] [Green Version]
- Zhao, L.; Hermann, M.; Schwarz, W.H.E.; Frenking, G. The Lewis electron-pair bonding model: Modern energy decomposition analysis. Nat. Rev. Chem. 2019, 3, 49–62. [Google Scholar] [CrossRef]
- Zhao, L.; Pan, S.; Holzmann, N.; Schwerdtfeger, P.; Frenking, G. Chemical Bonding and Bonding Models of Main-Group Compounds. Chem. Rev. 2019, 119, 8781–8845. [Google Scholar] [CrossRef] [PubMed]
- Gavezzotti, A. Comparing the strength of covalent bonds, intermolecular hydrogen bonds and other intermolecular interactions for organic molecules: X-ray diffraction data and quantum chemical calculations. New J. Chem. 2016, 40, 6848–6853. [Google Scholar] [CrossRef]
- Cremer, D.; Kraka, E. From Molecular Vibrations to Bonding, Chemical Reactions, and Reaction Mechanism. Curr. Org. Chem. 2010, 14, 1524–1560. [Google Scholar] [CrossRef]
- Kalescky, R.; Kraka, E.; Cremer, D. Are Carbon-Halogen Double and Triple Bonds Possible? Int. J. Quantum Chem. 2014, 114, 1060–1072. [Google Scholar] [CrossRef]
- Kalescky, R.; Zou, W.; Kraka, E.; Cremer, D. Quantitative Assessment of the Multiplicity of Carbon-Halogen Bonds: Carbenium and Halonium Ions with F, Cl, Br, and I. J. Phys. Chem. A 2014, 118, 1948–1963. [Google Scholar] [CrossRef]
- Oliveira, V.; Kraka, E.; Cremer, D. Quantitative Assessment of Halogen Bonding Utilizing Vibrational Spectroscopy. Inorg. Chem. 2016, 56, 488–502. [Google Scholar] [CrossRef]
- Setiawan, D.; Sethio, D.; Cremer, D.; Kraka, E. From Strong to Weak NF Bonds: On the Design of a New Class of Fluorinating Agents. Phys. Chem. Chem. Phys. 2018, 20, 23913–23927. [Google Scholar] [CrossRef]
- Sethio, D.; Oliveira, V.; Kraka, E. Quantitative Assessment of Tetrel Bonding Utilizing Vibrational Spectroscopy. Molecules 2018, 23, 2763. [Google Scholar] [CrossRef] [Green Version]
- Andrés, J.; Ayers, P.W.; Boto, R.A.; Carbó-Dorca, R.; Chermette, H.; Cioslowski, J.; Contreras-García, J.; Cooper, D.L.; Frenking, G.; Gatti, C.; et al. Nine questions on energy decomposition analysis. J. Comput. Chem. 2019, 40, 2248–2283. [Google Scholar] [CrossRef] [PubMed]
- Kraka, E.; Cremer, D. Characterization of CF Bonds with Multiple-Bond Character: Bond Lengths, Stretching Force Constants, and Bond Dissociation Energies. ChemPhysChem 2009, 10, 686–698. [Google Scholar] [CrossRef] [PubMed]
- Kaupp, M.; Danovich, D.; Shaik, S. Chemistry is about energy and its changes: A critique of bond-length/bond-strength correlations. Coord. Chem. Rev. 2017, 344, 355–362. [Google Scholar] [CrossRef]
- Bader, R.F.W. A Bond Path: A Universal Indicator of Bonded Interactions. J. Phys. Chem. A 1998, 102, 7314–7323. [Google Scholar] [CrossRef]
- Cremer, D.; Kraka, E. Chemical Bonds without Bonding Electron Density? Does the Difference Electron-Density Analysis Suffice for a Description of the Chemical Bond? Angew. Chem. Int. Ed. 1984, 23, 627–628. [Google Scholar] [CrossRef]
- Cremer, D.; Kraka, E. A Description of the Chemical Bond in Terms of Local Properties of Electron Density and Energy. Croat. Chem. Acta 1984, 57, 1259–1281. [Google Scholar]
- Kraka, E.; Cremer, D. Chemical Implication of Local Features of the Electron Density Distribution. In Theoretical Models of Chemical Bonding. The Concept of the Chemical Bond; Maksic, Z.B., Ed.; Springer Verlag: Berlin/Heidelberg, Germany, 1990; Volume 2, pp. 453–542. [Google Scholar]
- Ruedenberg, K. The physical nature of the chemical bond. Rev. Mod. Phys. 1962, 44, 326–376. [Google Scholar] [CrossRef]
- Levine, D.; Head-Gordon, M. Clarifying the quantum mechanical origin of the covalent chemical bond. Nat. Commun. 2020, 11, 4893. [Google Scholar] [CrossRef]
- Chai, J.D.; Head-Gordon, M. Long-Range Corrected Hybrid Density Functionals with Damped Atom–Atom Dispersion Corrections. Phys. Chem. Chem. Phys. 2008, 10, 6615–6620. [Google Scholar] [CrossRef] [Green Version]
- Chai, J.D.; Head-Gordon, M. Systematic Optimization of Long-Range Corrected Hybrid Density Functionals. J. Chem. Phys. 2008, 128, 084106. [Google Scholar] [CrossRef]
- Kendall, R.A.; Dunning, T.H., Jr.; Harrison, R.J. Electron Affinities of the First-Row Atoms Revisited. Systematic Basis Sets and Wave Functions. J. Chem. Phys. 1992, 96, 6796–6806. [Google Scholar] [CrossRef] [Green Version]
- Kendall, R.A.; Dunning, T.H., Jr.; Harrison, R.J. Gaussian basis sets for use in correlated molecular calculations. IX. The atoms gallium through krypton. J. Chem. Phys. 1999, 110, 7667–7676. [Google Scholar]
- Sato, T.; Nakai, H. Density Functional Method Including Weak Interactions: Dispersion Coefficients Based On the Local Response Approximation. J. Chem. Phys. 2009, 131, 224104. [Google Scholar] [CrossRef] [PubMed]
- López, C.S.; Faza, O.N.; Freindorf, M.; Kraka, E.; Cremer, D. Solving the Pericyclic-Pseudo pericyclic Puzzle in the Ring-Closure Reactions of 1,2,4,6-Heptatetraene Derivatives. J. Org. Chem. 2015, 81, 404–414. [Google Scholar] [CrossRef]
- Frisch, M.J.; Trucks, G.W.; Schlegel, H.B.; Scuseria, G.E.; Robb, M.A.; Cheeseman, J.R.; Scalmani, G.; Barone, V.; Petersson, G.A.; Nakatsuji, H.; et al. Gaussian 16; Gaussian Inc.: Wallingford, CT, USA, 2016. [Google Scholar]
- Zou, W.; Tao, Y.; Freindorf, M.; Makoś, M.Z.; Verma, N.; Cremer, D.; Kraka, E. Local Vibrational Mode Analysis (LModeA; Computational and Theoretical Chemistry Group (CATCO), Southern Methodist University: Dallas, TX, USA, 2022. [Google Scholar]
- Keith, T.A. AIMAll Version 17.11.14; K Gristmill Software: Overland Park, KS, USA, 2017. [Google Scholar]


Disclaimer/Publisher’s Note: The statements, opinions and data contained in all publications are solely those of the individual author(s) and contributor(s) and not of MDPI and/or the editor(s). MDPI and/or the editor(s) disclaim responsibility for any injury to people or property resulting from any ideas, methods, instructions or products referred to in the content. |
© 2022 by the authors. Licensee MDPI, Basel, Switzerland. This article is an open access article distributed under the terms and conditions of the Creative Commons Attribution (CC BY) license (https://creativecommons.org/licenses/by/4.0/).
Share and Cite
Freindorf, M.; McCutcheon, M.; Beiranvand, N.; Kraka, E. Dihydrogen Bonding—Seen through the Eyes of Vibrational Spectroscopy. Molecules 2023, 28, 263. https://doi.org/10.3390/molecules28010263
Freindorf M, McCutcheon M, Beiranvand N, Kraka E. Dihydrogen Bonding—Seen through the Eyes of Vibrational Spectroscopy. Molecules. 2023; 28(1):263. https://doi.org/10.3390/molecules28010263
Chicago/Turabian StyleFreindorf, Marek, Margaret McCutcheon, Nassim Beiranvand, and Elfi Kraka. 2023. "Dihydrogen Bonding—Seen through the Eyes of Vibrational Spectroscopy" Molecules 28, no. 1: 263. https://doi.org/10.3390/molecules28010263