Article

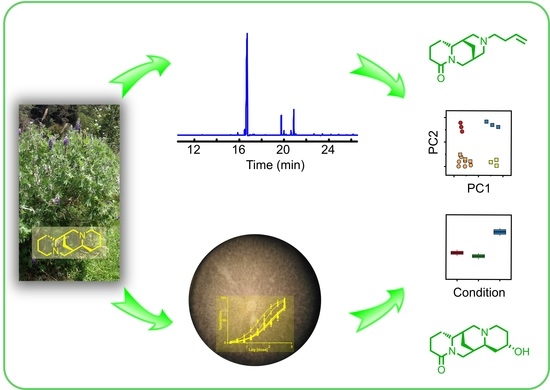
Composition and Antifungal Activity of the Alkaloidal Fraction of Lupinus mirabilis Leaves: A Biochemometrics-Based Exploration

by
Freddy A. Bernal
*,† and
Ericsson Coy-Barrera
*
Bioorganic Chemistry Laboratory, Facultad de Ciencias Básicas y Aplicadas, Universidad Militar Nueva Granada, Cajicá 250247, Colombia
*
Authors to whom correspondence should be addressed.
Current address: Transfer Group Anti-Infectives, Leibniz Institute for Natural Product Research and Infection Biology—Hans Knöll Institute, Beutenbergstr. 11a, 07745 Jena, Germany.
Molecules 2022, 27(9), 2832; https://doi.org/10.3390/molecules27092832
Submission received: 21 March 2022 / Revised: 25 April 2022 / Accepted: 26 April 2022 / Published: 29 April 2022
(This article belongs to the Special Issue Discovery of Bioactive Ingredients from Natural Products II)

Abstract

:
Lupinus plants are well-recognized due to their significant alkaloid content, which has made them the subject of several studies. However, the lack of chemical and biological information on the Colombian Lupinus species remains a fact. Therefore, the alkaloidal fractions from the leaves of L. mirabilis obtained by conventional solvent and ultrasound-assisted extraction (CSE and UAE, respectively) at different time frames were analyzed. Sparteine (2) was the main component in all cases; however, its relative abundance showed large variability, ranging from 64.7% to 80.6%. Minor constituents were also affected by the extraction conditions. In general, prolonged times gave a higher proportion of alkaloids under CSE, while only a slight decrease was observed under UAE. Both the method and extraction time appeared to equally affect the ratios of particular alkaloids, leading to variations in their effect on the mycelial growth of Fusarium oxysporum. Holistic analysis through multiple-covariate statistical methods as an approach to integrating chemical and bioactivity datasets allowed inferring the compounds most likely responsible for the changes in mycelial growth inhibition. 13α-Hydroxylupanine (12) might represent a promising compound to be included in further studies against this phytopathogen.

Graphical Abstract

1. Introduction

The Fabaceae family is widely distributed worldwide and is recognized by its invasive ability and the high content of specialized metabolites with multi-directional activities. One of the most abundant genera within this family is Lupinus, accounting for more than 260 species [1]. Plants belonging to the genus Lupinus are found all over the world; however, most of them grow wild in the New World [2,3]. However, and despite their significant representation, only four species have been extensively studied: L. albus, L. angustifolius, L. luteus, and L. mutabilis (commonly known as white, blue, yellow, and pearl lupine, respectively), due to their potential economic relevance as a cheap alternative to other legume crops [4]. The commercialization of Lupinus and lupine-derived food products [4,5] is still limited owing to the presence of variable amounts of alkaloids in all plant parts [6,7], being sometimes the main phytoconstituents causing a bitter taste of such products and even responsible for acute anticholinergic toxicity [8,9]. Thus, alkaloid-containing lupine plant materials for animal and human intake require a suitable debittering preprocessing to remove undesirable alkaloids [10].
An important diversity of alkaloids (particularly quinolizidines) is produced by Lupinus plants, predominantly in leaves, which are subsequently translocated to different organs, and mainly accumulated in seeds [11]. The structural patterns of quinolizidine alkaloids involve bicyclic, tricyclic, and tetracyclic moieties, whose occurrence and regulation are influenced by genotype, soil and environmental conditions, and pest and phytopathogen pressures [12]. Indeed, a defensive strategy of Lupinus plants against biotic factors is constituted by the production and accumulation of quinolizidine-like alkaloids [13]. Hence, quinolizidine sources can be investigated to explore their bioactivity against fungal pathogens. In this context, some fungal phytopathogens, such as Sclerotium rolfsii, Alternaria solani, Rhizoctonia solani, Fusarium oxysporum, and F. verticillioides, have been inhibited by quinolizidine-rich extracts from Lupinus exaltatus, L. mexicanus, and L. albescens, comprising growth inhibition > 72% and IC50 < 30 µg/mL [14,15].
Lupinus plants are also easily adaptable as they are found on dry hilly grasslands, coastal sands, cliffs, and along the banks of streams and rivers that are not suitable to many other plants [16]. In fact, several Lupinus species grow under such conditions in different regions of Colombia. One example is L. mirabilis, a lupine extensively distributed along the Bogotá plateau, mainly in highland ecosystems. Even though this species has a wide representation, there are no reports on the chemical/alkaloidal composition of wild specimens. Therefore, quinolizidine-oriented phytochemical studies on an unreported Lupinus plant are required to expand the knowledge on Lupinus chemodiversity. Such exploration becomes an opportunity to find bioactives against fungal phytopathogens, e.g., F. oxysporum, a relevant problem in commercial crops worldwide [17].
There are several approaches to discovering bioactives from natural sources [18]. The most common strategies are high-throughput screening (i.e., the evaluation of libraries of previously-isolated compounds) and bioguided fractionation (i.e., the consecutive evaluation of fractions from an active parent extract) to achieve final identification of the active components. However, these are time-consuming and expensive [19]. These disadvantages can be overcome by integrating chemical and bioactivity datasets to recognize plausible bioactives within plant extracts or fractions using multiple-covariate statistical methods, which recently emerged and are called biochemometrics [20,21,22]. This integration can exploit diverse extraction protocols to provide different chemical profiles that can be associated with bioactivity and, consequently, recognize statistically putative bioactives [23]. The incorporation of multiple profiles from distinct extraction conditions (e.g., time, method, etc.) and bioactivity data into a single analysis is the main benefit of this kind of approaches. They might be especially useful considering that certain extraction conditions might lead to better extracts in terms of specific target properties (e.g., bioactivity) since active principles can be differentially removed from the plant matrix. Therefore, they can be used as primary initiatives to direct the search for bioactive components from plant sources [24].
Hence, as part of our phytochemical research on highland-occurring Colombian plants, we present the GC-MS-based analysis of alkaloidal fractions from the leaves of L. mirabilis obtained by conventional and ultrasound-assisted extraction using different time frames as the input chemical dataset. Comparison of the bioactivity of those fractions against F. oxysporum and the analysis of the effect of the composition on the mycelial growth inhibition through multiple-factor statistical integration as a biochemometrics-based exploration are also shown.

2. Results and Discussion

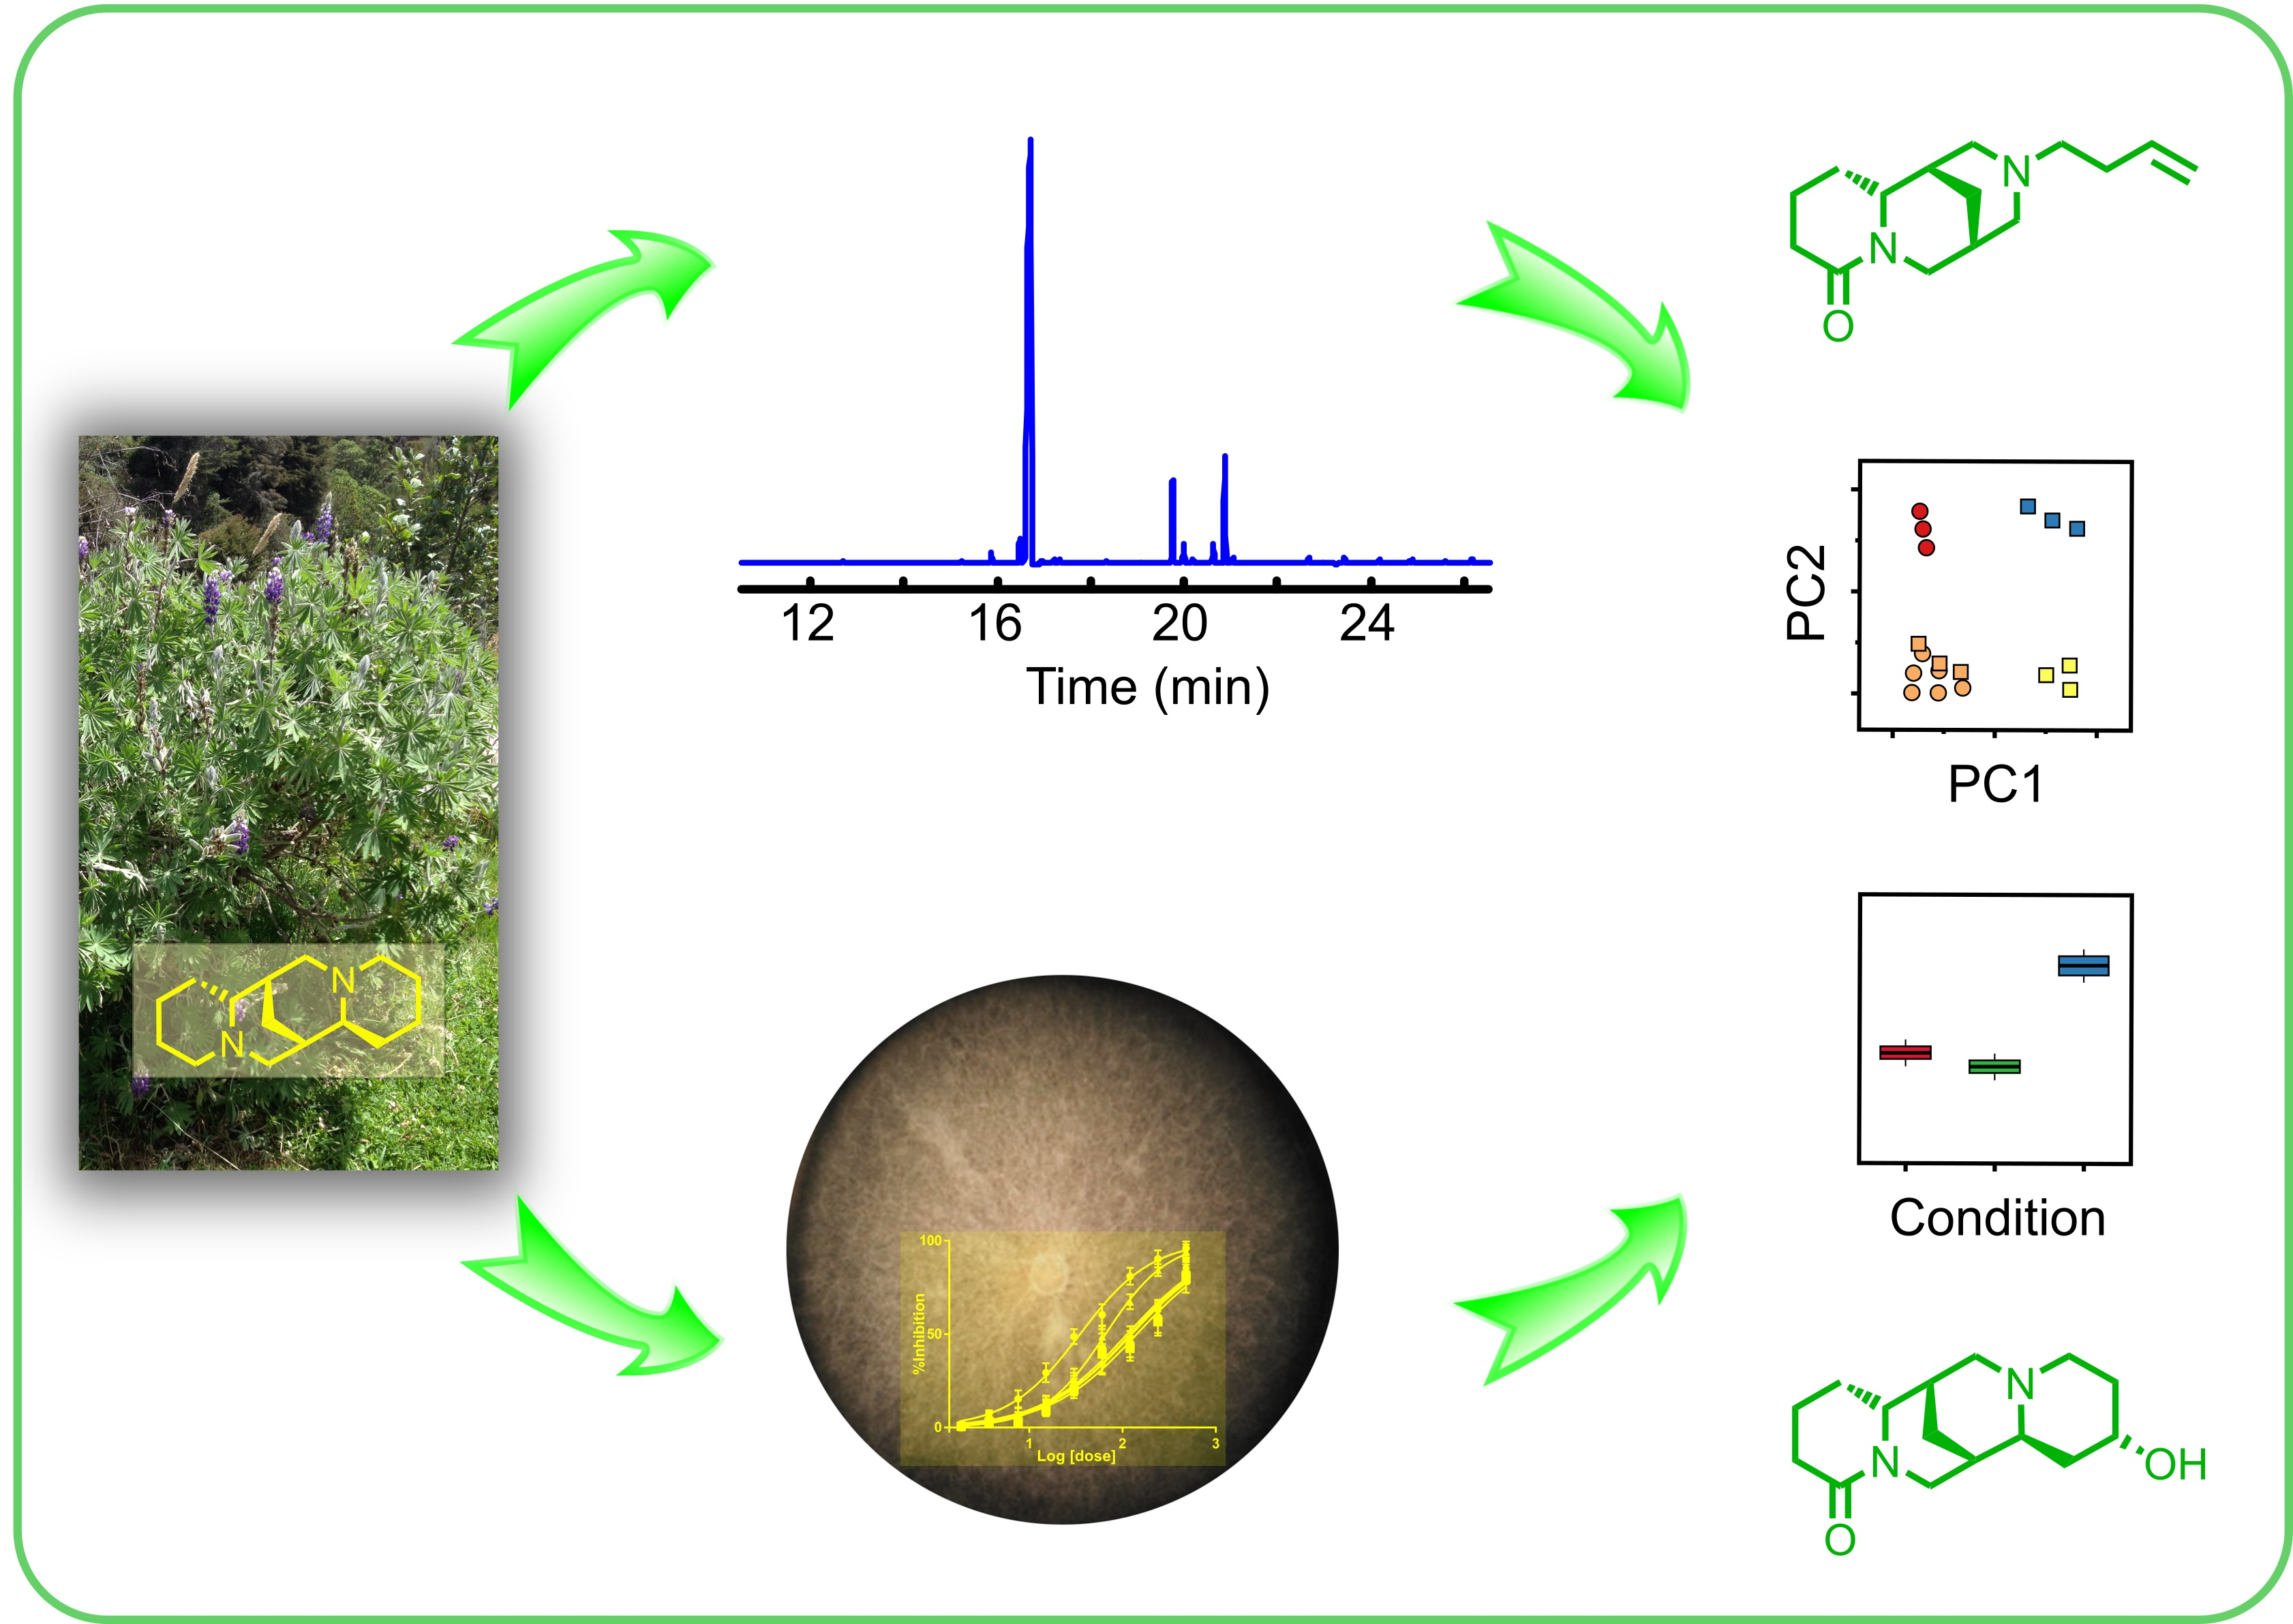
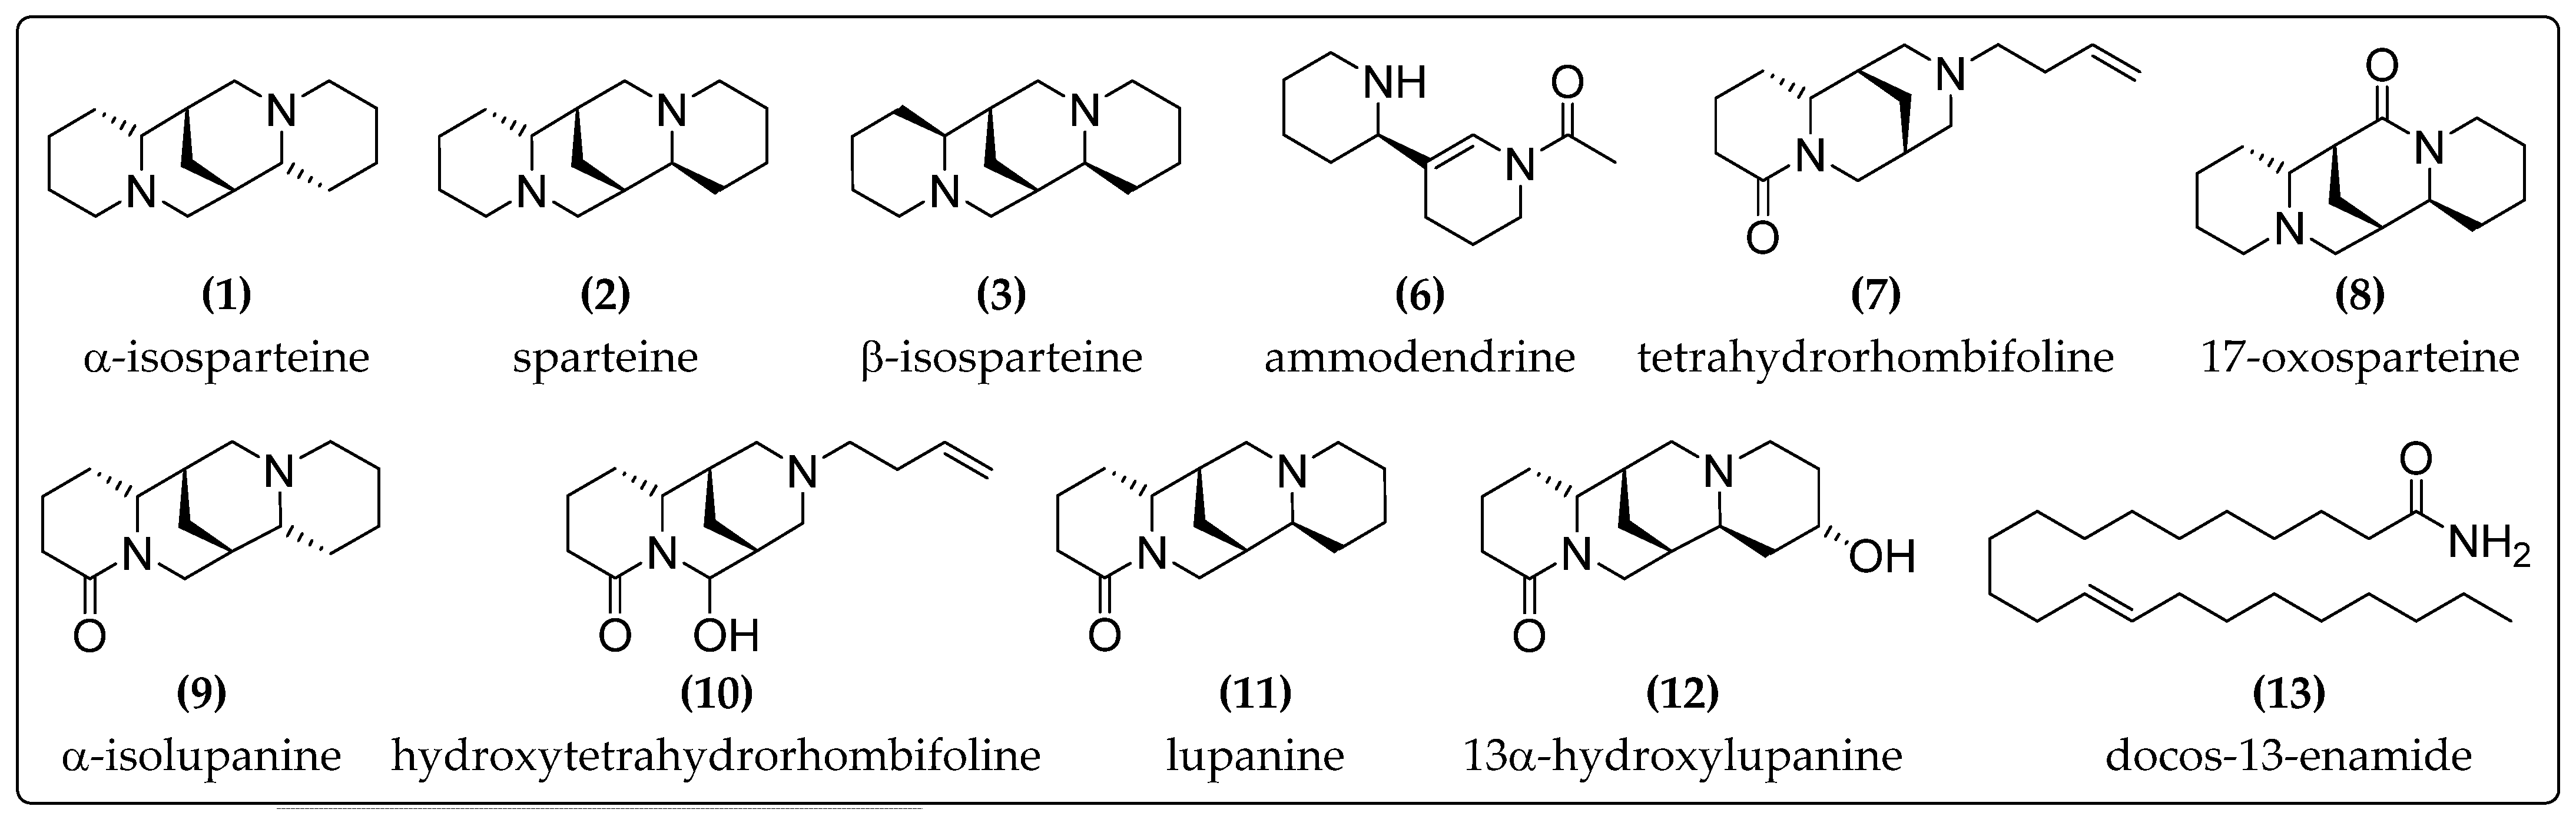
2.1. Analysis of Alkaloidal Composition

The genus Lupinus is well-known for high concentrations of isoflavones [4] and quinolizidine alkaloids [6,7,8]. The latter specialized metabolites are especially important to Lupinus as chemotaxonomic markers. The relevance of this kind of compound for ecological interactions and nitrogen-storing processes has been described previously [25]. In the present study, the composition of the alkaloidal fractions from L. mirabilis leaves, obtained by two extraction methods, namely conventional solvent extraction (CSE) and ultrasound-assisted extraction (UAE), during three different extraction periods (1–3) is described. The identified nitrogen-containing compounds along with key chromatographic and spectrometric data by GC-MS [26] are listed in Appendix A Table A1 and their structures are depicted in Appendix A Figure A1. These compounds have been previously described in Lupinus species and are therefore considered lupine alkaloids [6,7,27]. They account for different compound classes as follows: tetracyclic quinolizidine alkaloids (13, 8, 9, 11, and 12), tricyclic quinolizidine alkaloids with allylic lateral chain (7 and 10) [28], and dipiperidines 6) [6]. The identity of each compound was confirmed by a thorough comparison of representative MS signals and RI values with those reported in the literature (Appendix A Table A1) [27,29].
To study the effect of both extraction method and extraction duration on the resulting alkaloidal composition, we assessed three different time frames for each method. Table 1 shows the relative percentage of each nitrogen-containing compound in all the analyzed samples. Two abundant compounds consistently appeared: sparteine (2) and lupanine (11). Although both alkaloids are typically found in Lupinus, in most cases, quinolizidine 11 has been reported as the main constituent [27,30,31,32,33]. Wink et al. [9] found 2 in a higher percentage than 11 only in eleven out of 109 accessions of Lupinus around the world, accounting for 56 different species. L. arboreus (seeds and leaves), L. arcticus ssp. subalpinus (leaves), L. sericeus ssp. huffmannii (leaves), and L. sericeus ssp. flexuosus (leaves) contained exceptionally high levels of 2 (>70% of the alkaloidal fraction) [9]. More recently, Kordan et al. [33] reported three samples of L. luteus (L. cv. Dukat, Perkoz, and Talar) with higher amounts of 2 than 11. Such a study was performed on twelve lupine accessions, including four different species. On the other hand, the existence of chemotypes within Lupinus species has also been described [32,33,34]. For instance, one out of seven chemotypes observed in L. sulphureus displayed exclusively a 2/11 ratio above the unit (in 49 accessions analyzed) [34]. Such diversity encouraged us to further analyze the Colombian L. mirabilis specimens. Recently, we studied the alkaloidal profile of a greenhouse-propagated specimen of L. mirabilis and a high 2/11 ratio (>1.6) was observed [35].
The alkaloidal composition suffered changes upon variation of the extraction conditions, including even the complete absence of some of the minor constituents in some cases (Table 1). A detailed examination of Table 1 establishes that CSE1 has a significantly lower percentage of alkaloids than the other fractions (p < 0.05). This indicates that short extraction periods are unsuitable for the selective extraction of alkaloids leading to more complex mixtures containing terpenoids (as evidenced by GC-MS; data not shown). In contrast, shorter periods using UAE afforded a more significant proportion of nitrogen-containing compounds overall (p < 0.05). In addition, an extension of the extraction period did not show substantial changes in the total proportion of alkaloids; however, individual variations were observed (e.g., UAE1 vs UAE3).
From Table 1, it is evident that the ratio 2/11 changed along with the variation of the extraction time (from 16.4 to 10.5 and from 7.9 to 5.3 for CSE and UAE, respectively). While longer extraction times under CSE afforded a significantly higher proportion of both compounds (p < 0.05), increasing the contact period under UAE caused a substantial decrease in the relative amount of 2 with an imperceptible variation of the ratio of 11. Other compounds (such as 7 and 12) were increasingly concentrated over time regardless of the extraction method. Interestingly, CSE3 and UAE1 exhibited the closest similarity in terms of their alkaloidal composition (Table 1). The GC-MS profiles for these two samples are almost indistinguishable as demonstrated in Figure 1.
Pearson’s correlation coefficients from the relative proportion of alkaloids among samples were calculated (Figure 2) while looking for general insights. In agreement with the observable trends from Table 1, several alkaloids seemed to be somewhat positively correlating with coefficients above 0.8 (Figure 2). However, the statistical significance of most of these was considerably low as indicated by the correspondingly high p values (only p < 0.05 are indicative of statistical significance and therefore marked with a star). Interestingly, a high positive significant correlation between 7 and 9, 10, and 11 was found. This finding could indicate that the extraction method and the variation in the exposure time affect the amount of those four alkaloids in the same way. Therefore, their ratio rather than the relative proportion in the alkaloidal mixture remained almost unchanged.

2.2. Mycelial Growth Inhibition

The effect of the alkaloidal fractions on the mycelial growth of the F. oxysporum LQB-03 strain was also studied. The results are presented in Table 2. As can be seen, all the samples were found to be active at different levels, comprising IC50 values within the range of 33.5–98.5 µg/mL, although less potent than the positive controls used (i.e., prochloraz IC50 = 17.7 µg/mL, and mancozeb IC50 = 11.9 µg/mL). This finding agrees with previous studies, where alkaloid extracts have shown activity against phytopathogens, including Alternaria porri, Aspergillus niger, Monilia fructicola, and F. oxysporum [36,37,38]. Moreover, both types of extraction (i.e., CSE and UAE) led to similar trends (the longer the extraction time, the higher the activity). Particularly, UAE resulted as the most suitable extraction procedure to conveniently enrich the fractions in active alkaloids (86.3 µg/mL < IC50 < 33.5 µg/mL), whereas CSE-derived fractions were considerably less active even after long extraction periods (98.5 µg/mL < IC50 < 84.8 µg/mL).
The previously reported low antifungal potential of 2 against F. oxysporum [37] would suggest that the observed activity for L. mirabilis alkaloids may be due to their minor components. Indeed, it has been described that 2 and 11 have a low-to-moderate contribution to the inhibitory action of eight Lupinus plants on F. oxysporum despite their high abundance [35]. On the other hand, and since the major constituent is seemingly inactive, the antifungal activity of quinolizidines may be the consequence of synergistic effects. Similar results have been reported for Calia secundiflora, whose alkaloidal fraction demonstrated activity against F. oxysporum [36]; however, its main component (cytisine) was characterized as a rather poor antifungal. In the present study, a reduction in the proportion of 2 and an increase for 11 and 7 are the most notorious changes among fractions (Table 2), which, in principle, might be related to the enhanced bioactivity of UAE-based fractions.

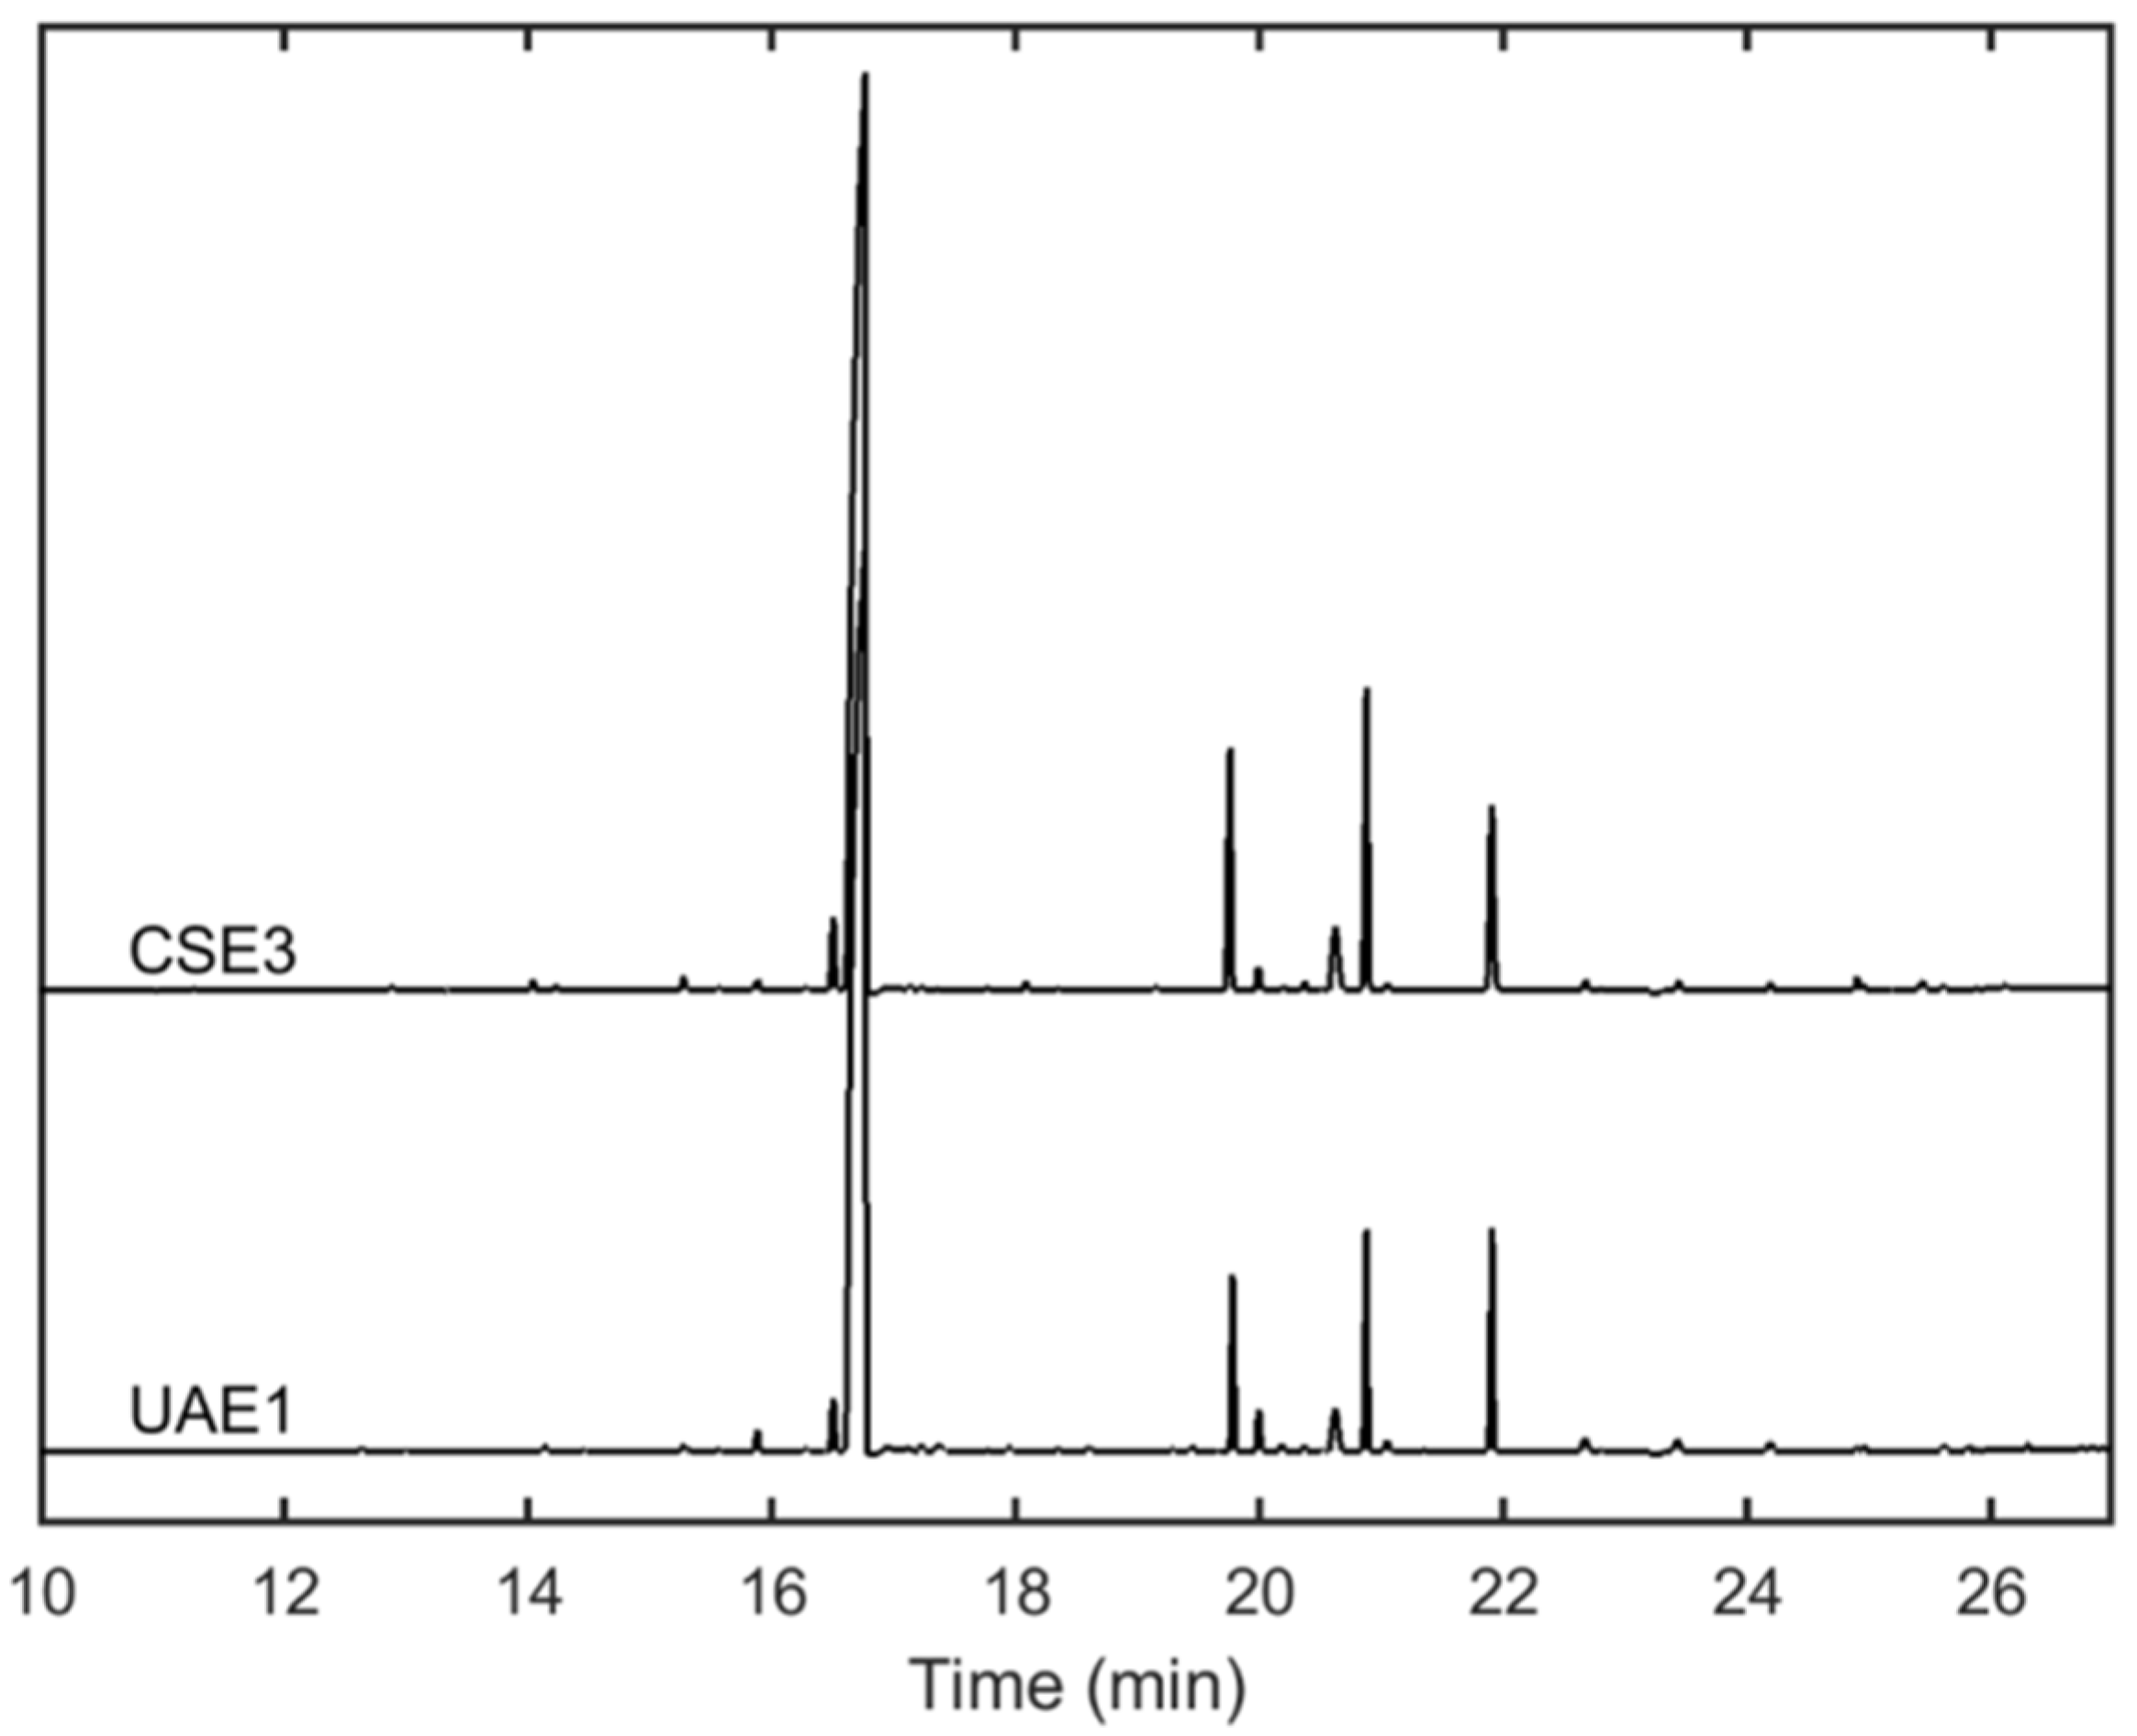
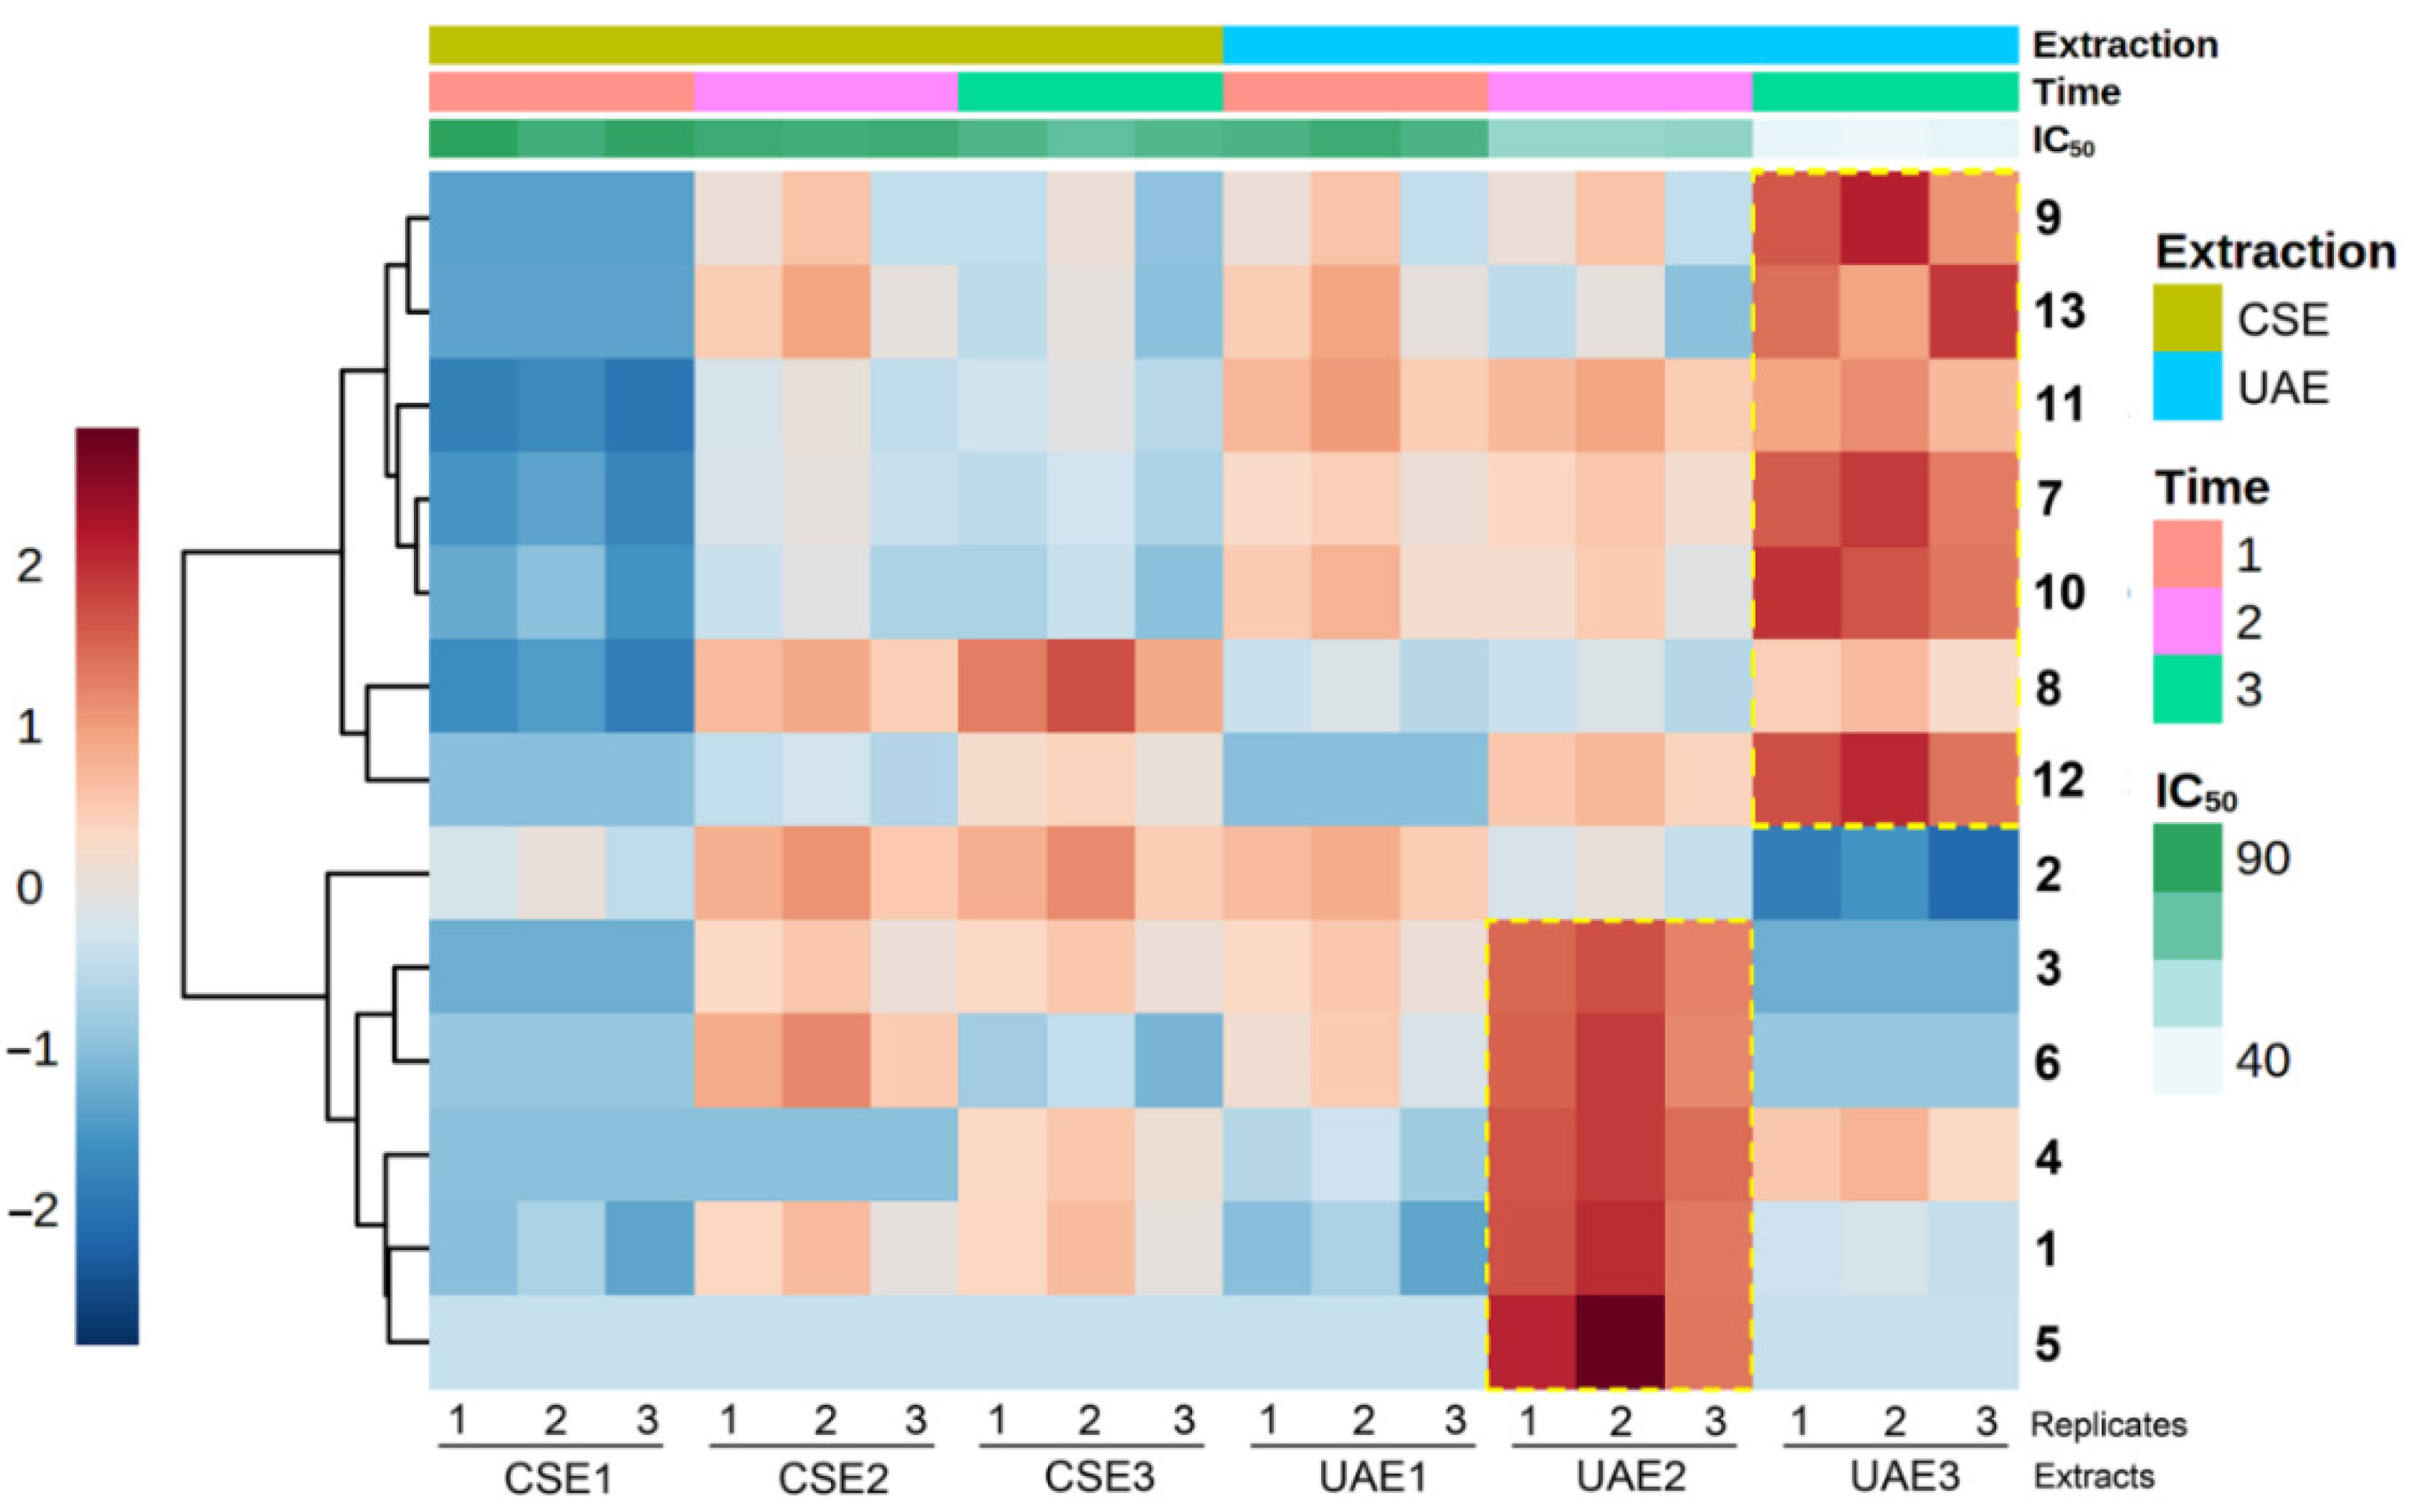
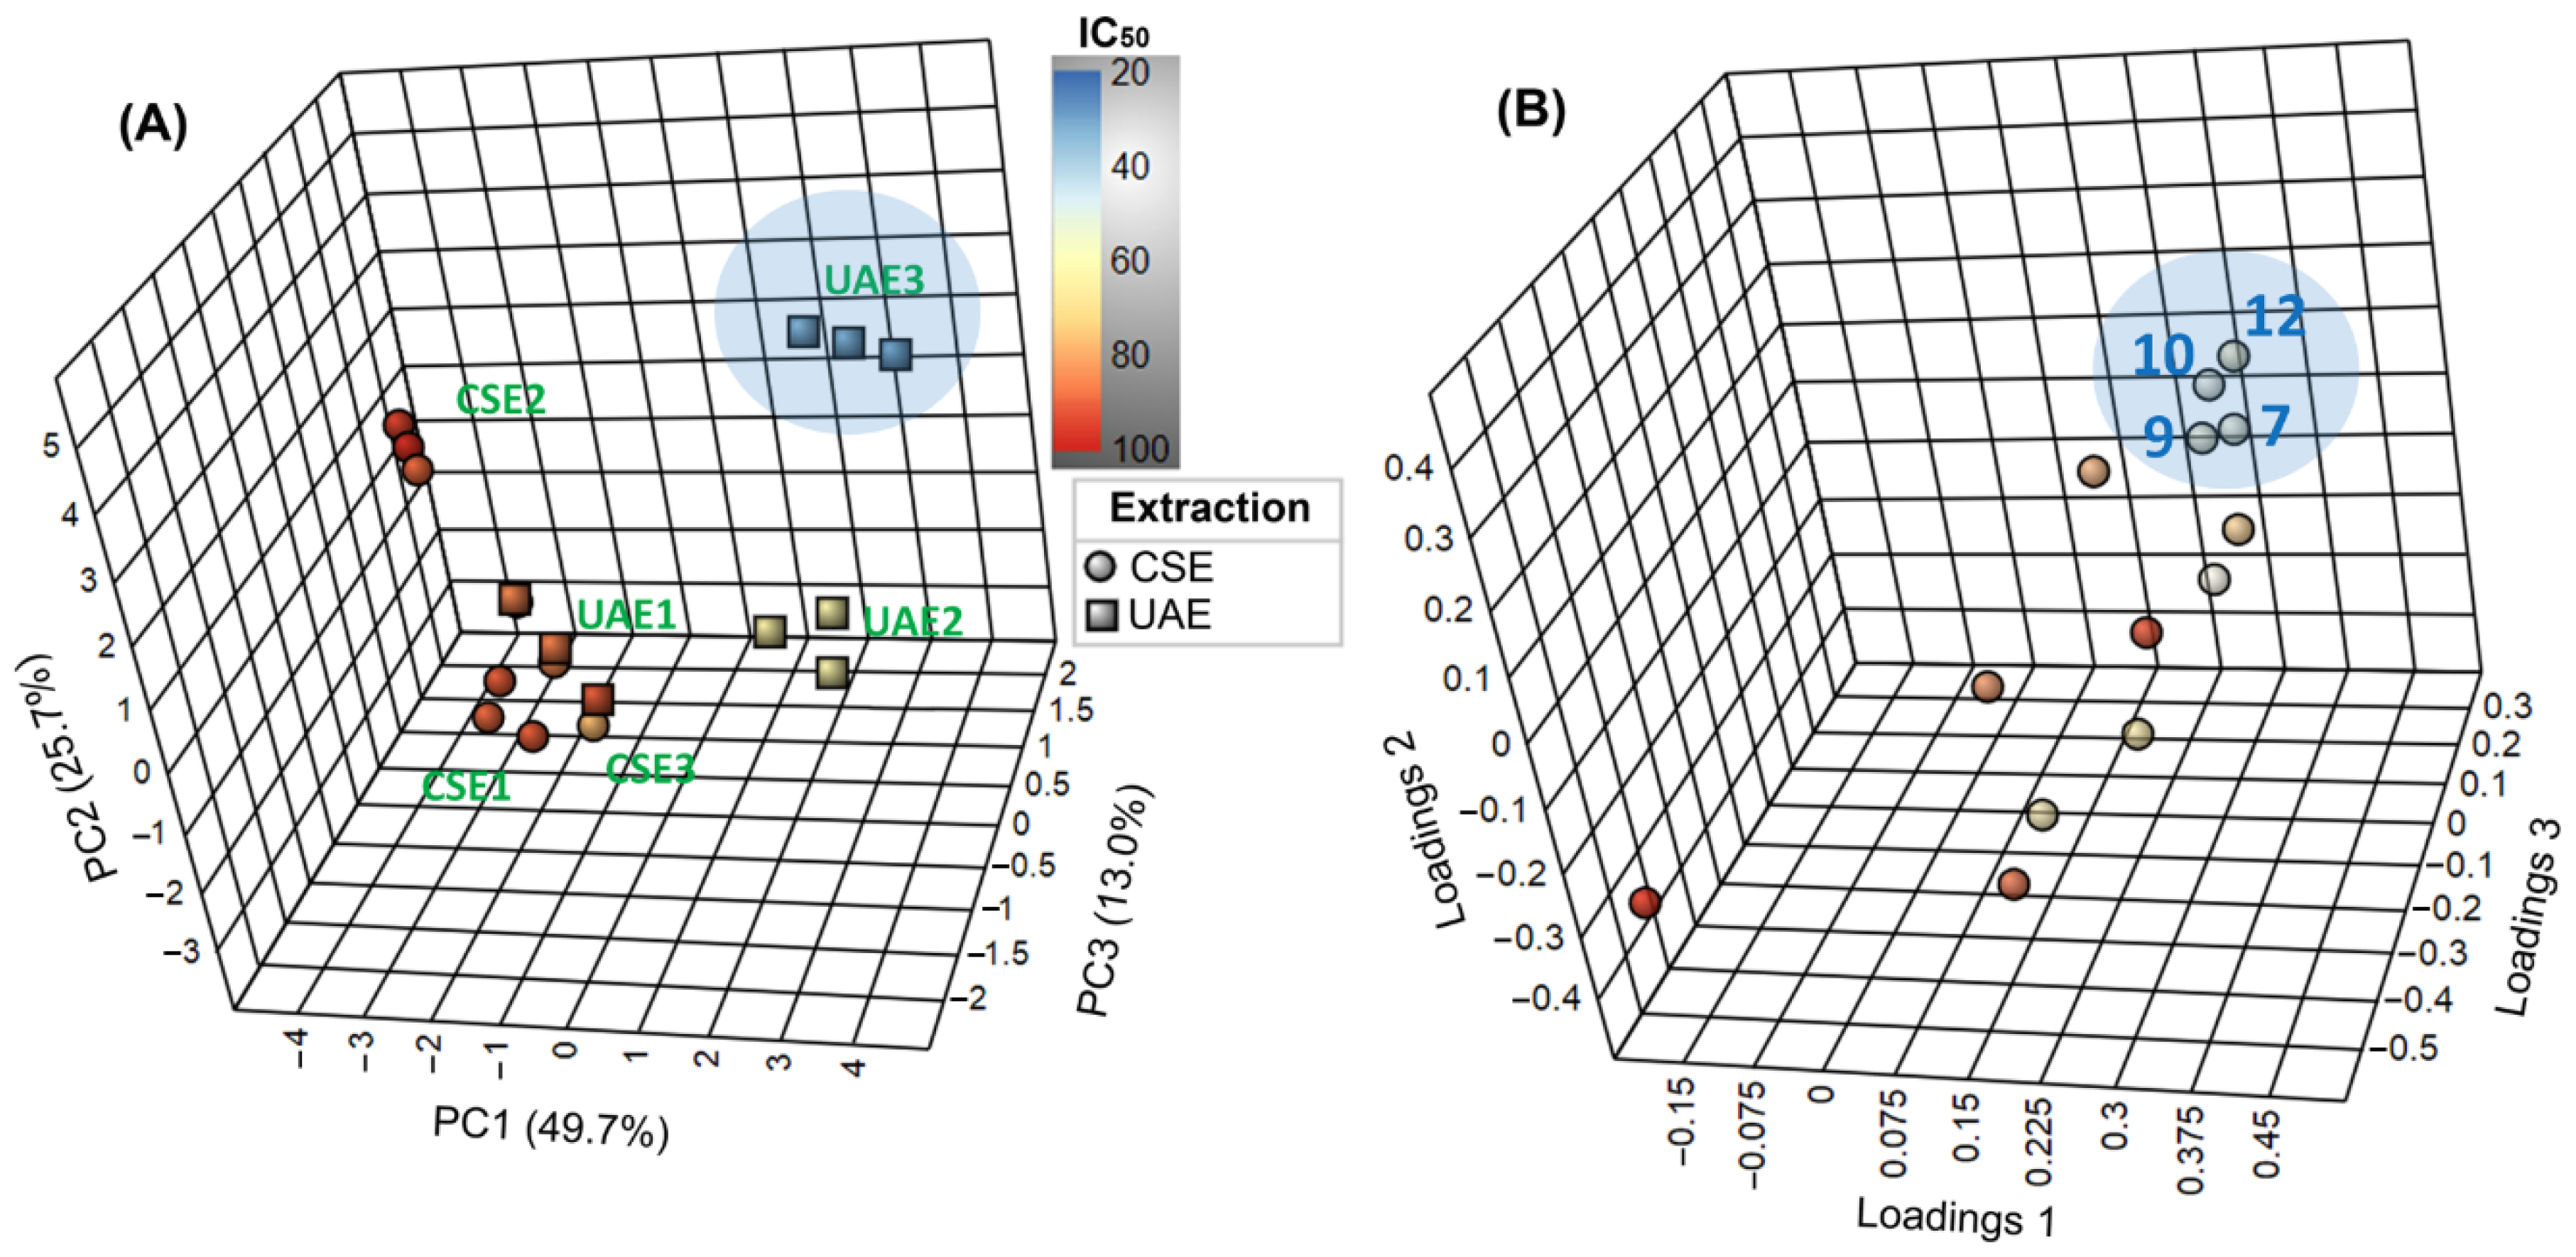
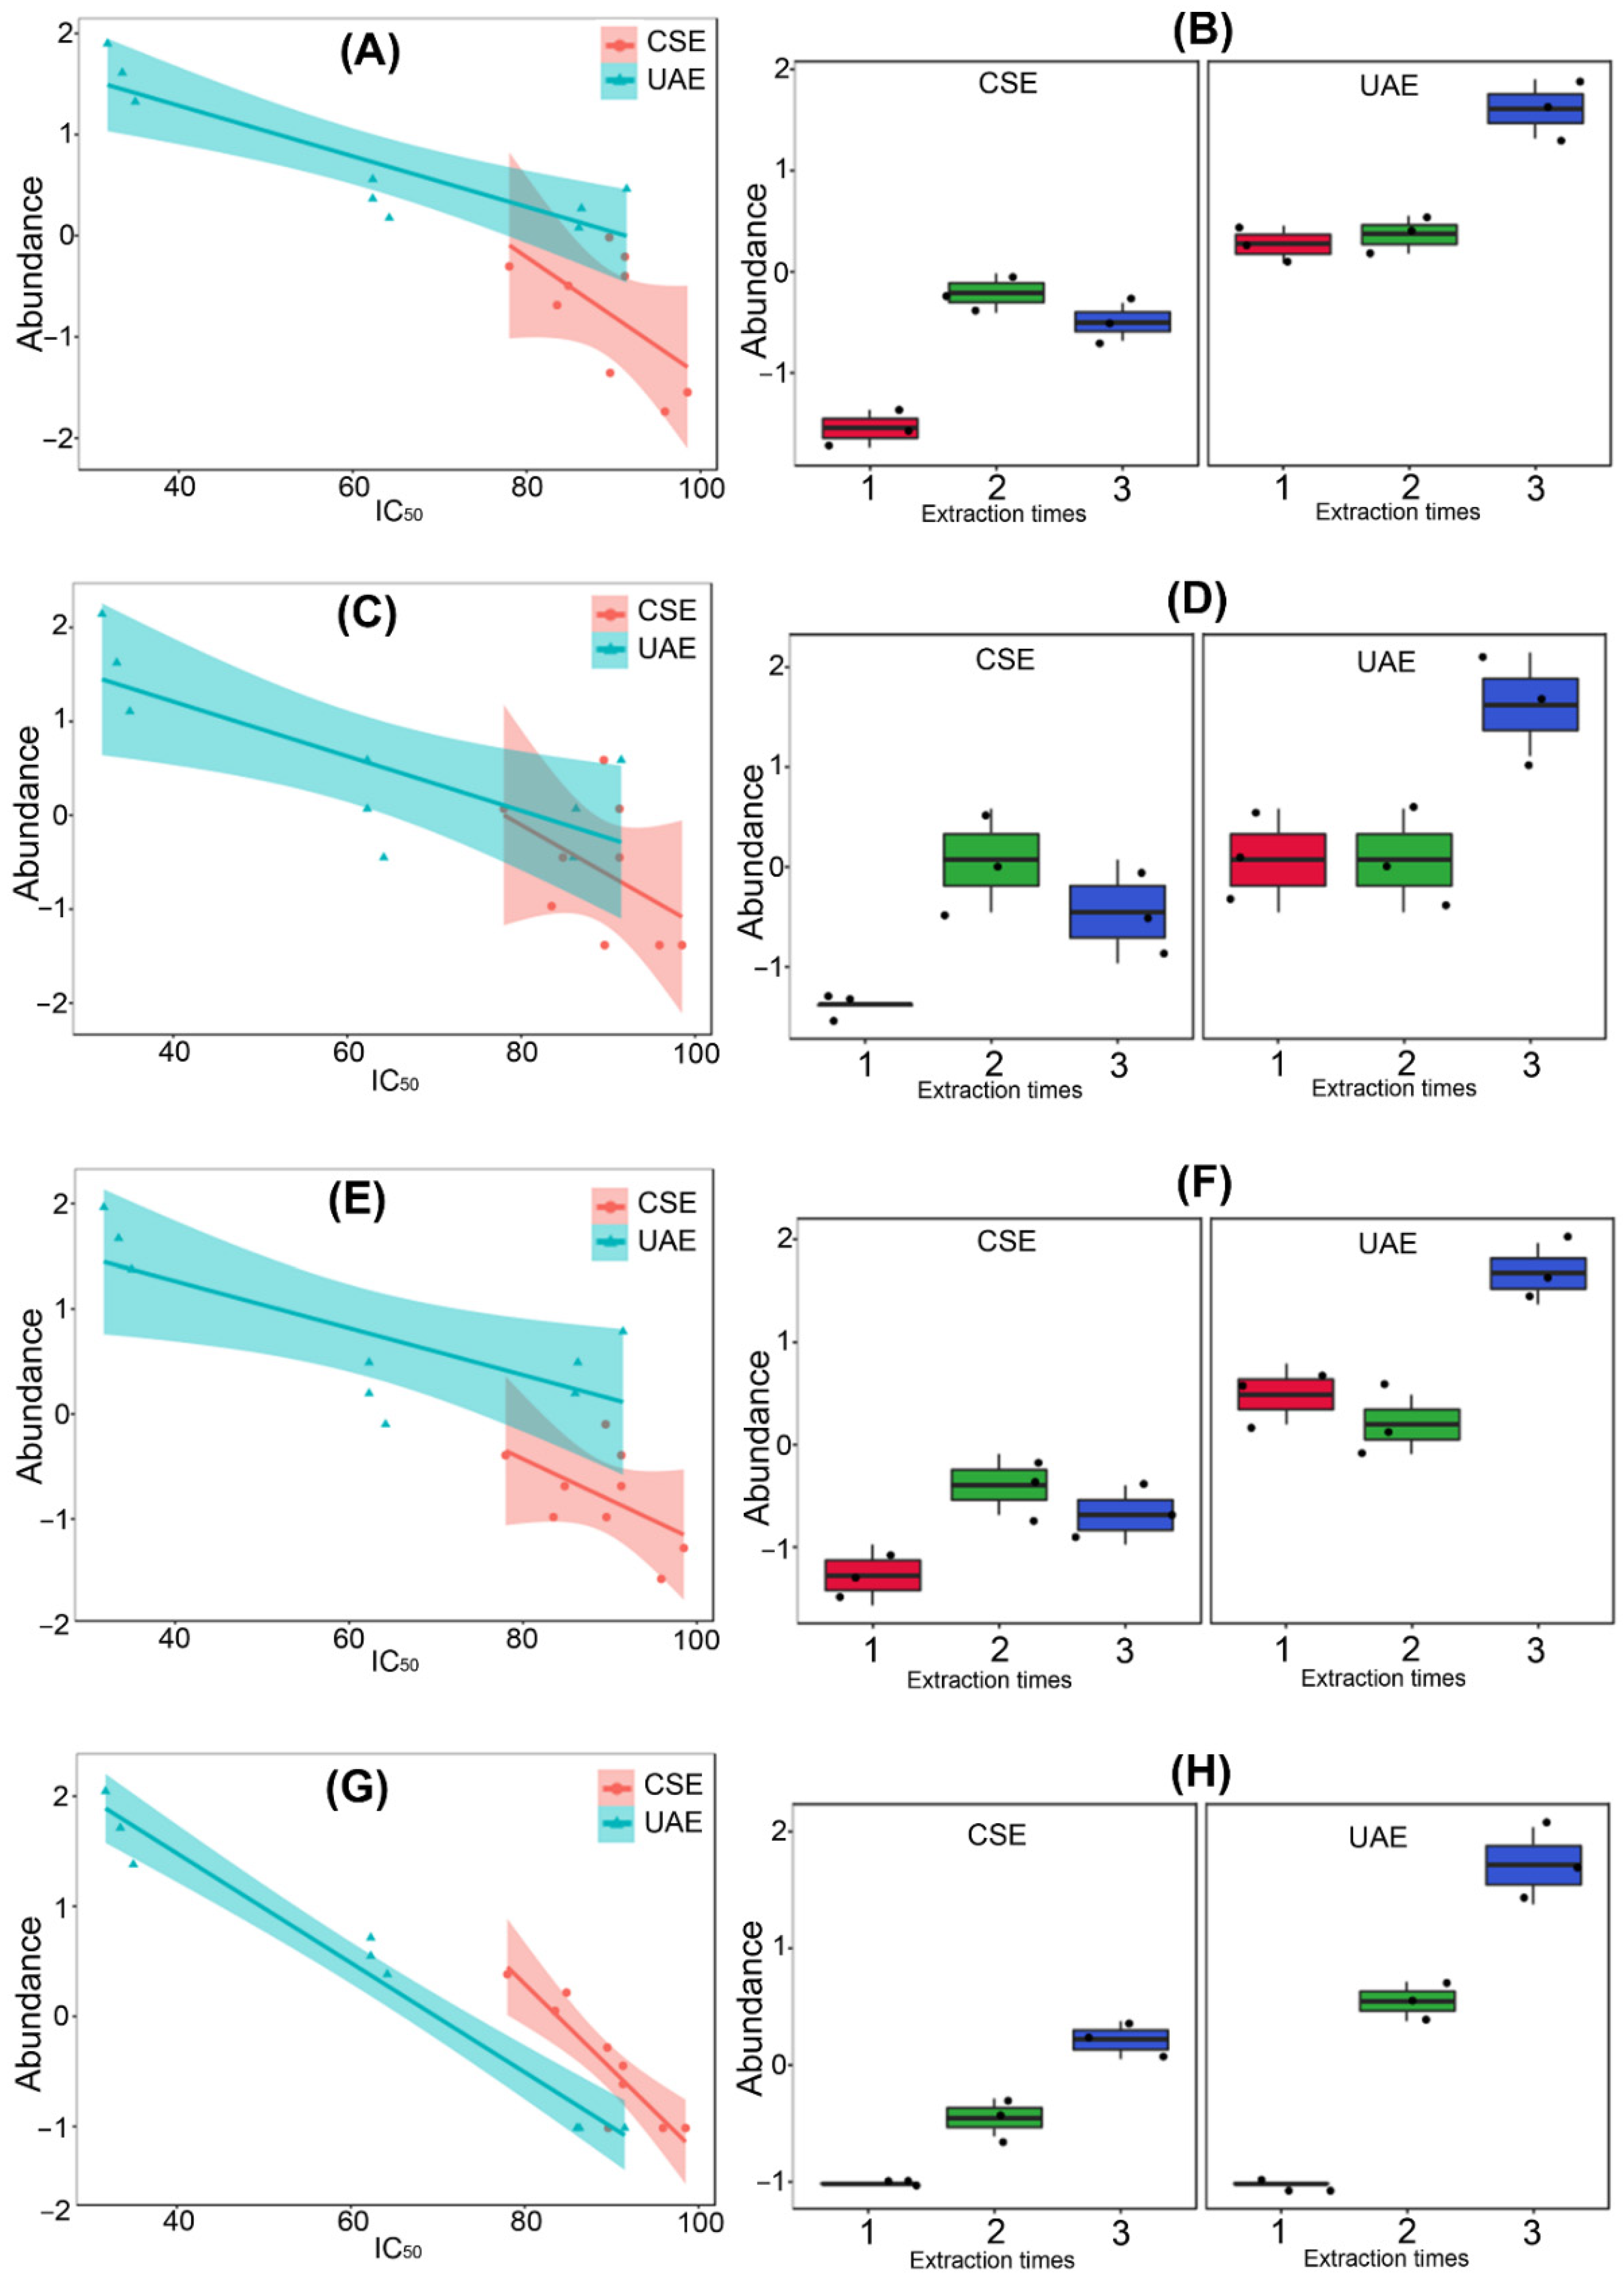
2.3. Variation of Chemical Composition and Mycelial Growth Inhibition by Extraction Conditions: A Biochemometrics-Based Exploration

An integrative analysis of the alkaloidal composition and activity on F. oxysporum mycelial growth was performed employing multiple-covariate statistics to achieve a more general comprehension of the obtained results and infer reliable relationships. The main goal was to recognize patterns and predict plausible bioactive alkaloids within the extracts. Thus, following a suitable pretreatment and preprocessing of the GC-MS profiles, an alkaloid abundance table (AAT) was built. The overall information contained in the AAT was visualized through a heat map combined with hierarchical clustering (Figure 3). Two clusters were evidenced in this heat map, comprising compounds mainly accumulated in UAE2 and UAE3, respectively, which influenced the discrimination of mycelial growth inhibition (significantly lower IC50 values). Each cluster involved six different alkaloids.
Further analysis was performed through a two-factor principal component analysis (PCA), whose scores and loadings plots are presented in Figure 4. The first three PC’s explained 88.4% of the total variance, indicating a well-fitted model. The relatively dispersed appearance of the samples across the corresponding three-dimensional scores plot (Figure 4A) implies high diversity among the alkaloidal profiles. In particular, UAE2, UAE3, and CSE2 are located in different quadrants along the PC1-PC2 plane, indicating stronger differences in their alkaloidal compositions.
In contrast, CSE1, CSE3, and UAE1 appeared closely related, as observed in Table 1. On the other hand, the color scale according to the IC50 values indicated an evident association between the alkaloidal composition and mycelial growth inhibition. The respective loadings plot (Figure 4B) revealed that four compounds were highly linked to the discriminating influence on the most active extract (i.e., UAE3), as follows: 7, 9, 10, and 12. This finding might indicate that they are the compounds responsible for the bioactivity observed for UAE3.
Therefore, the variation of these compounds along factors (i.e., the extraction type, extraction time, and IC50 values) is presented in Figure 5. A significantly higher abundance of the four top-ranked compounds in UAE3 compared with the other fractions derived from UAE and CSE was observed, supporting their statistical influence on sample discrimination regarding bioactivity. Hence, a noticeable change along the IC50 values was observed for compounds 7, 9, and 10, particularly in the ultrasound-assisted extraction at the longest time (i.e., UAE3), whose association between the abundance of these compounds and the activity was relevant (Figure 5A–F). However, the most drastic variations were experienced by alkaloid 12 (both by extraction type and time frame) since the slope of the linear regression is more pronounced along with IC50 values (Figure 5G) and involves significant differences between the extraction times for the UAE and CSE methods (Figure 5H). This observation could indicate a more plausible influence of 12 on the activity against the F. oxysporum strain. Highly abundant compounds, such as 2 and 11, could not be associated with the inhibitory activity since the changes in their abundance were not statistically relevant, and they behaved as a blank.

3. Materials and Methods

3.1. Plant Material

Leaves of the plant were collected in October of 2013 near the reservoir El Hato in Usme (Bogotá, Colombia). A voucher specimen was deposited at the Colombian National Herbarium with the number COL572777. Botanist C. A. Parra identified the specimen as Lupinus mirabilis C. P. Sm.

3.2. Conventional Extraction

Air-dried, powdered material (1.0 g) was mixed with 10% HCl at 1:1 w/v ratio, and the resulting mixture was magnetically stirred for 2 h at room temperature. Subsequently, the residue was filtered off. Then, the filtrate was neutralized with 10% ammonia and extracted with dichloromethane (3 × 20 mL). The combined organic layers were dried over anhydrous sodium sulfate and concentrated under reduced pressure to afford the alkaloidal fraction CSE1. The same procedure was independently repeated to give alkaloidal fractions after 4 and 6 h of extraction (CSE2 and CSE3, respectively). Each extraction procedure was performed in triplicate.

3.3. Ultrasound-Assisted Extraction

Air-dried, powdered material (1.0 g) was mixed with 10% HCl at 1:1 w/v ratio. The mixture was then immersed into an ultrasonic bath for 30 min at room temperature. After that period, filtration, neutralization, and extraction were conducted as described above for the conventional extraction to afford fraction UAE1. The same procedure was independently repeated to afford alkaloidal fractions after 1 and 2 h of extraction (UAE2 and UAE3, respectively). Each extraction was performed in triplicate.

3.4. GC-MS Analysis

Each alkaloidal fraction was analyzed by GC-MS on a Shimadzu QP2010 Plus system (Shimadzu, Columbia, MD, USA), using a fused capillary silica column Shimadzu SHRXi 5MS (30 m × 0.25 mm; 0.25 μm coating thickness). The injection port, ionization chamber, and transfer line temperatures were 250, 230, and 325 °C, respectively. The separation was conducted by running a temperature program as follows: 70 °C (2 min), 10 °C/min up to 310 °C, and finally, the temperature was held (10 min). A quadrupole analyzer in automatic frequency scanning (full scan) was used over the mass range m/z 40–400.
Mass spectra were obtained by electron ionization (EI) at 70 eV. The alkaloidal fractions were properly dissolved in chloroform before analysis and 1 μL of such solutions was injected using a split ratio of 1:10. Helium 4.5 was used as a carrier gas at a 1 mL/min flow rate. The components of each fraction were identified by comparison of their MS spectra with those reported in the database NIST95 and the literature [27,29]. Retention indexes (RI) were also calculated from a homologous series of n-alkanes (C12–C28) to support the identification [27].

3.5. Mycelial Growth Inhibition Assay

A micro-scale amended medium protocol was employed based on a previously reported procedure [39]. Briefly, six ten-fold serial dilutions (0.01–1000 µg/mL) of extracts and positive controls were prepared by amending fresh semi-solid medium (1.2 g of PDB (potato-dextrose broth) and 0.5 g of agar per 100 mL of distilled water) with the required amount of each test extract (n = 6). A stock dispersion was initially prepared by a direct mixture between the semi-solid medium (5 mL) and the required extract amount. This mixture was vigorously stirred until achieving a homogenous dispersion before solidifying.
Tween-20 (5%) was used to assist the dispersion of the extracts. The resulting homogeneously amended medium was placed into three wells of a 12-well autoclavable glass plate. The final volume (for extracts and controls) was 200 μL per well (1-cm diameter). Subsequently, a 1-mm agar-mycelial plug from 5 day actively growing cultures of the F. oxysporum LQB-03 strain (a virulent isolate obtained from wilting Physalis peruviana plants [22]) was inoculated onto the center of each well. Each 12-well plate was placed into a 17-mm Petri dish, under the appropriate conditions of humidity and sterility, and sealed with plastic film.
Each trial comprised a randomized design with three replicates for each extract compared to an absolute control (untreated, inoculated semi-solid medium). Prochloraz and Mancozeb were used as positive controls. After inoculation and sealing, this assembly was incubated at 25 °C. The assay was concluded once the colony on the negative control covered the whole well (after ca. 48 h). Therefore, the mean colony area (mm2) was measured for treated and untreated wells by processing the respective photographic records using the software Image J® (National Institutes of Health, Bethesda, MD, USA).
The percent mycelial growth inhibition (MGI) was then calculated for each replicate. This calculation was made employing the following equation: % MGI = [(absolute control area—treatment area)/absolute control area)] × 100. The half-maximal inhibitory concentrations (IC50 in μg/mL) for each extract were calculated through non-linear regression from the dose-response curves using the software GraphPad Prism 5.0 (GraphPad Software, San Diego, CA, USA).

3.6. Data Analysis

The data normality was checked by the Shapiro-Wilks test. Subsequently, a two-way ANOVA followed by post-hoc HSD Tukey’s test were used to assess the significant differences between relative abundances of quinolizidines (Table 1), owing to their normal distribution. On the other hand, the non-parametric Kruskal–Wallis test followed by a Dunn’s multiple comparison test were used to assess the differences among IC50 values (Table 2). In all cases, the significance level was set at α < 0.05. These statistical analyses were performed in R project software version 3.0.2 (R Foundation, Vienna, Austria).
On the other hand, the relative composition of each fraction was obtained after a conventional pretreatment of data. In brief, the baseline was corrected using MZmine 2 (MZmine Development Team, San Diego, CA, USA), and the resulting profiles were integrated. Thus, a data matrix was defined by the relative abundance of each alkaloid contained into the alkaloidal fractions and, therefore, an alkaloid abundance table (AAT) was built.
First, trend variations in the alkaloid content within the samples were analyzed by direct comparison in terms of Pearson’s correlation coefficients, and the corresponding p values evaluated their statistical significance. This analysis was performed in MATLAB R2016a (MathWorks, Natick, MA, USA). In addition, the AAT matrix and inhibition percentages against F. oxysporum were also used to build a multiple-covariate input dataset, using metadata factors, i.e., extractions times and type of extraction as categorical variables, and IC50 values as the continuous variable.
The resulting metadata matrix was autoscaled (mean-centered and divided by the standard deviation of each variable), visualized through a heatmap combined with hierarchical clustering, and further analyzed through two-factor principal component analysis (PCA), using the default parameters of the statistical analysis module of MetaboAnalyst 4.0 (McGill University, Quebec, Canada) [40]. The alkaloidal composition and mycelial growth inhibition were then statistically integrated, and, subsequently, the detected associations were used to explore patterns and to identify potential antifungal alkaloids within the test extracts. The variations of the most discriminating alkaloids were comparatively studied through box plots and linear regressions.

4. Conclusions

The alkaloidal composition of leaves from L. mirabilis wildly growing in Colombia was established for the first time, evaluating the effect of two different extraction methods. Regardless of the extraction conditions, sparteine (2) and lupanine (11) were identified as the main constituents of the obtained fractions, accounting for 75–89% of the total composition. This fact indicates that L. mirabilis is an excellent source of simple quinolizidines, such as sparteine. Tetrahydrorhombifoline (7), 17-oxosparteine (8), and hydroxytetrahydrorhombifoline (10) were identified within the minor components. Short-term (0.5 h) ultrasound-assisted extraction was demonstrated to be comparable with long-term (6 h) conventional extraction.
All obtained fractions exhibited activity on the mycelial growth of the studied F. oxysporum strain (IC50 < 100 µg/mL). However, the extraction appeared to strongly impact the proportion of the most active constituents, with fraction UAE3 being the most active. After a statistical integration of the alkaloidal composition and bioactivity datasets, four compounds (i.e., 7, 9, 10, and 12) were more likely related to the mycelial growth inhibition since the extraction conditions appeared to affect the major components to the same extent. 13α-Hydroxylupanine (12) may represent a promising antifungal alkaloid to be included in further studies against the phytopathogen F. oxysporum.

Author Contributions

Conceptualization, methodology, formal analysis, data curation, and writing, F.A.B. and E.C.-B.; resources, funding acquisition, E.C.-B. All authors have read and agreed to the published version of the manuscript.

Funding

This study was funded by Vicerrectoría de Investigaciones at Universidad Militar Nueva Granada through the project IMP-CIAS-2293, validity 2017.

Institutional Review Board Statement

Not applicable.

Informed Consent Statement

Not applicable.

Data Availability Statement

The authors confirm that the data supporting the findings of this study are available within the article and from the corresponding author upon request.

Acknowledgments

The authors thank Universidad Militar Nueva Granada for the financial support.

Conflicts of Interest

The authors declare that there are no conflict of interest regarding the publication of this paper.

Sample Availability

Samples are available from the authors upon request.

Appendix A

Table A1. Identification of compounds from alkaloidal fractions of L. mirabilis leaves by GC-MS.
# aRT bRI cM+ dOther MS Fragments d
115.871757234(39)98(100)137(55)136(36)97(25)110(23)84(20)193(17)122(16)134(15)150(15)
216.731786234(26)137(100)98(87)136(42)97(34)193(33)110(22)122(19)84(18)150(15)134(15)
316.931852234(19)137(100)98(95)136(43)97(40)193(28)110(24)122(21)84(20)134(18)150(15)
417.241887234(15)98(100)137(90)134(46)97(43)122(26)232(26)110(24)84(19)150(17)193(16)
517.621920232(37)98(100)137(62)97(44)134(39)84(29)122(22)110(19)148(16)193(15)177(12)
617.751934208(47)165(100)110(99)136(88)123(85)191(78)137(73)94(69)95(45)84(40)107(29)
719.752133248(<1)58(100)207(87)112(31)108(16)208(12)55(18)94(6)84(4)98(3)-
819.992172248(51)97(100)98(87)110(73)136(49)220(35)123(33)137(28)150(23)134(22)191(16)
920.362204248(44)136(100)149(52)98(38)150(32)97(31)110(23)137(22)84(20)134(18)122(13)
1020.632236264(<1)223(100)58(68)108(60)96(20)128(18)224(14)100(9)110(6)82(6)-
1120.882275248(44)136(100)149(54)150(36)98(26)110(22)134(20)137(15)82(10)219(7)-
1223.092531264(30)152(100)134(50)246(50)165(38)112(36)148(26)98(17)122(15)84(14)207(12)
1324.852623337(3)59(100)72(67)55(41)43(28)126(14)86(10)114(8)140(4)320(3)294(2)
a # = Compound numbering according to the retention time in the total ion chromatogram, whose names and structures are presented in Figure A1. b RT = retention time (min). c RI = Retention indexes (experimental). d Values in parenthesis constitute the ion’s relative intensity in the MS spectra.
Figure A1. Structures of compounds identified from alkaloidal fractions of Lupinus mirabilis leaves.
Molecules 27 02832 g0a1

References

  1. Drummond, C.S.; Eastwood, R.J.; Miotto, S.T.S.; Hughes, C.E. Multiple Continental Radiations and Correlates of Diversification in Lupinus (Leguminosae): Testing for Key Innovation with Incomplete Taxon Sampling. Syst. Biol. 2012, 61, 443–460. [Google Scholar] [CrossRef] [PubMed] [Green Version]
  2. Aïnouche, A.-K.; Bayer, R.J. Phylogenetic Relationships in Lupinus (Fabaceae: Papilionoideae) Based on Internal Transcribed Spacer Sequences (ITS) of Nuclear Ribosomal DNA. Am. J. Bot. 1999, 86, 590. [Google Scholar] [CrossRef] [PubMed]
  3. Aïnouche, A.; Bayer, R.J.; Misset, M.-T. Molecular Phylogeny, Diversification and Character Evolution in Lupinus (Fabaceae) with Special Attention to Mediterranean and African Lupines. Plant Syst. Evol. 2004, 246, 211–222. [Google Scholar] [CrossRef]
  4. Khan, M.K.; Karnpanit, W.; Nasar-Abbas, S.M.; Huma, Z.E.; Jayasena, V. Phytochemical Composition and Bioactivities of Lupin: A Review. Int. J. Food Sci. Technol. 2015, 50, 2004–2012. [Google Scholar] [CrossRef]
  5. Villarino, C.B.J.; Jayasena, V.; Coorey, R.; Chakrabarti-Bell, S.; Johnson, S.K. Nutritional, Health, and Technological Functionality of Lupin Flour Addition to Bread and Other Baked Products: Benefits and Challenges. Crit. Rev. Food Sci. Nutr. 2016, 56, 835–857. [Google Scholar] [CrossRef] [Green Version]
  6. Saito, K.; Murakoshi, I. Chemistry, Biochemistry and Chemotaxonomy of Lupine Alkaloids in the Leguminosae. Stud. Nat. Prod. Chem. 1995, 15, 519–549. [Google Scholar] [CrossRef]
  7. Reisfeld, R.A.; Jolla, L.; Tuppy, H. Lupine Alkaloids. In Molecular Biology, Biochemistry, and Biophysics—The Biochemistry of Alkaloids; Springer: Berlin, Germany, 1980; Volume 32, pp. 67–75. ISBN 9783642618321. [Google Scholar]
  8. Frick, K.M.; Kamphuis, L.G.; Siddique, K.H.M.; Singh, K.B.; Foley, R.C. Quinolizidine Alkaloid Biosynthesis in Lupins and Prospects for Grain Quality Improvement. Front. Plant Sci. 2017, 8, 1–12. [Google Scholar] [CrossRef]
  9. Schrenk, D.; Bodin, L.; Chipman, J.K.; Del Mazo, J.; Grasl-Kraupp, B.; Hogstrand, C.; Hoogenboom, L.R.; Leblanc, J.-C.; Nebbia, C.S.; Nielsen, E.; et al. Scientific Opinion on the Risks for Animal and Human Health Related to the Presence of Quinolizidine Alkaloids in Feed and Food, in Particular in Lupins and Lupin-Derived Products. Eur. Food Saf. Auth. J. 2019, 17, e05860. [Google Scholar] [CrossRef] [Green Version]
  10. Cortés-Avendaño, P.; Tarvainen, M.; Suomela, J.P.; Glorio-Paulet, P.; Yang, B.; Repo-Carrasco-Valencia, R. Profile and Content of Residual Alkaloids in Ten Ecotypes of Lupinus mutabilis Sweet after Aqueous Debittering Process. Plant Foods Hum. Nutr. 2020, 75, 184–191. [Google Scholar] [CrossRef] [Green Version]
  11. Wink, M. Introduction: Biochemistry, Physiology and Ecological Functions of Secondary Metabolites. In Biochemistry of Plant Secondary Metabolism; Wiley-Blackwell: Oxford, UK, 2010; Volume 40, pp. 1–19. ISBN 9781444320503. [Google Scholar]
  12. Boschin, G.; Resta, D. Alkaloids Derived from Lysine: Quinolizidine (a Focus on Lupin Alkaloids) BT—Natural Products: Phytochemistry, Botany and Metabolism of Alkaloids, Phenolics and Terpenes. In Natural Products. Phytochemistry, Botany and Metabolism of Alkaloids, Phenolics and Terpenes; Ramawat, K.G., Mérillon, J.-M., Eds.; Springer: Berlin/Heidelberg, Germany, 2013; pp. 381–403. ISBN 978-3-642-22144-6. [Google Scholar]
  13. Wink, M. Plant Secondary Metabolites Modulate Insect Behavior-Steps Toward Addiction ? Front. Physiol. 2018, 9, 1–9. [Google Scholar] [CrossRef] [Green Version]
  14. Confortin, T.C.; Todero, I.; Soares, J.F.; Luft, L.; Brun, T.; Rabuske, J.E.; Nogueira, C.U.; Mazutti, M.A.; Zabot, G.L.; Tres, M.V. Extracts from Lupinus albescens: Antioxidant Power and Antifungal Activity in vitro against Phytopathogenic Fungi. Environ. Technol. 2019, 40, 1668–1675. [Google Scholar] [CrossRef] [PubMed]
  15. Bernal-Alcocer, A.; Zamora-Natera, J.F.; Virgen-calleros, G.; Nuño-romero, R. In Vitro Biological Activity of Extracts of Lupinus Spp. on Phytopathogenic Fungi. Rev. Mex. Fitopatol. 2005, 23, 140–146. [Google Scholar]
  16. Small, E. 38. Lupins—Benefit and Harm Potentials. Biodiversity 2012, 13, 54–64. [Google Scholar] [CrossRef]
  17. Pegg, K.G.; Coates, L.M.; O’Neill, W.T.; Turner, D.W. The Epidemiology of Fusarium Wilt of Banana. Front. Plant Sci. 2019, 10, 1–53. [Google Scholar] [CrossRef] [Green Version]
  18. Najmi, A.; Javed, S.A.; Al Bratty, M.; Alhazmi, H.A. Modern Approaches in the Discovery and Development of Plant-Based Natural Products and Their Analogues as Potential Therapeutic Agents. Molecules 2022, 27, 349. [Google Scholar] [CrossRef]
  19. Álvarez-Caballero, J.M.; Cuca-Suárez, L.E.; Coy-Barrera, E. Bio-Guided Fractionation of Ethanol Extract of Leaves of Esenbeckia alata Kunt (Rutaceae) Led to the Isolation of Two Cytotoxic Quinoline Alkaloids: Evidence of Selectivity against Leukemia Cells. Biomolecules 2019, 9, 585. [Google Scholar] [CrossRef] [Green Version]
  20. Granato, D.; Nunes, D.S.; Barba, F.J. An Integrated Strategy between Food Chemistry, Biology, Nutrition, Pharmacology, and Statistics in the Development of Functional Foods: A Proposal. Trends Food Sci. Technol. 2017, 62, 13–22. [Google Scholar] [CrossRef]
  21. Kellogg, J.J.; Todd, D.A.; Egan, J.M.; Raja, H.A.; Oberlies, N.H.; Kvalheim, O.M.; Cech, N.B. Biochemometrics for Natural Products Research: Comparison of Data Analysis Approaches and Application to Identification of Bioactive Compounds. J. Nat. Prod. 2016, 79, 376–386. [Google Scholar] [CrossRef] [Green Version]
  22. Cárdenas-Laverde, D.; Barbosa-Cornelio, R.; Coy-Barrera, E. Antifungal Activity against Fusarium oxysporum of Botanical End-Products: An Integration of Chemical Composition and Antifungal Activity Datasets to Identify Antifungal Bioactives. Plants 2021, 10, 2563. [Google Scholar] [CrossRef]
  23. Kellogg, J.J.; Wallace, E.D.; Graf, T.N.; Oberlies, N.H.; Cech, N.B. Conventional and Accelerated-Solvent Extractions of Green Tea (Camellia sinensis) for Metabolomics-Based Chemometrics. J. Pharm. Biomed. Anal. 2017, 145, 604–610. [Google Scholar] [CrossRef] [Green Version]
  24. Caesar, L.K.; Kellogg, J.J.; Kvalheim, O.M.; Cech, N.B. Opportunities and Limitations for Untargeted Mass Spectrometry Metabolomics to Identify Biologically Active Constituents in Complex Natural Product Mixtures. J. Nat. Prod. 2019, 82, 469–484. [Google Scholar] [CrossRef] [PubMed]
  25. Wink, M. Chemische Verteidigung Der Lupinen: Zur Biologischen Bedeutung Der Chinolizidinalkaloide. Plant Syst. Evol. 1985, 150, 65–81. [Google Scholar] [CrossRef]
  26. Priddis, C.R. Capillary Gas Chromatography of Lupin Alkaloids. J. Chromatogr. A 1983, 261, 95–101. [Google Scholar] [CrossRef]
  27. Wink, M.; Meißner, C.; Witte, L. Patterns of Quinolizidine Alkaloids in 56 Species of the Genus Lupinus. Phytochemistry 1995, 38, 139–153. [Google Scholar] [CrossRef]
  28. Wink, M. Quinolizidine Alkaloids: Biochemistry, Metabolism, and Function in Plants and Cell Suspension Cultures. Planta Med. 1987, 53, 509–514. [Google Scholar] [CrossRef] [Green Version]
  29. Vul, N.S.; Zaikin, V.G. Mass Spectrometry of Quinolizidine Alkaloids. Russ. Chem. Rev. 1976, 45, 959–970. [Google Scholar]
  30. El-Shazly, A.; Ateya, A.-M.M.M.; Wink, M. Quinolizidine Alkaloid Profiles of Lupinus varius orientalis, L. albus albus, L. hartwegii, and L. densiflorus. Z. Naturforsch. C 2001, 56, 21–30. [Google Scholar] [CrossRef]
  31. Planchuelo-Ravelo, A.; Witte, L.; Wink, M. Quinolizidine Alkaloid Profiles of South American Lupins: Lupinus linearis and the Lupinus gibertianus Complex. Z. Naturforsch. C 1993, 48c, 702–706. [Google Scholar] [CrossRef] [Green Version]
  32. Chludil, H.D.; Vilariño, M.D.P.; Franco, M.L.; Leicach, S.R. Changes in Lupinus albus and Lupinus angustifolius Alkaloid Profiles in Response to Mechanical Damage. J. Agric. Food Chem. 2009, 57, 6107–6113. [Google Scholar] [CrossRef]
  33. Kordan, B.; Dancewicz, K.; Wróblewska, A.; Gabryś, B. Intraspecific Variation in Alkaloid Profile of Four Lupine Species with Implications for the Pea Aphid Probing Behaviour. Phytochem. Lett. 2012, 5, 71–77. [Google Scholar] [CrossRef]
  34. Cook, D.; Mott, I.W.; Larson, S.R.; Lee, S.T.; Johnson, R.; Stonecipher, C.A.; Herbarium, S.L.W. Genetic Relationships among Different Chemotypes of Lupinus sulphureus. J. Agric. Food Chem. 2018, 66, 1773–1783. [Google Scholar] [CrossRef] [PubMed]
  35. Cely-Veloza, W.; Quiroga, D.; Coy-Barrera, E. Quinolizidine-Based Variations and Antifungal Activity of Eight Lupinus Species Grown under Greenhouse Conditions. Molecules 2022, 27, 305. [Google Scholar] [CrossRef] [PubMed]
  36. Pérez-Laínez, D.; García-Mateos, R.; San Miguel-Chávez, R.; Soto-Hernández, M.; Rodríguez-Pérez, E.; Kite, G. Bactericidal and Fungicidal Activities of Calia secundiflora (Ort.) Yakovlev. Z. Naturforsch. C 2008, 63, 653–657. [Google Scholar] [CrossRef] [PubMed]
  37. Wink, M. Chemical Defense of Leguminosae. Are Quinolizidine Alkaloids Part of the Antimicrobial Defense System of Lupins? Z. Naturforsch. C 1984, 39, 548–552. [Google Scholar] [CrossRef] [Green Version]
  38. El Hamdani, N.; Filali-Ansari, N.; Fdil, R.; El Abbouyi, A.; El Khyari, S. Antifungal Activity of the Alkaloids Extracts from Aerial Parts of Retama monosperma. Res. J. Pharm. Biol. Chem. Sci. 2016, 7, 965–971. [Google Scholar]
  39. Marentes-Culma, R.; Orduz-Díaz, L.L.; Coy-Barrera, E. Targeted Metabolite Profiling-Based Identification of Antifungal 5-n-Alkylresorcinols Occurring in Different Cereals against Fusarium oxysporum. Molecules 2019, 24, 770. [Google Scholar] [CrossRef] [Green Version]
  40. Chong, J.; Wishart, D.S.; Xia, J. Using MetaboAnalyst 4.0 for Comprehensive and Integrative Metabolomics Data Analysis. Curr. Protoc. Bioinform. 2019, 68, e86. [Google Scholar] [CrossRef]
Figure 1. Comparison of the GC-MS alkaloidal profiles of L. mirabilis leaves obtained by conventional extraction for 6 h (CSE3) and ultrasound-assisted extraction for 0.5 h (UAE1).
Molecules 27 02832 g001
Figure 2. Pearson’s correlations among alkaloids of L. mirabilis from different extraction conditions. Dark blue: high positive correlation; dark red: high negative correlation. * Significant p value (p < 0.05). 1: α-isosparteine; 2: sparteine; 3: β-isosparteine; 4 and 5: unknown; 6: ammodendrine; 7: tetrahydrorhombifoline; 8: 17-oxysparteine; 9: α-isolupanine; 10: hydroxytetrahydrorhombifoline; 11: lupanine; 12: 13α-hydroxylupanine; and 13: 13-Docosenamide.
Molecules 27 02832 g002
Figure 3. Distribution of the relative abundance of the quinolizidine alkaloids (112) and amide 13 detected in extracts of L. mirabilis under different extraction conditions. CSE1-3: conventional solvent extraction for 2, 4, and 6 h, respectively; UAE1-3: ultrasound-assisted extraction for 0.5, 1, and 2 h, respectively. The heat map is organized by columns for each factor, i.e., the extraction type (CSE and UAE), extraction time (1, 2, and 3), and mycelial growth inhibition expressed by green shades (dark green: IC50 = 90 µg/mL; light green: IC50 = 40 µg/mL). Cells colored by autoscaled relative abundance of each alkaloid (dark red: high abundance; and dark blue: low abundance). The heat map is also organized by rows according to the Ward clustering algorithm (Euclidean distance).
Molecules 27 02832 g003
Figure 4. Two-factor principal component analysis (PCA) on the alkaloidal profiles of L. mirabilis under different extraction conditions. CSE1-3: conventional solvent extraction for 2, 4, and 6 h, respectively; UAE1-3: ultrasound-assisted extraction for 0.5, 1, and 2 h, respectively. (A) Three-dimensional scores plot. Samples colored by activity on F. oxysporum mycelial growth (expressed as IC50 in µg/mL). (B) Three-dimensional loadings plot. Compounds highlighted in blue ellipsoids are as follows: 7: tetrahydrorhombifoline; 9: α-isolupanine; 10: hydroxytetrahydrorhombifoline; and 12: 13α-hydroxylupanine.
Molecules 27 02832 g004
Figure 5. Variations of the most-contrasting alkaloids between alkaloidal profiles of L. mirabilis using different extraction conditions along the activity on F. oxysporum mycelial growth (expressed as IC50 in µg/mL). Linear regressions for compounds (A) 7, (C) 9, (E) 10, and (G) 12 and box-plots of the autoscaled abundances for compounds (B) 7, (D) 9, (F) 10, and (H) 12. CSE1-3: conventional solvent extraction for 2, 4, and 6 h, respectively; UAE1-3: ultrasound-assisted extraction for 0.5, 1, and 2 h, respectively. Compounds: 7 = tetrahydrorhombifoline; 9 = α-isolupanine; 10 = hydroxytetrahydrorhombifoline; and 12 = 13α-hydroxylupanine.
Molecules 27 02832 g005
Table 1. Comparison of the chemical composition of alkaloidal fractions from L. mirabilis using conventional solvent and ultrasound-assisted extraction.
CompoundRelative Abundance (%) a
CSE1CSE2CSE3UAE1UAE2UAE3
10.3 ± 0.1 C0.7 ± 0.1 B0.7 ± 0.1 B0.3 ± 0.1 C1.1 ± 0.1 A0.5 ± 0.03 B,C
274.3 ± 1.5 B80.4 ± 1.7 A80.6 ± 2.1 A79.6 ± 1.1 A74.4 ± 1.3 B64.7 ± 1.7 C
3-0.8 ± 0.1 B0.8 ± 0.1 B0.8 ± 0.1 B1.3 ± 0.1 A-
4--0.6 ± 0.1 B0.2 ± 0.1 C1.2 ± 0.1 A0.7 ± 0.1 B
5----0.4 ± 0.1 A-
6-0.5 ± 0.1 B0.03 ± 0.01 D0.3 ± 0.1 C0.7 ± 0.1 A-
71.6 ± 0.2 D3.0 ± 0.2 B,C2.7 ± 0.2 C3.5 ± 0.2 B3.6 ± 0.2 B4.9 ± 0.3 A
80.4 ± 0.1 D1.5 ± 0.1 A,B1.8 ± 0.2 A1.0 ± 0.1 C1.0 ± 0.1 C1.4 ± 0.1 B
9-0.3 ± 0.1 B0.2 ± 0.1 B0.3 ± 0.1 B0.3 ± 0.1 B0.6 ± 0.1 A
100.6 ± 0.1 E0.9 ± 0.1 C,D0.8 ± 0.1 D,E1.2 ± 0.1 B1.1 ± 0.1 B,C1.6 ± 0.1 A
114.5 ± 0.3 C7.9 ± 0.5 B7.7 ± 0.5 B10.0 ± 0.6 A9.9 ± 0.5 A10.4 ± 0.5 A
12-0.4 ± 0.1 C0.8 ± 0.1 B-1.0 ± 0.1 B1.7 ± 0.2 A
13-0.4 ± 0.1 A,B0.2 ± 0.1 B,C0.4 ± 0.1 A,B0.2 ± 0.1 B,C0.6 ± 0.1 A
Total b82.0 ± 2.1 B96.8 ± 2.7 A97.4 ± 2.3 A97.7 ± 1.2 A96.4 ± 1.5 A95.6 ± 1.8 A
a Results expressed as the mean values ± standard deviation (SD); b Total of nitrogen-containing compounds; - = not detected. CSE1-3: conventional solvent extraction for 2, 4, and 6 h, respectively; UAE1-3: ultrasound-assisted extraction for 0.5, 1 and 2 h, respectively. 1: α-isosparteine; 2: sparteine; 3: β-isosparteine; 4 and 5: unknown; 6: ammodendrine; 7: tetrahydrorhombifoline; 8: 17-oxosparteine; 9: α-isolupanine; 10: hydroxytetrahydrorhombifoline; 11: lupanine; 12: 13α-hydroxylupanine; and 13: docos-13-enamide. Different capital superscript letters across rows indicate significant differences among extractions per compound according to the post-hoc HSD Tukey’s testing (p < 0.05).
Table 2. Mycelial growth inhibition of alkaloidal fractions against Fusarium oxysporum.
IC50 (µg/mL)Confidence Interval (95%)
CSE198.5 E90.1–102.1
CSE291.3 DE84.3–93.7
CSE384.8 D80.0–87.3
UAE186.3 DE84.5–92.8
UAE262.3 C56.9–66.2
UAE333.5 B27.5–35.6
P a17.7 A15.5–20.6
M a11.9 A7.7–14.2
a Positive controls: P = prochloraz; M = Mancozeb. CSE1-3: conventional solvent extraction for 2, 4, and 6 h, respectively; UAE1-3: ultrasound-assisted extraction for 0.5, 1, and 2 h, respectively. Different capital superscript letters across IC50 column indicate significant differences according to the Kruskal–Wallis test with Dunn′s multiple comparisons post-hoc test (p < 0.05).
Publisher’s Note: MDPI stays neutral with regard to jurisdictional claims in published maps and institutional affiliations.

