
HESI-MS/MS Analysis of Phenolic Compounds from Calendula aegyptiaca Fruits Extracts and Evaluation of Their Antioxidant Activities


 and
and
Abstract
:1. Introduction
2. Results and Discussions
2.1. Extraction
2.2. Total Phenolics and Flavonoids Contents of Various Extracts from C. aegyptiaca Fruits
2.3. Phytochemical Constituents

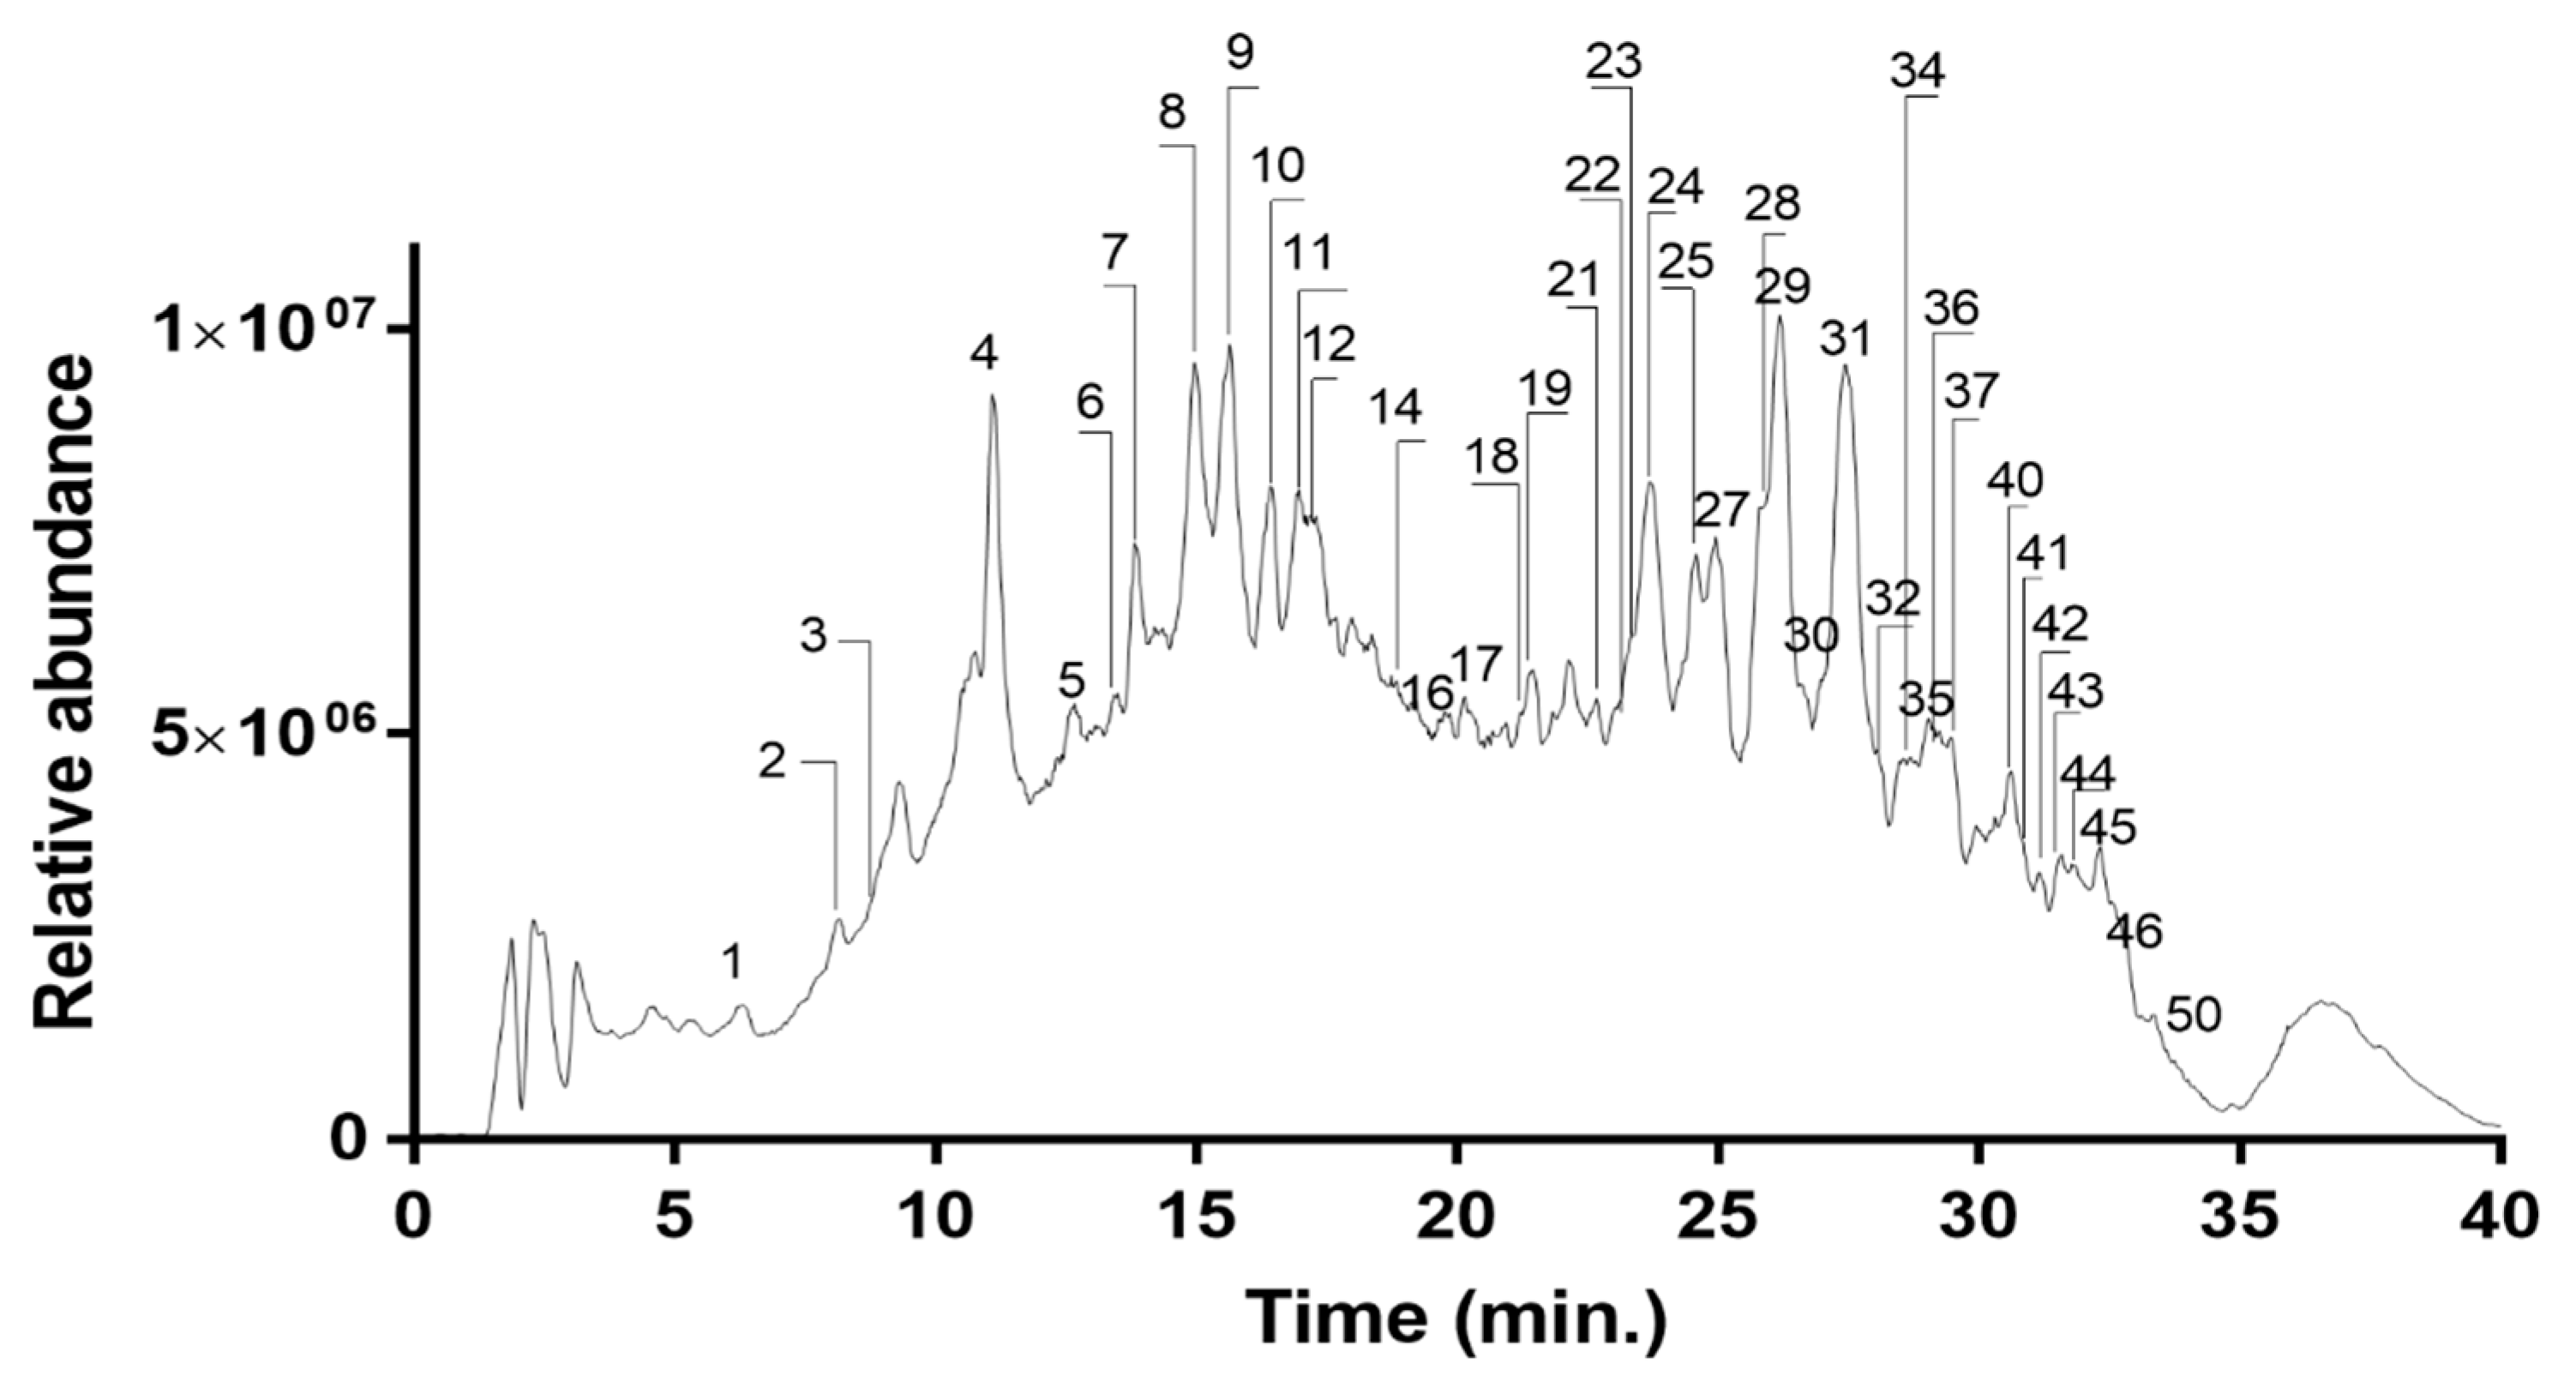
| Compound | TR (min) | Relative Abundance (%) | [M-H]− (m/z) | Molecular Formula | LC/HESI-MS2 (m/z) | Tentative Identification | Reference |
|---|---|---|---|---|---|---|---|
| 1 | 6.31 | 2.32 | 341 | C15H18O9 | 179 (100), 161, 135 | Caffeic acid hexoside | [6] |
| 2 | 8.15 | 1.94 | 315 | C13H16O9 | 153 (100), 109 | Protocatechuic acid-4-O-hexoside | [7] |
| 3 | 8.51 | 0.04 | 191 | C7H12O6 | 173, 171, 127 (100), 109, 93 | Quinic acid | [8] |
| 4 | 11.06 | 0.73 | 353 | C16H18O9 | 191 (100) | Chlorogenic acid | [9,10] |
| 5 | 13.01 | 1.29 | 507 | - | 325 (100), 181 | Unidentified | - |
| 6 | 13.42 | 1.49 | 563 | C26H28O14 | 503, 473, 443 (100), 383, 353 | Apigenin C-hexoside- C-pentoside | [12] |
| 7 | 13.82 | 8.80 | 625 | C27H30O17 | 301 (100), 271, 255 | Quercetin-3,4′-di-O-glucoside | [14] |
| 8 | 14.96 | 17.49 | 609 | C27H30O16 | 343, 301 (100), 300, 271, 255 | Rutin | [10,14] |
| 9 | 15.65 | 7.57 | 463 | C21H20O12 | 301 (100) | Quercetin-3-O-glucoside | [15,16] |
| 10 | 16.42 | 6.15 | 623 | C28H32O16 | 315 (100), 300, 271 | Isorhamnetin-3-O-rutinoside | [18] |
| 11 | 16.96 | 5.13 | 505 | C23H22O13 | 463, 301 (100) | Quercetin-O-acetyl glucoside | [17] |
| 12 | 17.13 | 0.88 | 477 | C22H22O12 | 357, 315, 314 (100) | Isorhamnetin 3-O-glucoside | [19] |
| 13 | 18.38 | 1.27 | 461 | - | 323 (100), 137 | Unidentified | - |
| 14 | 18.74 | 0.08 | 515 | C25H24O12 | 353 (100), 335, 317, 299, 255,191, 173 | 1,4-di-O-caffeoylquinic acid | [11] |
| 15 | 18.81 | 0.14 | 465 | - | 297 (100), 183 | Unidentified | - |
| 16 | 19.38 | 0.07 | 137 | C7H6O3 | 93 (100) | p-Hydroxybenzoic acid | [22] |
| 17 | 19.93 | 0.17 | 491 | C22H20O13 | 459, 447, 323, 315 (100) | Isorhamnetin-3-O-glucuronide | [21,22] |
| 18 | 20.88 | 0.14 | 563 | C26H28O14 | 401 (100) | Apigenin-O-hexosylpentosyl | [13] |
| 19 | 21.11 | 0.05 | 301 | C15H10O7 | 179 (100), 151 | Quercetin | [8] |
| 20 | 21.44 | 3.35 | 1165 | - | 1146, 1002 (100), 657, 463 | Unidentified | - |
| 21 | 22.42 | 0.14 | 971 | C47H72O21 | 851, 809 (100), 629 | Betavulgaroside VI | [23] |
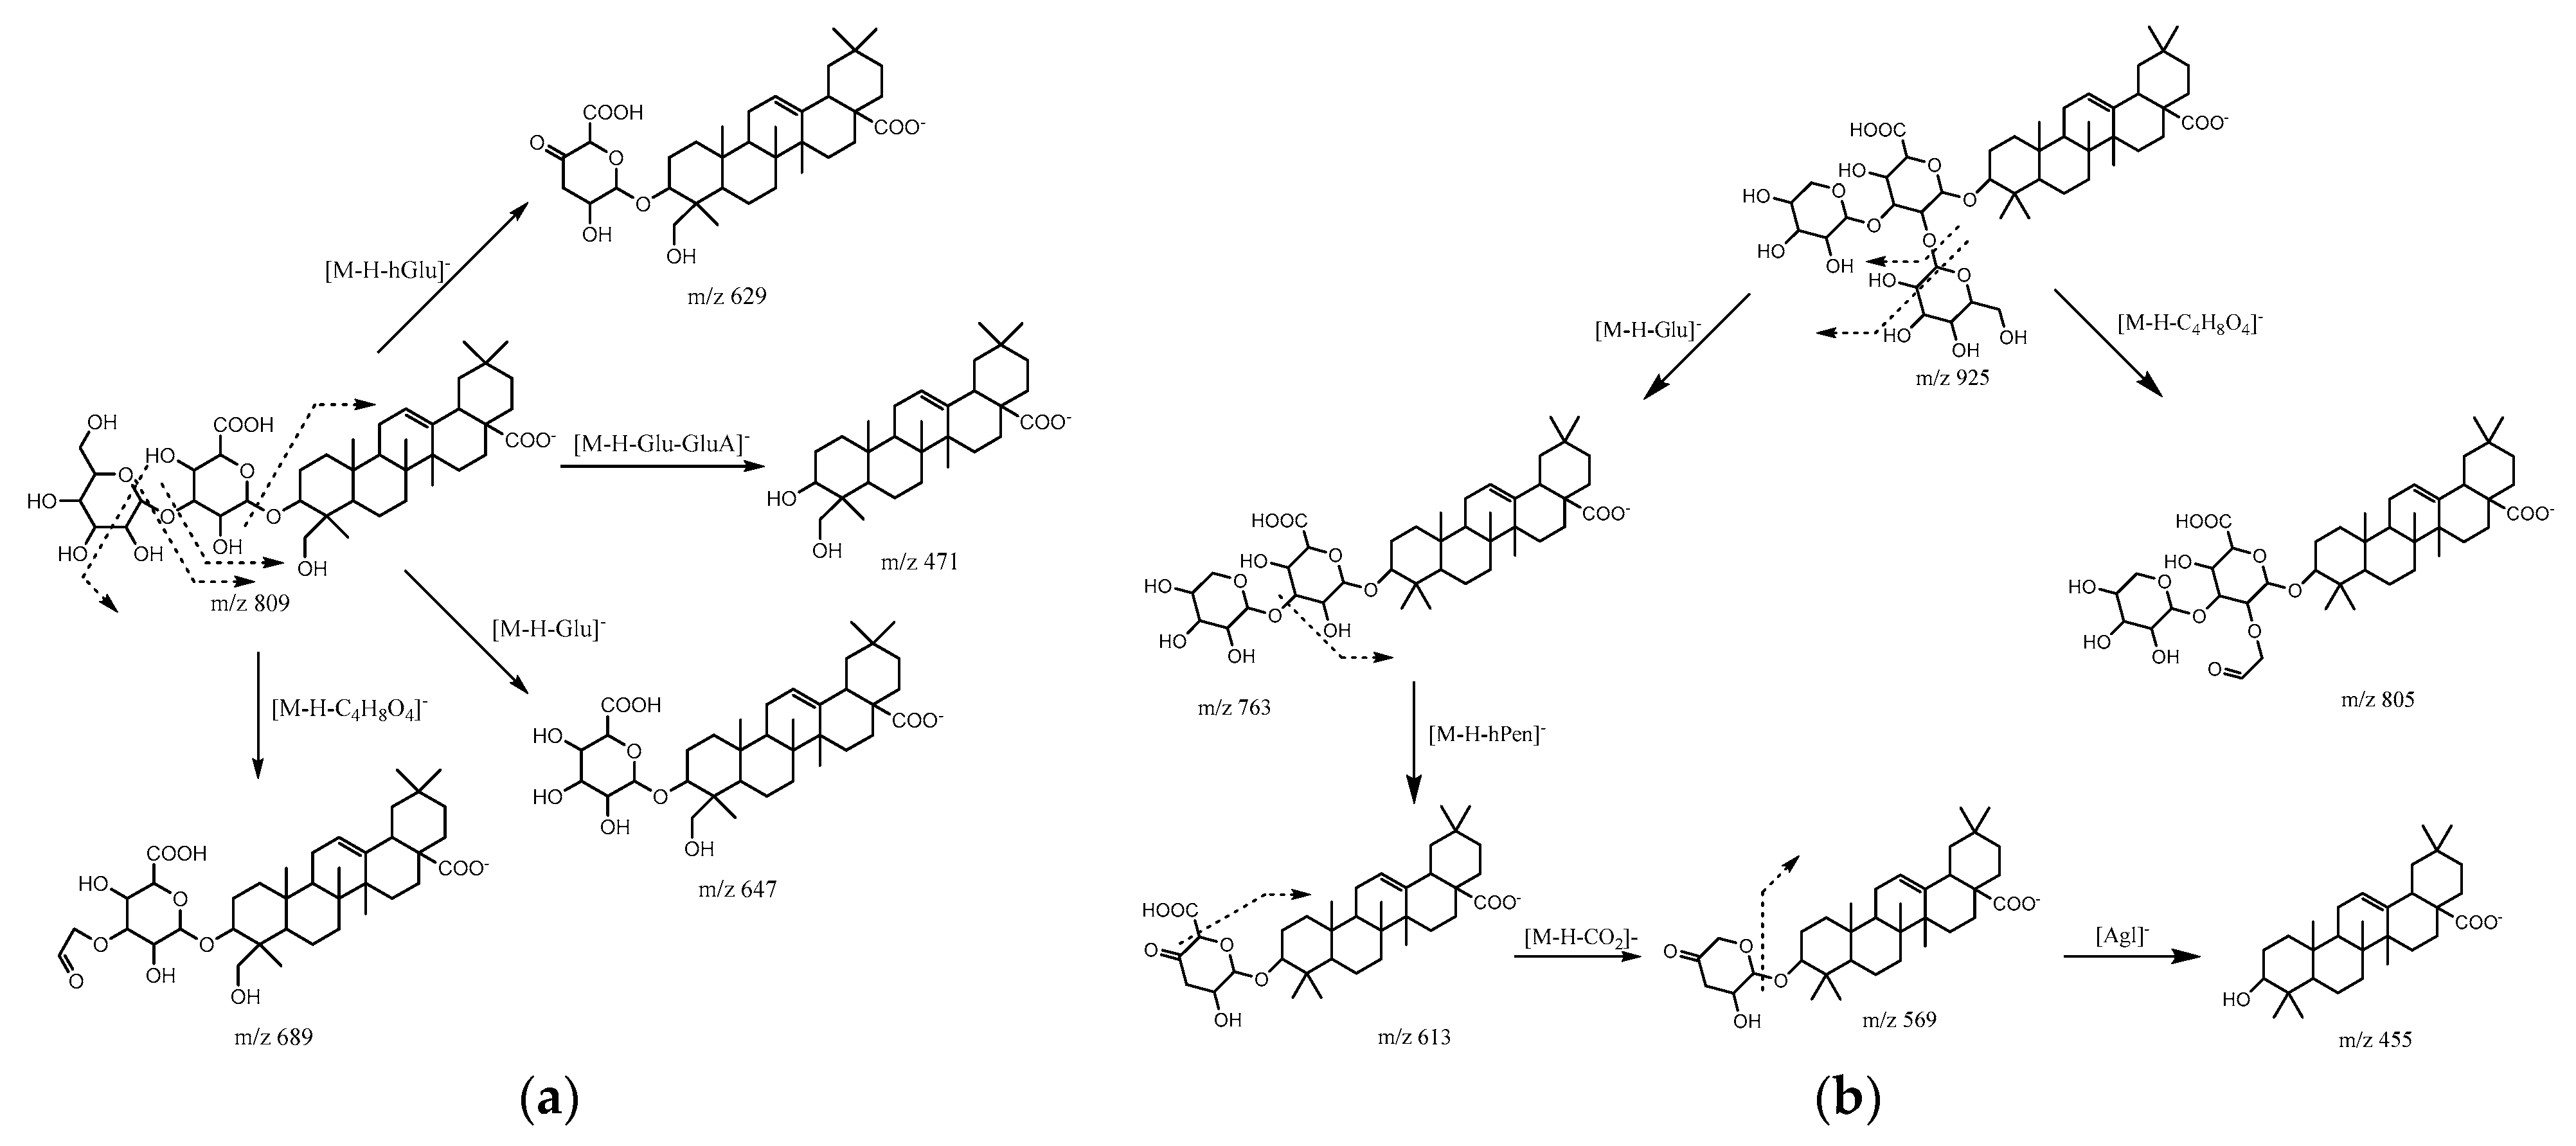
| 22 | 22.74 | 0.20 | 809 | C42H66O15 | 791, 689, 647 (100), 629,471 | Gluco-glucuronic acid hedragenin | [24] |
| 23 | 23.35 | 2.00 | 327 | C18H32O5 | 291, 229 (100), 211, 209, 171 | Oxo-dihydroxy-octadecenoic acid | [26,27] |
| 24 | 23.71 | 13.02 | 1149 | - | 1131,1048,970 (100), 839,444 | Unidentified | - |
| 25 | 24.41 | 0.34 | 955 | C48H76O19 | 793 (100), 613, 455 | Ginsenoside Ro | [30] |
| 26 | 24.66 | 2.9 | 987 | - | 925,825 (100), 791, 543 | Unidentified | - |
| 27 | 25.02 | 0.19 | 925 | C47H73O18 | 805, 763 (100), 613 | Hexose-pentose uronic acid oleanolic acid | [23,31] |
| 28 | 25.85 | 5.26 | 1027 | - | 1009, 983 (100), 966 | Unidentified | - |
| 29 | 26.15 | 0.78 | 793 | C42H66O14 | 673, 631 (100), 613, 569, 455 | Calenduloside G | [13] |
| 30 | 26.80 | 0.25 | 695 | - | 533 (10), 371 | Unidentified | - |
| 31 | 27.46 | 5.33 | 937 | - | 793 (100) | Unidentified | - |
| 32 | 28.01 | 0.94 | 647 | C36H56O10 | 629, 571, 471 (100) | Glucuronic acid hedragenin | [25] |
| 33 | 28.30 | 0.69 | 987 | - | 969, 841, 824 (100), 816, 614 | Unidentified | - |
| 34 | 28.69 | 0.25 | 835 | - | 793, 775, 673, 613, 569 (100), 455 | Calenduloside G derivative | - |
| 35 | 28.95 | 0.45 | 777 | C42H68O14 | 633 (100), 615, 471 | Hedragenin dihexoside | - |
| 36 | 29.21 | 0.34 | 791 | C42H64O14 | 689, 647 (100), 629 | Dehydrated gluco-glucuronic acid Hedragenin | - |
| 37 | 29.5 | 0.12 | 793 | C42H65O14 | 775, 731, 613 (100), 455 | Soyasaponin βe’ | [33] |
| 38 | 30.01 | 0.39 | 793 | - | 613, 551, 483 (100), 455 | Unidentified | - |
| 39 | 30.34 | 0.95 | 763 | C41H63O13 | 719, 701, 613 (100), 523, 455 | Soyasaponin βg’ | [33] |
| 40 | 30.60 | 1.74 | 675 | - | 415, 937 (100), 305, 235 | Unidentified | - |
| 41 | 30.81 | 0.41 | 313 | C18H34O4 | 295, 277, 201 (100), 171 | Dihydroxyoctadecenoic acid | [19] |
| 42 | 31.30 | 0.17 | 617 | C36H58O8 | 599, 571, 497, 455 (100) | Oleanolic acid 28-O-β-D-glucopyranoside | [32] |
| 43 | 31.62 | 0.52 | 631 | C36H56O9 | 613, 455(100) | 3-O-β-D glucuruopyranosyl of oleanolic acid | [24] |
| 44 | 32.02 | 0.28 | 761 | C42H66O12 | 617, 599 (100), 571, 497, 455 | Oleanolic acid dihexoside | - |
| 45 | 32.27 | 0.80 | 775 | C42H64O13 | 631 (100), 613, 455 | Gluco- glucuruopyranosyl of oleanolic acid | - |
| 46 | 33.05 | 0.03 | 295 | C18H32O3 | 277 (100), 251, 171 | 9-Hydroxy-10,12-actadecadienoic acid | [29] |
| 47 | 33.12 | 0.03 | 527 | - | 509, 277 (100), 249 | Unidentified | - |
| 48 | 33.38 | 0.12 | 564 | - | 504 (100) | Unidentified | - |
| 49 | 33.50 | 0.09 | 504 | - | 279 (100) | Unidentified | - |
| 50 | 34.17 | 0.01 | 279 | C18H32O2 | 261 (100), 235, 171 | Linoleic acid | [28] |
2.4. Antioxidant Activity of Fruit Extracts In Vitro
2.5. Correlations
3. Materials and Methods
3.1. Plant Material
3.2. Extraction
3.3. Determination of Phenolic Content
3.4. Determination of Flavonoid Content
3.5. Antioxidant Activity
3.5.1. Free Radical Scavenging Activity
3.5.2. Total Antioxidant Capacity
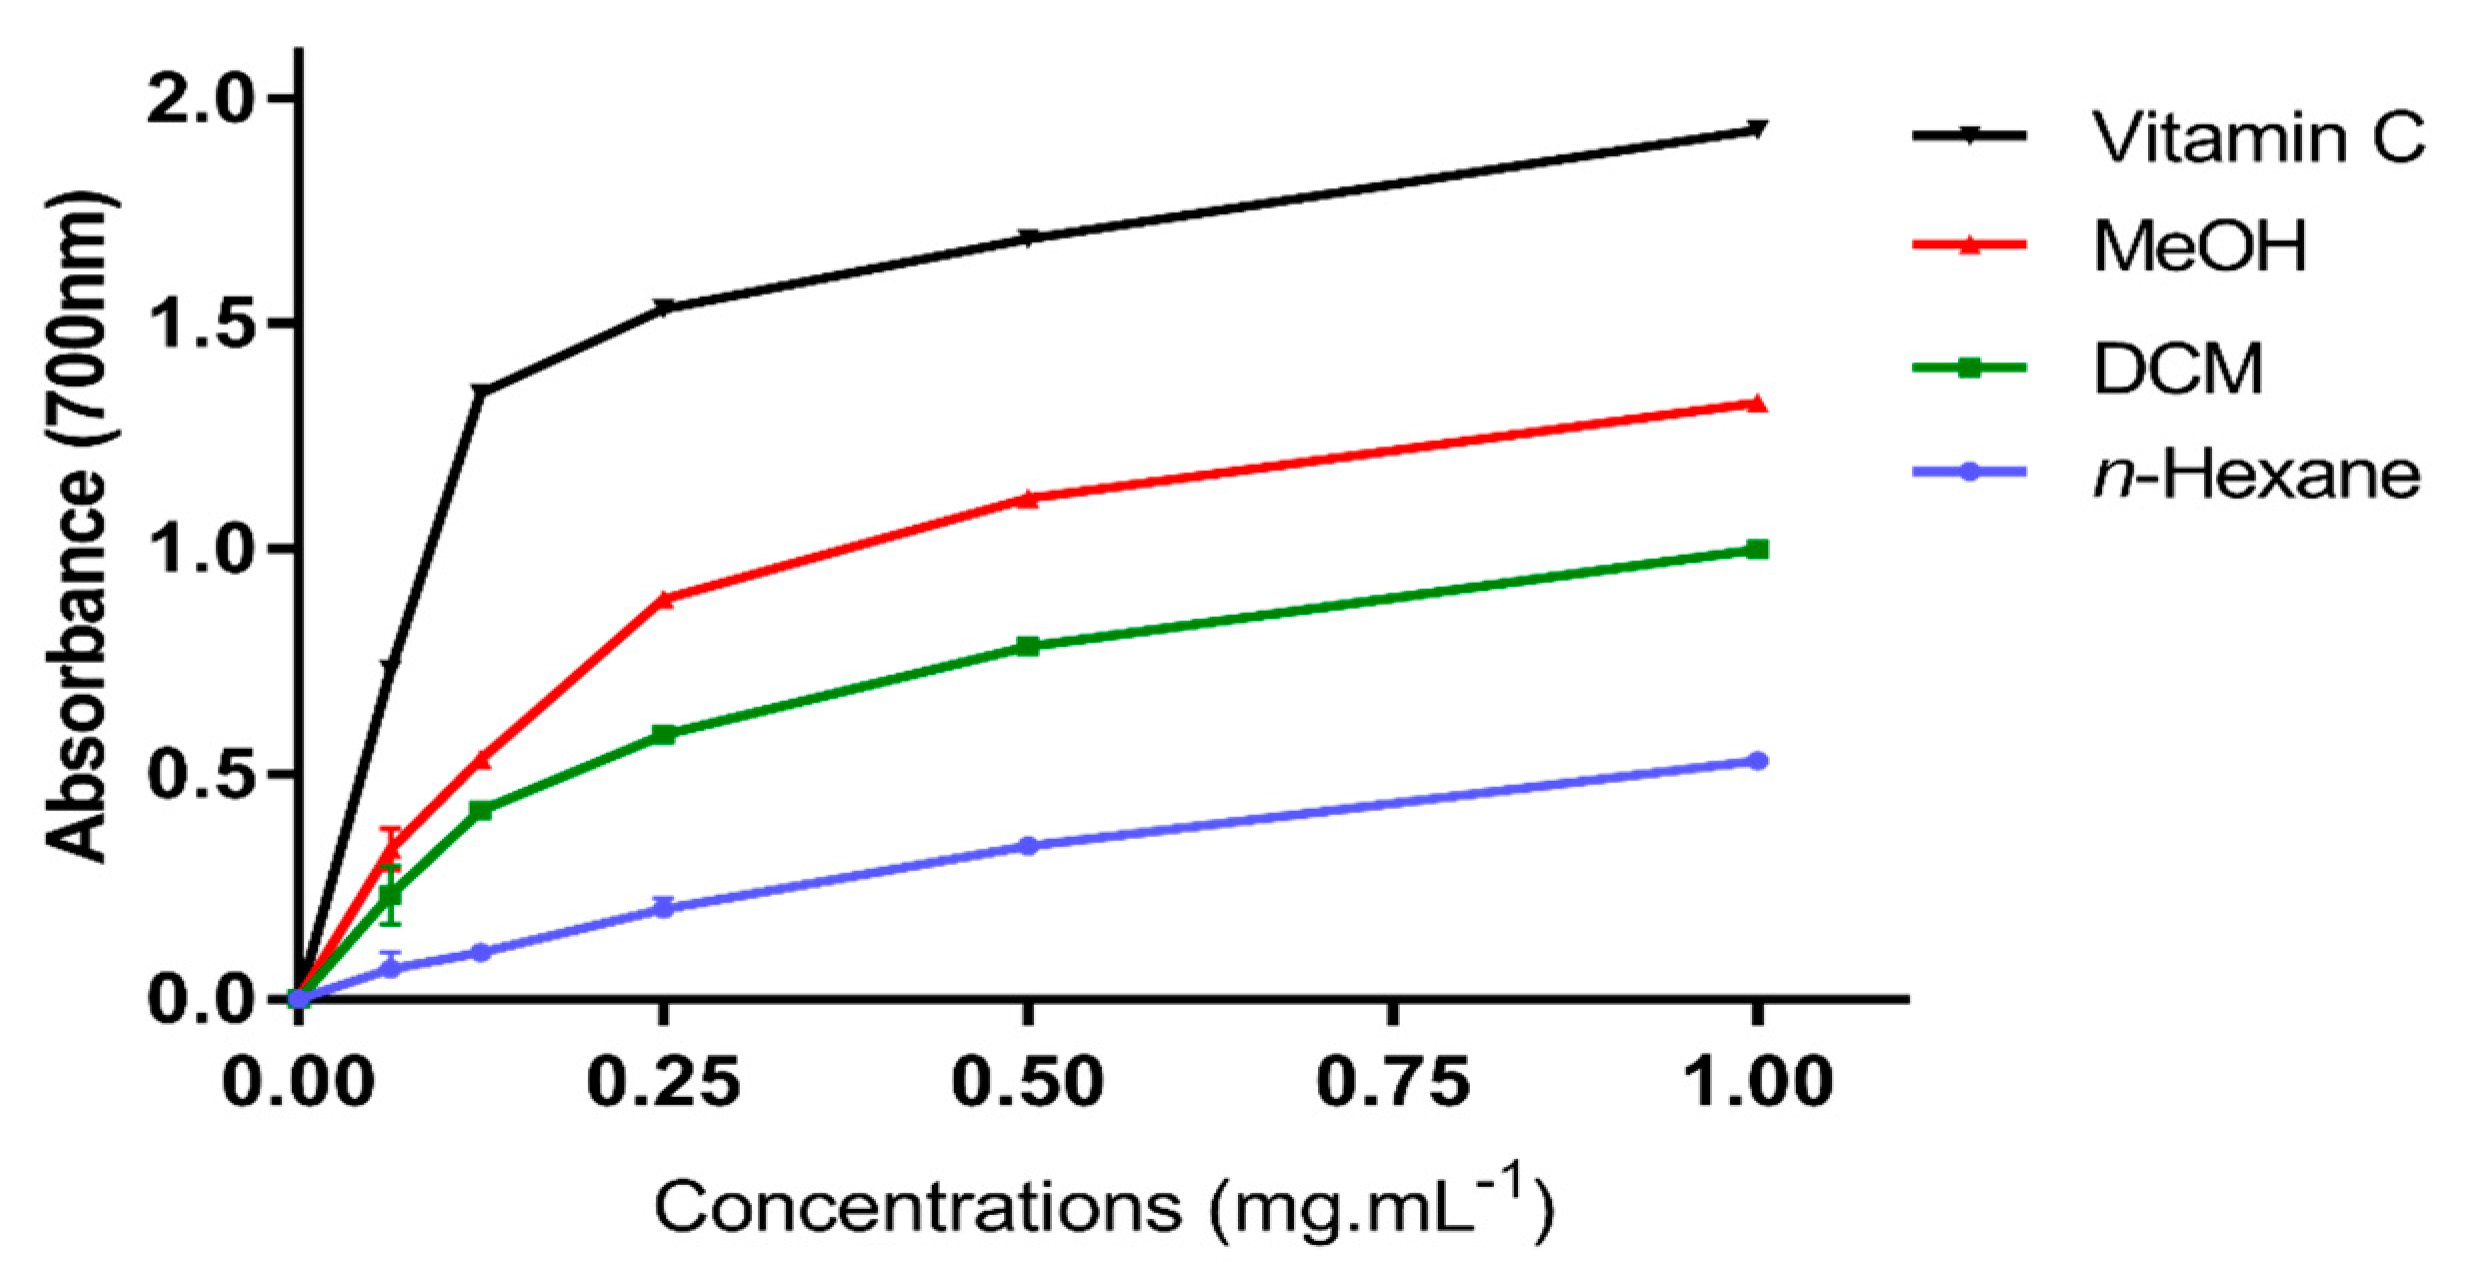
3.5.3. Reducing Power Assay
3.6. LC-HESI-MS
3.7. Statistical Analysis
4. Conclusions
Author Contributions
Funding
Institutional Review Board Statement
Informed Consent Statement
Data Availability Statement
Acknowledgments
Conflicts of Interest
Sample Availability
References
- Shukla, S.; Mehta, A. Anticancer potential of medicinal plants and their phytochemicals: A review. Braz. J. Bot. 2015, 38, 199–210. [Google Scholar] [CrossRef]
- Rolnik, A.; Olas, B. The plants of the Asteraceae family as agents in the protection of human health. Int. J. Mol. Sci. 2021, 22, 3009. [Google Scholar] [CrossRef] [PubMed]
- Jan, N.; Andrabi, K.I.; John, R. Calendula officinalis—An important medicinal plant with potential biological properties. Proc. Indian Natl. Sci. Acad. 2017, 83, 769–787. [Google Scholar] [CrossRef]
- Bouzayani, B.; Koubaa, I.; Frikha, D.; Samet, S.; Ben Younes, A.; Chawech, R.; Maalej, S.; Allouche, N.; Mezghani Jarraya, R. Spectrometric analysis, phytoconstituents isolation and evaluation of in vitro antioxidant and antimicrobial activities of Tunisian Cistanche violacea (Desf). Chem. Pap. 2022, 1–20. [Google Scholar] [CrossRef]
- Ercetin, T.; Senol, F.S.; Orhan, I.E.; Toker, G. Comparative assessment of antioxidant and cholinesterase inhibitory properties of the marigold extracts from Calendula arvensis L. and Calendula officinalis L. Ind. Crops Prod. 2012, 36, 203–208. [Google Scholar] [CrossRef]
- Hossain, M.B.; Rai, D.K.; Brunton, N.P.; Martin-Diana, A.B.; Barry-Ryan, C. Characterization of phenolic composition in Lamiaceae spices by LC-ESI-MS/MS. J. Agric. Food Chem. 2010, 58, 10576–10581. [Google Scholar] [CrossRef] [PubMed]
- Salomon, L.; Lorenz, P.; Ehrmann, B.; Spring, O.; Stintzing, F.C.; Kammerer, D.R. Impact of environmental conditions on growth and the phenolic profile of Achillea atrata L. Processes 2021, 9, 853. [Google Scholar] [CrossRef]
- Fathoni, A.; Saepudin, E.; Cahyana, A.H.; Rahayu, D.U.C.; Haib, J. Identification of nonvolatile compounds in clove (Syzygium aromaticum) from Manado. AIP Conf. Proc. 2017, 1862, 030079. [Google Scholar] [CrossRef] [Green Version]
- Simirgiotis, M.J.; Benites, J.; Areche, C.; Sepúlveda, B. Antioxidant capacities and analysis of phenolic compounds in three endemic Nolana species by HPLC-PDA-ESI-MS. Molecules 2015, 20, 11490–11507. [Google Scholar] [CrossRef] [Green Version]
- Sonmezdag, A.S.; Kelebek, H.; Selli, S. Characterization of aroma-active and phenolic profiles of wild thyme (Thymus serpyllum) by GC-MS-Olfactometry and LC-ESI-MS/MS. J. Food Sci. Technol. 2016, 53, 1957–1965. [Google Scholar] [CrossRef] [Green Version]
- Clifford, M.N.; Knight, S.; Kuhnert, N. Discriminating between the six isomers of dicaffeoylquinic acid by LC-MS n. J. Agric. Food Chem. 2005, 53, 3821–3832. [Google Scholar] [CrossRef] [PubMed]
- Farooq, M.U.; Mumtaz, M.W.; Mukhtar, H.; Rashid, U.; Akhtar, M.T.; Raza, S.A.; Nadeem, M. UHPLC-QTOF-MS/MS based phytochemical characterization and anti-hyperglycemic prospective of hydro-ethanolic leaf extract of Butea monosperma. Sci. Rep. 2020, 10, 3530. [Google Scholar] [CrossRef] [PubMed] [Green Version]
- Faustino, M.V.; Pinto, D.C.; Gonçalves, M.J.; Salgueiro, L.; Silveira, P.; Silva, A.M. Calendula L. species polyphenolic profile and in vitro antifungal activity. J. Funct. Foods 2018, 45, 254–267. [Google Scholar] [CrossRef]
- Kumar, S.; Singh, A.; Kumar, B. Identification and characterization of phenolics and terpenoids from ethanolic extracts of Phyllanthus species by HPLC-ESI-QTOF-MS/MS. J. Pharm. Anal. 2017, 7, 214–222. [Google Scholar] [CrossRef] [PubMed]
- Silva, S.; Matias, A.A.; Nunes, A.; Duarte, C.; Coelhe, A.V.; Bronze, M.R. Identification of flavonol glycosides in winemaking by-products by HPLC with different detectors and hyphenated with mass spectrometry. Ciênc. Téc. Vitiviníc. 2005, 20, 17–33. [Google Scholar]
- Affes, S.; Ben Younes, A.; Frikha, D.; Allouche, N.; Treilhou, M.; Tene, N.; Mezghani-Jarraya, R. ESI-MS/MS analysis of phenolic compounds from Aeonium arboreum leaf extracts and evaluation of their antioxidant and antimicrobial activities. Molecules 2021, 26, 4338. [Google Scholar] [CrossRef]
- Villalva, M.; Santoyo, S.; Salas-Pérez, L.; de la Nieves Siles-Sánchez, M.; Rodríguez García-Risco, M.; Fornari, T.; Reglero, G.; Jaime, L. Sustainable extraction techniques for obtaining antioxidant and anti-inflammatory compounds from the Lamiaceae and Asteraceae species. Foods 2021, 10, 2067. [Google Scholar] [CrossRef]
- Li, Z.H.; Guo, H.; Xu, W.B.; Ge, J.; Li, X.; Alimu, M.; He, D.J. Rapid identification of flavonoid constituents directly from PTP1B inhibitive extract of raspberry (Rubus idaeus L.) leaves by HPLC–ESI–QTOF–MS-MS. J. Chromatogr. Sci. 2016, 54, 805–810. [Google Scholar] [CrossRef] [PubMed] [Green Version]
- Kang, J.; Price, W.E.; Ashton, J.; Tapsell, L.C.; Johnson, S. Identification and characterization of phenolic compounds in hydromethanolic extracts of Sorghum wholegrains by LC-ESI-MSn. Food Chem. 2016, 211, 215–226. [Google Scholar] [CrossRef] [PubMed] [Green Version]
- Parejo, I.; Jauregui, O.; Sánchez-Rabaneda, F.; Viladomat, F.; Bastida, J.; Codina, C. Separation and characterization of phenolic compounds in fennel (Foeniculum vulgare) using liquid chromatography−negative electrospray ionization tandem mass spectrometry. J. Agric. Food Chem. 2004, 52, 3679–3687. [Google Scholar] [CrossRef] [PubMed]
- Chen, S.; Fang, L.; Xi, H.; Guan, L.; Fang, J.; Liu, Y.; Wu, B.; Li, S. Simultaneous qualitative assessment and quantitative analysis of flavonoids in various tissues of lotus (Nelumbo nucifera) using high performance liquid chromatography coupled with triple quad mass spectrometry. Anal. Chim. Acta 2012, 724, 127–135. [Google Scholar] [CrossRef] [PubMed]
- Khallouki, F.; Ricarte, I.; Breuer, A.; Owen, R.W. Characterization of phenolic compounds in mature Moroccan Medjool date palm fruits (Phoenix dactylifera) by HPLC-DAD-ESI-MS. J. Food Compos. Anal. 2018, 70, 63–71. [Google Scholar] [CrossRef]
- Mikołajczyk-Bator, K.; Błaszczyk, A.; Czyżniejewski, M.; Kachlicki, P. Characterisation and identification of triterpene saponins in the roots of red beets (Beta vulgaris L.) using two HPLC–MS systems. Food Chem. 2016, 192, 979–990. [Google Scholar] [CrossRef] [PubMed]
- Mroczek, A.; Kapusta, I.; Janda, B.; Janiszowska, W. Triterpene saponin content in the roots of red beet (Beta vulgaris L.) cultivars. J. Agric. Food Chem. 2012, 60, 12397–12402. [Google Scholar] [CrossRef] [PubMed]
- Pollier, J.; Morreel, K.; Geelen, D.; Goossens, A. Metabolite profiling of triterpene saponins in Medicago truncatula hairy roots by liquid chromatography Fourier transform ion cyclotron resonance mass spectrometry. J. Nat. Prod. 2011, 74, 1462–1476. [Google Scholar] [CrossRef] [PubMed] [Green Version]
- Llorent-Martínez, E.J.; Spínola, V.; Gouveia, S.; Castilho, P.C. HPLC-ESI-MSn characterization of phenolic compounds, terpenoid saponins, and other minor compounds in Bituminaria bituminosa. Ind. Crops Prod. 2015, 69, 80–90. [Google Scholar] [CrossRef]
- Püssa, T.; Raudsepp, P.; Toomik, P.; Pällin, R.; Mäeorg, U.; Kuusik, S.; Soidla, R.; Rei, M. A study of oxidation products of free polyunsaturated fatty acids in mechanically deboned meat. J. Food Compos. Anal. 2009, 22, 307–314. [Google Scholar] [CrossRef]
- Zhou, Y.; Wu, Z.; Li, C.; Wang, N.; Zhang, X.; Chen, H.; Xiao, S. Coupling neutral desorption sampling to dielectric barrier discharge ionization mass spectrometry for direct oil analysis. Anal. Methods 2014, 6, 1538–1544. [Google Scholar] [CrossRef]
- Lee, S.H.; Williams, M.V.; DuBois, R.N.; Blair, I.A. Targeted lipidomics using electron capture atmospheric pressure chemical ionization mass spectrometry. Rapid Commun. Mass Spectrom. 2003, 17, 2168–2176. [Google Scholar] [CrossRef] [PubMed]
- Jiang, P.; Dou, S.; Liu, L.; Zhang, W.; Chen, Z.; Xu, R.; Ding, J.; Liu, R. Identification of multiple constituents in the TCM-formula Shexiang Baoxin pill by LC coupled with DAD-ESI-MS-MS. Chromatographia 2009, 70, 133–142. [Google Scholar] [CrossRef]
- Ridout, C.L.; Price, K.R.; Parkin, G.; Dijoux, M.G.; Lavaud, C. Saponins from sugar beet and the floc problem. J. Agric. Food Chem. 1994, 42, 279–282. [Google Scholar] [CrossRef]
- Kumar, R.; Joshi, G.; Kler, H.; Kalra, S.; Kaur, M.; Arya, R. Toward an understanding of structural insights of xanthine and aldehyde oxidases: An overview of their inhibitors and role in various diseases. Med. Res. Rev. 2018, 38, 1073–1125. [Google Scholar] [CrossRef]
- Nascimento, Y.M.; Abreu, L.S.; Lima, R.L.; Costa, V.C.O.; Melo, J.I.M.D.; Braz-Filho, R.; Sobral Silva, M.; Tavares, J.F. Rapid characterization of triterpene saponins from Zornia brasiliensis by HPLC-ESI-MS/MS. Molecules 2019, 24, 2519. [Google Scholar] [CrossRef] [PubMed] [Green Version]
- Ismahene, S.; Ratiba, S.; Miguel, C.M.D.; Nuria, C. Phytochemical composition and evaluation of the antioxidant activity of the ethanolic extract of Calendula suffruticosa subsp. suffruticosa Vahl. Pharmcogn. J. 2018, 10, 64–70. [Google Scholar] [CrossRef] [Green Version]
- Mseddi, K.; Al-Shammari, A.; Sharif, H.; Chaieb, M. Plant diversity and relationships with environmental factors after rangeland exclosure in arid Tunisia. Turk. J. Bot. 2016, 40, 287–297. [Google Scholar] [CrossRef]
- Akrout, A.; Conzalez, A.L.; Jani, E.J.; Madrid, C.P. Antioxidant and antitumor activities of Artemisia campestris and Thymelaea hirsuta from southern Tunisia. Food Chem. Toxicol. 2011, 49, 342–347. [Google Scholar] [CrossRef] [PubMed]
- Heimler, D.; Isolani, L.; Vignolani, P.; Romani, A. Polyphenol content and antiradical activity of Cichorium intybus L. from biodynamic and conventional farming. Food Chem. 2009, 114, 765–770. [Google Scholar] [CrossRef]
- Chen, Y.; Wang, M.; Rosen, R.T.; Ho, C.T. 2, 2-Diphenyl-1-picrylhydrazyl radical-scavenging active components from Polygonum multiflorum thunb. J. Agric. Food Chem. 1999, 47, 2226–2228. [Google Scholar] [CrossRef] [PubMed]
- Prieto, P.; Pineda, M.; Aguilar, M. Spectrophotometric quantitation of antioxidant capacity through the formation of a phosphomolybdenum complex. Anal. Biochem. 1999, 269, 337–341. [Google Scholar] [CrossRef]
- Barros, L.; Baptista, P.; Ferreira, I.C.F.R. Effect of Lactarius piperatus fruiting body maturity stage on antioxidant activity measured by several biochemical assays. Food Chem. Toxicol. 2007, 45, 1731–1737. [Google Scholar] [CrossRef] [PubMed] [Green Version]


| Extracts | Yields (%) |
|---|---|
| n-Hexane | 0.93 |
| DCM | 0.47 |
| MeOH | 9.67 |
| Extracts | TPC (mg GAE/g DE) | TFC (mg QE/g DE) |
|---|---|---|
| n-Hexane | 93.37 ± 2.10 c | 66.46 ± 9.52 c |
| DCM | 190.16 ± 3.21 b | 105.18 ± 4.69 b |
| MeOH | 275.38 ± 0.39 a | 204.57 ± 4.10 a |
| Extracts | TAC (mg GAE/g DE) | DPPH IC50 (mg·mL−1) |
|---|---|---|
| n-Hexane | 123.771 ± 2.011 c | 0.054 ± 0.010 c |
| DCM | 181.414 ± 3.044 b | 0.050 ± 0.002 b |
| MeOH | 253.394 ± 1.198 a | 0.041 ± 0.001 a |
| Vit C | - | 0.033 ± 0.001 a |
| TPC | TFC | DPPH | FRAP | TAC | |
|---|---|---|---|---|---|
| TPC | 1 | - | - | - | - |
| TFC | 0.905 | 1 | - | - | - |
| DPPH | 0.884 | 0.859 | 1 | - | - |
| FRAP | 0.994 | 0.861 | 0.866 | 1 | - |
| TAC | 0.987 | 0.941 | 0.921 | 0.969 | 1 |
Publisher’s Note: MDPI stays neutral with regard to jurisdictional claims in published maps and institutional affiliations. |
© 2022 by the authors. Licensee MDPI, Basel, Switzerland. This article is an open access article distributed under the terms and conditions of the Creative Commons Attribution (CC BY) license (https://creativecommons.org/licenses/by/4.0/).
Share and Cite
Grati, W.; Samet, S.; Bouzayani, B.; Ayachi, A.; Treilhou, M.; Téné, N.; Mezghani-Jarraya, R. HESI-MS/MS Analysis of Phenolic Compounds from Calendula aegyptiaca Fruits Extracts and Evaluation of Their Antioxidant Activities. Molecules 2022, 27, 2314. https://doi.org/10.3390/molecules27072314
Grati W, Samet S, Bouzayani B, Ayachi A, Treilhou M, Téné N, Mezghani-Jarraya R. HESI-MS/MS Analysis of Phenolic Compounds from Calendula aegyptiaca Fruits Extracts and Evaluation of Their Antioxidant Activities. Molecules. 2022; 27(7):2314. https://doi.org/10.3390/molecules27072314
Chicago/Turabian StyleGrati, Wafa, Sonda Samet, Bouthaina Bouzayani, Amani Ayachi, Michel Treilhou, Nathan Téné, and Raoudha Mezghani-Jarraya. 2022. "HESI-MS/MS Analysis of Phenolic Compounds from Calendula aegyptiaca Fruits Extracts and Evaluation of Their Antioxidant Activities" Molecules 27, no. 7: 2314. https://doi.org/10.3390/molecules27072314