
Chemotaxonomic Classification of Peucedanum japonicum and Its Chemical Correlation with Peucedanum praeruptorum, Angelica decursiva, and Saposhnikovia divaricata by Liquid Chromatography Combined with Chemometrics


Abstract
: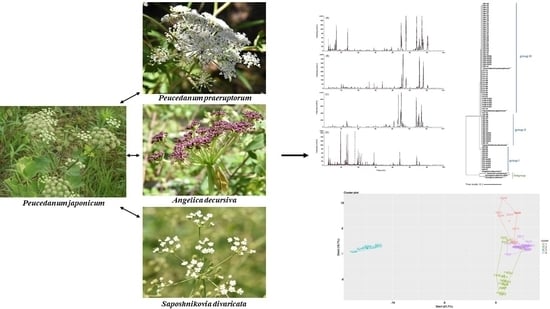
1. Introduction
2. Results and Discussion
2.1. Internal Transcribed Spacer Regions of Nuclear Ribosomal Cistron
2.2. Chloroplast Genome-Based DNA Barcode Sequence Analysis
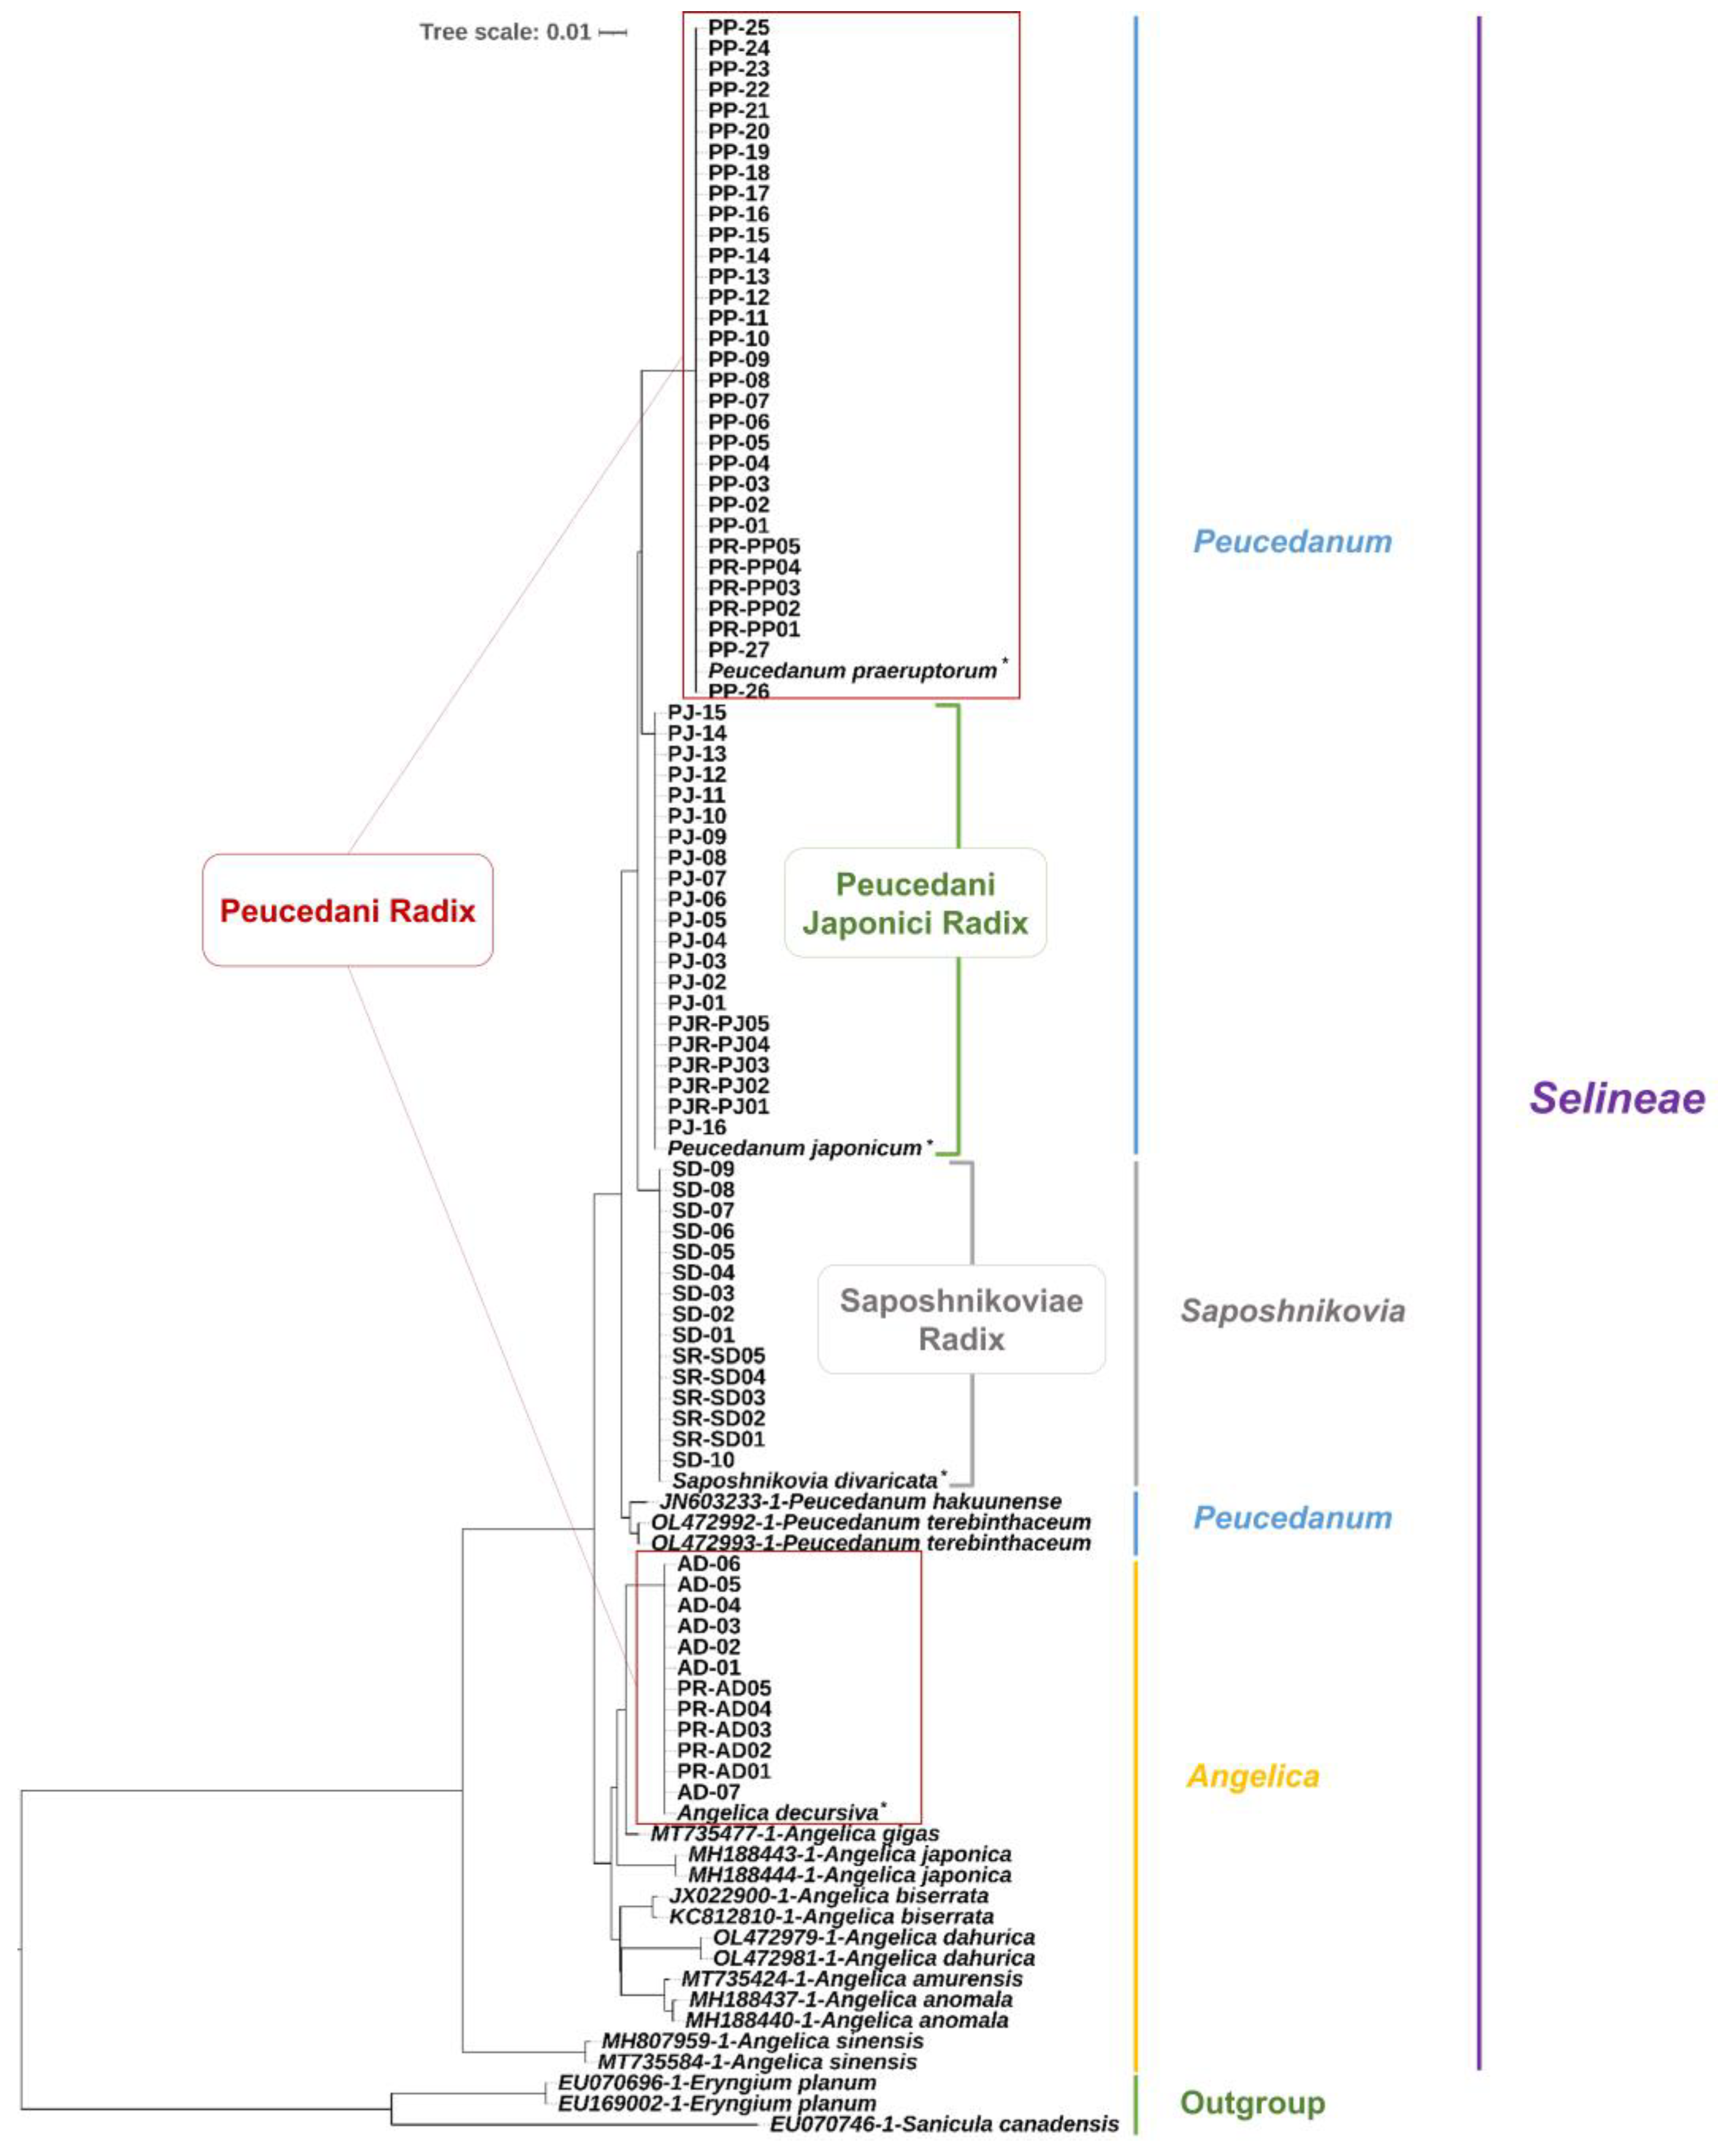
2.3. Phylogenetic Analysis
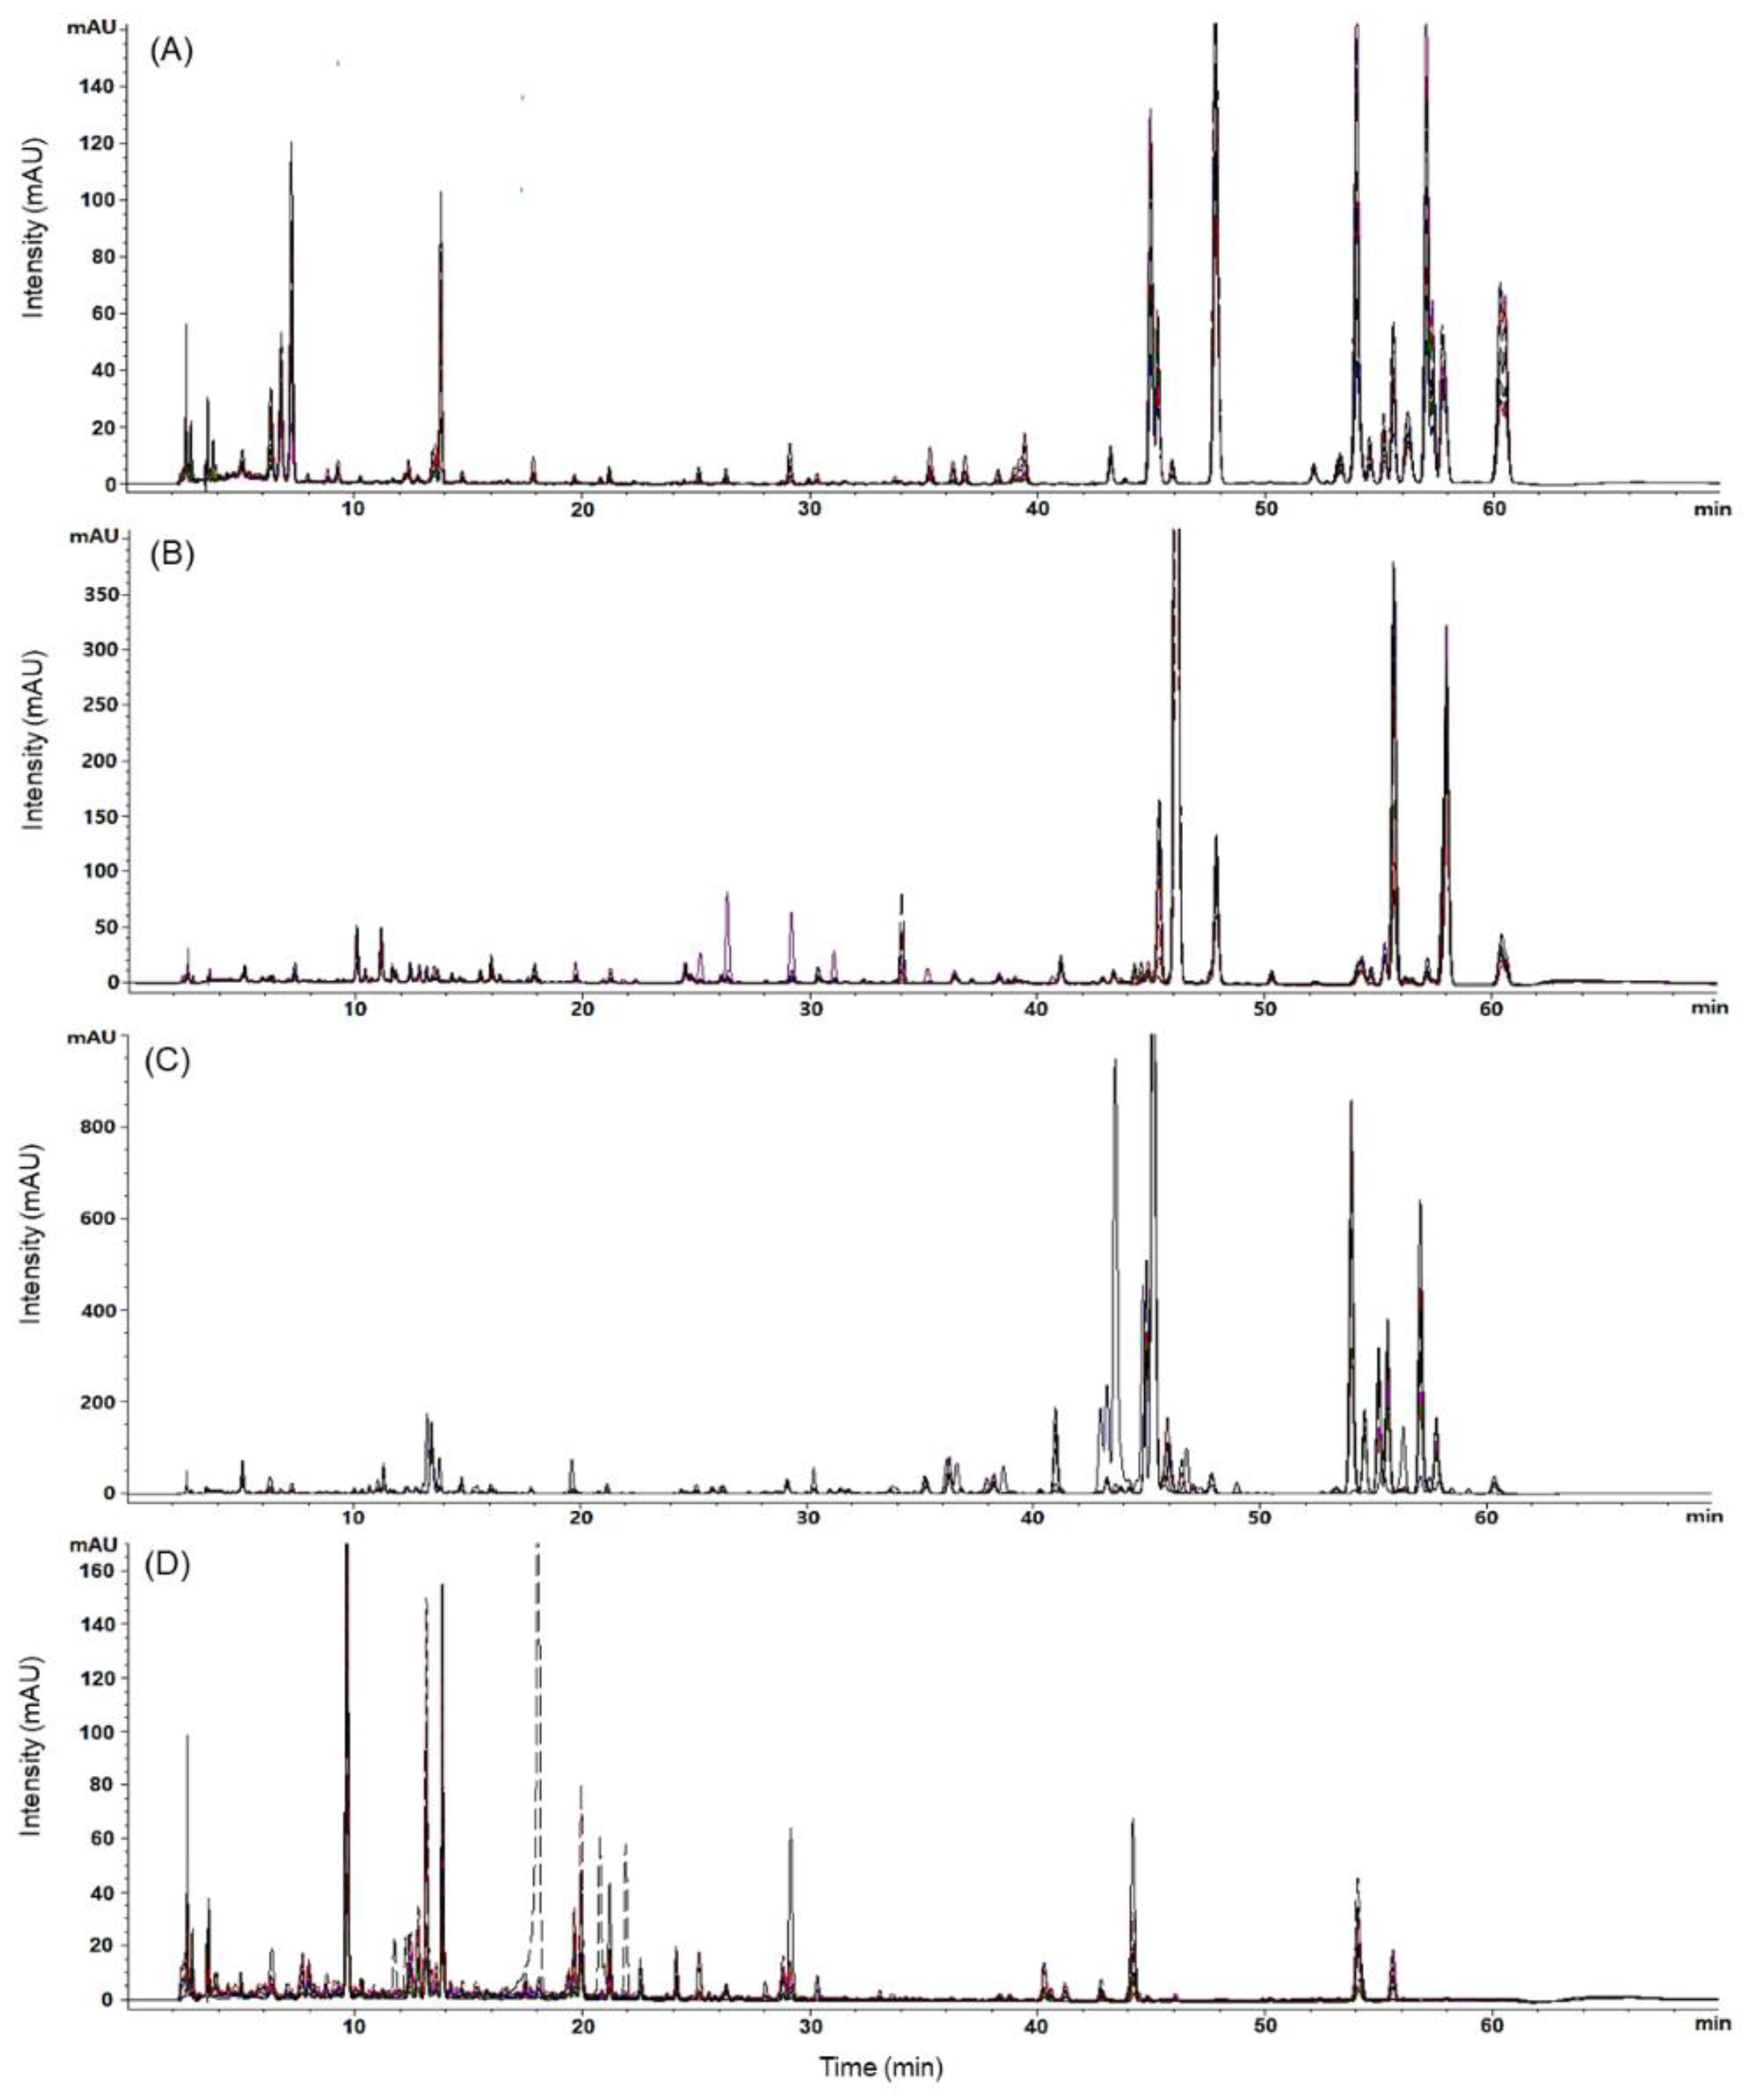
2.4. Chromatographic Profiling of PJ, PP, AD, and SD Samples
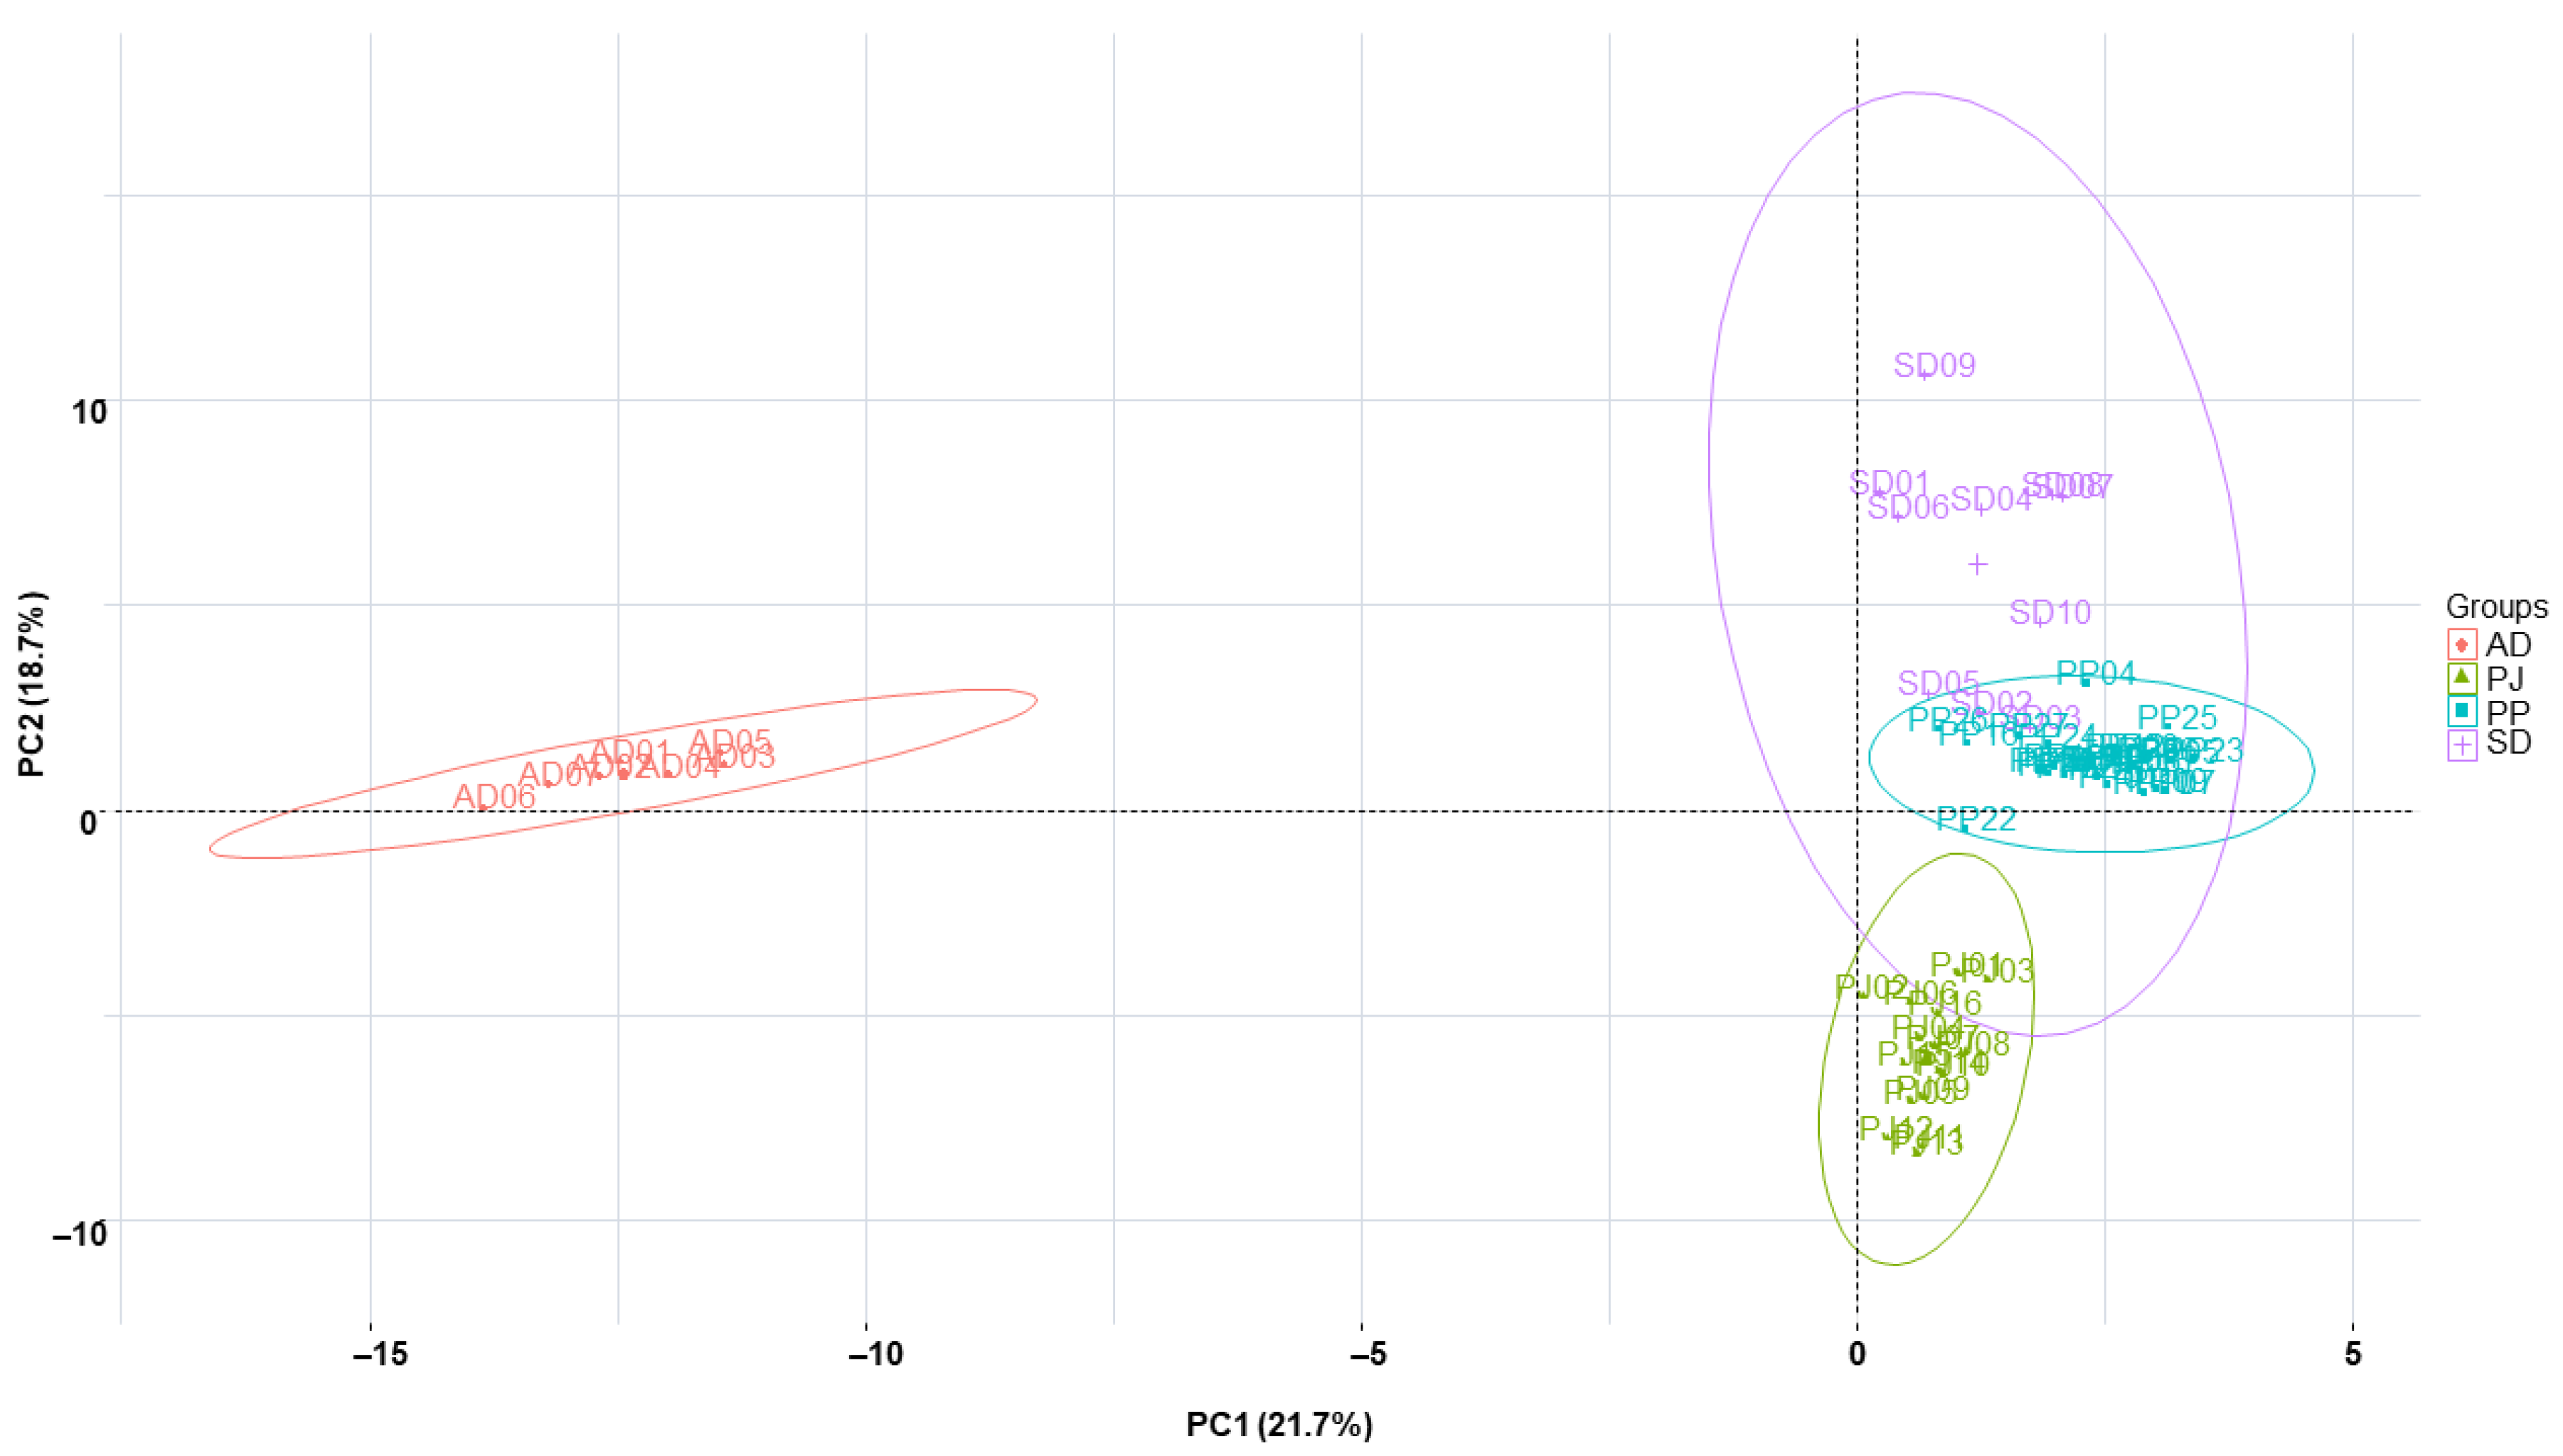
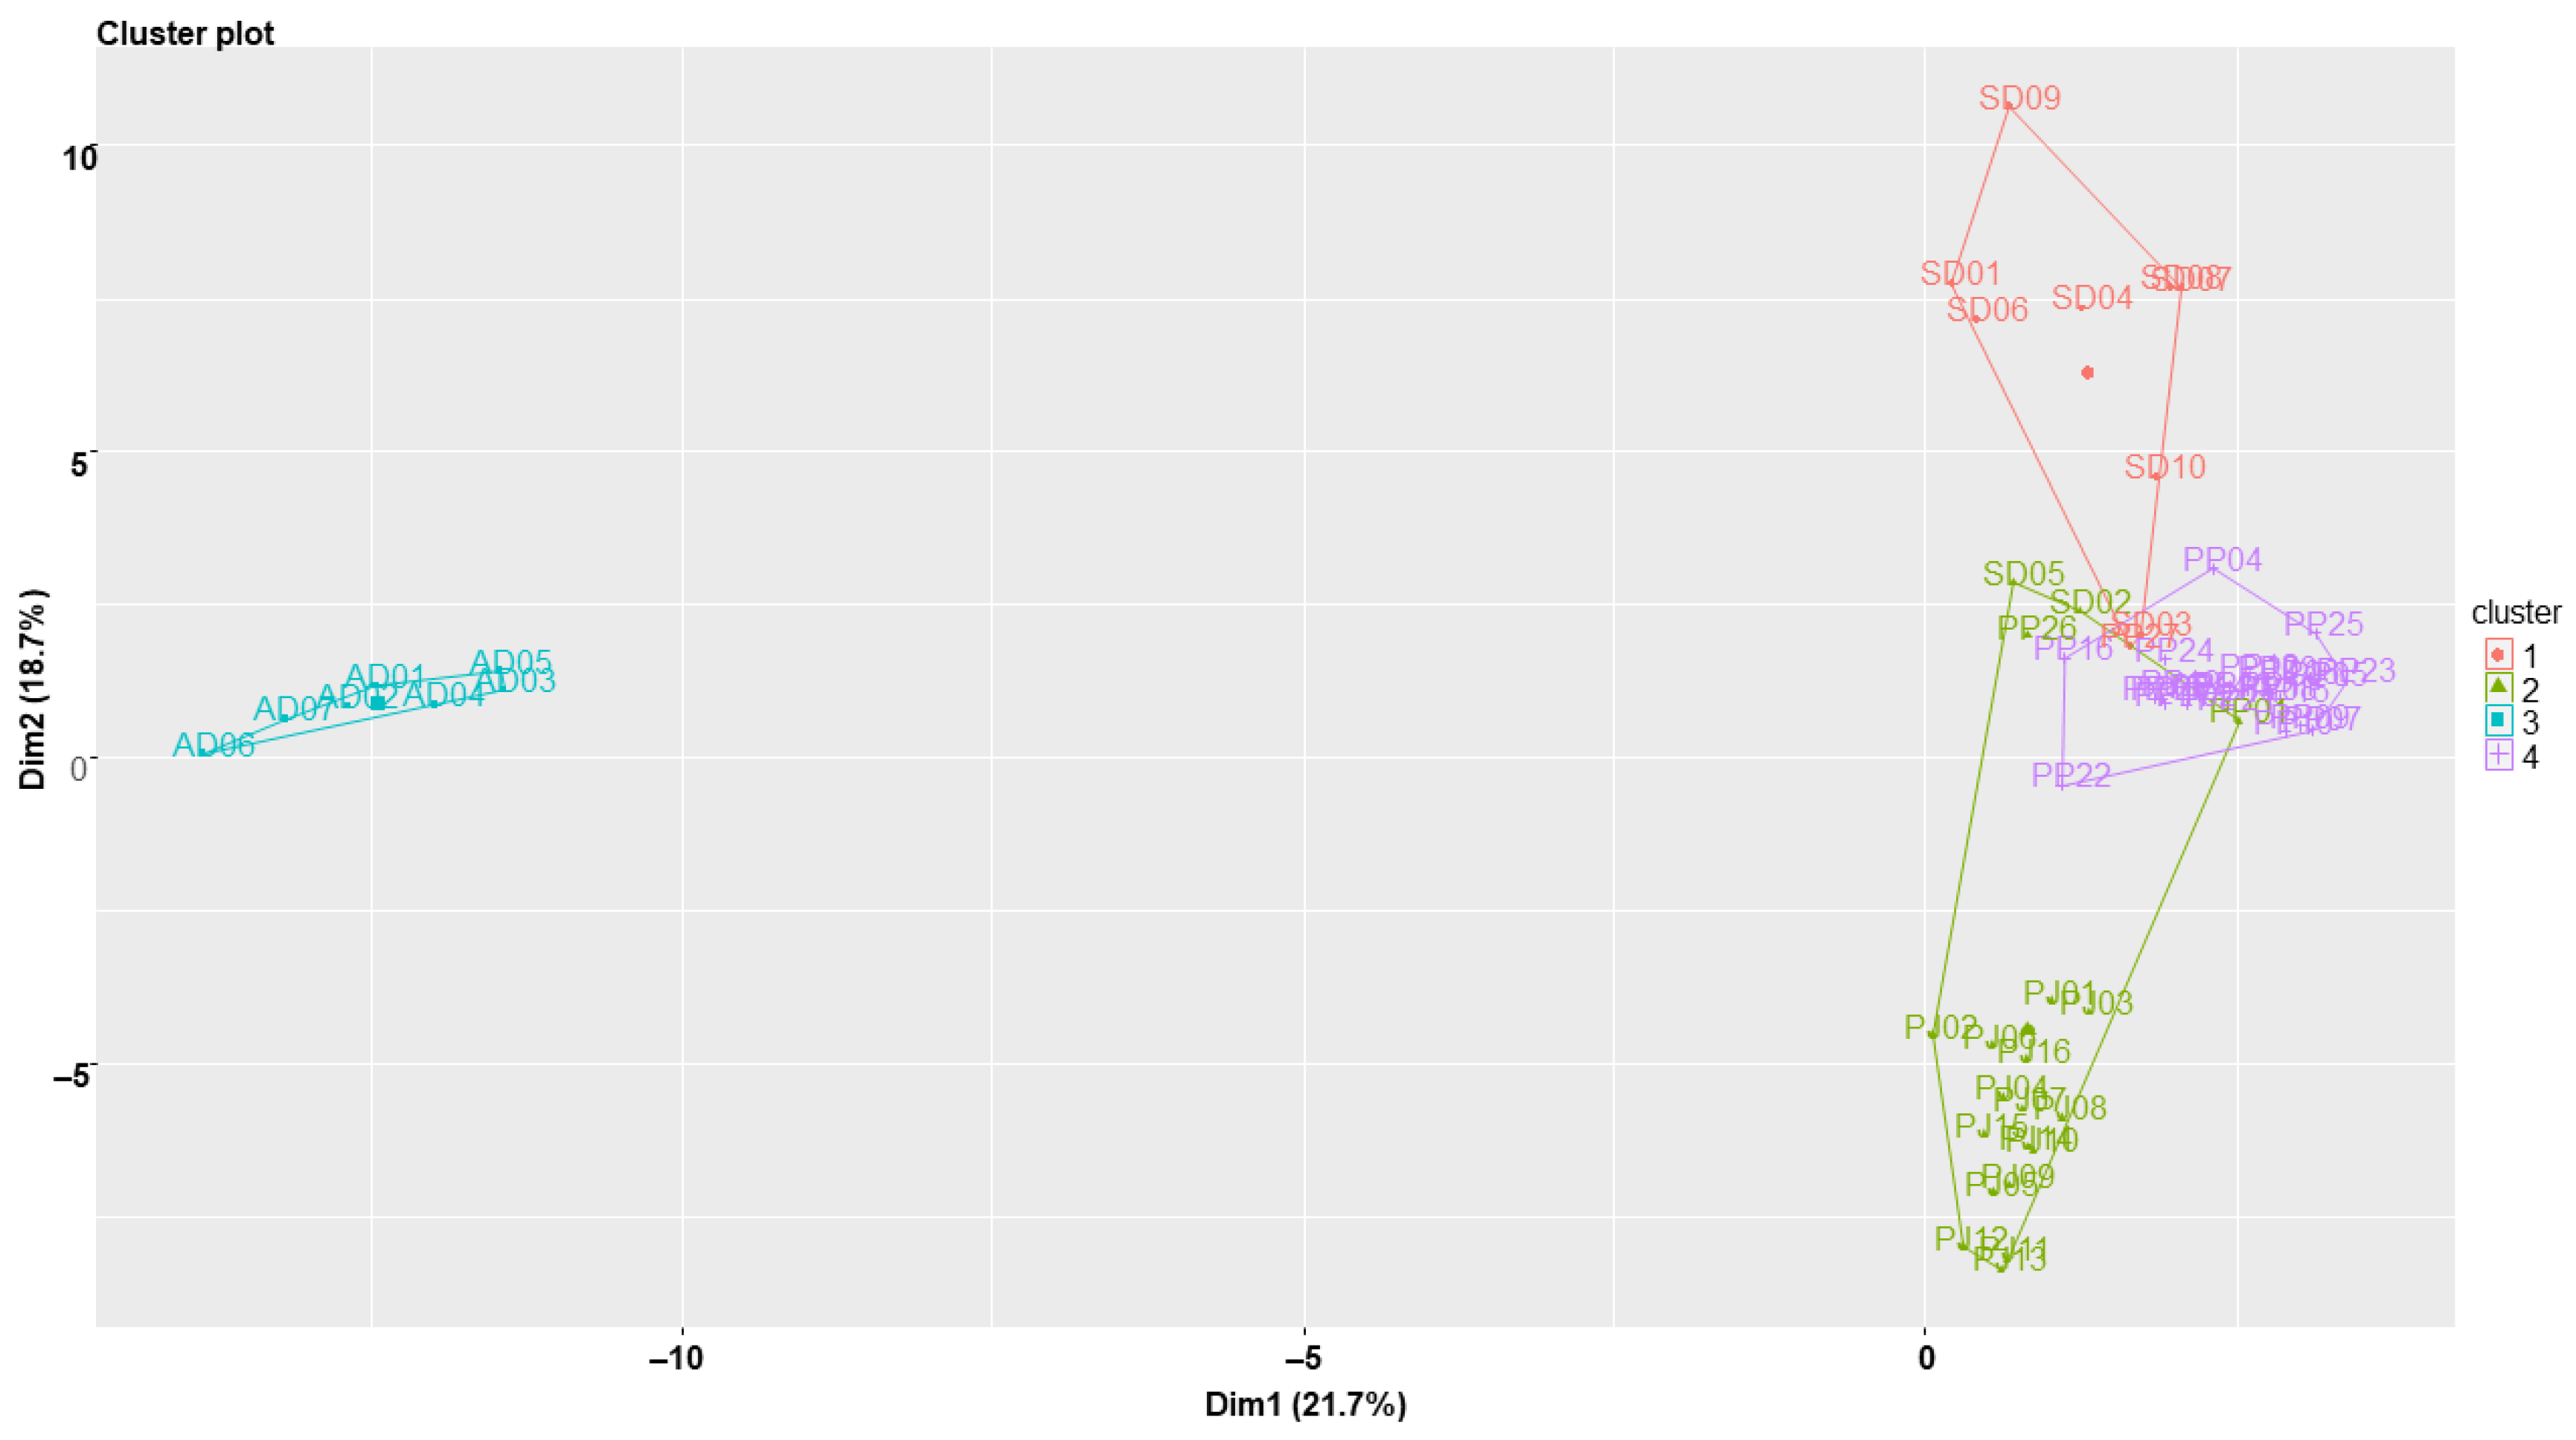
2.5. Clustering Analysis of the Samples Using Chemometric Statistical Methods
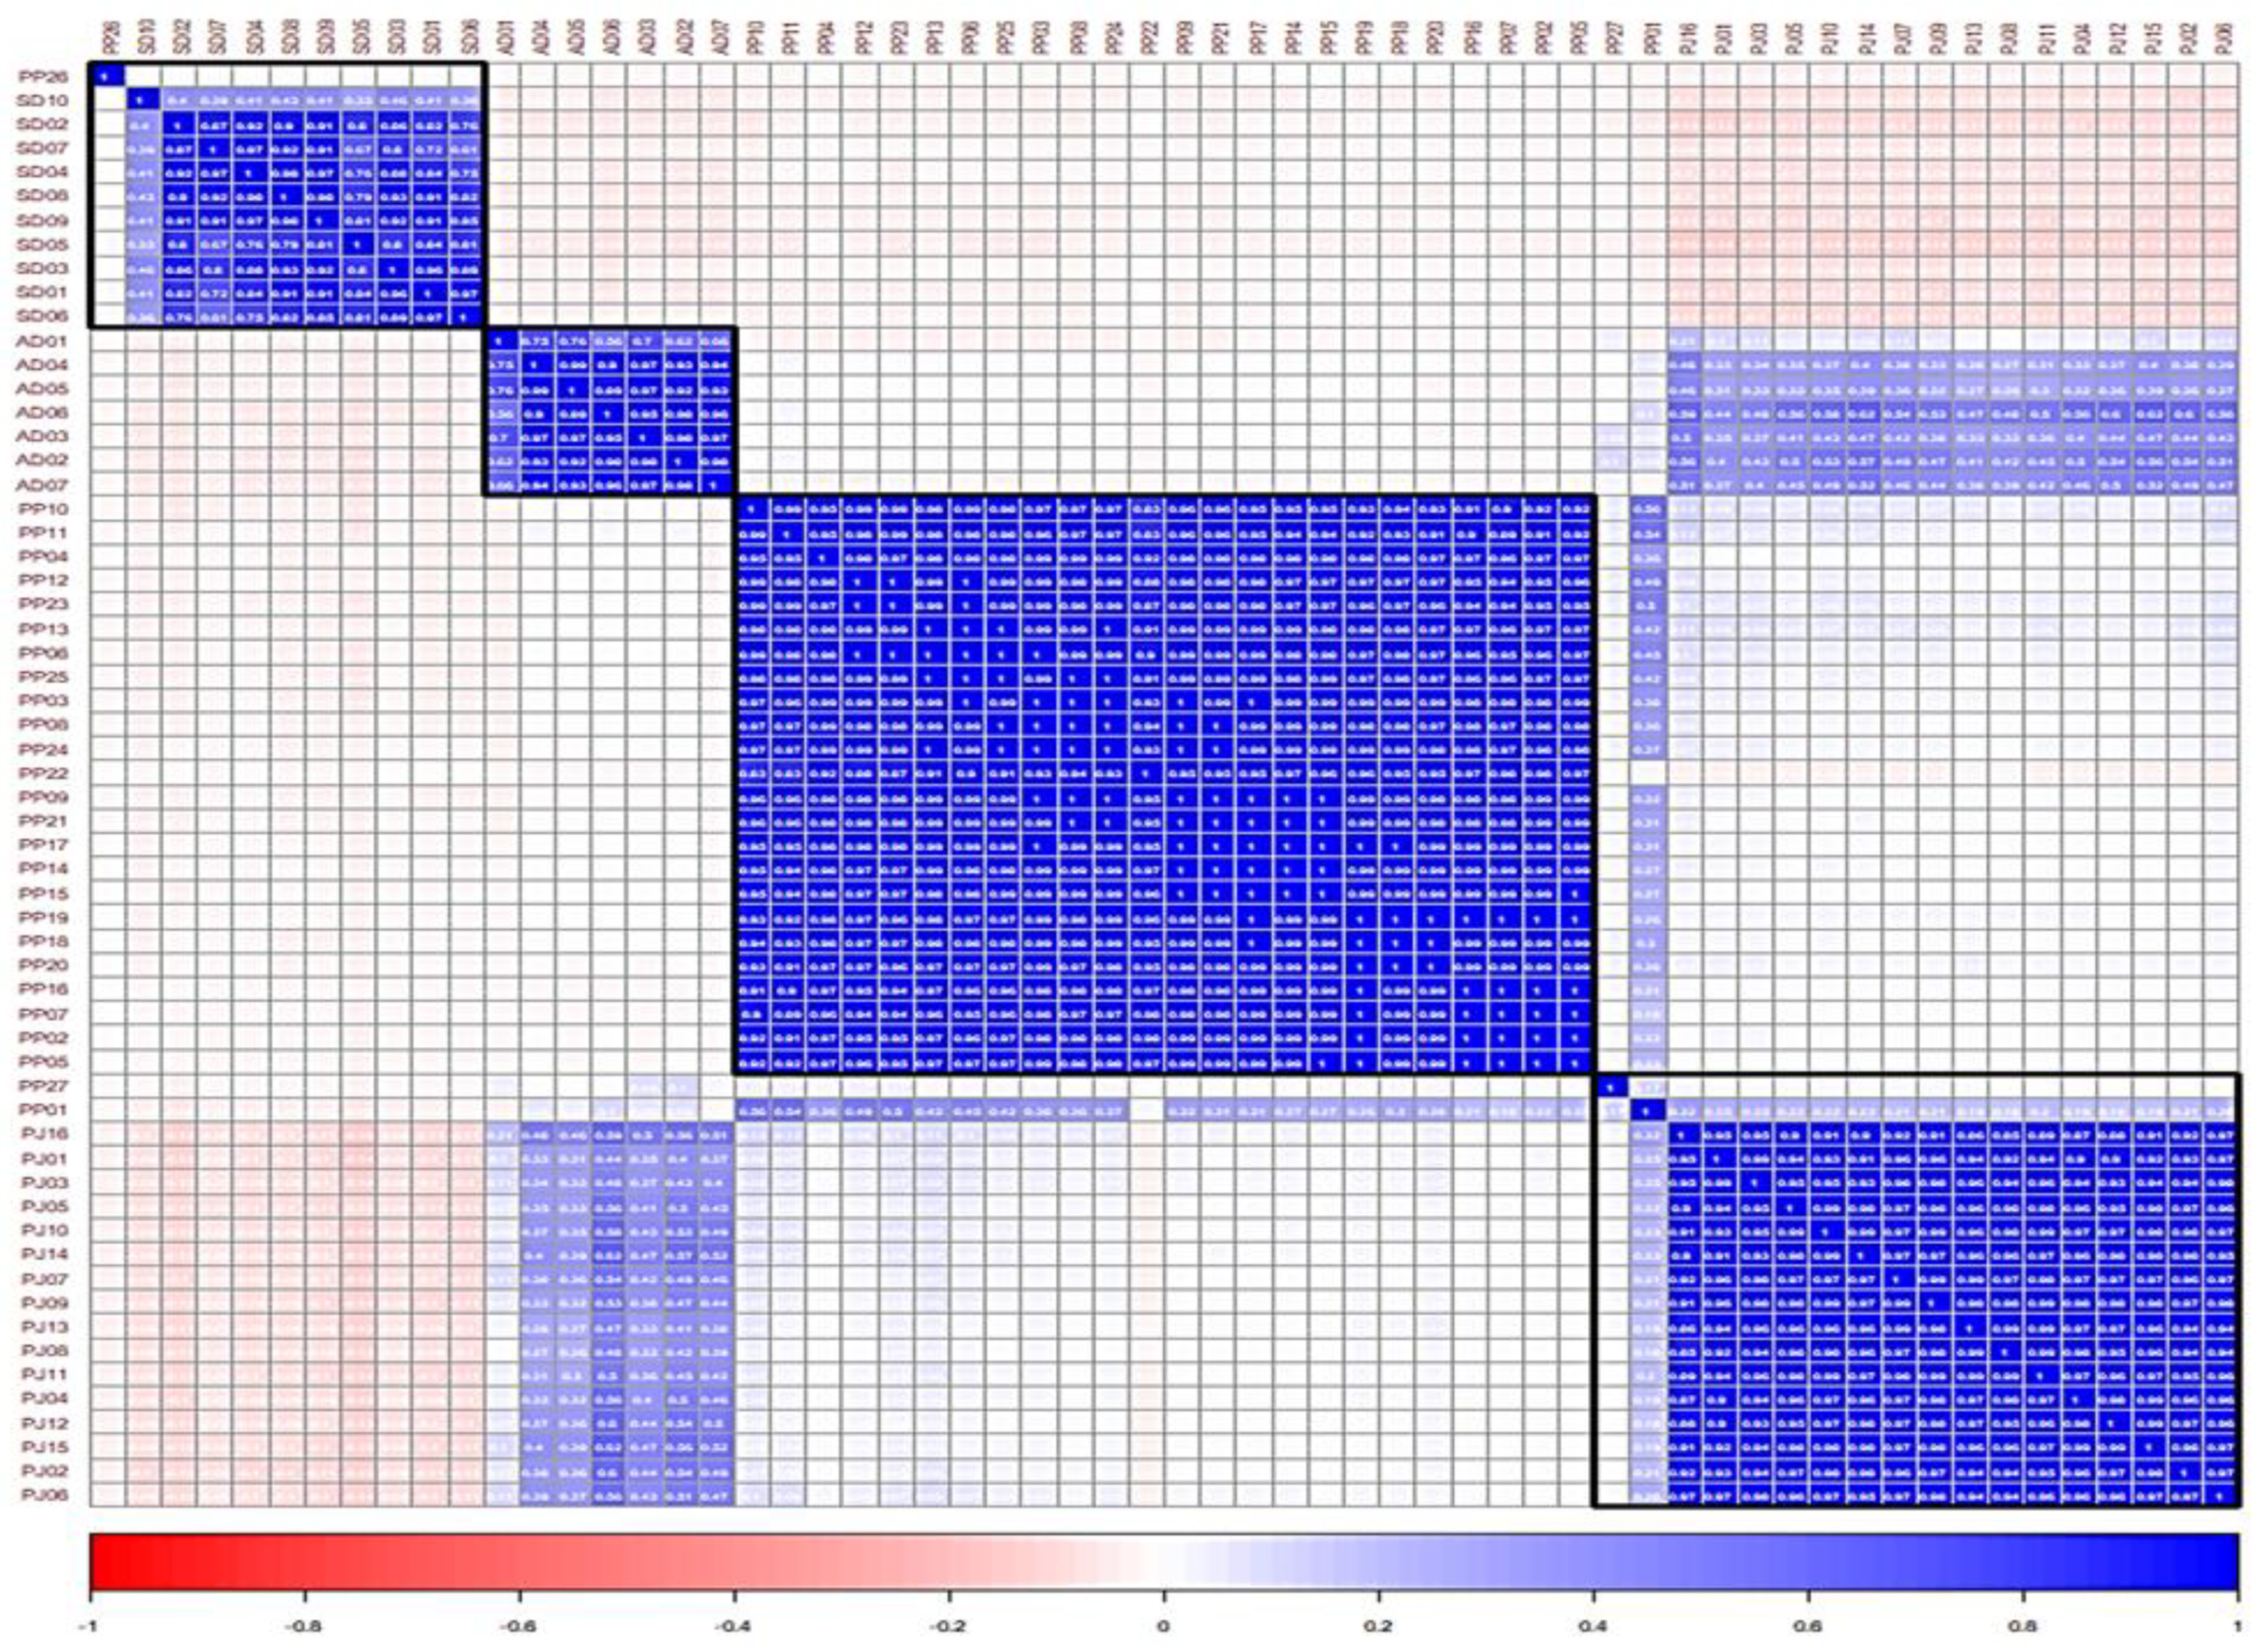
2.6. Evaluation of Similarity between the Samples Using Pearson’s Correlation Coefficient
3. Materials and Methods
3.1. Plant Materials and Reagents
3.2. Preparation of Genomic DNA
3.3. PCR Amplification for DNA Barcode Analysis
3.4. Determination of DNA Sequences of PCR Product
3.5. Analysis of DNA Sequences and Preparation of Dendrogram
3.6. Preparation of Samples for HPLC Analysis
3.7. HPLC Conditions for Chromatographic Profiling
3.8. Chemometric Statistical Analysis
4. Conclusions
Supplementary Materials
Author Contributions
Funding
Institutional Review Board Statement
Informed Consent Statement
Data Availability Statement
Acknowledgments
Conflicts of Interest
Sample Availability
References
- The Ministry of Korean Food and Drug Safety. The Korean pharmacopoeia 12th edition. In KFDA Notification No. 2019-102; Ministry of Korean Food and Drug Safety: Cheongju-si, Korea, 2019. [Google Scholar]
- Commission of Chinese Pharmacopeia. Pharmacopoeia of the Peoples Republic of China; China Medical Science Press: Beijing, China, 2015. [Google Scholar]
- The Ministry of Korean Food and Drug Safety. The Korean herbal pharmacopoeia. In KFDA Notification No. 2020-73; Ministry of Korean Food and Drug Safety: Cheongju-si, Korea, 2020. [Google Scholar]
- Peucedanum japonicum Thunberg in Murray. The Flora of China, Volume 14, p. 186. Available online: http://www.efloras.org/florataxon.aspx?flora_id=2&taxon_id=200015732 (accessed on 7 December 2021).
- Editing Commission for Chinese Materia Medica, National Chinese Medicine and Pharmacy Administration. Chinese Materia Medica; Shanghai Science and Technology Press: Shanghai, China, 1999; Volume 5. [Google Scholar]
- Kalpana, J.; Preeti, C.; Dnyaneshwar, W.; Bhushan, P. Molecular markers in herbal drug technology. Curr. Sci. 2004, 87, 159–165. [Google Scholar]
- Choi, H.Y.; Seo, Y.B.; Lee, S.I. PCR-mediated RFLP to identify ‘Bangpoong’ a crude drug. Kor. J. Pharmacogn. 1997, 28, 1–8. [Google Scholar]
- Hong, S.M.; Lee, M.Y.; Koh, J.C.; Ko, B.S. Development and application of PCR-based markers for the discrimination of Bang-Poong and related species. Kor. J. Plant Biotechnol. 2004, 31, 1–6. [Google Scholar]
- Cho, J.H.; Lim, J.M.; Kim, M.S.; Byeon, J.H.; Park, H.S.; Ahn, Y.S.; Park, C.G. Classification and discrimination of geographical origin of Bang-Poong (Saposhnikovia divaricata (Turcz) Schischkin) medicinal plant and related species by using DNA sequence analysis. Korean J. Intl. Agri. 2013, 25, 395–405. [Google Scholar]
- Lee, M.Y.; Ju, Y.S.; Kim, H.J.; Ko, B.S. Morphological characteristic and PCR analysis for original identification of Peucedanum decursivum. Korean J. Ori. Med. 2003, 9, 113–122. [Google Scholar] [CrossRef]
- Xiong, Y.X.; Wu, L.; Liu, Y.M.; Chen, K.L.; Xiong, Y.X.; Wu, L.; Liu, Y.M.; Chen, K.L. Identification of Peucedani Radix and its adulterants by DNA barcoding technique. Zhong Yao Cai 2013, 36, 1762–1765. [Google Scholar]
- Hou, D.Y.; Song, J.Y.; Yang, P.; Zhou, H.; Xin, T.Y.; Yao, H. Identification of peucedani radix, peucedani decursivi radix and its adulterants using ITS2 sequence. Zhongguo Zhong Yao Za Zhi 2014, 39, 4186–4190. [Google Scholar]
- Choi, S.A.; Kim, Y.J.; Lee, W.K.; Kim, K.Y.; Kim, J.H.; Seong, R.S. The complete chloroplast genome of the medicinal plant Angelica decursiva (Apiaceae) in Peucedani Radix. Mitochondrial DNA B Resour. 2016, 1, 210–211. [Google Scholar] [CrossRef] [PubMed]
- Wang, L.; Yu, X.; Xu, W.; Zhang, J.; Lin, H.; Zhao, Y. Complete chloroplast genome sequencing support Angelica decursiva is an independent species from Peucedanum praeruptorum. Physiol. Mol. Biol. Plants 2021, 27, 2503–2515. [Google Scholar] [CrossRef] [PubMed]
- Choi, B.R.; Yoon, D.; Kim, G.S.; Han, K.S.; Choi, D.J.; Lee, Y.S.; Hyun, D.Y.; Lee, D.Y. Metabolic profiling and method validation of marker compounds from Saposhnikoviae Radix and Peucedani Japonici Radix. J. Appl. Biol. Chem. 2020, 63, 393–399. [Google Scholar] [CrossRef]
- Yoshitomi, T.; Wakana, D.; Uchiyama, N.; Tsujimoto, T.; Kawano, N.; Yokokura, T.; Yamamoto, Y.; Fuchino, H.; Hakamatsuka, T.; Komatsu, K.; et al. Identifying the compounds that can distinguish between Saposhnikovia root and its substitute, Peucedanum ledebourielloides root, using LC-HR/MS metabolomics. J. Nat. Med. 2020, 74, 550–560. [Google Scholar] [CrossRef] [PubMed]
- Seo, U.M.; Zhao, B.T.; Kim, Y.H.; Kang, J.S.; Son, J.K.; Woo, M.H. Simultaneous analysis of seven marker compounds from Saposhnikoviae Radix, Glehniae Radix and Peucedani Japonici Radix by HPLC/PDA. Arch. Pharm. Res. 2016, 39, 695–704. [Google Scholar] [CrossRef] [PubMed]
- Kim, H.M.; Jeong, S.Y.; Kim, S.M.; Lee, K.H.; Kim, J.H.; Seong, R.S. Simultaneous determination and recognition analysis of coumarins in Angelica decursiva and Peucedanum praeruptorum by HPLC-DAD. Nat. Prod. Sci. 2016, 22, 162–167. [Google Scholar] [CrossRef] [Green Version]
- Tarmizi, A.A.A.; Wagiran, A.; Salleh, F.M.; Chua, L.S.; Abdullah, F.I.; Hasham, R.; Mostafiz, S.B. Integrated approach for species identification and quality analysis for Labisia pumila using DNA barcoding and HPLC. Plants 2021, 10, 717. [Google Scholar] [CrossRef]
- Xu, H.; Li, P.; Ren, G.; Wang, Y.; Jiang, D.; Liu, C. Authentication of three source spices of Arnebiae Radix using DNA barcoding and HPLC. Front. Pharmacol. 2021, 12, 677014. [Google Scholar] [CrossRef]
- Zhong, Y.; Wang, H.; Wei, Q.; Cao, R.; Zhang, H.; He, Y.; Wang, L. Combining DNA barcoding and HPLC fingerprints to trace species of an important traditional Chinese medicine Fritillariae Bulbus. Molecules 2019, 24, 3269. [Google Scholar] [CrossRef] [Green Version]
- Li, Y.P.; Geng, L.; Liu, Y.Y.; Chen, M.Y.; Mu, Q.R.; Zhang, X.; Zhang, Z.Y.; Ren, G.X.; Liu, C.S. Identification of three Daphne species by DNA barcoding and HPLC fingerprint analysis. PLoS ONE 2018, 13, 0201711. [Google Scholar] [CrossRef] [Green Version]
- Zhang, Z.P.; Zhang, Y.; Zhang, Z.; Yao, H.; Liu, H.T.; Zhang, B.G.; Liao, Y.H. Comparative analysis of DNA barcoding and HPLC fingerprint to trace species of Phellodendri Cortex, an important traditional Chinese medicine from multiple sources. Biol. Pharm. Bull. 2016, 39, 1325–1330. [Google Scholar] [CrossRef] [Green Version]
- Kim, J.H.; Doh, E.J.; Lee, G. Evaluation of medicinal categorization of Atractylodes japonica Koidz. by using internal transcribed spacer sequencing analysis and HPLC fingerprinting combined with statistical tools. Evid.-Based Complementary Altern. Med. 2016, 2016, 2926819. [Google Scholar]
- Kim, J.H.; Doh, E.J.; Lee, G. Chemical differentiation of genetically identified Atractylodes japonica, A. macrocephala, and A. chinensis rhizomes using high-performance liquid chromatography with chemometric analysis. Evid.-Based Complementary Altern. Med. 2018, 2018, 4860371. [Google Scholar] [CrossRef] [Green Version]
- Doh, E.J.; Lee, G.; Jung, H.J.; Kwon, K.B.; Kim, J.H. Chemotaxonomic monitoring of genetically authenticated Amomi Fructus using high-performance liquid chromatography-diode array detector with chemometric analysis. Molecules 2020, 25, 4581. [Google Scholar] [CrossRef] [PubMed]
- Vijayan, K.; Tsou, C.H. DNA barcoding in plants: Taxonomy in a new perspective. Curr. Sci. 2010, 99, 1530–1541. [Google Scholar]
- Zheng, L.; Watson, D.G.; Johnston, B.F.; Clark, R.L.; Edrada-Ebel, R.; Elseheri, W. A chemometric study of chromatograms of tea extracts by correlation optimization warping in conjunction with PCA, support vector machines and random forest data modeling. Anal. Chim. Acta 2009, 642, 257–265. [Google Scholar] [CrossRef]
- Torniainen, P.; Popescu, C.-M.; Jones, D.; Scharf, A.; Sandberg, D. Correlation of studies between colour, structure and mechanical properties of commercially produced ThermoWood® treated Norway spruce and scots pine. Forests 2021, 12, 1165. [Google Scholar] [CrossRef]
- Ratner, B. The correlation coefficient: Its values range between +1/−1, or do they? J. Target. Meas. Anal. Mark. 2009, 17, 139–142. [Google Scholar] [CrossRef] [Green Version]
- Schober, P.; Boer, C.; Schwarte, L.A. Correlation coefficients: Appropriate use and interpretation. Anesth. Analg. 2018, 126, 1763–1768. [Google Scholar] [CrossRef] [PubMed]
- Batsukh, Z.; Toume, K.; Javzan, B.; Kazuma, K.; Cai, S.Q.; Hayashi, S.; Kawahara, N.; Maruyama, T.; Komatsu, K. Metabolomic profiling of Saposhnikoviae Radix from Mongolia by LC–IT–TOF–MS/MS and multivariate statistical analysis. J. Nat. Med. 2020, 74, 170–188. [Google Scholar] [CrossRef] [PubMed]
- Fuchino, H.; Murase, S.; Hishida, A.; Kawahara, N. Simultaneous UHPLC/MS quantitative analysis and comparison of Saposhnikoviae radix constituents in cultivated, wild and commercial products. J. Nat. Med. 2021, 75, 499–519. [Google Scholar] [CrossRef]
- Lajayer, B.A.; Ghorbanpour, M.; Nikabadi, S. Heavy metals in contaminated environment: Destiny of secondary metabolite biosynthesis, oxidative status and phytoextraction in medicinal plants. Ecotoxicol. Environ. Saf. 2017, 145, 377–390. [Google Scholar] [CrossRef]
- Yang, L.; Wen, K.-S.; Ruan, X.; Zhao, Y.-X.; Wei, F.; Wang, Q. Response of plant secondary metabolites to environmental factors. Molecules 2018, 23, 762. [Google Scholar] [CrossRef] [Green Version]
- Demasi, S.; Caser, M.; Lonati, M.; Cioni, P.L.; Pistelli, L.; Najar, B.; Scariot, V. Latitude and altitude influence secondary metabolite production in peripheral alpine populations of the mediterranean species Lavandula angustifolia Mill. Front. Plant Sci. 2018, 9, 983. [Google Scholar] [CrossRef] [Green Version]
- White, T.J.; Bruns, T.; Lee, S.; Taylor, J.W. Amplification and direct sequencing of fungal ribosomal RNA genes for phylogenetics. In PCR Protocols: A Guide to Methods and Applications; Innis, M.A., Gelfand, D.H., Sninsky, J.J., White, T.J., Eds.; Academic Press: New York, NY, USA, 1990; pp. 315–322. [Google Scholar]
- Fay, M.F.; Swensen, S.M.; Chase, M.W. Taxonomic affinities of Medusagyne oppositifolia (Medusagynaceae). Kew Bull. 1997, 52, 111–120. [Google Scholar] [CrossRef]
- Cuénoud, P.; Savolainen, V.; Chatrou, L.W.; Powell, M.; Grayer, R.J.; Chase, M.W. Molecular phylogenetics of caryophyllales based on nuclear 18S rDNA and plastid rbcL, atpB, and matK DNA sequences. Am. J. Bot. 2002, 89, 132–144. [Google Scholar] [CrossRef] [PubMed]
- Ford, C.S.; Ayres, K.L.; Toomey, N.; Haider, N.; Stahl, J.V.; Kelly, L.J.; Wikstrom, N.; Hollingsworth, P.M.; Duff, R.J.; Hoot, S.B.; et al. Selection of candidate coding DNA barcoding regions for use on land plants. Bot. Linn. Soc. 2009, 159, 1–11. [Google Scholar] [CrossRef] [Green Version]
- Taberlet, P.; Gielly, L.; Pautou, G.; Bouvet, J. Universal primers for amplification of three non-coding regions of the chloroplast DNA. Plant Mol. Biol. 1991, 17, 1105–1109. [Google Scholar] [CrossRef]
- Katoh, K.; Standley, D.M. MAFFT Multiple sequence alignment software version 7: Improvements in performance and usability. Mol. Biol. Evol. 2013, 30, 772–780. [Google Scholar] [CrossRef] [Green Version]
- Criscuolo, A.; Gribaldo, S. BMGE (Block Mapping and Gathering with Entropy): A new software for selection of phylogenetic informative regions from multiple sequence alignments. BMC Evol. Biol. 2010, 10, 210. [Google Scholar] [CrossRef] [Green Version]
- Guindon, S.; Dufayard, J.F.; Lefort, V.; Anisimova, M.; Hordijk, W.; Gascuel, O. New algorithms and methods to estimate maximum-likelihood phylogenies: Assessing the performance of PhyML 3.0. Syst. Biol. 2010, 59, 307–321. [Google Scholar] [CrossRef] [Green Version]
- Lemoine, F.; Domelevo Entfellner, J.B.; Wilkinson, E.; Correia, D.; Dávila Felipe, M.; de Oliveira, T.; Gascuel, O. Renewing Felsenstein’s phylogenetic bootstrap in the era of big data. Nature 2018, 556, 452–456. [Google Scholar] [CrossRef]
- Lemoine, F.; Correia, D.; Lefort, V.; Doppelt-Azeroual, O.; Mareuil, F.; Cohen-Boulakia, S.; Gascuel, O. NGPhylogeny.fr: New generation phylogenetic services for non-specialists. Nucleic Acids Res. 2019, 47, W260–W265. [Google Scholar] [CrossRef] [Green Version]
- NCBI Resource Coordinators. Database resources of the National Center for Biotechnology Information. Nucleic Acids Res. 2016, 44, D7–D19. [Google Scholar] [CrossRef] [PubMed] [Green Version]
- Han, B.X.; Yuan, Y.; Huang, L.Q.; Zhao, Q.; Tan, L.L.; Song, X.W.; He, X.M.; Xu, T.; Liu, F.; Wang, J. Specific PCR identification between Peucedanum praeruptorum and Angelica decursive and identification between them and adulterant using DNA barcode. Phcog. Mag. 2017, 13, 38–45. [Google Scholar] [PubMed]


| Code | Species Identification | Geographic Origin | Code | Species Identification | Geographic Origin |
|---|---|---|---|---|---|
| PJ-01 | Peucedanum japonicum | - | PP-15 | P. praeruptorum | China |
| PJ-02 | P. japonicum | Yeongcheon, Gyeongbuk, Korea | PP-16 | P. praeruptorum | Zhejiang, China |
| PJ-03 | P. japonicum | - | PP-17 | P. praeruptorum | Zhejiang, China |
| PJ-04 | P. japonicum | Yeongju, Gyeongbuk, Korea | PP-18 | P. praeruptorum | Zhejiang, China |
| PJ-05 | P. japonicum | - | PP-19 | P. praeruptorum | Zhejiang, China |
| PJ-06 | P. japonicum | Gyeongbuk, Korea | PP-20 | P. praeruptorum | Zhejiang, China |
| PJ-07 | P. japonicum | Gyeongbuk, Korea | PP-21 | P. praeruptorum | China |
| PJ-08 | P. japonicum | Yeongju, Gyeongbuk, Korea | PP-22 | P. praeruptorum | - |
| PJ-09 | P. japonicum | Gyeongbuk, Korea | PP-23 | P. praeruptorum | - |
| PJ-10 | P. japonicum | Yeongju, Gyeongbuk, Korea | PP-24 | P. praeruptorum | - |
| PJ-11 | P. japonicum | Korea | PP-25 | P. praeruptorum | China |
| PJ-12 | P. japonicum | Hwasun, Jeonnam, Korea | PP-26 | P. praeruptorum | Yunnan, China |
| PJ-13 | P. japonicum | Bonghwa, Gyeongbuk, Korea | PP-27 | P. praeruptorum | Zhejiang, China |
| PJ-14 | P. japonicum | Yeongju, Gyeongbuk, Korea | AD-01 | Angelica decursiva | - |
| PJ-15 | P. japonicum | Bonghwa, Gyeongbuk, Korea | AD-02 | A. decursiva | - |
| PJ-16 | P. japonicum | Korea | AD-03 | A. decursiva | - |
| PP-01 | P. praeruptorum | China | AD-04 | A. decursiva | - |
| PP-02 | P. praeruptorum | China | AD-05 | A. decursiva | - |
| PP-03 | P. praeruptorum | China | AD-06 | A. decursiva | - |
| PP-04 | P. praeruptorum | China | AD-07 | A. decursiva | China |
| PP-05 | P. praeruptorum | China | SD-01 | Saposhnikovia divaricata | Neimenggu, China |
| PP-06 | P. praeruptorum | China | SD-02 | S. divaricata | Hebei, China |
| PP-07 | P. praeruptorum | China | SD-03 | S. divaricata | China |
| PP-08 | P. praeruptorum | China | SD-04 | S. divaricata | - |
| PP-09 | P. praeruptorum | China | SD-05 | S. divaricata | Neimenggu, China |
| PP-10 | P. praeruptorum | China | SD-06 | S. divaricata | Neimenggu, China |
| PP-11 | P. praeruptorum | China | SD-07 | S. divaricata | Neimenggu, China |
| PP-12 | P. praeruptorum | China | SD-08 | S. divaricata | Jilin, China |
| PP-13 | P. praeruptorum | China | SD-09 | S. divaricata | China |
| PP-14 | P. praeruptorum | China | SD-10 | S. divaricata | China |
| No. | Accession Code | Scientific Name | Medicinal Name |
|---|---|---|---|
| 1 | PR-PP01 | Peucedanum praeruptorum Dunn | Peucedani Radix |
| 2 | PR-PP02 | ||
| 3 | PR-PP03 | ||
| 4 | PR-PP04 | ||
| 5 | PR-PP05 | ||
| 6 | PR-AD01 | Angelica decursiva (Miq.) Franch. et Sav. (=Peucedanum decursivum Maxim.) | |
| 7 | PR-AD02 | ||
| 8 | PR-AD03 | ||
| 9 | PR-AD04 | ||
| 10 | PR-AD05 | ||
| 11 | PJR-PJ01 | Peucedanum japonicum Thunberg | Peucedani Japonici Radix |
| 12 | PJR-PJ02 | ||
| 13 | PJR-PJ03 | ||
| 14 | PJR-PJ04 | ||
| 15 | PJR-PJ05 | ||
| 16 | SR-SD01 | Saposhnikovia divaricata Schischkin | Saposhnikoviae Radix |
| 17 | SR-SD02 | ||
| 18 | SR-SD03 | ||
| 19 | SR-SD04 | ||
| 20 | SR-SD05 |
| Barcode Target | Amplicon Size (~bp) | Aligned Length (bp) | Conserved Sites | Variable Sites | Parsimony Informative Sites | Singleton Site |
|---|---|---|---|---|---|---|
| ITS | 700 | 689–693 | 648 | 44 | 2 | 42 |
| matk | 930 | 933 | 920 | 13 | 4 | 9 |
| rbcL | 670 | 670 | 664 | 6 | 1 | 5 |
| psbA-trnH | 320 | 311–345 | 323 | 17 | none | 16 |
| trnL-F intergenic sapcer | 440 | 444 | 440 | 4 | none | 4 |
| matk + rbcL | 1603 | 1584 | 19 | 5 | 14 | |
| psbA-trnH + trnL-F intergenic spacer | 755–789 | 763 | 21 | none | 20 | |
| mark+rbcL+ psbA-trnH | 1914–1948 | 1907 | 36 | 5 | 30 | |
| Mark + rbcL+ trnL-F intergenic spacer | 2047 | 2024 | 23 | 5 | 18 | |
| Four plastid targets | 2358–2392 | 2347 | 40 | 5 | 34 |
| Sample | Value | PJ | PP | AD | SD |
|---|---|---|---|---|---|
| PJ | Mean | 0.957 | |||
| Median | 0.966 | ||||
| Max | 0.991 | ||||
| Min | 0.849 | ||||
| PP | Mean | 0.029 | 0.791 | ||
| Median | 0.021 | 0.976 | |||
| Max | 0.321 | 0.999 | |||
| Min | −0.058 | −0.034 | |||
| AD | Mean | 0.791 | −0.011 | 0.872 | |
| Median | 0.976 | −0.014 | 0.932 | ||
| Max | 0.999 | 0.103 | 0.995 | ||
| Min | −0.034 | −0.057 | 0.563 | ||
| SD | Mean | −0.099 | −0.038 | −0.061 | 0.764 |
| Median | −0.097 | −0.038 | −0.060 | 0.822 | |
| Max | −0.072 | 0.036 | −0.044 | 0.982 | |
| Min | −0.155 | −0.079 | −0.084 | 0.330 |
Publisher’s Note: MDPI stays neutral with regard to jurisdictional claims in published maps and institutional affiliations. |
© 2022 by the authors. Licensee MDPI, Basel, Switzerland. This article is an open access article distributed under the terms and conditions of the Creative Commons Attribution (CC BY) license (https://creativecommons.org/licenses/by/4.0/).
Share and Cite
Kim, J.-H.; Doh, E.-J.; Lee, G. Chemotaxonomic Classification of Peucedanum japonicum and Its Chemical Correlation with Peucedanum praeruptorum, Angelica decursiva, and Saposhnikovia divaricata by Liquid Chromatography Combined with Chemometrics. Molecules 2022, 27, 1675. https://doi.org/10.3390/molecules27051675
Kim J-H, Doh E-J, Lee G. Chemotaxonomic Classification of Peucedanum japonicum and Its Chemical Correlation with Peucedanum praeruptorum, Angelica decursiva, and Saposhnikovia divaricata by Liquid Chromatography Combined with Chemometrics. Molecules. 2022; 27(5):1675. https://doi.org/10.3390/molecules27051675
Chicago/Turabian StyleKim, Jung-Hoon, Eui-Jeong Doh, and Guemsan Lee. 2022. "Chemotaxonomic Classification of Peucedanum japonicum and Its Chemical Correlation with Peucedanum praeruptorum, Angelica decursiva, and Saposhnikovia divaricata by Liquid Chromatography Combined with Chemometrics" Molecules 27, no. 5: 1675. https://doi.org/10.3390/molecules27051675