2.1. Signal Profiles during a Polymerization Reaction
The idea behind using
1H TD-NMR to probe chemical reactions with the formation of solid products is to follow the evolution of signals from rigid and mobile segments during the reaction. However,
1H NMR signals arising from rigid molecular segments have short decay times (
50 μs) due to the strong
1H-
1H dipolar coupling. Thus, to detect full NMR signals from these segments, it is necessary to start the signal acquisition right after the excitation pulse. This is barely achieved in most of the commercial probeheads, which have typical dead times in the range of 5–30 μs. Thus, a simple
—acquisition scheme (denoted here as FID acquisition) frequently implies in the loss of a considerable part of the signal from solid components. One strategy to avoid this dead time issue is to use probeheads with the lowest possible quality factor, but this usually implies in lower sensitivity and requires higher
power for excitation. An alternative is to use a dipolar echo pulse sequence, capable of refocusing the
1H-
1H dipolar coupling, to produce an echo right out of the dead time region where the solid component is recovered [
28]. However, the recovery efficiency of the solid components signals is not 100%, depending on echo times, interpulse delays, pulses errors, etc. Moreover, the shape of the signal can also be affected by the use of a specific pulse sequence or by the experimental set-up [
20]. Therefore, different methods can be chosen to obtain better echo recovery efficient or shape accuracy, depending on desired application.
Here we rely on two basic pulse sequences to refocus the signal from rigid components. The first one is an approach based on the experiments developed by Rhim and Kassemeier in the early 1970s. It consists of applying a continuous wave pulse of duration
followed by a delay τ and a hard
pulse 90° phase shifted with respect to the CW pulse [
28]. Recently, the Rhim and Kassemeier pulse sequence was used without interpulse delays and had a power setup chosen to maximize the signal recovery of solid components at expense of some signal distortion due to the magnitude mode acquisition. This dipolar echo pulse sequence refocuses the dipolar coupling at
after the second pulse and was referred to as Rhim and Kessemeier Radiofrequency Optimized Solid-Echo (RK-ROSE) [
27]. The second pulse sequence is the traditional mixed Magic Sandwich Echo (mixed-MSE—
Figure 1a) method [
26,
29]. In this method, a sequence of properly phased pulses refocuses the
1H-
1H dipolar couplings at the same time as eliminating the interference of linear spin interactions such as magnetic field inhomogeneities, chemical shielding, heteronuclear dipolar interactions and local susceptibility variations. Because it can be acquired in the phase mode, the shape analysis of the mixed-MSE echo provide a more reliable way to estimate dipolar coupling second moment, which is particularly important for applications relies on the analysis of the signal shape [
30,
31]. However, because of the large number of pulses and interpulse delays, the minimum echo time is limited in mixed-MSE, which may compromise the recovery efficiency of signals arising from rigid segments.
As already mentioned, both RK-ROSE and mixed-MSE pulse sequences allow for differentiation between signals from rigid and mobile segments. Thus, both methods can be used for probing the emergence of rigid segments and/or the disappearing of mobile ones. This is the case of the curing reaction of the epoxy resin, where the formation of the solid products occurs at the expense of the liquid reagents. During such processes, an epoxy resin is converted into crosslinked thermosetting networks, and the thermosetting polymer properties depend on the extent of the chemical reactions that occur during cure and the resin morphology [
32]. Briefly, epoxy resin cure goes from a liquid state to a gel point, then turns to rubber, and finally reaches the vitrification point, where it is converted to glass [
32,
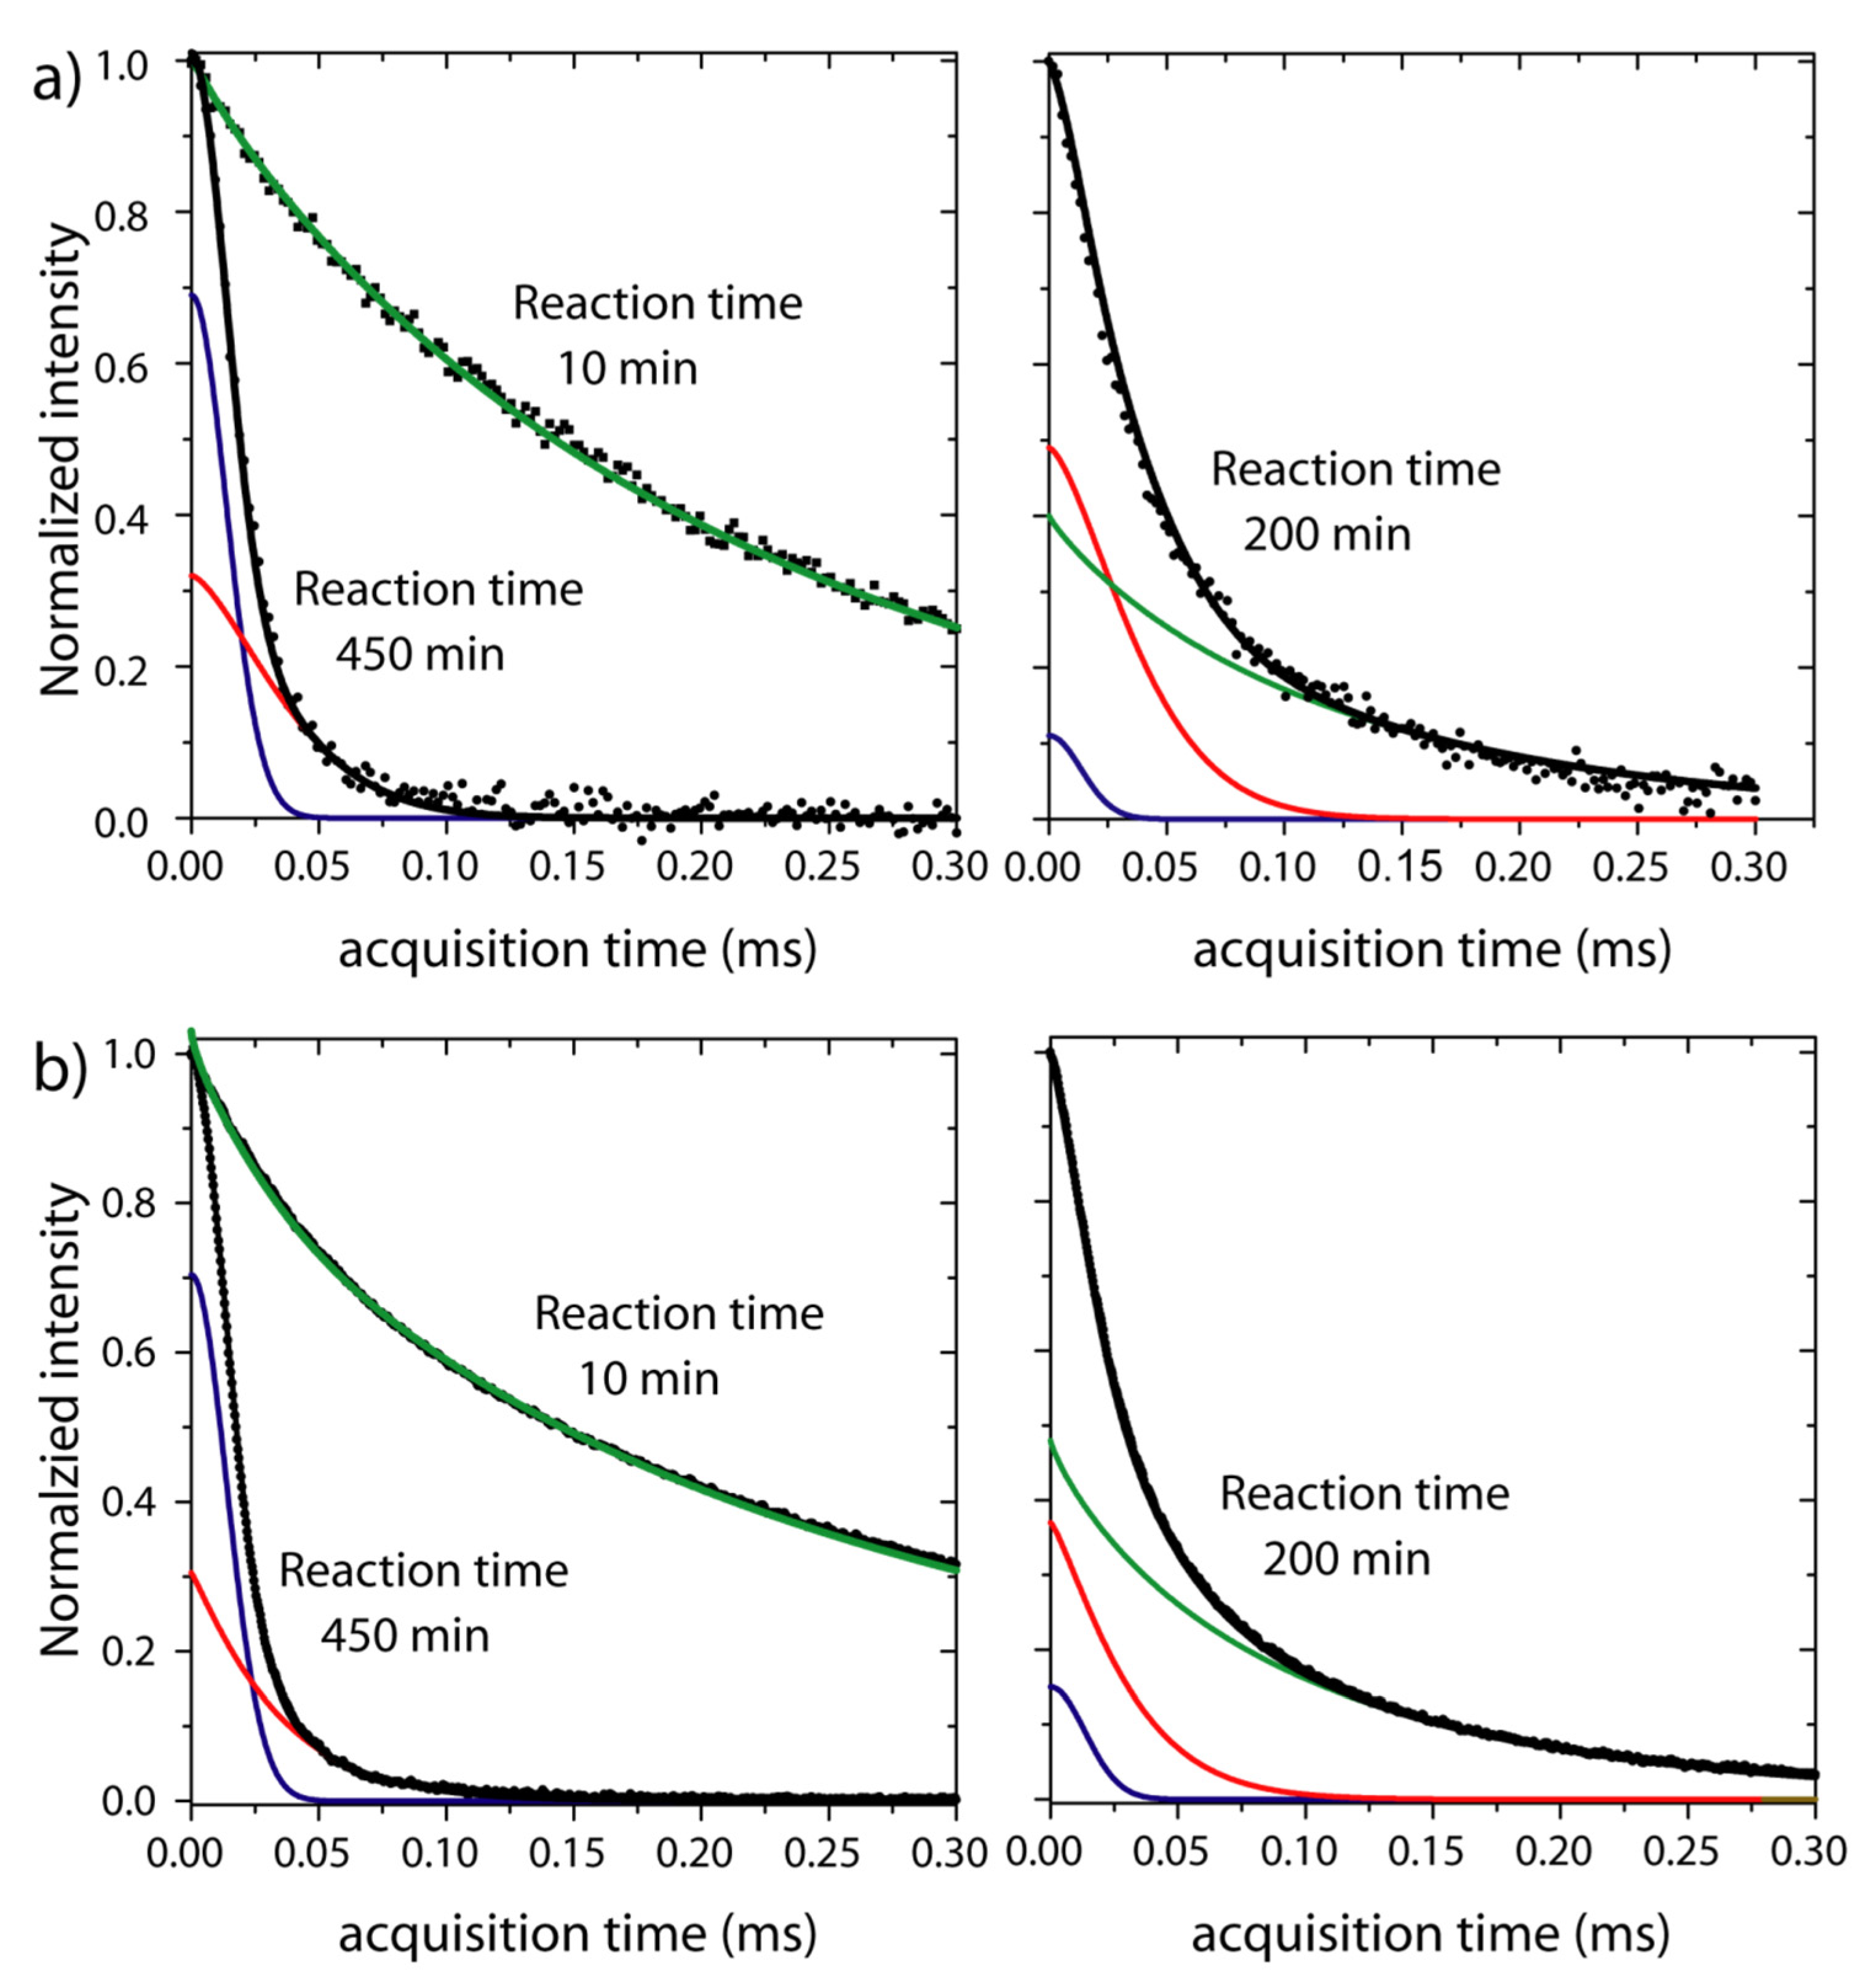
33]. The effect of these processes on the RK-ROSE and mixed-MSE dipolar echoes is shown in
Figure 2, where normalized half-echoes signals acquired at several reaction times are presented. The RK-ROSE and mixed-MSE correspond to two different reactions, but with the same relative amount of resin and hardener and at the same temperature. The general behavior of the signals is similar for both type of experiments. The first signal is acquired only after the homogenization of the reagents (~2 min) and temperature equilibration (~10 min). At shorter reaction times (10 min), the signal is comprised of a slow decaying signal associated to
1H nuclei in the mobile segments of the reagents. As the reaction takes place (reaction time of 200 min,
Figure 2b), the slow decaying fraction of the signal decreases while the fast-decaying fraction increase. When the reaction finishes (reaction time of 450 min in
Figure 2a), a fast-decaying signal is observed, as is typical for rigid segments.
To provide a more quantitative analysis, we refer to the work by Mauss et. al. [
20] who decomposed the mixed-MSE signal from a semicrystalline polymer above its glass transition temperature
in three components, associated to the crystalline (rigid), amorphous (highly mobile) and interfacial (with intermediate mobility) regions. The signals from rigid molecular segments can be well described by the so-called Abragam function, i.e., a multiplication between a gaussian and a sinc function (Van Vleck theory [
34]). The signals from intermediate and highly mobile segments are described by modified exponential functions (stretched or compressed), but with different time constant and shape parameters [
20]. In summary, the NMR signal can be represented by the following function:
where
,
and
are the fractions associated to rigid, intermediate and mobile components, respectively.
,
,
,
and
are the respective shape parameters. It is worth to stress that in a low field NMR the signal has significant contribution from static field inhomogeneities. Thus, despite the signal fitting being performed within the
acquisition time window, the shape parameters of mobile components may still have a minor contribution from static field inhomogeneities.
Here we will use the same model to describe the 1H NMR signal, but with the signal from the rigid segments assigned to the solid polymer formed during the cure and the mobile component accounting for the liquid reagents. The segments with intermediate mobility are attributed to polymer chains with restricted mobility in the solid product, for instance, chains in the solid to liquid interface, chain segments with local mobility such side groups or remaining small segments such as oligomers.
Figure 2 (right) illustrates the fit of normalized signals acquired at 293 K with RK-ROSE and mixed-MSE 10 min and 450 min after the polymerization started. For RK-ROSE the absolute value of the signals is shown (magnitude mode acquisition), while for mixed-MSE the real part of phase adjusted signals are exhibited (phase mode acquisition). After 10 min of reaction, the signal is well adjusted using only the last term of Equation (1) (green curve,
,
for RK-ROSE and
,
for mixed-MSE), showing that there is no significant rigid phase at this reaction time and temperature, i.e., the signal is only associated to the reagent. On the other hand, after 450 min of reaction only rigid components are observed in the signal. As shown in
Figure 2, this fast component can be adjusted using the first and the second terms of Equation (1), i.e., a gaussian-type decay (blue curve,
,
for RK-ROSE and
,
for mixed-MSE) and a compressed exponential (red curve,
,
,
for RK-ROSE and
,
,
for mixed-MSE). The signal profile does not change for reaction times longer than 450 min (not shown), suggesting that the cure is already completed. As discussed, the existence of an intermediate mobility phase in the final product can be related to restricted local mobility in the solid phase, for instance due to side chain motions or other local segmental reorientations, or remaining oligomers. Thus, the product fraction can be associated to the sum of the rigid and intermediate mobility components, which will be referred simply as solid fraction, i.e.,
. Moreover, we should point out that in both experiments, mixed-MSE and RK-ROSE, there is an underestimation of the rigid fraction because the efficient of the pulse sequences in recovering signals from rigid segments is not 100%. This effect can be corrected as suggested elsewhere [
31]. Here this is completed by analyzing the dipolar echoes (acquired with mixed-MSE or RK-ROSE) the simple FID signals acquired after the end of the reaction. This FID signal was shifted by the dead time of our spectrometer (12 μs), and then we perform a joint fit of the dipolar echoes and the corresponding FID signals. In this joint fit, the shape parameters in Equation (1) are shared to impose the FID and the dipolar echo with the same shape. Because the amplitudes are free parameters, the fitting provides independent values of
,
and
for the dipolar echo and the FID signals. Thus, it is possible to calculate the ratio between the amplitude parameters associated to dipolar echoes and the FID to estimate a correction factor
, which gives how much of the solid signals is lost due to the acquisition with mixed-MSE or RK-ROSE. For the experiments conducted as a function of temperature, this procedure was performed at each temperature. This correction factor was used to correct the values of
in all data presented here.
Figure 2 (left) illustrates the fit of normalized signals acquired 200 min after mixing the reagents. In this case, the best fit is achieved using all three components of Equation (1) (blue curve,
,
, red curve,
,
, green curve,
,
,
for RK-ROSE and blue,
,
, dark yellow,
,
, magenta,
,
,
for mixed-MSE), as shown individually in
Figure 2b.
Changes in the molecular dynamics of the mobile component throughout the reaction can be observed monitoring the
values.
values decrease for longer reaction times, suggesting an average slowdown of molecular motions in the mobile phase. This is somewhat expected because the formation of rigid components increases the local molecular constraints, reducing the molecular mobility of the remaining mobile segments. Indeed,
has been extensively used to probe reaction kinetics using
1H TD-NMR [
1]. However, kinetic models for describing polymerization reactions mostly rely on monitoring changes in the reagent and product concentrations. Thus, a more straightforward analysis can be completed using
,
and
.
2.2. Autocatalyzed and Non-Catalyzed Reaction: Relationship between NMR Parameters and Reaction Kinetic Parameters
To obtain the kinetic parameters of the polymerization reaction we first need to establish the meaning of the NMR data in terms of the kinetic parameters. As mentioned, in the curing reaction of epoxy resins, the formation of the solid products occurs at the expense of the liquid reagents. Thus, and can be associated to the relative reagent, , and product, , concentrations. Therefore, assuming a model for the polymerization reaction, it would be possible to obtain the kinetic parameters by fitting the reaction time dependence of or .
Epoxy cure is usually described in terms of noncatalyzed or autocatalytic single step reaction models [
14]. The analysis of such reactions using DSC makes it possible to distinguish the contribution of noncatalyzed and autocatalyzed paths by performing dynamic or isothermal experiments, respectively [
33,
35]. Here, the experiment is essentially isothermal, so we would expect an autocatalytic reaction to prevail. Nonetheless, despite the external temperature of the sample being kept constant, a relatively large sample volume (~0.5 cm
3) is used, making it difficult to completely avoid internal temperature gradients due to the exothermal character of the reaction, so noncatalytic paths cannot be ruled out. Thus, we build upon a model described in reference [
36] that assumes autocatalytic and noncatalytic paths occurring simultaneously. In this model, the reagent and product concentrations are given by:
Here is the reaction time, is the initial reagent concentration and is the average reaction rate at a given temperature. The parameter assumes different meaning for autocatalyzed and noncatalyzed paths, being equal to the initial product concentration, for autocatalyzed and for noncatalyzed reactions. is the initial reaction rate.
As already discussed, one may establish a direct correlation between the reagent concentration and the mobile component of the signal,
, as well as between the product concentration and the solid component,
. Thus, the curves of
or
as a function of the reaction time could be fitted to obtain
,
and
. However, for higher temperatures one might observe a slow decaying component in the signal that is not associated to the reagent, but to mobile segments in the product. Fortunately, this component can be identified as a mobile fraction kept constant after the reaction is finished. Moreover, it can be taken into account by adding a constant term,
, in the fitting function. Hence, the reaction time dependence of
can be fitted by:
with
and
assumed as free fitting parameters and
obtained as the initial and final
mobile fractions.
2.3. Reaction Kinetic Parameters Extracted from Dipolar Echoes
In order to probe the dependence of the mobile fraction on the reaction time, we acquired a series of dipolar echoes during the epoxy cure. The dipolar echoes were acquired using mixed-MSE and RK-ROSE in different batches, but with the same proportion of resins and hardeners as well as the same temperature. The signal acquisition started 15 min after mixing the reagents to assure temperature equilibration in the sample. The resulting curves of versus the reaction time, , were fitted using Equation (3) to obtain and . The fitting procedure used to obtain these parameters was: first, we manually deconvolute the mixed-MSE and RK-ROSE signals at the shortest and the longest reaction times to obtain the shape and amplitude parameters , , , , , , and . Note that this fitting procedure already provides the values for and . Then, these values were used as input values for an automated fit procedure using the origin lab software to obtain the parameter values for each reaction time.
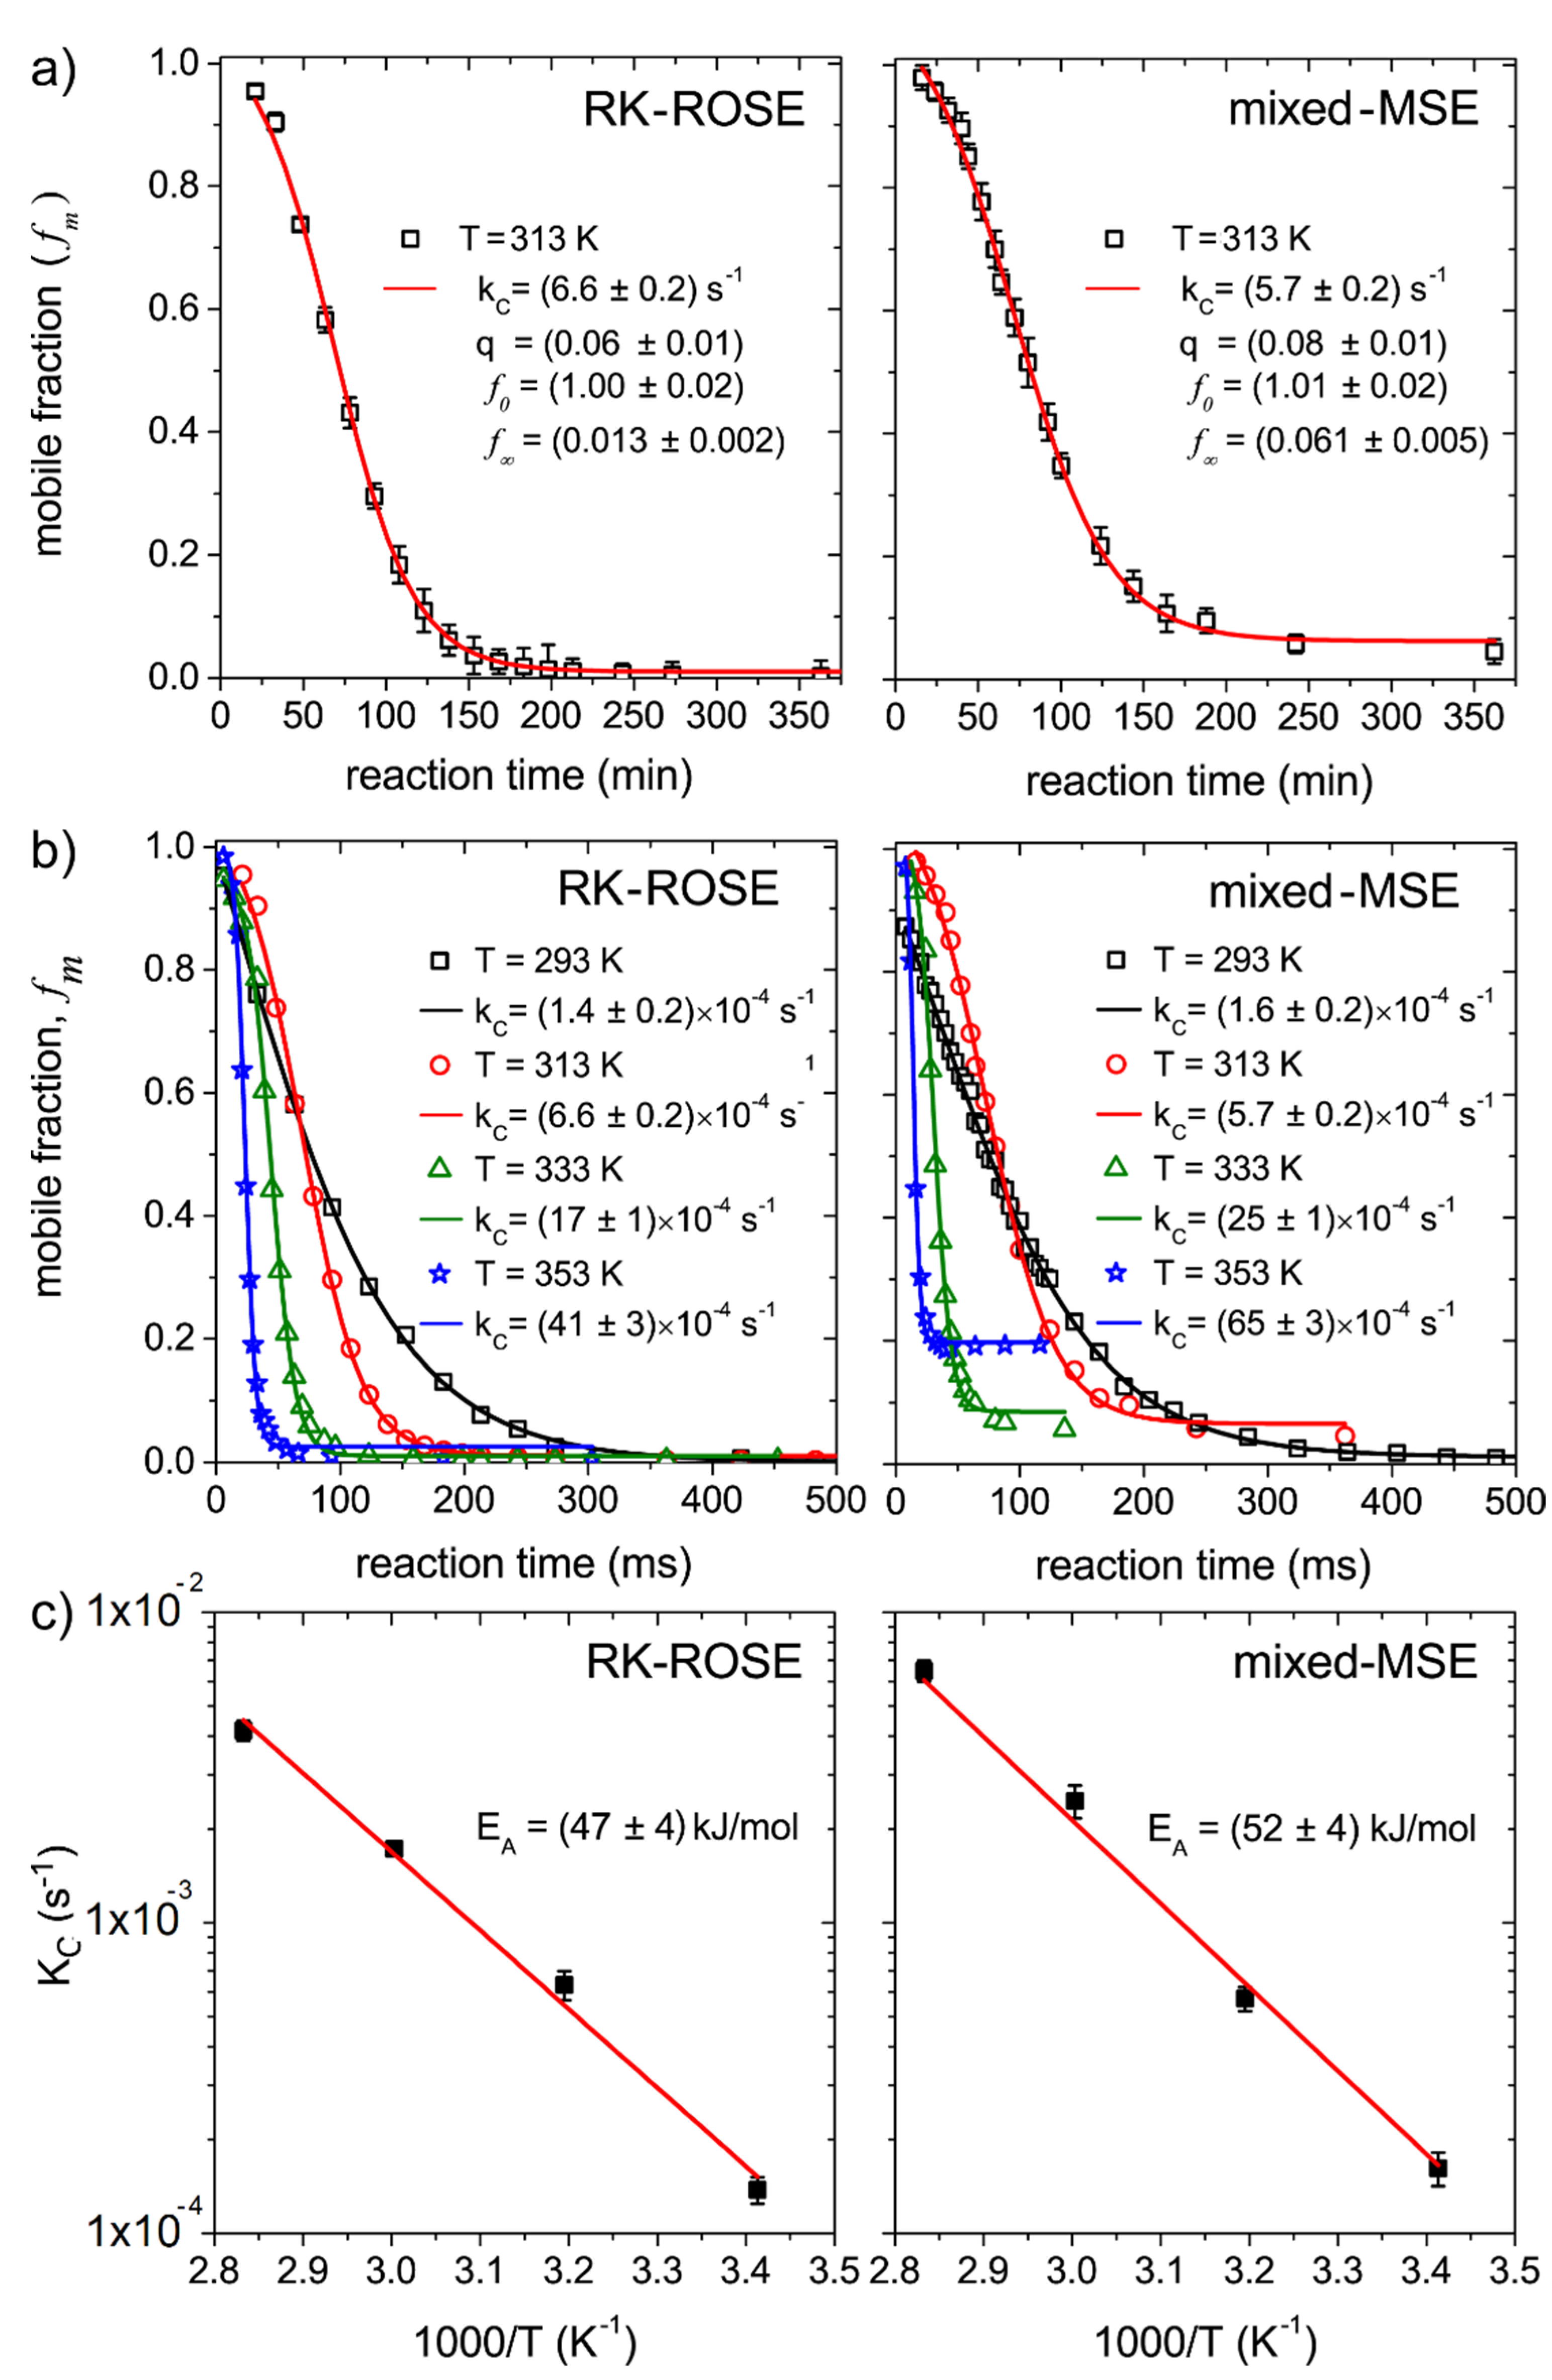
Figure 3a shows the plot of the mobile fractions
as a function of the reaction time obtained from mixed-MSE and RK-ROSE data at 313 K. Even though the curves obtained by mixed-MSE and RK-ROSE correspond to different batches of samples, the
values obtained are similar, since the reactions were performed at the same temperatures. In both cases the values obtained for
are close to zero. As mentioned, for autocatalytic reaction the
parameter is equal to the initial product concentration
. Because the initial product concentration should be quite small, the lower
obtained suggests the reaction is predominantly of autocatalytic, as expected for an isothermal process. The values of
are different from zero, indicating that part of the segments remain mobile after the end of the reaction. As mentioned, this corresponds to molecular segments in the product, such as pendant groups, chain ends and oligomers, which contributes as intermediate mobility components at the lower temperature (293 K, see
Figure 3), but have their mobility increased at 313 K. This remaining mobile component is more evident in the mixed-MSE data due to its ability of refocusing field inhomogeneity effects. We shall consider that even though these segments can contribute to a significant fraction of the signal, they do not hinder the analysis of the reaction kinetics, as they remain constant after the reaction is completed.
Figure 3b shows the plot of the mobile fractions,
as a function of the reaction time, obtained from mixed-MSE and RK-ROSE data at 293 K, 313 K, 333 K and 353 K. The curve fit using Equation (3) provides the
values at each temperature, as shown in the insets. The temperature dependence of
is shown in the Arrhenius plot of
Figure 3c. Activation energies of
and
were obtained from the RK-ROSE and mixed-MSE data, respectively. Such values for the activation energies are in good agreement with literature values for similar samples [
25,
35].
2.4. Reaction Kinetics Parameters from Dipolar Filtered Magic Sandwich Echo (DF-MSE)
In the last section we showed how dipolar echo pulse sequences can be used to extract kinetic parameters. Nevertheless, performing the signal deconvolution to obtain the mobile, intermediate and solid fractions for each reaction time and temperature can be a quite tedious task and add significant fitting errors to the data. A possible strategy to avoid this is to acquire the data using a pulse sequence that selects only signals from mobile or rigid components or allow to separate these signals in a proper manner. This approach permits an intensity-only analysis, requiring minimal processing effort. For instance, any dipolar filter pulse sequence that suppresses the signal from the rigid phase [
37,
38,
39] can be used to obtain an echo arising only from the mobile components. The amplitude of such an echo, normalized by the corresponding full echo signal, can be plotted as a function of the reaction time to obtain curves similar to those shown in
Figure 3b, but without further need of data processing. It is also possible to use a pulse sequence to suppress the mobile phase reaching only the signal from the rigid components, which could also be monitored as a function of the reaction time to probe the polymerization reaction. The most common filter to keep the signal from the rigid phase is the double quantum filter, which only selects signals from dipolar coupled spins, i.e., stiffened segments [
40]. Such an approach was already used by Valentin and co-workers to probe epoxy polymerization reactions [
25].
Here we discuss an approach based on a simple pulse sequence named Dipolar Filtered Magic Sandwich Echo (DF-MSE); see
Figure 1 and reference [
8] for details. In its simplest form, DF-MSE is comprised by a Goldman–Shen dipolar filter of duration
[
38,
39] followed by the mixed-MSE pulse sequence. At the shorter possible filter time
(here 3.5
s) the Goldman–Shen period has no effect, so a standard mixed-MSE echo is obtained. As already discussed, this signal may contain contributions from both the solid and mobile components with the solid component signal somewhat reduced due to the finite efficiency of the pulse sequence, i.e.,
, with
accounting for the reduction in the echo intensity associated to the solid component. Note that
does not change with reaction time. As the filter time is increased the signals from rigid segments are progressively attenuated by the Goldman–Shen dipolar filter, while the signal from the mobile ones is detected without attenuation as long as
. Thus, the detected signal is comprised by the full signal from the mobile components and an attenuated signal from the rigid components. The attenuation can be taken into account considering a factor depending on the Goldman–Shen filter time, i.e.,
. If the filter time is long enough
becomes equal to zero, meaning the signals from rigid components are suppressed. This limit is easily identified by the absence of fast decaying signals in the DF-MSE echo. Thus, the ratio between the DF-MSE echo intensities at long and short Goldman-Shen filter times becomes:
Therefore, for a filter time adjusted such as , the fraction has the same behavior of concerning the dependence with the reaction time. Thus, it can also be fitted using Equation (3) to obtain the reaction kinetic parameters.
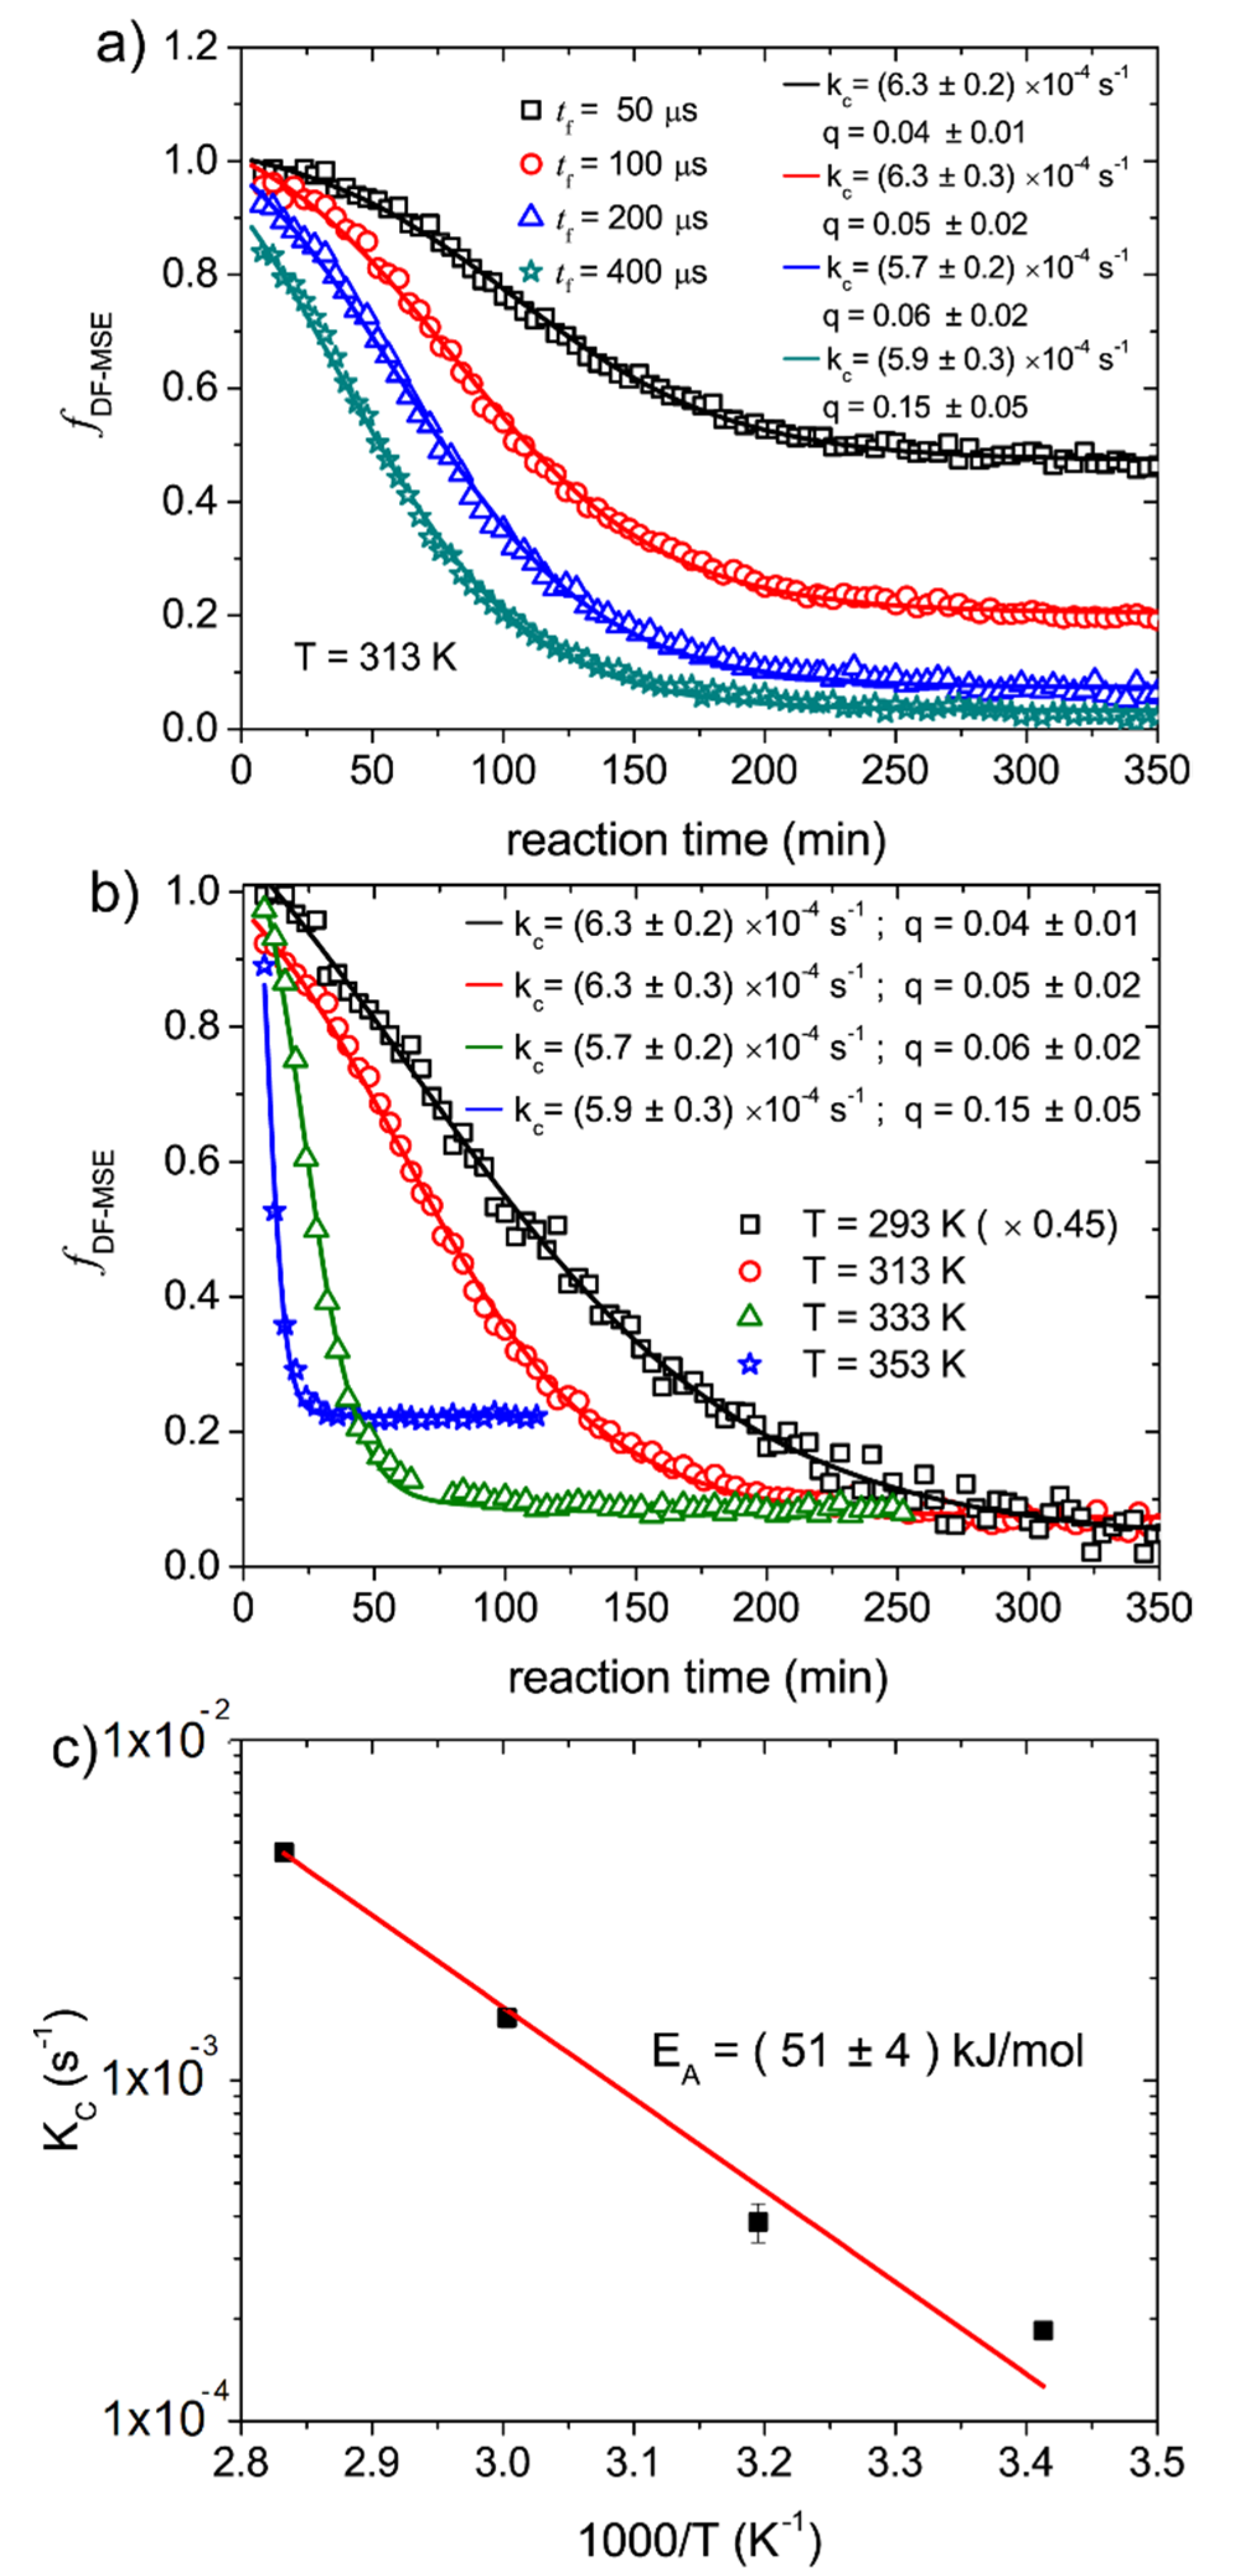
Figure 4a show
fractions acquired with filter times of
as a function of the reaction times for the epoxy cure carried out at 313 K. The curves show similar decay shapes, but different plateau values. Another feature observed in
Figure 4 is the reduction of the initial
fractions as the filter time increases. This is a result of the relative short
values, so at longer filter times part of the mobile component signals is also filtered out by the Goldman–Shen pulse sequence. This attenuation of the mobile signals is taken into account the
factor in Equation (4). Due to the partial filtering of the solid components at shorter filter times, i.e.,
and
, the plateau is associated to both the
contribution and the remaining mobile component
as observed in the mixed-MSE experiments. At longer filter times, so
, the plateau value is only related to
, but it can assume a different value because of the partial attenuation of the mobile component. These features can be observed in
Figure 4a, where a progressive decrease of the plateau value and initial fractions are observed as the filter time increases. Fitting the curves using Equation (3), we obtained almost the same values for the kinetic rate
, showing that the terms
and
suffice to take into account the features discussed above. Despite not being necessary, in order to assure a situation with
and to minimize the attenuation of mobile component signal, we used
in the DF-MSE experiments to probe the epoxy cure.
Figure 4b shows the
fractions as a function of reaction time for epoxy polymerization reactions carried out at 293 K, 313 K, 333 K and 353 K. The increase of the plateau values with temperature is associated with the gain of molecular mobility in the molecular segments of the product, as already discussed in the case of the mixed-MSE experiments. The fits using Equation (3) are also shown with the fitting parameters presented as inset. The
as a function of temperature are shown in the Arrhenius plot of
Figure 4c. An activation energy of
is obtained. This value is in excellent agreement with those obtained from the mixed-MSE and RK-ROSE data and also with the values found in the literature [
25].


 and
and 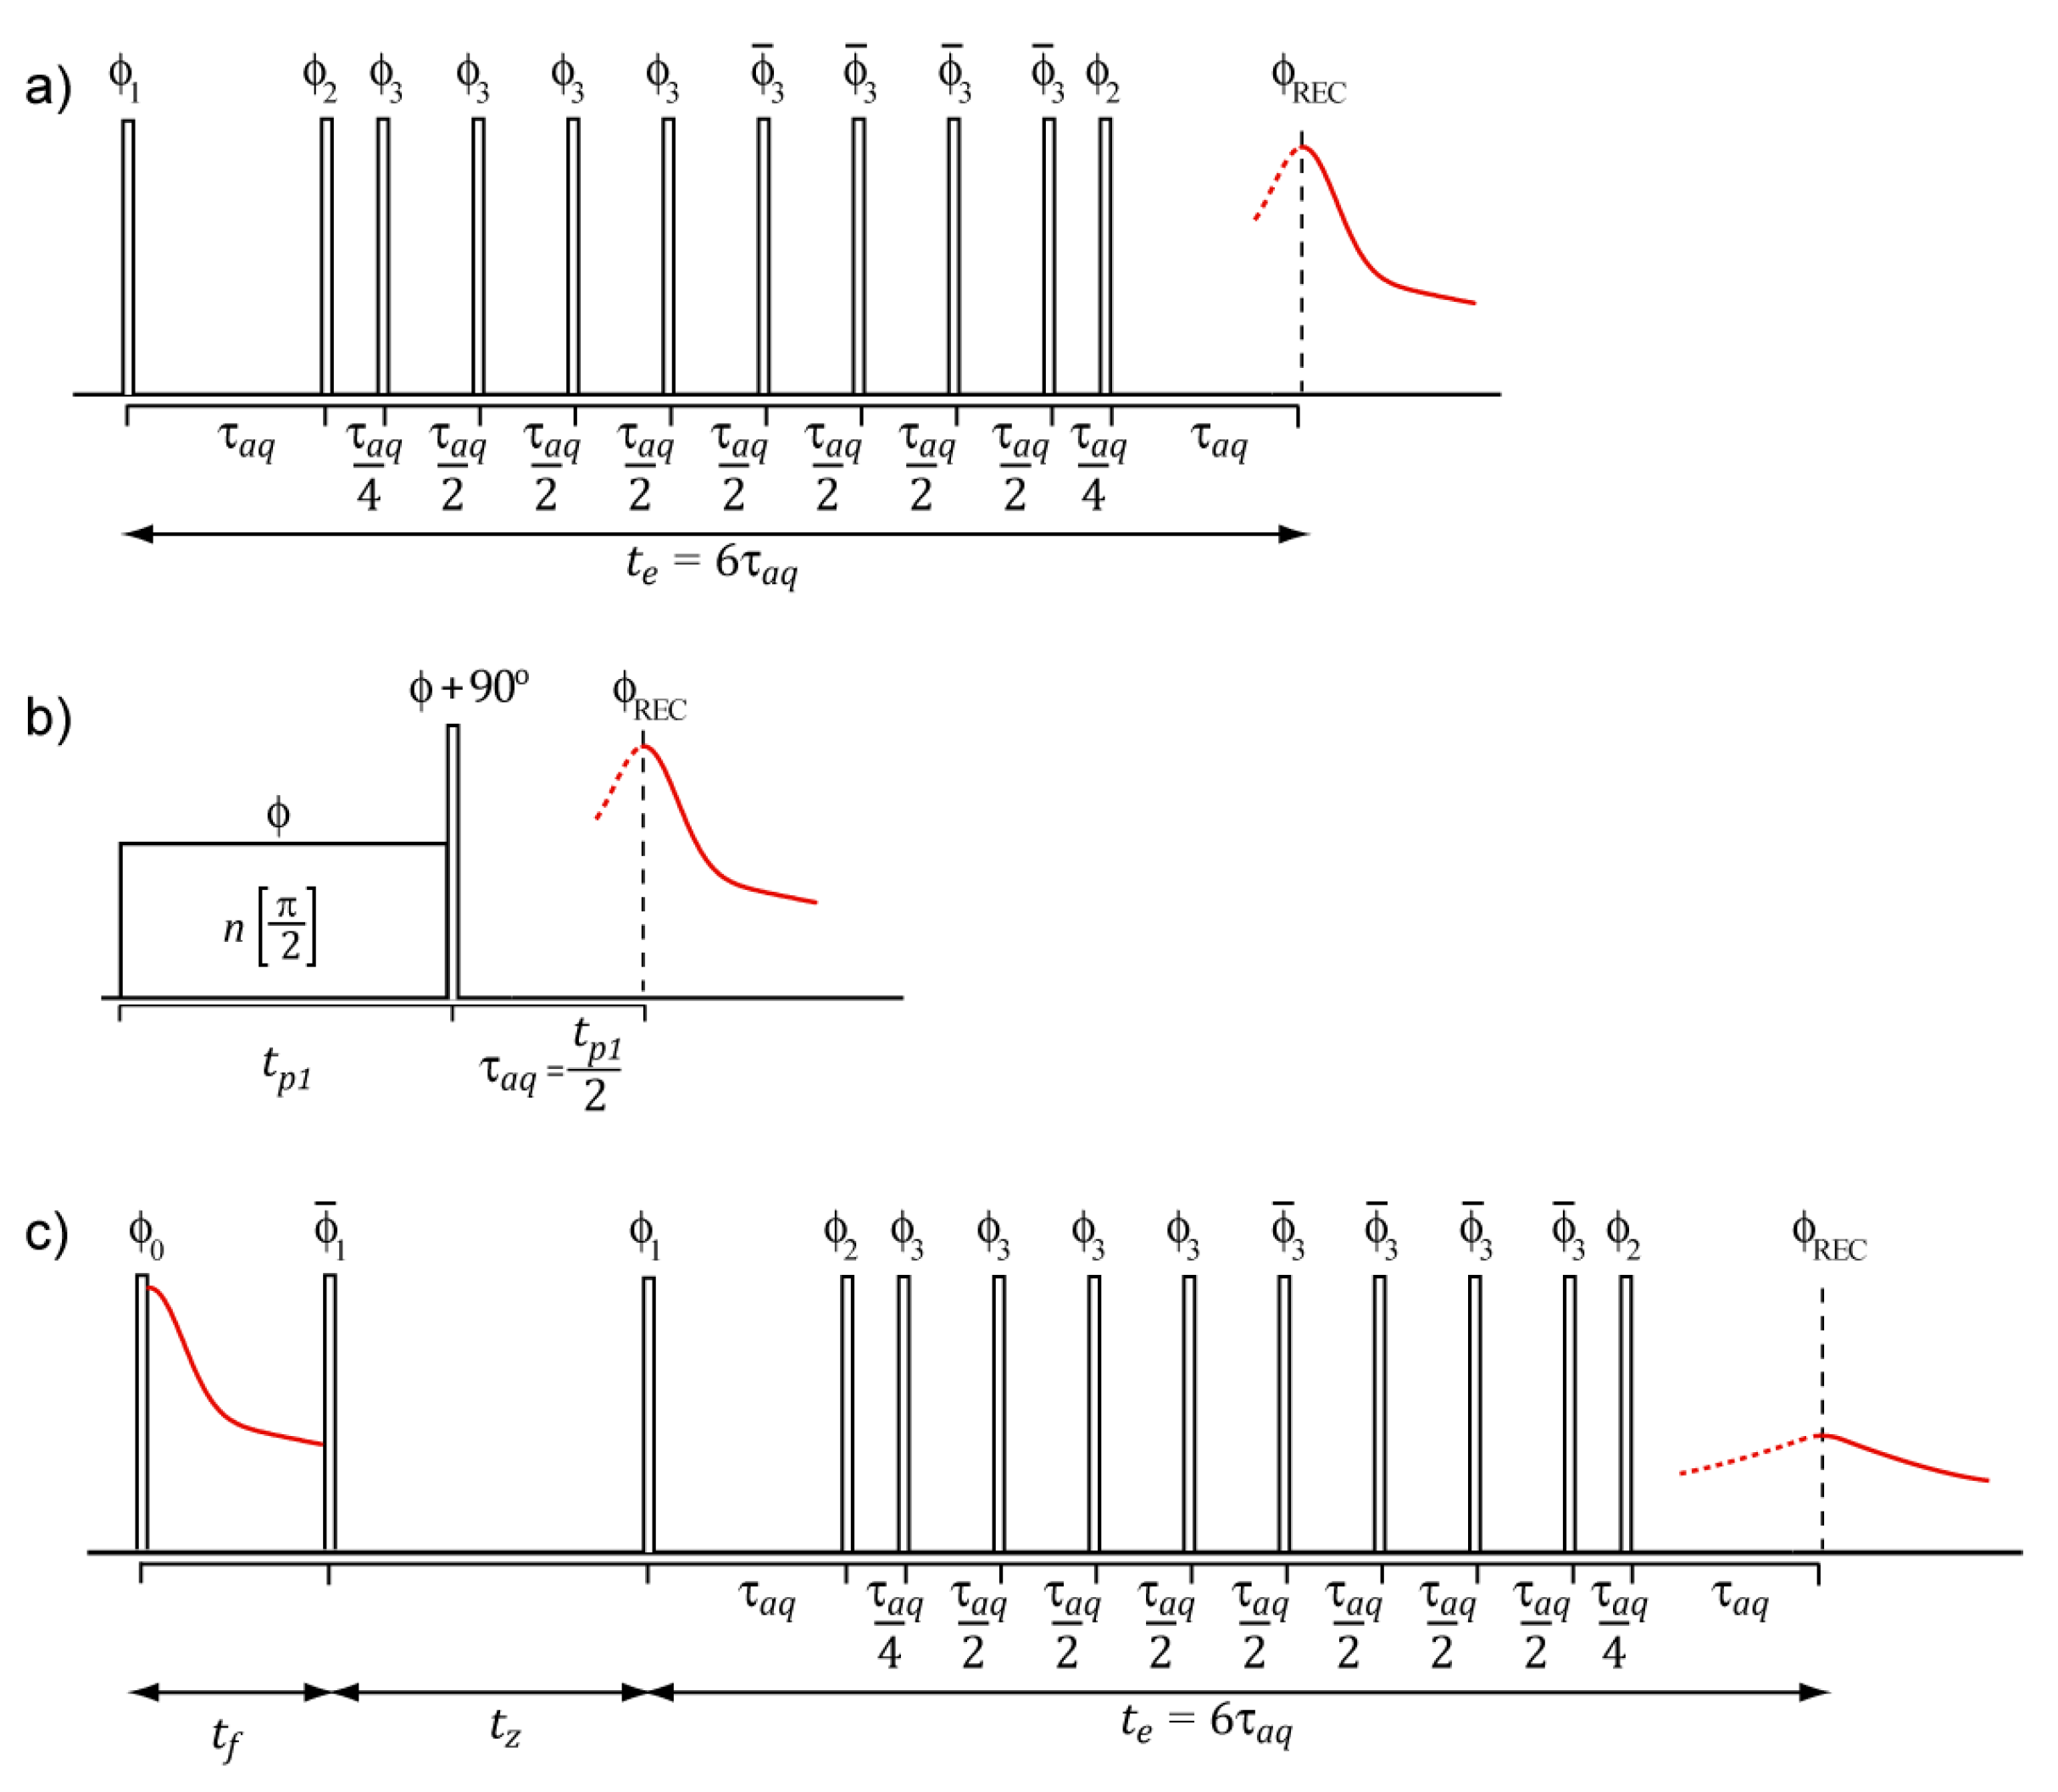


