
Quantification of Zonisamide in Dried Blood Spots and Dried Plasma Spots by UPLC–MS/MS: Application to Clinical Practice

 ,
,
Abstract
:
1. Introduction
2. Materials and Methods
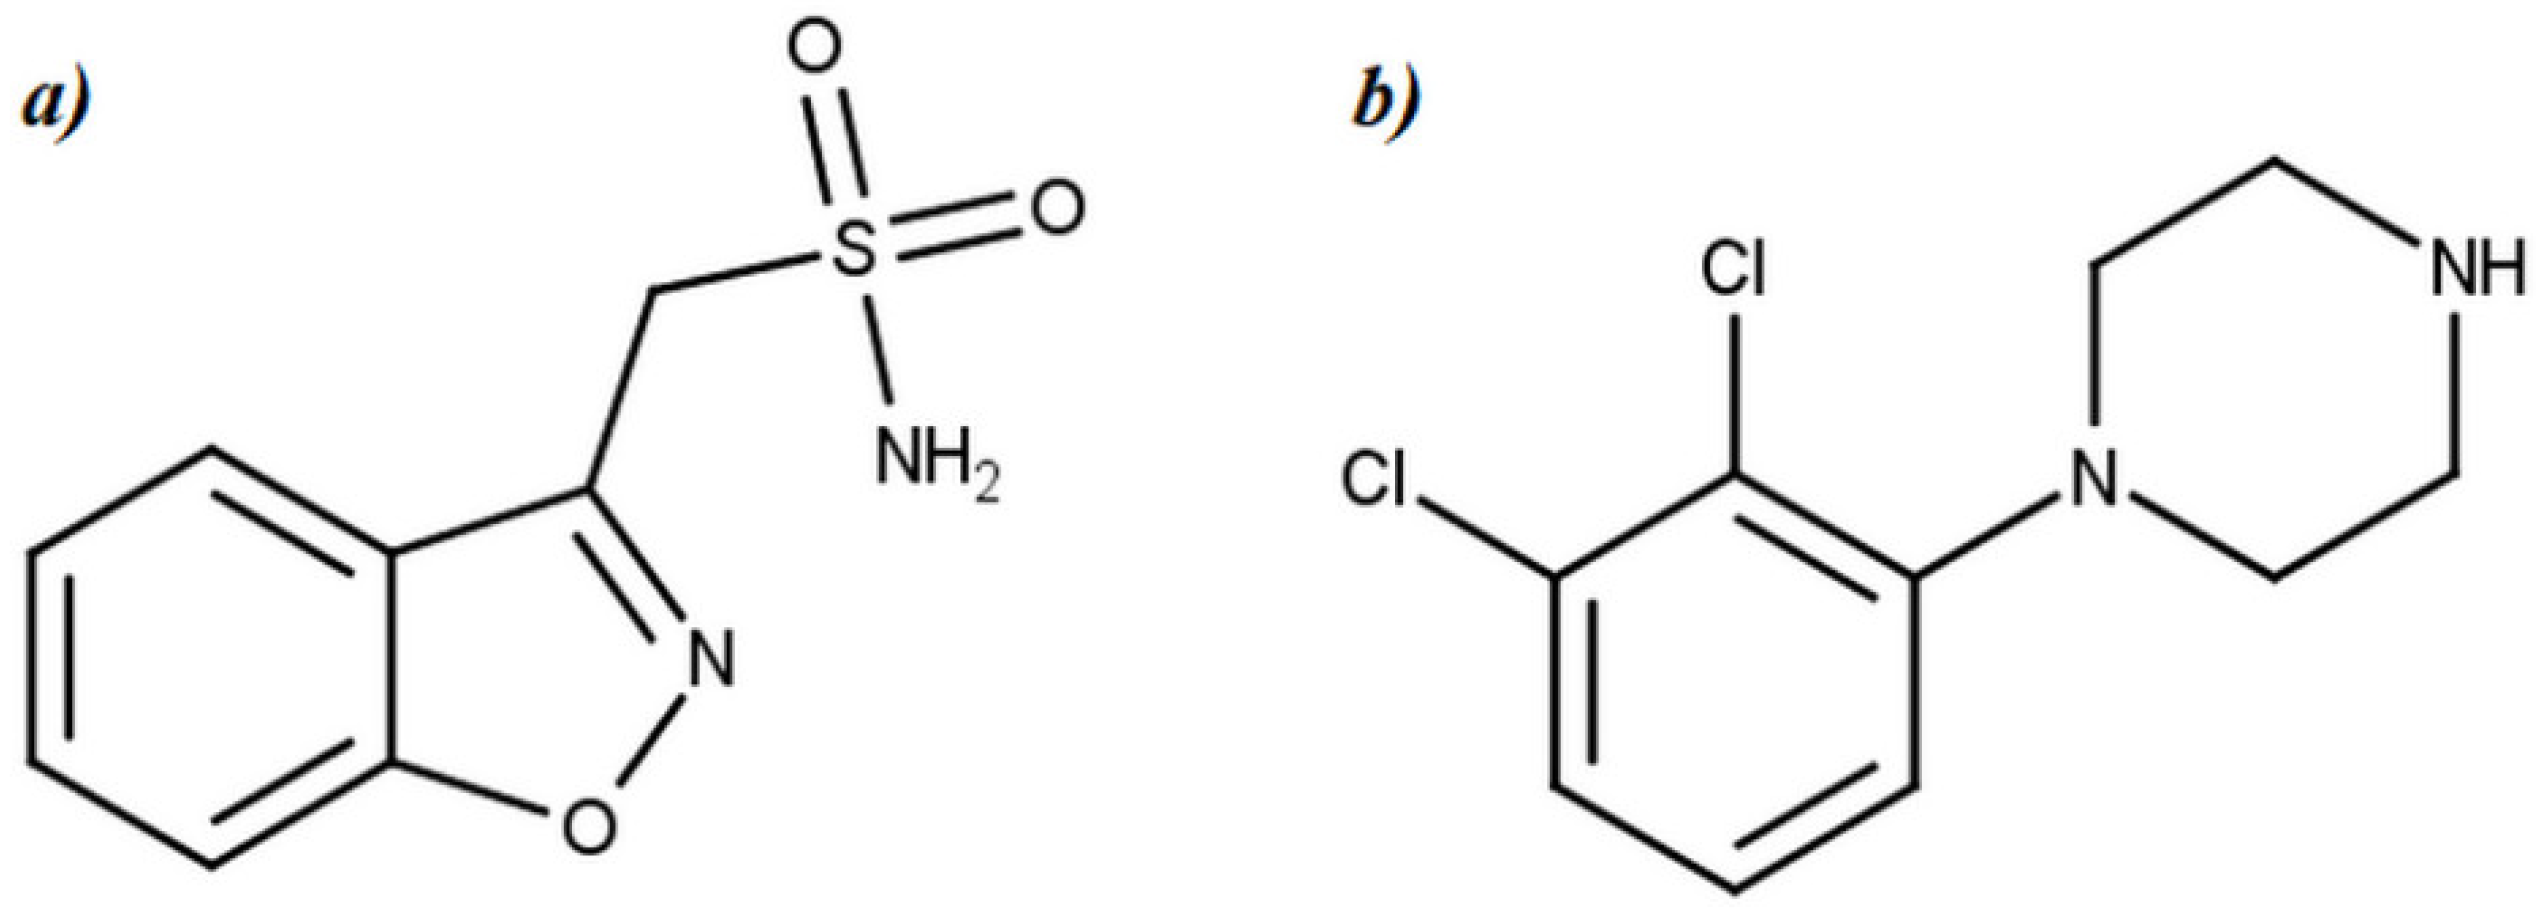
2.1. Chemicals and Materials
2.2. Instrumentation
2.3. Software
2.4. Sample Preparation
2.4.1. Preparation of Calibration Standards and Quality Control Samples
2.4.2. Preparation of Blood Samples of Target/Desired Hematocrit Values
2.4.3. Preparation of Dried Plasma Spot and Dried Blood Spot
2.4.4. Analytical Sample Preparation
2.5. Dried Plasma Spot and Dried Blood Spot Scanning and Spot Area Determination Procedure
2.6. Patients’ Sample Collection
3. Results and Discussion
3.1. MS and MRM Method Development
3.2. UHPLC Method Development
3.3. UHPLC–MS/MS Method Validation
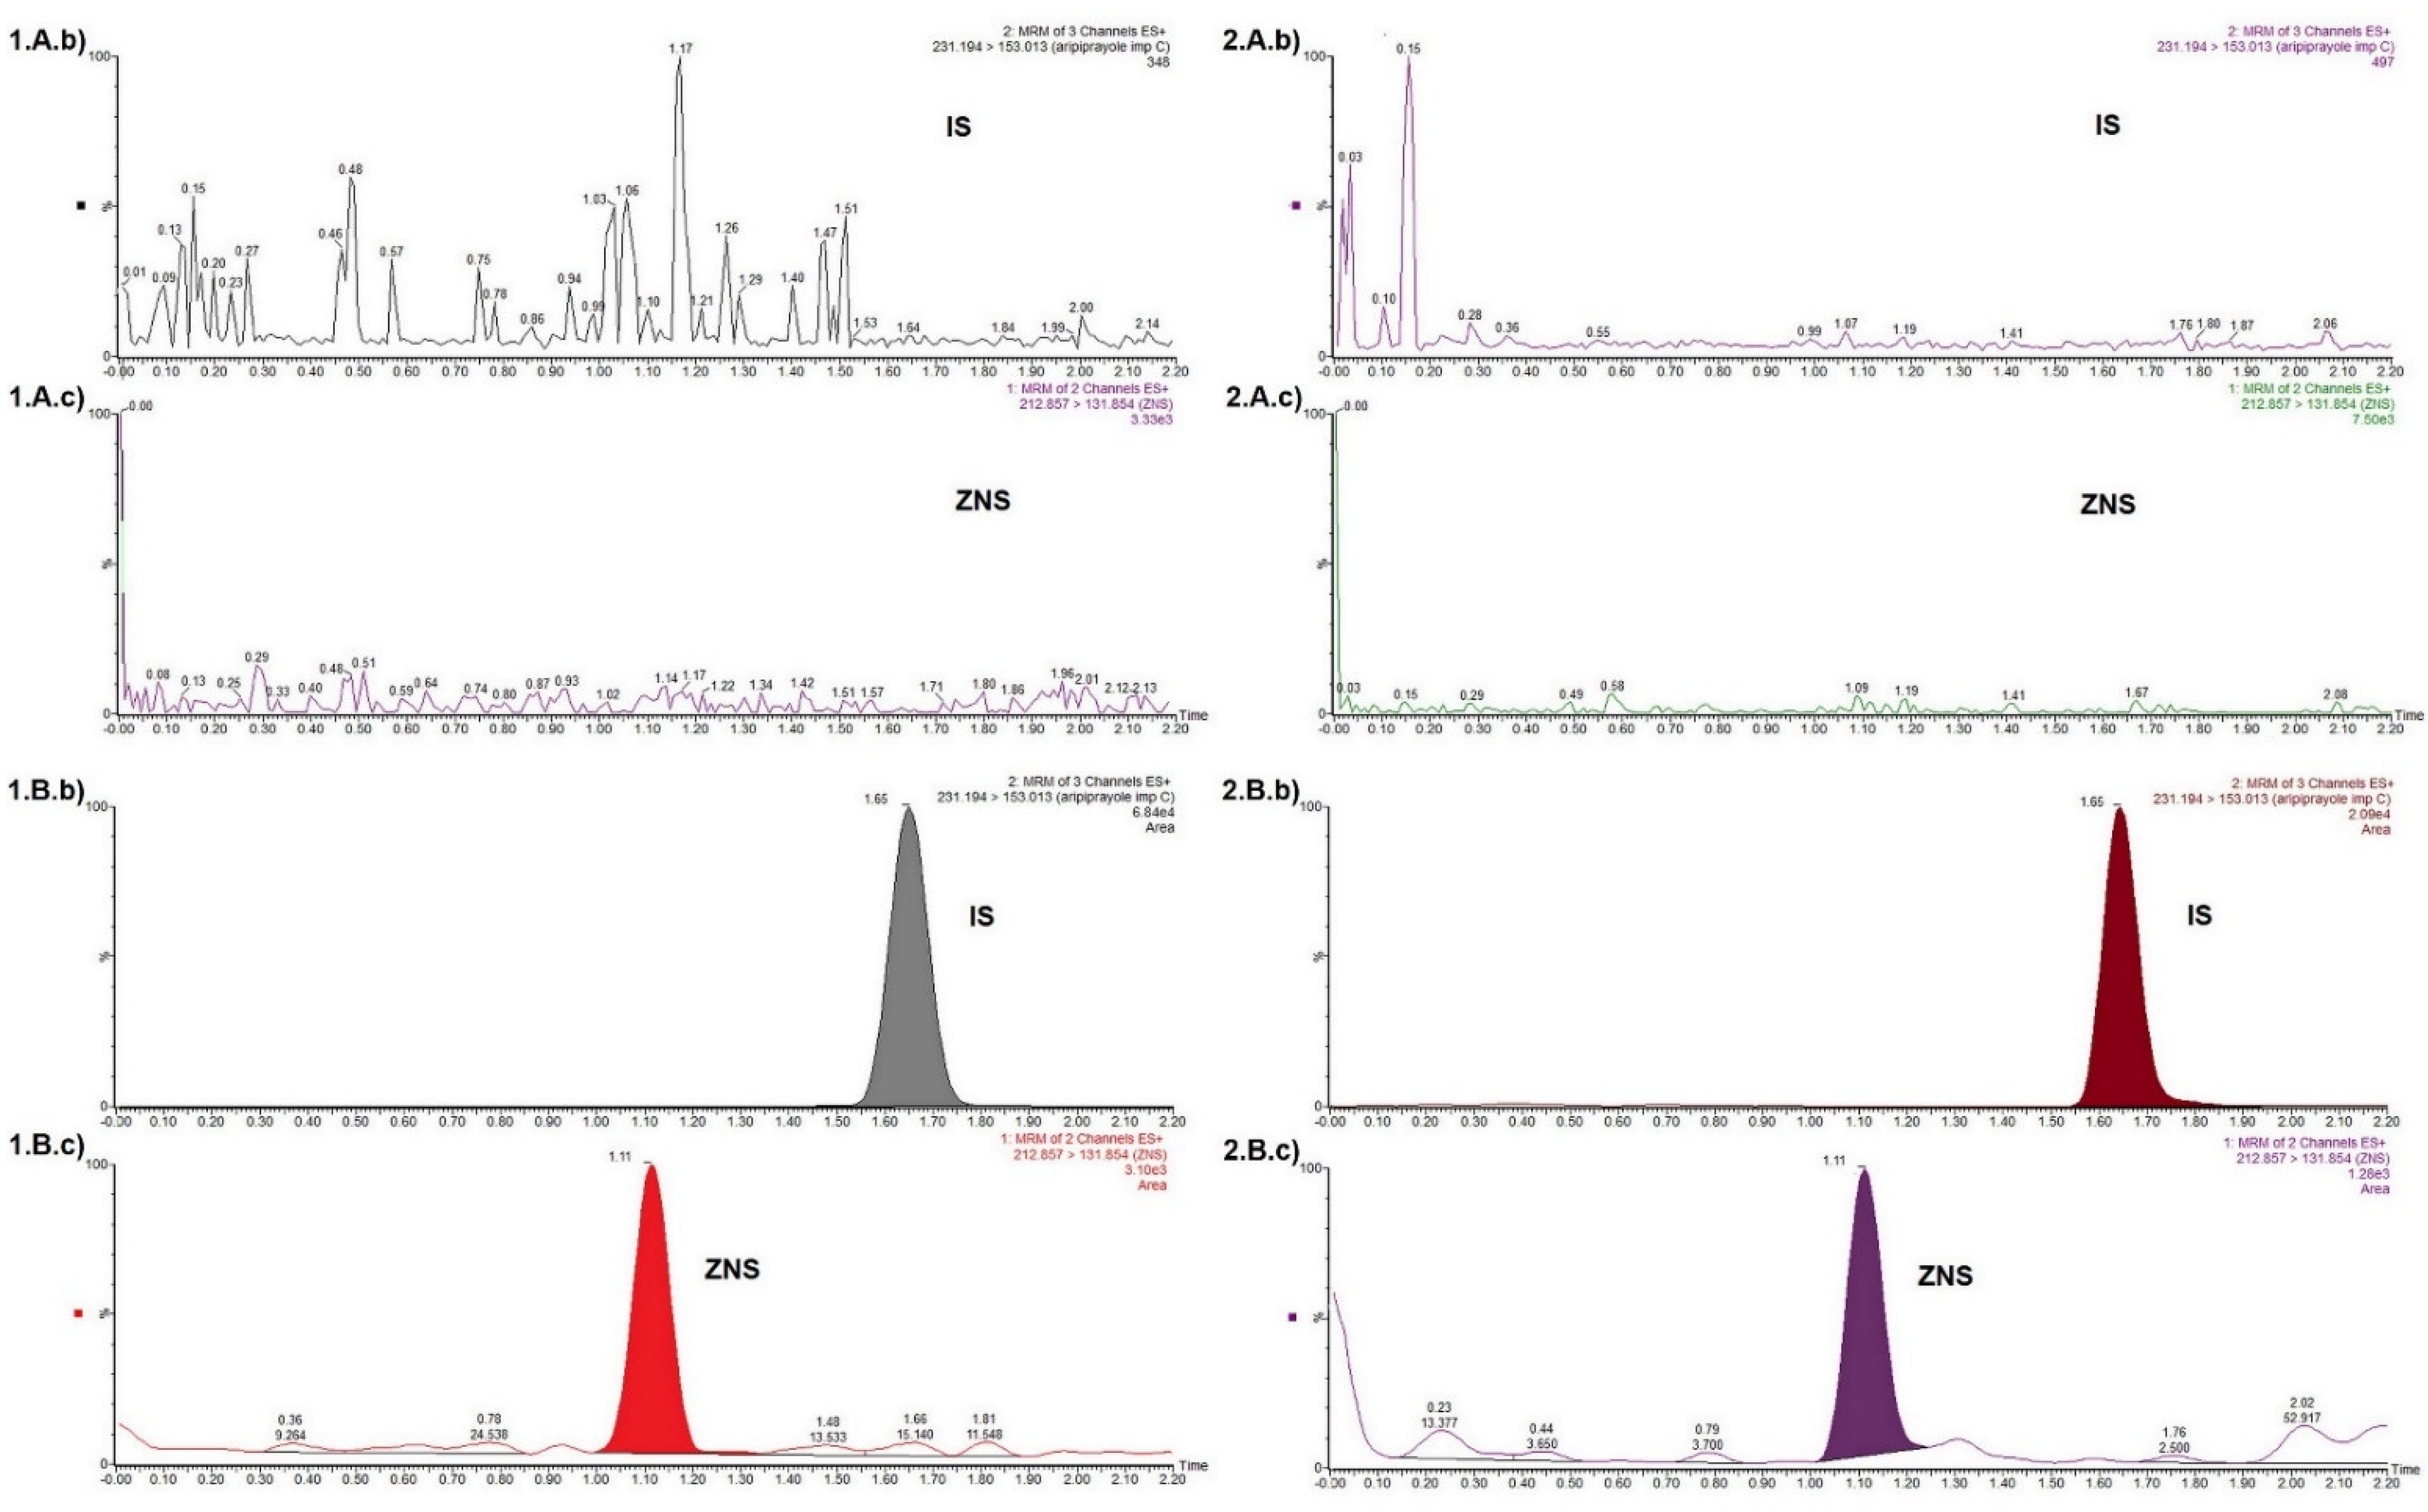
3.3.1. Selectivity
3.3.2. Calibration Curves for ZNS Quantification in DPS and DBS
3.3.3. Carry-Over
3.3.4. Accuracy and Precision
3.3.5. Matrix Effect
3.3.6. Recovery
3.3.7. Stability Testing
3.3.8. Dilution Integrity
3.3.9. Homogeneity (Matrix Spot Homogeneity and Matrix Spot Volume Homogeneity)
3.3.10. Additional/Miscellaneous Tests
3.3.11. Incurred Sample Reanalysis
3.4. Greenness of Developed UHPLC–MS/MS Method
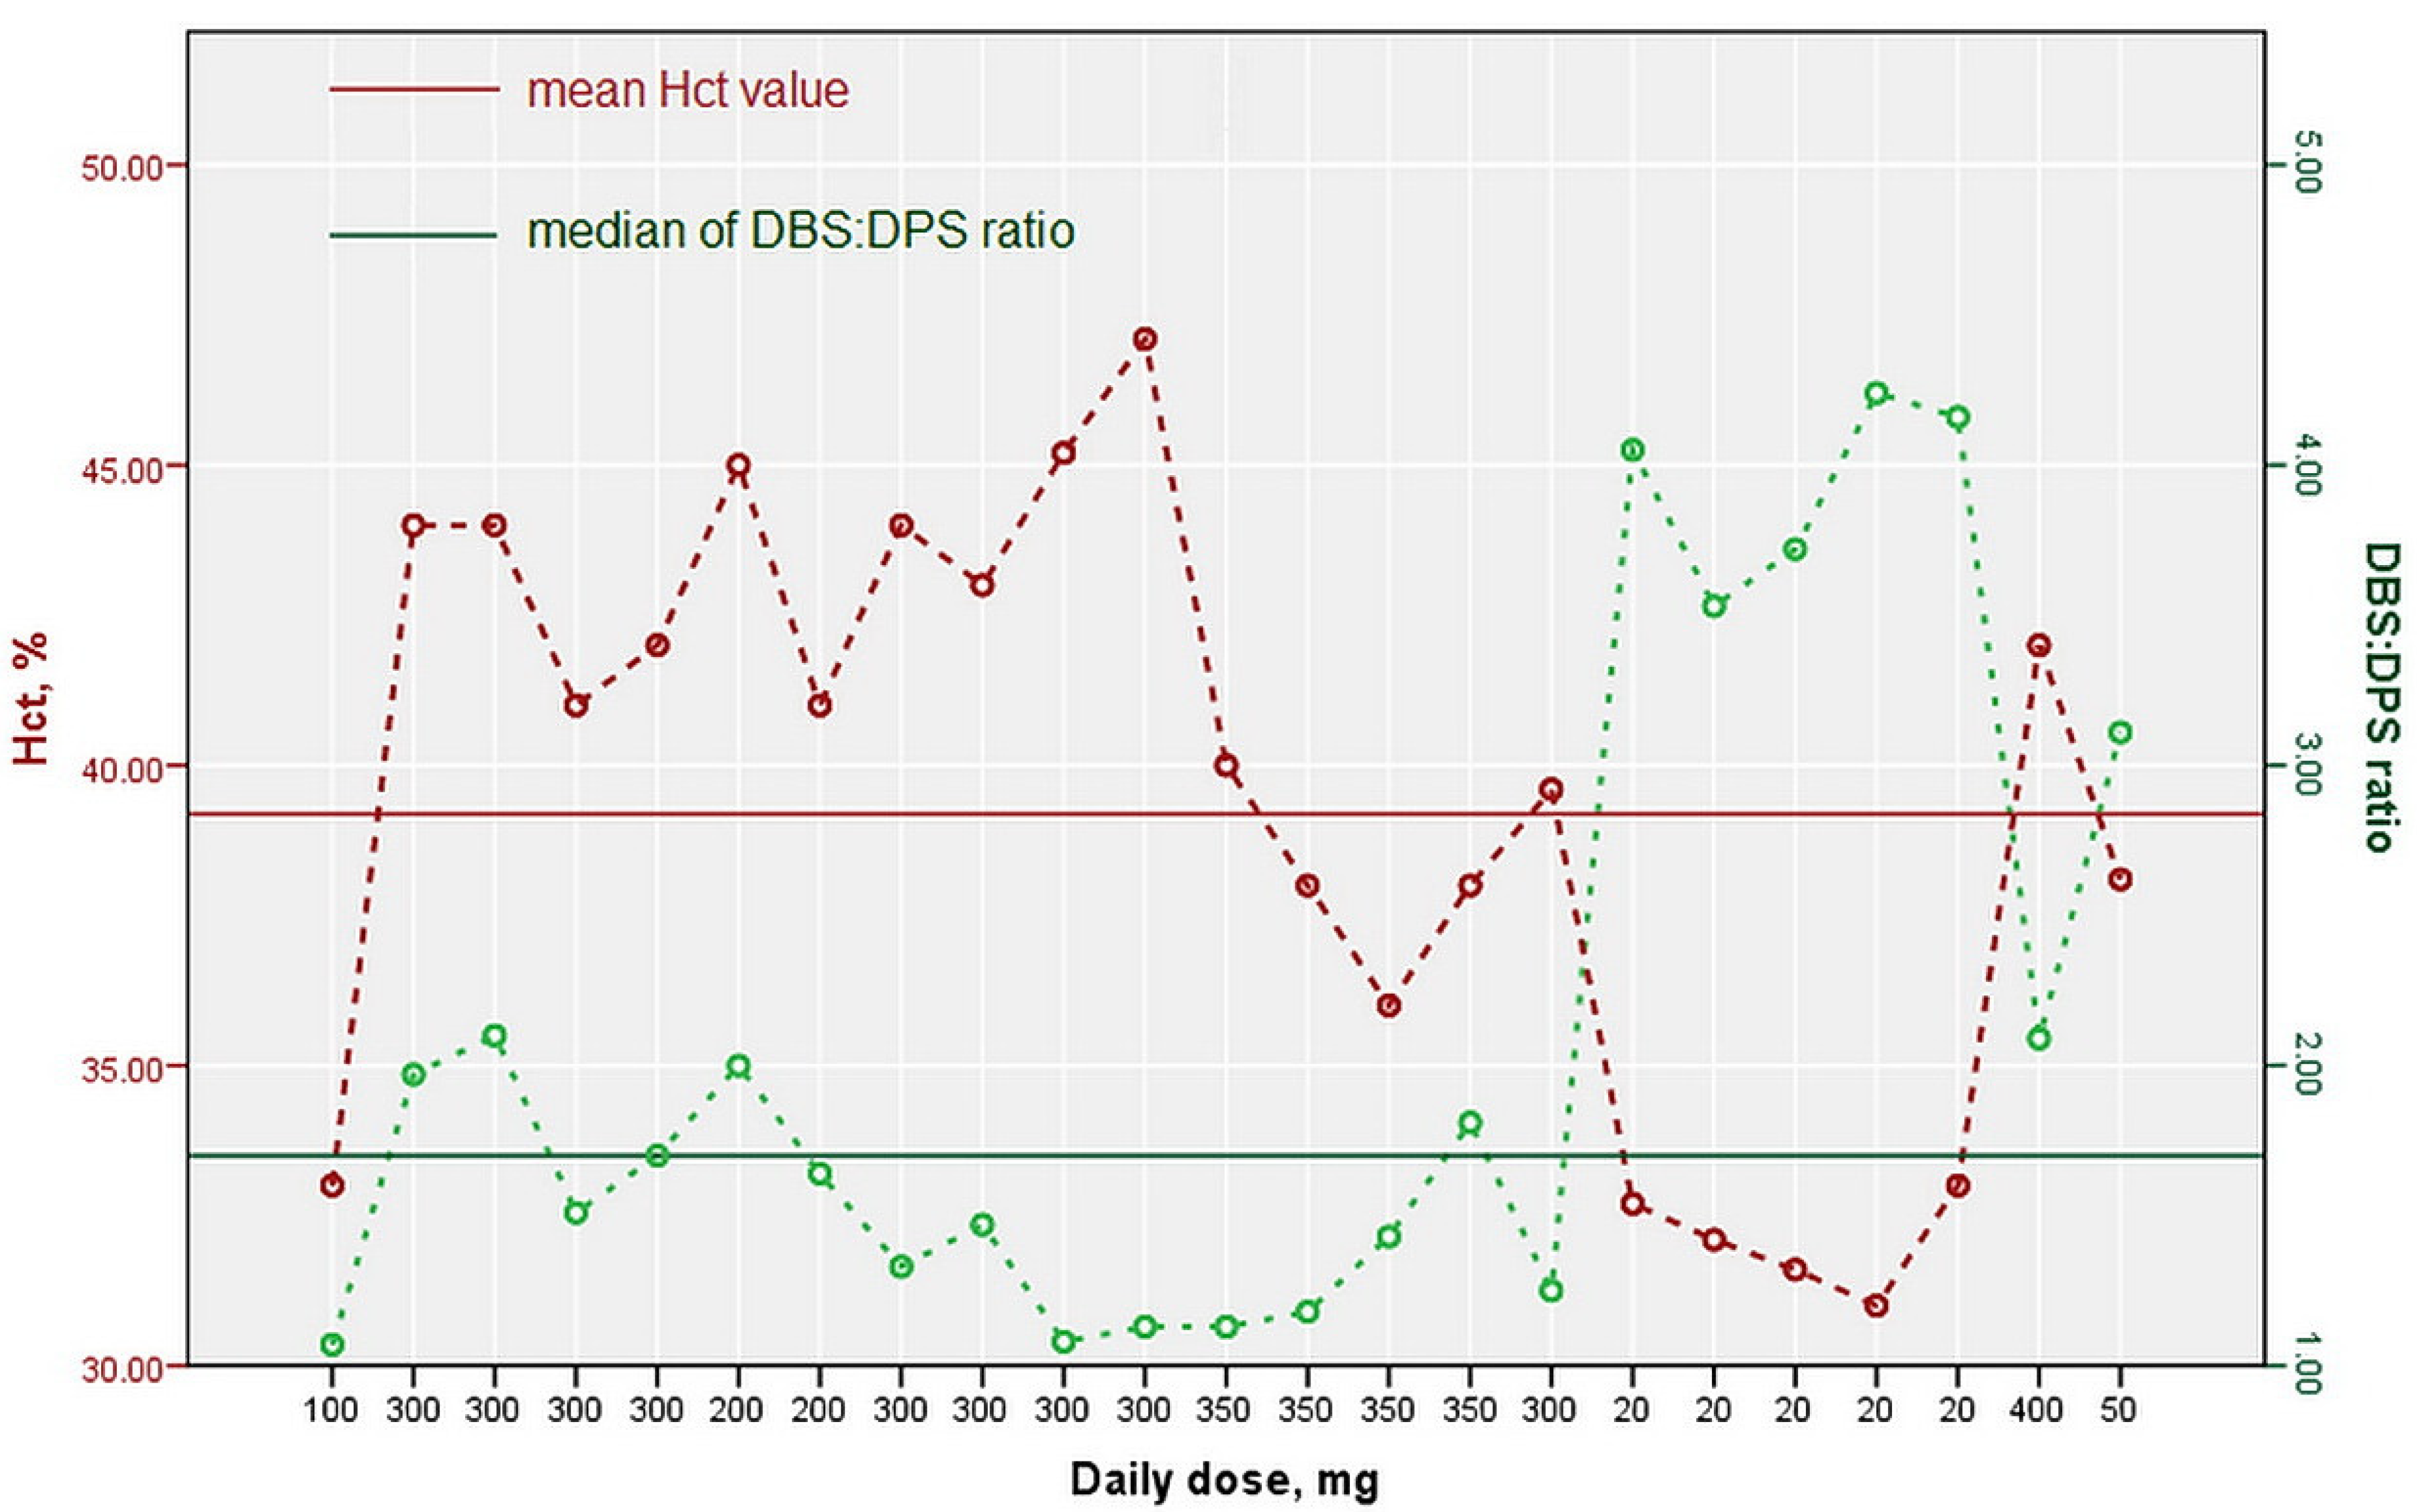
3.5. Analysis of Patients’ DMSs
4. Conclusions
Supplementary Materials
Author Contributions
Funding
Institutional Review Board Statement
Informed Consent Statement
Data Availability Statement
Conflicts of Interest
Sample Availability
References
- Stiff, D.D.; Robicheau, J.T.; Zemaitis, M.A. Reductive metabolism of the anticonvulsant agent zonisamide, a 1,2-benzisoxazole derivative. Xenobiotica 1992, 22, 1–11. [Google Scholar] [CrossRef] [PubMed]
- Leppik, I.E. Zonisamide: Chemistry, mechanism of action, and pharmacokinetics. Seizure 2004, 13, S5–S9. [Google Scholar] [CrossRef] [PubMed] [Green Version]
- Juenke, J.M.; Brown, P.I.; Urry, F.M.; McMillin, G.A. Drug Monitoring and Toxicology: A Procedure for the Monitoring of Levetiracetam and Zonisamide by HPLC-UV. J. Anal. Toxicol. 2006, 30, 27–30. [Google Scholar] [CrossRef] [PubMed] [Green Version]
- Nakamura, M.; Hirade, K.; Sugiyama, T.; Katagiri, Y. High-performance liquid chromatographic assay of zonisamide in human plasma using a non-porous silica column. J. Chromatogr. B Biomed. Sci. Appl. 2001, 755, 337–341. [Google Scholar] [CrossRef]
- Subramanian, M.; Birnbaum, A.K.; Remmel, R.P. High-Speed Simultaneous Determination of Nine Antiepileptic Drugs Using Liquid Chromatography-Mass Spectrometry. Ther. Drug Monit. 2008, 30, 347–356. [Google Scholar] [CrossRef] [PubMed]
- Kim, K.-B.; Seo, K.-A.; Kim, S.-E.; Bae, S.K.; Kim, D.-H.; Shin, J.-G. Simple and accurate quantitative analysis of ten antiepileptic drugs in human plasma by liquid chromatography/tandem mass spectrometry. J. Pharm. Biomed. Anal. 2011, 56, 771–777. [Google Scholar] [CrossRef]
- Matar, K.M. A simple and accurate liquid chromatography–tandem mass spectrometry method for quantification of zonisamide in plasma and its application to a pharmacokinetic study. J. Chromatogr. B 2014, 961, 103–109. [Google Scholar] [CrossRef]
- Palte, M.J.; Basu, S.S.; Dahlin, J.L.; Gencheva, R.; Mason, D.; Jarolim, P.; Petrides, A.K. Development and Validation of an Ultra-Performance Liquid Chromatography–Tandem Mass Spectrometry Method for the Concurrent Measurement of Gabapentin, Lamotrigine, Levetiracetam, Monohydroxy Derivative of Oxcarbazepine, and Zonisamide Concentrations in Serum in a Clinical Setting. Ther. Drug Monit. 2018, 40, 469–476. [Google Scholar] [CrossRef] [PubMed]
- Baldelli, S.; Cattaneo, D.; Giodini, L.; Baietto, L.; Di Perri, G.; D’Avolio, A.; Clementi, E. Development and validation of a HPLC-UV method for the quantification of antiepileptic drugs in dried plasma spots. Clin. Chem. Lab. Med. (CCLM) 2015, 53, 435–444. [Google Scholar] [CrossRef] [PubMed]
- Rmandić, M.; Dotsikas, Y.; Malenović, A. Identification of the factors affecting the consistency of DBS formation via experimental design and image processing methodology. Microchem. J. 2018, 145, 1003–1010. [Google Scholar] [CrossRef]
- U.S. Food and Drug Administration (FDA). Guidance for Industry, Bioanalytical Method Validation. Available online: https://www.fda.gov/files/drugs/published/Bioanalytical-Method-Validation-Guidance-for-Industry.pdf (accessed on 21 December 2019).
- European Medicines Agency EMA. Guideline on Bioanalytical Method Validation. Available online: https://www.ema.europa.eu/en/documents/scientific-guideline/guideline-bioanalytical-method-validation_en.pdf (accessed on 21 December 2019).
- International Council for Harmonisation of Technical Requirements for Pharmaceuticals for Human. ICH Guideline M10 on Bioanalytical Method Validation, ICH Guideline M10 Step2b on Bioanalytical Method Validation. Available online: https://www.ema.europa.eu/en/documents/scientific-guideline/draft-ich-guideline-m10-bioanalytical-method-validation-step-2b_en.pdf (accessed on 21 December 2019).
- Timmerman, P.; White, S.; Globig, S.; Ludke, S.; Brunet, L.; Smeraglia, J. EBF recommendation on the validation of bioanalytical methods for dried blood spots. Bioanalysis 2011, 3, 1567–1575. [Google Scholar] [CrossRef] [PubMed] [Green Version]
- Pena-Pereira, F.; Wojciech Wojnowski, W.; Tobiszewski, M. AGREE Analytical GREEnness Metric Approach and Software. Anal Chem. 2020, 92, 10076–10082. [Google Scholar] [CrossRef] [PubMed]
- Zonegran Scientific Discusion. Zonegran, INN-Zonisamide. Available online: https://www.ema.europa.eu/en/documents/product-information/zonegran-epar-product-information_en.pdf (accessed on 3 January 2020).
- D’Urso, A.; Rudge, J.; Patsalos, P.N.; Ugo de Grazia, U. Volumetric Absorptive Microsampling: A New Sampling Tool for Therapeutic Drug Monitoring of Antiepileptic Drugs. Ther. Drug. Monit. 2019, 41, 681–692. [Google Scholar] [CrossRef] [PubMed]
- Volumetric Absorptive Microsampling (VAMS) and LC–MS/MS Analysis for Simultaneous Monitoring of 16 Antiepileptic Drugs: Workflow Development and Validation. Available online: https://www.neoteryx.com/hubfs/Content/Conference_Presentations/MSACL%20EU%2017/de%20Grazia_VAMS%20for%20Monitoring%2016%20Anti-epileptic%20Drugs%20(MSACL%20EU%2017).pdf (accessed on 5 May 2022).


| Analyte | Molecular Ion, m/z | Production, m/z | Collision Energy (V) | Cone Voltage (V) | Capillary Voltage (kV) |
|---|---|---|---|---|---|
| Zonisamide | 212.86 | 131.85 * | 16 | 30 | 3.8 |
| 76.95 | 30 | 30 | 3.8 | ||
| (1-(2,3-dichlorphenyl) piperazine)-IS | 231.19 | 153.01 * | 22 | 42 | 3.8 |
| 117.15 | 46 | 42 | 3.8 |
| DPS | |||||
| Linear Regression Models | Weighting Factor | r | The Largest%RE * for Non-LLOQ Concentrations, % | % RE * for the LLOQ Concentration, % | |
| a | b | ||||
| 0.20506 | 0.03649 | 1/x2 | 0.994 | 14.3% | 2.13% |
| 0.18083 | 0.03579 | 1/x2 | 0.994 | 13.3% | 0.90% |
| 0.19246 | 0.02097 | 1/x2 | 0.993 | 14.3% | 3.79% |
| 0.15495 | 0.03605 | 1/x2 | 0.998 | 6.73% | 2.84% |
| DBS, Hct 42% | |||||
| Linear Regression Models | Weighting Factor | r | The Largest%RE * for Non-LLOQ Concentrations, % | % RE * for the LLOQ Concentration, % | |
| a | b | ||||
| 0.12987 | 0.00829 | 1/x2 | 0.991 | 13.7 | 0.09 |
| 0.25000 | −0.00509 | 1/x2 | 0.9990 | 6.24 | 3.04 |
| 0.25522 | 0.02071 | 1/x2 | 0.992 | 12.9 | 3.64 |
| 0.34892 | 0.016996 | 1/x2 | 0.995 | 14.4 | 7.51 |
| Accuracy And Precision Testing | ||||||||||
|---|---|---|---|---|---|---|---|---|---|---|
| Within-run accuracy and precision | Dried Plasma Samples (DPS) | Dried Blood Samples (DBS) | ||||||||
| Analytical run | LLOQ 0.250 µg/mL | Low QC1 0.750 µg/mL | Medium QC2 7.5 µg/mL | High QC338µg/mL | LLOQ 0.125 µg/mL | Low QC1 0.375 µg/mL | Medium QC2 3.75 µg/mL | High QC3 19 µg/mL | ||
| I | <Cdet.>, µg/mL | 0.242 | 0.693 | 6.67 | 33.45 | 0.134 | 0.411 | 4.08 | 19.71 | |
| <bias>,% | −3.21 | −7.55 | −11.11 | −11.98 | 6.90 | 9.60 | 8.74 | 3.76 | ||
| SD,µg/mL | 0.021 | 0.051 | 0.17 | 0.42 | 0.011 | 0.021 | 0.158 | 1.85 | ||
| RSD,% | 8.64 | 7.40 | 2.62 | 1.26 | 8.41 | 5.18 | 3.87 | 9.39 | ||
| II | <Cdet.>, µg/mL | 0.248 | 0.707 | 7.11 | 33.72 | 0.127 | 0.361 | 3.77 | 19.76 | |
| <bias>,% | −0.86 | −5.76 | −5.19 | −11.26 | 1.87 | 3.76 | 0.60 | 3.98 | ||
| SD,µg/mL | 0.039 | 0.065 | 0.46 | 0.62 | 0.020 | 0.032 | 0.461 | 1.5034 | ||
| RSD,% | 15.85 | 9.25 | 6.45 | 1.85 | 15.37 | 8.82 | 12.23 | 7.61 | ||
| III | <Cdet.>, µg/mL | 0.246 | 0.779 | 7.64 | 35.14 | 0.117 | 0.391 | 4.12 | 19.92 | |
| <bias>,% | −1.62 | 3.92 | 1.85 | 0.40 | −6.67 | 4.34 | 9.82 | 4.85 | ||
| SD,µg/mL | 0.037 | 0.040 | 0.36 | 1.67 | 0.012 | 0.045 | 0.212 | 2.014 | ||
| RSD,% | 14.98 | 5.15 | 4.75 | 4.75 | 9.92 | 11.53 | 5.15 | 10.11 | ||
| Between-run accuracy and precision | LLOQ 0.250 µg/mL | Low QC1 0.750 µg/mL | Medium QC2 7.5 µg/mL | High QC3 38 µg/mL | LLOQ 0.125 µg/mL | Low QC1 0.375 µg/mL | Medium QC2 3.75 µg/mL | High QC3 19 µg/mL | ||
| <Cdet.>, µg/mL | 0.245 | 0.727 | 7.14 | 34.10 | 0.126 | 0.388 | 3.99 | 19.80 | ||
| <bias>,% | −1.90 | −3.13 | −4.81 | −10.26 | 0.70 | 3.39 | 6.39 | 4.20 | ||
| SD,µg/mL | 0.031 | 0.063 | 0.52 | 1.24 | 0.015 | 0.038 | 0.326 | 1.671 | ||
| RSD,% | 12.63 | 8.67 | 7.35 | 3.65 | 12.21 | 9.84 | 8.17 | 8.44 | ||
| n | 15 | 15 | 15 | 15 | 15 | 15 | 15 | 15 | ||
| DBS | ||||||||
| MFZNS * % | MFIS * % | MFZNS/MFIS % | MP <Cc> * µg/mL | MP CZNS RSD, % | MA <Cc> µg/mL | MA CZNS RSD, % | CZNS bias, % | |
| low QC 0.375 µg/mL | 110.11 | 108.26 | 101.72 | 0.417 | 3.73 | 0.409 | 4.33 | 2.85 |
| medium QC 3.75 µg/mL | 91.55 | 91.02 | 100.58 | 4.19 | 2.51 | 4.15 | 6.61 | 0.90 |
| high QC 19 µg/mL | 99.12 | 95.41 | 103.89 | 21.19 | 4.24 | 20.63 | 5.31 | 2.70 |
| n | 3 | |||||||
| DPS | ||||||||
| MFZNS * % | MFIS * % | MFZNS/MFIS % | MP <Cc> * µg/mL | MP CZNS RSD, % | MA <Cc> µg/mL | MA CZNS RSD, % | CZNS bias, % | |
| low QC 0.750 µg/mL | 102.26 | 99.44 | 102.84 | 0.832 | 2.25 | 0.804 | 7.27 | 3.58 |
| medium QC 7.5 µg/mL | 93.92 | 96.62 | 97.21 | 8.17 | 4.77 | 8.41 | 1.16 | −2.84 |
| high QC 38 µg/mL | 100.11 | 102.30 | 97.86 | 40.91 | 6.14 | 41.91 | 3.09 | −2.39 |
| n | 3 | |||||||
| DBS | |||
| ZNS | <RZNS>, % | IS | <RIS>, % |
| low QC 0.375 µg/mL | 103.24 | 20 ng/mL | 101.11 |
| medium QC 3.75 µg/mL | 101.19 | 107.16 | |
| high QC 19 µg/mL | 100.83 | 102.30 | |
| overall <R>, % | 101.75 | overall <R>, % | 103.52 |
| SD | 1.30 | SD | 3.21 |
| RSD, % | 1.28 | RSD, % | 3.10 |
| DPS | |||
| ZNS | <RZNS>, % | IS | <RIS>, % |
| low QC 0.750 µg/mL | 101.62 | 20 ng/mL | 103.19 |
| medium QC 7.5 µg/mL | 95.83 | 99.82 | |
| high QC 38 µg/mL | 94.32 | 99.08 | |
| overall <R>, % | 97.26 | overall <R>, % | 100.70 |
| SD | 3.58 | SD | 2.19 |
| RSD, % | 3.96 | RSD, % | 2.18 |
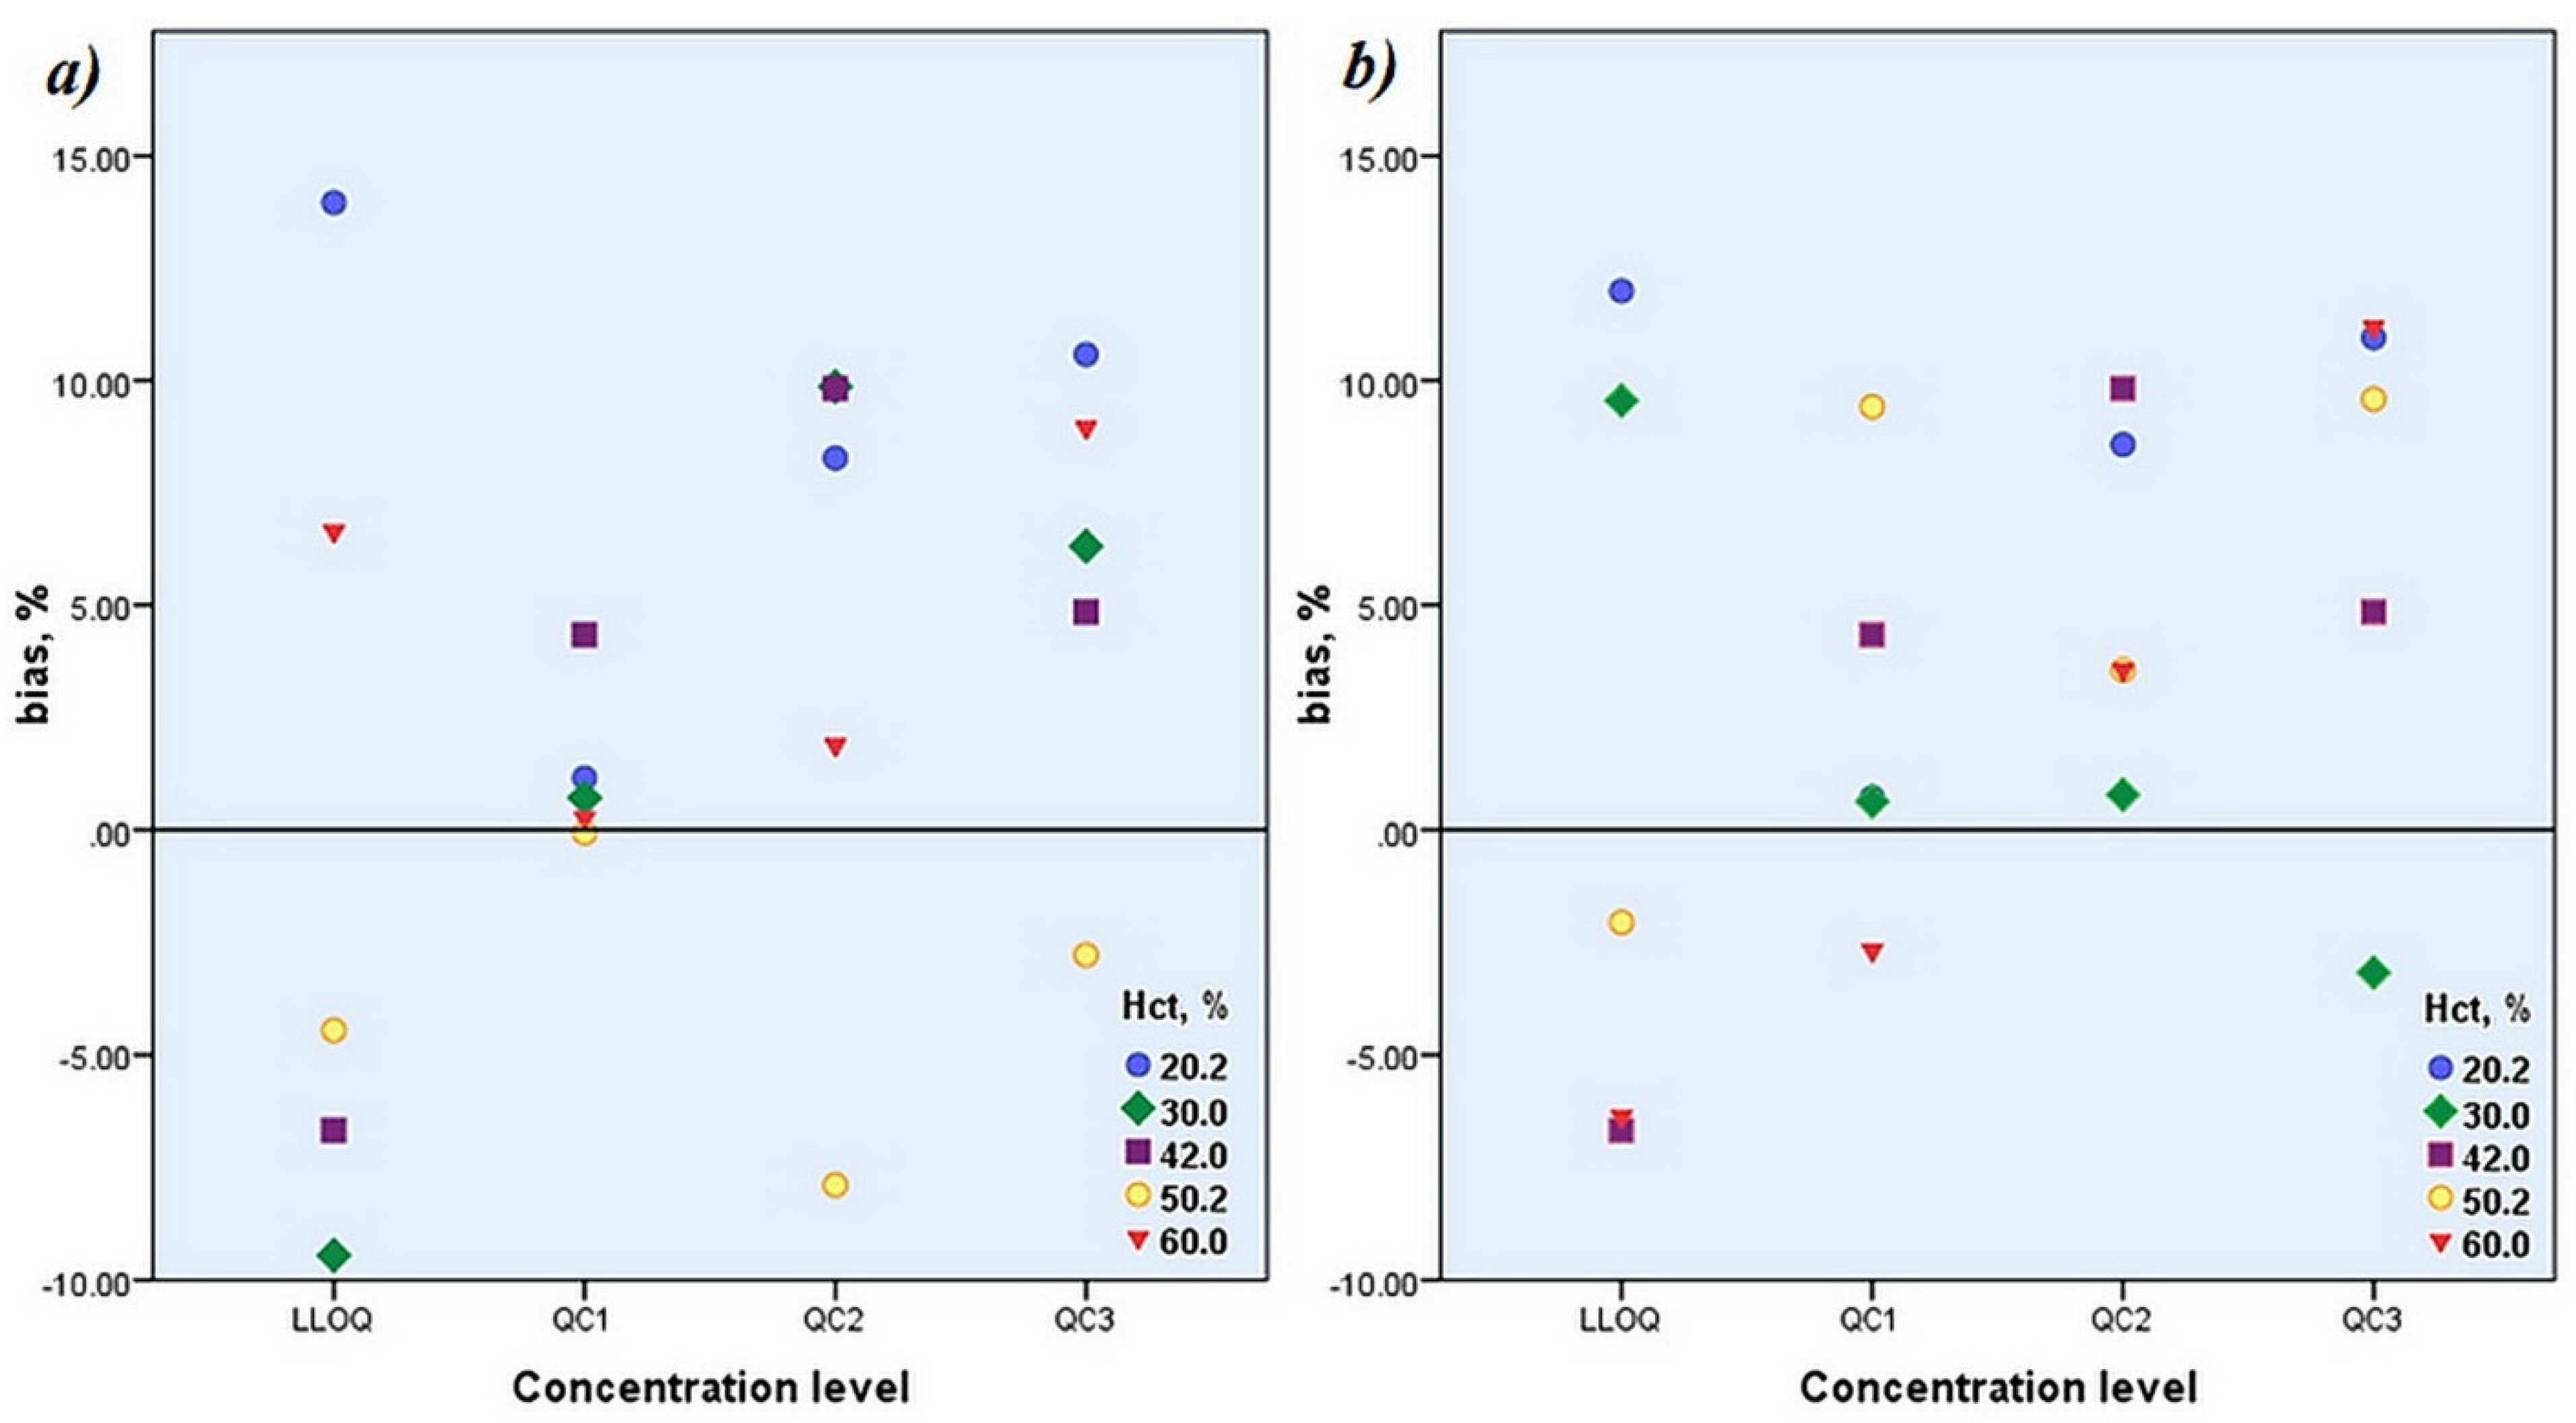
| Hct,% | Linear Regression Model | ||||||
|---|---|---|---|---|---|---|---|
| a | b | w.f. | r | ||||
| 20.2 | 0.25612 | 0.01996 | 1/x2 | 0.9930 | |||
| 30.0 | 0.23202 | 0.02940 | 0.9893 | ||||
| 42.0 | 0.25522 | 0.02071 | 0.9923 | ||||
| 50.2 | 0.28783 | 0.01758 | 0.9933 | ||||
| 60.0 | 0.26068 | 0.01584 | 0.9938 | ||||
| Accuracy and Precision | |||||||
| Conc. level | nominal concentration, µg/mL | Hct,% | bias set 1,% | bias set 2,% | RSD set 1,% | RSD set 2,% | bias set1/set2,% |
| LLOQ | 0.125 | 20.2 | 13.96 | 11.99 | 2.97 | 3.03 | 1.76 |
| QC1 | 0.375 | 1.15 | 0.71 | 2.86 | 2.88 | 0.43 | |
| QC2 | 3.75 | 8.27 | 8.57 | 3.06 | 3.06 | −0.28 | |
| QC3 | 19.0 | 10.58 | 10.95 | 2.58 | 2.58 | −0.34 | |
| LLOQ | 0.125 | 30.0 | −9.45 | 9.55 | 4.86 | 3.65 | −17.34 |
| QC1 | 0.375 | 0.71 | 0.63 | 6.70 | 6.10 | 0.08 | |
| QC2 | 3.75 | 9.86 | 0.78 | 2.05 | 2.03 | 9.01 | |
| QC3 | 19.0 | 6.31 | −3.17 | 7.11 | 7.09 | 9.79 | |
| LLOQ | 0.125 | 42.0 | −6.67 | −6.67 | 9.92 | 0 | |
| QC1 | 0.375 | 4.34 | 4.34 | 11.53 | 0 | ||
| QC2 | 3.75 | 9.82 | 9.82 | 5.15 | 0 | ||
| QC3 | 19 | 4.85 | 4.85 | 10.11 | 0 | ||
| LLOQ | 0.125 | 50.2 | −4.45 | −2.06 | 5.53 | 6.08 | −2.44 |
| QC1 | 0.375 | −0.07 | 9.42 | 5.73 | 5.90 | −8.68 | |
| QC2 | 3.75 | −7.89 | 3.55 | 8.49 | 8.52 | −11.05 | |
| QC3 | 19.0 | −2.78 | 9.58 | 2.79 | 2.79 | −11.28 | |
| LLOQ | 0.125 | 60.0 | 6.64 | −6.37 | 6.63 | 7.71 | 13.90 |
| QC1 | 0375 | 0.27 | −2.68 | 7.38 | 7.77 | 3.03 | |
| QC2 | 3.75 | 1.88 | 3.55 | 8.48 | 8.52 | −1.61 | |
| QC3 | 19.0 | 8.95 | 11.18 | 4.46 | 4.46 | −2.01 | |
| n | 5 | ||||||
| Patient’ Sample Label | Hct,% | Daily Dose, mg | DBS Concentration, µg/mL | DPS Concentration, µg/mL | DBS:DPS Ratio |
|---|---|---|---|---|---|
| 1 | 33.0 | 100 | 30.45 | 28.55 | 1.07 |
| 2 | 44.0 | 300 | 17.89 | 9.10 | 1.97 |
| 3 | 44.0 | 300 | 16.26 | 7.75 | 2.10 |
| 4 | 41.0 | 300 | 23.69 | 15.64 | 1.51 |
| 5 | 42.0 | 300 | 15.01 | 8.81 | 1.70 |
| 6 | 45.0 | 200 | 16.90 | 8.44 | 2.00 |
| 7 | 41.0 | 200 | 13.43 | 8.18 | 1.64 |
| 8_1 | 44.0 | 300 | 18.72 | 14.08 | 1.33 |
| 8_2 | 43.0 | 15.93 | 10.83 | 1.47 | |
| 8_3 | 45.2 | 13.42 | 12.46 | 1.08 | |
| 8_4 | 47.1 | 17.42 | 15.45 | 1.13 | |
| 9_1 | 40.0 | 350 | 26.39 | 23.31 | 1.13 |
| 9_2 | 38.0 | 27.38 | 23.14 | 1.18 | |
| 9_3 | 36.0 | 26.50 | 18.55 | 1.43 | |
| 9_4 | 38.0 | 27.84 | 15.36 | 1.81 | |
| 10 | 39.6 | 300 | 29.62 | 23.74 | 1.25 |
| 11_0 | 32.7 | 20, 40 * | 3.83 | 0.95 | 4.05 |
| 11_1 | 32.1 | 4.41 | 1.25 | 3.53 | |
| 11_2 | 31.6 | 5.52 | 1.48 | 3.72 | |
| 11_3 | 31.0 | 5.55 | 1.31 | 4.24 | |
| 11_4 | 33.0 | 6.01 | 1.45 | 4.16 | |
| 12 | 42.0 | 400 | 79.70 | 38.04 | 2.09 |
| 13 | 38.1 | 50 | 16.66 | 5.36 | 3.11 |
| Overall Descriptive Statistic of Conducted Analysis | |||||
| Hct,% | Daily Dose, mg | DBS Concentration, µg/mL | DPS Concentration, µg/mL | DBS:DPS Ratio | |
| mean ± SD ** | 39.19 ± 4.99 | / | / | / | / |
| range | 31–47.1 | 20–400 | 3.83–79.70 | 0.95–38.04 | 1.07–4.24 |
| median | / | 300 | 16.90 | 10.83 | 1.70 |
| interquartile range | / | 150 i.e., 150–300 | 13.08 i.e., 13.42–26.50 | 13.19 i.e., 0.95–38.04 | 1.86 i.e., 1.25–3.11 |
| n | 23 | 13 | 23 | 23 | 23 |
Publisher’s Note: MDPI stays neutral with regard to jurisdictional claims in published maps and institutional affiliations. |
© 2022 by the authors. Licensee MDPI, Basel, Switzerland. This article is an open access article distributed under the terms and conditions of the Creative Commons Attribution (CC BY) license (https://creativecommons.org/licenses/by/4.0/).
Share and Cite
Rmandić, M.; Stajić, A.; Jančić, J.; Samardžić, J.; Jović, N.; Malenović, A. Quantification of Zonisamide in Dried Blood Spots and Dried Plasma Spots by UPLC–MS/MS: Application to Clinical Practice. Molecules 2022, 27, 4899. https://doi.org/10.3390/molecules27154899
Rmandić M, Stajić A, Jančić J, Samardžić J, Jović N, Malenović A. Quantification of Zonisamide in Dried Blood Spots and Dried Plasma Spots by UPLC–MS/MS: Application to Clinical Practice. Molecules. 2022; 27(15):4899. https://doi.org/10.3390/molecules27154899
Chicago/Turabian StyleRmandić, Milena, Ana Stajić, Jasna Jančić, Janko Samardžić, Nebojša Jović, and Anđelija Malenović. 2022. "Quantification of Zonisamide in Dried Blood Spots and Dried Plasma Spots by UPLC–MS/MS: Application to Clinical Practice" Molecules 27, no. 15: 4899. https://doi.org/10.3390/molecules27154899