Article

Gangliosidome of a Human Hippocampus in Temporal Lobe Epilepsy Resolved by High-Resolution Tandem Mass Spectrometry

by
Raluca Ica
1,2,
Kristina Mlinac-Jerkovic
3,
Katarina Ilic
3,4,
Tomislav Sajko
5,
Cristian V. A. Munteanu
6,
Alina D. Zamfir
1,2 and
Svjetlana Kalanj-Bognar
3,*
1
Department of Condensed Matter, National Institute for Research and Development in Electrochemistry and Condensed Matter, 300224 Timisoara, Romania
2
Faculty of Physics, West University of Timisoara, 300223 Timisoara, Romania
3
Croatian Institute for Brain Research, School of Medicine, University of Zagreb, 10000 Zagreb, Croatia
4
BRAIN Centre, Department of Neuroimaging, Institute of Psychiatry, Psychology and Neuroscience (IOPPN), King’s College London, London SE5 9NU, UK
5
Department of Neurosurgery, University Hospital Sestre Milosrdnice, 10000 Zagreb, Croatia
6
Institute of Biochemistry of the Romanian Academy, Splaiul Independenței 296, 060031 Bucharest, Romania
*
Author to whom correspondence should be addressed.
Molecules 2022, 27(13), 4056; https://doi.org/10.3390/molecules27134056
Submission received: 4 May 2022 / Revised: 17 June 2022 / Accepted: 21 June 2022 / Published: 23 June 2022
(This article belongs to the Special Issue Tandem Mass Spectrometry: Techniques and Applications)

Abstract

:
In this study, we developed a high-resolution tandem mass spectrometry (HR MS) approach to assess presumed changes in gangliosidome of a human hippocampus affected by temporal lobe epilepsy (TLE) in comparison with a normal hippocampus. Gangliosides, membrane glycolipids, are particularly diverse and abundant in the human brain, and participate in ion transport and modulation of neuronal excitability. Changes in structural ganglioside pattern potentially linked to TLE molecular pathogenesis have not been explored in detail. Aiming to characterize TLE-specific gangliosidome, we analyzed the native gangliosides purified from a human hippocampal tissue sample affected by TLE and a control hippocampus using HR MS. Marked differences of ganglioside expression were shown in TLE vs. control, particularly with respect to the sialylation degree of components, discovered as a characteristic feature of TLE. Another major finding is the occurrence of tetrasialofucogangliosides in TLE and species modified by either O-acetylation or CH3COO. Structural analysis by higher-energy collisional dissociation (HCD) MS/MS gave rise to fragmentation patterns implying that the GQ1b (d18:1/18:0) isomer is specifically associated with TLE. Further investigation in a larger sample is needed in order to confirm the discovery of ganglioside structures specifically expressed in human TLE and to provide information on the probable role of gangliosides in the molecular events underlying seizures.

Graphical Abstract

1. Introduction

Gangliosides are sialylated membrane glycosphingolipids, expressed with immense structural diversity and abundance in human central nervous system (CNS) [1,2]. A large number of studies confirmed that specific glycolipidomic patterns of different cell types in CNS is important for the modulation of crucial cellular events involving cell membranes, such as cell proliferation, synaptogenesis, myelination and membrane ion transport [3,4,5]. Ganglioside species which predominate in the mammalian brain are GM1, GD1a, GD1b and GT1b, where they are expressed in a specific regional and temporal manner [6,7,8,9]. The diversity of ganglioside structures provides huge variability of their interactions with other membrane lipids and proteins, influencing membrane dynamics and homeostasis. Thus, the utilization of highly sensitive modern mass spectrometric methods has so far enabled detailed structural characterization of human brain gangliosides, and revealed the presence of novel or modified ganglioside structures viewed as specific pathological, diagnostic markers or potential therapeutic targets [10,11]. Alterations in brain ganglioside composition or metabolism have been found in different neurological and neuropsychiatric conditions and are considered to be involved in complex molecular pathogenesis of neurodegeneration [12,13,14,15]. Certain human diseases such as refractory epilepsy are caused by the deficiency in enzymes involved in ganglioside synthesis [16,17]. Although gangliosides are implicated in modulation of neuronal excitability via interactions with ion transport systems, which is altered during seizures, very few studies refer to changes of brain ganglioside compositional pattern in epilepsy [18]. Regrettably, the potential role of gangliosides in molecular pathogenesis of the most common form of epilepsy in humans, temporal lobe epilepsy (TLE) accompanied by hippocampal sclerosis (HS), has not been explored in detail, mainly because such a project requires both the reliable determination of the ganglioside profile and the molecular structure of the species involved as a prerequisite. Such a profiling demands optimal bioanalytical services and protocols able to detect and characterize individual components in the highly complex TLE ganglioside extract.
Amongst all methods, in the past few years, high-resolution mass spectrometry (HR MS), conducted on instruments incorporating the orbital trap analyzer, has emerged as one of the most powerful and reproducible techniques in targeted and untargeted omics-related workflows. Based on the high analysis speed, sensitivity and resolving power, as well as the excellent derived accuracy in mass measurement, this platform is able to provide information on single species in minute amounts of clinical samples and on structures with a biomarker value, without the need of mixture separation prior to the MS screening. In combination with nanoelectrospray ionization (nanoESI) and an efficient fragmentation procedure such as the high energy collision-induced dissociation (HCD), HR MS recently became a technique capable of mapping, identification and structural characterization of major and minor ganglioside components in native extracts from human brain [19,20]. Several recent studies have also revealed the major role of nanoESI HR MS and MS/MS in the discovery of ganglioside and fucoganglioside markers in brain tumors [21], neurodegenerative diseases [22] and genetic disorders affecting the central nervous system [23].
In this context, in the present study, an approach based on HR MS and MS/MS using a nanoESIOrbitrap platform operating in the negative ion mode, was for the first time developed, optimized and applied for the determination of ganglioside expression in human brain tissue samples. Our research was focused on the assessment of the changes in the ganglioside pattern in the adult hippocampus affected by TLE vs. normal hippocampus, on the detection of specific TLE structures and the comprehensive characterization of the TLE-associated gangliosidome.

2. Results

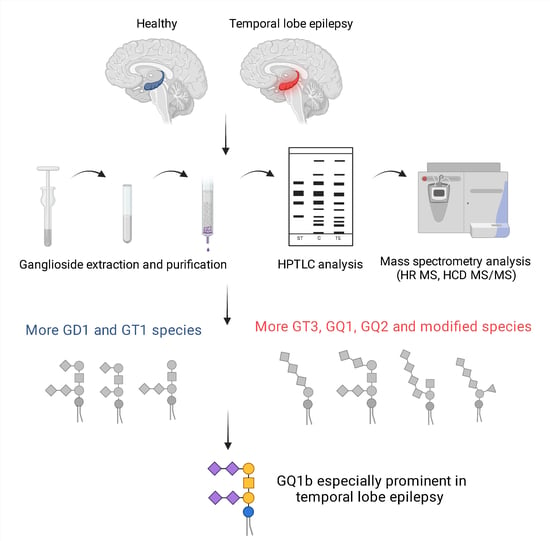
2.1. High-Performance Thin-Layer Chromatography Detects Minor Changes in Ganglioside Compositional Pattern of Human Hippocampal Tissue in Temporal Epilepsy Compared to Control Tissue

Qualitative analysis of brain ganglioside composition utilizing high-performance thin-layer chromatography (HPTLC) showed the presence of all major ganglioside fractions in the TLE human hippocampal tissue sample compared with the control (C) hippocampal tissue (Figure 1). No significant compositional change related to GT1b, GD1b, GD1a and GM1 was observed between TLE and C hippocampal tissue. The presence of monosialogangliosides GM2 and GM3, as well as polysialylated GQ1b, was detected in both the pathological and control samples. A higher proportion of the GM1, GD1a and a fraction migrating as GM2 was noticed in TLE vs. C hippocampus.

2.2. Comparative Assay by High-Resolution Mass Spectrometry Demonstrates Higher Degree of Gangliosides Species Sialylation, Expression of Fucogangliosides and Modifications of Tri- and Tetrasialogangliosides in Hippocampal Tissue in Temporal Epilepsy

For nanoESI HR MS comparative screening, 10 µL of the 5 pmol·μL−1 hippocampal TLE and control sample solutions in pure methanol were infused by (−) nanoESI into the Orbitrap MS under identical instrumental conditions. The screening mass spectra generated by accumulating scans for 2 min are presented in Figure 2 and Figure 3, while the assignment of the signals, based on the exact mass calculation, is given in Table 1 and Table 2, respectively.
The high resolution of the employed MS platform allowed the ion designation with the excellent average mass accuracy of 5.22 ppm and the standard deviation σ1 = 2.29 ppm in the case of TLE and 5.24 ppm with the standard deviation σ2 = 1.927 ppm for C hippocampal tissue. Both mass spectra feature a high signal-to-noise ratio and a complex molecular ion pattern displaying multicharged molecules (see Supplementary Materials), both of which document not only the presence of an elevated number of structures, but also a diversity of the ceramide composition for many of the identified ganglioside classes. Moreover, the data systematized in Table 1 and Table 2 indicate that the optimized nanoESI HR MS conditions for brain ganglioside profiling provided a fair ionization/detection of major and minor components in the analyzed samples and, most importantly, favored the multicharging of the molecules, which allowed the detection of long-chain polysialylated structures belonging to GT and GQ classes. In Table 1, the average mass accuracy for GT and GQ species is 4.69 and 4.8 ppm, respectively, whereas in Table 2 the average mass accuracy for GT and GQ species is 5.07 and 6.2 ppm, respectively. The mass measurement accuracy of the Orbitrap instrument stated by the producer falls in the 1–5 ppm range; however, we have noticed here and before [19,20,21,23] that the mass tolerance for ganglioside identification is situated in the 0.5–12 ppm range. Our findings are in agreement with previous research reporting differences between the accuracy range indicated by the producer and the optimal mass tolerance for ion identification in the case of large molecules [24].
The inspection of the spectra in Figure 2 and Figure 3 also demonstrate that due to the mild nanoESI screening parameters, at the low spray voltage of 0.70 kV and the low cone voltage of −30 V, the in-source fragmentation of the labile modifications of glycan nature such as Neu5Ac and Fuc or non-carbohydrate type such as O-Ac and CH3COO were hindered. The anions at m/zmonisotopic 308.1059 and 290.0954 (Neu5Ac), 163.0684 and 145.0579 (Fuc), typical for the in-source detachment of the labile Neu5Ac or Fuc, were not detected in the screening mass spectra.
In this comparative assay, the high resolution and accurate mass measurement allowed the discrimination and assignment in TLE hippocampal sample of no less than 105 ions corresponding to 99 ganglioside species differing in the composition of their glycan core and lipid moiety (Table 1) and of 91 ions attributed to 75 distinct gangliosides in the control mixture (Table 2).
Unlike the control sample, TLE hippocampus was found more enriched in polysialylated gangliosides, in particular the tetrasialogangliosides and fucogangliosides. Overall, of the 99 individual components identified in TLE, 87% were found to contain at least two Neu5Ac residues in the structure of the oligosaccharide chain, with an expression in the following ascending order of the number of the detected structures: GT2 < GQ2 < GD2 = GD3 < GT3 < GT1 < GD1 < GQ1.
Obviously, in the TLE hippocampal sample, the highest number of species belonging to the same class is 26 and corresponds to the tetrasialylated tetraoses GQ1 bearing different ceramides and/or modifications of the main oligosaccharide chain by O-fucosylation, O-acetylation or CH3COO. Hence, no less than 26 GQ1 structures were discovered in TLE vs. only 15 in C hippocampal tissue sample. Another important aspect related to the sialylation status of both native ganglioside extracts is related to GQ2 class, which was only discovered in TLE hippocampal sample represented by the species GQ2(d18:1/17:0) and GQ2(d18:1/17:1). Both structures were detected as [M-3H+]3− ions of fair relative abundances. The MS data show that, except for the 28 species in the GQ class of which 26 GQ1 and 2 GQ2, no less than 27 trisialylated ganglioside components belonging to the GT class were discovered in the TLE mixture. These species, which have 20 GT1, 1 GT2 and 6 GT3 glycoforms, were discovered here for the first time in association to TLE, while GQ2 species were only detected in TLE. The elevated expression of GQ and GT in TLE hippocampus as compared to C demonstrates that TLE gangliosidome is characterized by a much higher overall sialylation degree of components than the normal hippocampus.
A systematic view of the ganglioside pattern in TLE and C hippocampal samples is provided in Figure 4. The histogram comparatively plots the number of species identified vs. the glycan chain composition, which includes the saccharide chain length and the number of sialic acids, counting also those exhibiting labile carbohydrate and non-carbohydrate-type modifications of the main chain such as O-Fuc, O-Ac and CH3COO.
Another characteristic of TLE hippocampal native extract is the occurrence of fucogangliosides and compounds having the oligosaccharide chain modified by either O-acetylation or CH3COO. Altogether, 25 modified structures were discovered, among which the most interesting are the tri- and tetrasialylated components, whose rather complex glycan chains are supplementary decorated by attachments such as: Fuc-GT3(t18:1/16:1), Fuc-GT3(d18:1/20:0), Fuc-GT3(t18:1/18:0), O-Ac-GT1(d18:1/22:0), O-Ac-GT1(d18:0/22:0) and, in particular, O-Ac-GQ1(d18:1/18:0) identified as a triply deprotonated molecule at m/z 819.3877, O-Ac-GQ1(t18:1/18:1) also as a [M − 3H+]3− signal at m/z 824.0505 and (CH3COO) GQ1(t18:1/18:3), and a triply charged species at m/z 828.7063.

2.3. Structural Analysis of GQ1 Species by High-Energy Collision-Induced Dissociation MS/MS Reveals Specific Association of GQ1b Isomer in Hippocampus with Temporal Epilepsy

Since HR MS screening has indicated that the structures in the GQ1 class are strongly expressed in the TLE hippocampal sample, this ganglioside extract numerically dominates and may be a characteristic molecular feature of TLE, in the final stage of research we have conducted a detailed structural analysis by HCD MS/MS, using the [M − 4H+]4− detected at m/z 603.7844 as the precursor ion. According to the exact mass calculation of the tetradeprotonated glycoform (m/ztheor 603.7830), this ion was assigned with the excellent mass accuracy of 2.32 ppm to the tetrasialotetraose GQ1(d18:1/18:0) species.
For the HCD MS/MS fragmentation analysis, the [M − 4H+]4− precursor ion was isolated in a window of 1 m/z width and subjected to sequencing under variable collision energy in the (35–80) eV range of the applied Elab to make possible the generation of diagnostic fragment ions by both glycosidic bond and cross-ring cleavages. The obtained tandem mass spectrum, generated by summing up the scans accumulated for 2 min across the set range of collision energies, is presented in Figure 5 while the scheme of the fragmentation experienced by this ion under the employed tandem MS conditions, as deduced from the assignment of the fragment ions, is depicted in Figure 6, in a representation correlated to the b isomer.
The inspection of the spectrum in Figure 5 reveals that the optimized HCD experiment gave rise to an important number of singly and multicharged diagnostic fragment ions that not only corroborate the composition of the glycan chain, the ceramide moiety and the overall degree of sialylation, but also the supply information from which the position of the four Neu5Ac residues and the type of the structural isomer may be postulated.
A number of monodeprotonated sequence ions such as Y1 at m/z 726.5961 corresponding to Glc-Cer, Z0 at m/z 548.5314 and Y0 at m/z 564.5380 characterize the aglycone and confirm the (d18:1/18:0) composition of the ceramide, whereas the Z, Z and Z ions and particularly the double cleavage [Z/C] at m/z 1221.9019 support the Gal-GalNAc-Gal-Glc structure of the glycan backbone and the Gal-GalNAc-Gal-Glc-Cer(d18:1/18:0) structural motif in the fragmented species.
The presence of Neu5Ac at the non-reducing end of the molecule is certified by the high intensity signal at m/z 290.0896 associated to the cleavage of the labile Neu5Ac residue; this event led to the generation of the B and/or B, together with their singly charged C and/or C counterparts at m/z 308.0983. Of high importance is the detection of the monocharged fragment ion at m/z 581.1890. According to mass calculation, this signal corresponds to the cleaved disialo-Neu5Ac2 element, that might originate as either B or B, giving strong evidence on the existence of Neu5Ac–Neu5Ac linkage.
In relation to the type of GQ1 isomer, of structural significance are: (a) the Y corresponding to Gal(Neu5Ac2)-Glc-Cer and (b) the cross ring cleavage ion 0,4X, which occurred following a 2,4 ring fragmentation of GalNAc monosacharide discovered in a GalNAc-Gal(Neu5Ac2)-Glc-Cer motif. Both Y and 0,4X document the linkage of the disialo element to the inner galactose and, together with 0,4X, substantiate the architecture of a ganglioside species having the inner and outer Gal linked to Neu5Ac–Neu5Ac disaccharide. Such a structural pattern is consistent with the GQ1b isomer. Since a few other fragment ions could arise from either GQ1a, GQ1c, or GQ1d isomers, which are known to be expressed in human brain tissue, the presence in the TLE hippocampal sample of these species cannot be excluded either. However, the tandem MS data evidenced here, for the first time, the occurrence of the GQ1b isomer as a characteristic feature of the TLE gangliosidome.

3. Discussion

In this study, the gangliosidome of the human hippocampus affected by temporal lobe epilepsy was investigated for the first time by high-resolution tandem mass spectrometry in a comparative assay with a normal hippocampus. The objective of this work was the determination of ganglioside expression in TLE hippocampus by HR MS/MS and the discovery and structural analysis of the disease-associated species. In a previous report [25] on the mapping of the human hippocampus-associated gangliosides in fetal and adult tissues by a hybrid quadrupole time-of-flight (QTOF) mass spectrometer achieving a resolution of 5000 (m/z 400), 17 ganglioside components differing in their glycan and ceramide composition were detected. Of these, only four exhibited modifications: three by fucosyl and one by GalNAc attachment. Moreover, a single GQ1 species was found in fetal tissue. In the case of adult hippocampus, the MS screening at 5000 (m/z 400) resolution has evidenced only 15 distinct species; the highest sialylation degree determined in the case of adult tissue was three, as documented by the five tetraoses distinguished by QTOF MS: GT1 (d18:1/18:0), GT1 (d18:1/18:1), GT1 (d18:1/20:0), GT1 (d18:1/24:1), and Fuc-GT1 (d18:1/17:0).
In contrast to these results, the 100,000 (m/z 400) resolution employed in the present experiments enabled the detection and identification of no less than 99 different gangliosides in hippocampus affected by temporal lobe epilepsy and 75 in the normal adult hippocampus specimen, which represent five times more structures than ever reported in the adult tissue and the highest number of species identified in the hippocampus solely on the basis of MS profiling.
The high resolution and precision in the determination of the masses of the fragment ions and the optimal sequencing conditions in HCD MS/MS provided reliable data on the intimate structure of the tetrasialotetraose GQ1(d18:1/18:0), a ganglioside species specifically expressed in the TLE hippocampus. The fragmentation pathway of this species was found to be consistent with the GQ1b isomer, a configuration displaying one of the disialo elements linked to the inner galactose and one to the outer galactose.
In addition to the high resolution, mass accuracy, reproducibility and fragmentation efficiency, another technical aspect of utmost importance in the case of clinical samples was noticed. The spectra in Figure 2, Figure 3 and Figure 5 were each acquired for 2 min. Considering that the nanoESI flow rate is 500 nL·min−1 and the sample concentration 5 pmol·μL−1 2 min of signal acquisition is equivalent to only 5 pmol sample consumption for a mass spectrum, which situates the analysis sensitivity in the low picomole range.
Finally, a strikingly different ganglioside structural composition of TLE vs. normal hippocampus, detected in this study by utilizing a combination of highly sensitive MS techniques, needs to be further discussed in the context of the potential involvement of gangliosides in TLE molecular pathogenesis. Even though a rather small number of studies are dealing with this topic in humans and mouse models, they provide firm evidence on: (a) the association of seizure phenotypes with genetic disorders linked to enzymes required for ganglioside synthesis [16,17,26]; (b) alterations in ganglioside content and composition in brain tissue in epilepsy [18]. Of interest for comparison with our study are data indicating a link of gangliosides GD3 and GQ1b with temporal epilepsy. The reported increased proportion of GD3, a simple ganglioside species characteristic for proliferating cells during development and activated glial cells in the adult brain is expected, given that glial activation participates in brain tissue response to different types of lesions [27]. Interestingly, the evidenced release of GD3 from activated microglia suggests an additional role of GD3 in neuroinflammation, which contributes to TLE pathology [28,29]. The essential roles of gangliosides in the maintenance of physiological membrane functions in brain tissue are further accentuated by the confirmed relationship of either simple gangliosides such as GM1, GM2, GM3, GD2 and GD3 or more complex (polysialylated) ganglioside structures with various neuropathological conditions [9]. For instance, an increased level of polysialylated ganglioside GQ1b has been proposed to aggravate seizures in animal models, which is relevant to the presented results, demonstrating a specific TLE-related GQ1b expression in a human hippocampal tissue sample [30,31]. The effect of GQ1b on neuronal membrane excitability has been well described and is related to membrane ion transport systems via the modulation of Ca2+ channels by gangliosides [32]. Recent studies draw particular attention to the regulation of cellular ion homeostasis by gangliosides as one of the most prominent aspect of gangliosides actions [3,33]. Seemingly, gangliosides are implicated in membrane architectural and functional remodeling occurring in a human TLE pathology in much more complex ways than could have been perceived. In the last two decades, there has been a lack of investigations focusing on the physicochemical properties of membrane gangliosides in TLE; thus, the data presented here bring new insight into the astonishing structural diversity of the gangliosidome specifically associated to TLE. We firstly utilized a less sensitive HPTLC technique for the screening of the ganglioside composition and observed a slightly increased proportion of species migrating as GM1, GM2 and GD1a in TLE compared to the control hippocampal sample. A more sensitive high- resolution MS approach confirmed a large diversity and enrichment of species belonging to GM1, GM2 and GD2 in TLE vs. C hippocampal sample; additionally, it detected an increased expression of polysialylated structures (GT2, GQ1, GQ2), occurrence of fucogangliosides, modified tri- and tetrasialogangliosides, and GQ1b as a specific TLE-related ganglioside structure. Based on the previously described role of gangliosides in ion transport across membranes, it may be presumed that a higher degree of sialylation and modifications of gangliosides observed in human TLE hippocampal tissue sample are associated with alterations of membrane ion homeostasis, as illustrated in Figure 7. The question remains whether increased sialylation is a compensatory effect of a pathologically affected tissue, or part of the pathogenic cascade in TLE, whose clinical phenotype is a consequence of disordered neuronal excitability. The finding of the increased expression of fucogangliosides in TLE hippocampus, along with detected additional modifications of gangliosides by acetylation and O-acetylation, is particularly compelling as it indicates a probable disruption of regulatory mechanisms involved in ganglioside synthesis and intracellular trafficking in TLE. Of note also is that modified ganglioside structures at the cell surface may greatly influence the variety of cellular processes related to cell–cell interactions and cellular communication. Further investigation of brain cell-type related gangliosidome pattern is certainly needed in order to clarify more closely a relationship between the occurrence of a particular ganglioside species and the accompanying cellular pathological events such as a (micro)glial response to neuronal damage.
The limitation of this study is that a comparative analysis of the composition and structural features of gangliosides was performed in a single hippocampal tissue sample derived from a patient with temporal epilepsy and neuropathologically unaffected control tissue. A larger case-control study is needed in order to confirm specific TLE-related changes of hippocampal gangliosidome, which could serve as TLE biomarkers, and to clarify the involvement of gangliosides in the molecular pathomechanism of TLE-associated neurodegeneration. Initial findings of this study, although based on a limited number of samples, indicate a highly probable link between altered hippocampal gangliosidome and TLE. The hypothesized role of gangliosides in TLE is in line with recently described structural and metabolic perturbations of other classes of membrane lipids, particularly phosphatidylcholine and phosphatidylethanolamine, in human hippocampus affected by TLE [34].
In conclusion, this study, which utilized an accurate, reproducible and efficient high-resolution MS approach, provides detailed data on altered hippocampal gangliosidome in TLE, establishes TLE-specific expression of GQ1b isomer in human hippocampus, and supports the hypothesized relationship of gangliosides with disturbed ion homeostasis underlying seizures pathogenesis in humans. Since in this study the MS/MS data revealed for the first time the presence in TLE of an isomer with a potential biomarker role, further studies are necessary in order to determine all TLE-specific isomers. Such results are achievable by fragmentation analysis of over 100 ions, which certainly requires high-throughput MS/MS. However, although this method was successful in peptide sequencing, it so far has provided limited structural information on complex molecules such as GSLs. For this reason, we plan the development and application to TLE gangliosides of ion mobility mass spectrometry (IMS MS), which is able to separate isomers, isobars and conformers according to their mobility and provide detailed information on the stoichiometry, topology and structure of even minor compounds in a complex mixture of glycoconjugates, in a single run and on a single instrument.

4. Materials and Methods

Brain tissue samples: Brain tissue samples utilized for isolation and purification of ganglioside were hippocampal tissue samples affected by temporal epilepsy and control hippocampal tissue samples with no neuropathological changes. The patient with temporal epilepsy (female, aged 28 years) had a history of complex partial seizures, and refractory to antiepileptic medication. The brain magnetic resonance imaging showed right sided hippocampal sclerosis, thus selective amygdalohippocampectomy was indicated. Neuropathological examination confirmed the clinical diagnosis. Control hippocampal tissue was part of the human brain tissue collection at Croatian Institute for Brain Research, Zagreb University School of Medicine, and was obtained from routine autopsy of a person who died of causes not related to neurological conditions (male, aged 63 years). All tissue samples were immediately frozen in liquid nitrogen and stored at −80 °C until further analytical procedures. The study was performed in accordance with the Declaration of Helsinki and was approved by ethical commissions of the University hospital Sestre Milosrdnice, Zagreb (EP-7259/17-17), and Zagreb University School of Medicine (641-01/17-02/01).
Ganglioside purification: The ganglioside extraction procedure was performed as described previously [35,36,37]. Briefly, brain tissue samples were homogenized in ice-cold distilled water (W) in a Potter–Elvehjemglass-Teflon homogenizer (DeOtto Lab, Zagreb, Croatia). Lipids were extracted using organic solvents chloroform (C):methanol (M) (1:2, by vol.) followed by partition and repartition by adding M and W to a final volume ratio 1:1:0.7 (chloroform was from T.T.T., Sveta Nedjelja, Croatia; methanol from Honeywell Riedel-de Haen, Seelze, Germany). Upper phases were collected, evaporated to dryness and further purified by gel filtration Sephadex-G25 (Sigma-Aldrich, St. Louis, MO, USA) [38].
Ganglioside quantification and high performance thin layer chromatography (HPTLC): Quantitative analysis of ganglioside-bound sialic acid content was determined spectrophotometrically as previously described [36,39]. The absorbances of samples and N-acetylneuraminic acid (Sigma-Aldrich, St. Louis, MO, USA) used as a standard in a range of known concentrations were determined at 580 nm. The contents of ganglioside-bound sialic acids are expressed as micrograms of ganglioside-bound sialic acids per gram of fresh tissue w.w. The purified samples were qualitatively analyzed by HPTLC, which was performed as previously described [35,39,40,41]. Purified samples were dissolved in C:M:W (60:30:4.5, by vol.) and the aliquots spotted to the HPTLC plate. Resolved gangliosides were detected by resorcinol–HCl reagent [39].
Mass spectrometry analysis: Mass spectrometry analysis was carried out using a LTQ OrbitrapVelosProTM mass spectrometer from Thermo Fisher Scientific (Bremen, Germany), equipped with an offline nanoESI source ES 259. Ten microliters of each ganglioside mixture dissolved in methanol (Darmstadt, Germany) to the concentration of 5 pmol·μL−1, calculated for an average molecular weight of 2000, were loaded into the borosilicate emitters ES380 (Proxeon, Odense, Denmark) and directly infused into the instrument through the offline nanoESI connected to the instrument using the Nanospray Flex Ion Source (Thermo Scientific, Waltham, MA, USA). The electrospray was initiated at a spray voltage of 0.70 kV and a cone voltage of −30 V, yielding a current of 0.08 µA. Prior to nanoESI infusion, the sample solutions were vortexed in a Biosan Multi-Vortex V-32 (Riga, Latvia) at 2000× g rpm, followed by centrifugation in a Beckman Coulter Microfuge®16 (Beckman Coulter, Pasadena, CA, USA).
The screening and tandem mass spectra were acquired in the negative ion mode under identical conditions for all samples, with no sheath, sweep or auxiliary gas, in the m/z range of 200 to 2000. The MS scans were accumulated in the high-resolution mode, with the resolution set to the value of 100,000 (for m/z 400). Prior to experiments, the m/z scale was externally calibrated with the standard Pierce® ESI Negative Ion Solution (Thermo Scientific, Waltham, MA, USA). Following the calibration, the average mass accuracy was situated within the normal range of an Orbitrap MS instrument.
The mass spectrometer was operated and controlled by the LTQ Tune Plus v2.7 build 1112 SP2 software (Thermo Scientific, Waltham, MA, USA) running under Windows 7, while the MS data acquisition and possessing were achieved using Xcalibur 3.0.63 software (Thermo Scientific, Waltham, MA, USA). The MS/MS experiments were carried out in the LTQ by high energy collision induced dissociation (HCD) in the HCD collision cell, using Helium 5.0 purity at a pressure of 50 psi as the collision gas, with detection in the HR Orbitrap mode. The precursor ions were selected within an isolation width of 1 m/z unit. The HCD MS/MS scans were acquired with a resolution of 20,000 using variable collision energies within a (35–80) eV range, laboratory values (Elab), to generate a high coverage of fragment ions. The total ion chromatograms and the derived mass spectra were processed using Xcalibur 2.1 software (Thermo Scientific, Waltham, MA, USA), which allows signal extraction, smoothing and subtraction.
For three replicates the in-run and run-to-run reproducibility of the MS data was 100%, while the day-to-day reproducibility was situated between 96% and 98% in terms of the type, number and intensity of the signals as well as their charge state.
For gangliosides assignment, the abbreviation system introduced by Svennerholm [42], together with the recommendations of IUPAC-IUB Commission on Biochemical Nomenclature (IUPAC-IUB 1998) were used. The ion assignment was based on exact mass calculation and the knowledge we have acquired in our previous studies [10,19,21,22,25] on this type of molecules and the biosynthesis pathways of gangliosides. The assignment of the fragment ions generated within the HCD MS/MS fragmentation experiments followed the nomenclature introduced by Domon and Costello [43] and revised by Costello et al. [44].

Supplementary Materials

The following supporting information can be downloaded at: https://www.mdpi.com/article/10.3390/molecules27134056/s1, The isotopic distribution of species, proving the carried charges.

Author Contributions

S.K.-B. and A.D.Z. developed the concept and the methodology and supervised the experiments. R.I. and K.M.-J. designed the experiments. R.I., K.M.-J., K.I., T.S. and C.V.A.M. carried out the experiments. R.I., K.M.-J., A.D.Z. and S.K.-B. interpreted the data and wrote the paper. All authors have read and agreed to the published version of the manuscript.

Funding

This research was funded by Croatian Science Foundation grant NeuroReact, IP-2016-06-8636 (to S.K.-B.), the Romanian National Authority for Scientific Research, UEFISCDI, through the project PN-III-P2-2.1-PED-2019-0799 (to A.D.Z.), and the Scientific Centre of Excellence for Basic, Clinical, and Translational Neuroscience (project “Experimental and clinical research of hypoxic ischemic damage in perinatal and adult brain” GA KK 01.1.1.01.0007 funded by the European Union through the European Regional Development Fund).

Institutional Review Board Statement

The study was conducted in accordance with the Declaration of Helsinki, and approved by the Ethics Committee of Zagreb University School of Medicine (641-01/17-02/01; 20 April 2017) and University Hospital Sestre Milosrdnice (EP-7259/17-17; 5 May 2017).

Informed Consent Statement

Informed consent was obtained from the subjects involved in the study. Ethical permission for collecting human tissue during routine autopsies was approved by the appropriate Ethics committee.

Data Availability Statement

Not applicable.

Acknowledgments

Graphical abstract and Figure 7 were created with BioRender.com (accessed on 3 May 2022) (agreement numbers CI23V5C7L1 and WH23V5CXID).

Conflicts of Interest

The authors declare no conflict of interest.

Sample Availability

Not applicable.

References

  1. Svennerholm, L. Gangliosides and synaptic transmission. Adv. Exp. Med. Biol. 1980, 125, 533–544. [Google Scholar] [CrossRef] [PubMed]
  2. Schnaar, R.L. The Biology of Gangliosides. Adv. Carbohydr. Chem. Biochem. 2019, 76, 113–148. [Google Scholar] [CrossRef]
  3. Xu, Y.; Sun, J.; Yang, L.; Zhao, S.; Liu, X.; Su, Y.; Zhang, J.; Zhao, M. Gangliosides play important roles in the nervous system by regulating ion concentrations. Neurochem. Res. 2022, 47, 1791–1798. [Google Scholar] [CrossRef] [PubMed]
  4. Ledeen, R.; Wu, G. Gangliosides of the Nervous System. Methods Mol. Biol. 2018, 1804, 19–55. [Google Scholar] [CrossRef]
  5. Rahmann, H.; Probst, W.; Muhleisen, M. Gangliosides and synaptic transmission. Jpn. J. Exp. Med. 1982, 52, 275–286. [Google Scholar] [PubMed]
  6. Tettamanti, G.; Bonali, F.; Marchesini, S.; Zambotti, V. A new procedure for the extraction, purification and fractionation of brain gangliosides. Biochim. Biophys. Acta 1973, 296, 160–170. [Google Scholar] [CrossRef]
  7. Schnaar, R.L.; Gerardy-Schahn, R.; Hildebrandt, H. Sialic acids in the brain: Gangliosides and polysialic acid in nervous system development, stability, disease, and regeneration. Physiol. Rev. 2014, 94, 461–518. [Google Scholar] [CrossRef] [PubMed] [Green Version]
  8. Kracun, I.; Rosner, H.; Cosovic, C.; Stavljenic, A. Topographical atlas of the gangliosides of the adult human brain. J. Neurochem. 1984, 43, 979–989. [Google Scholar] [CrossRef]
  9. Sipione, S.; Monyror, J.; Galleguillos, D.; Steinberg, N.; Kadam, V. Gangliosides in the Brain: Physiology, Pathophysiology and Therapeutic Applications. Front. Neurosci. 2020, 14, 572965. [Google Scholar] [CrossRef]
  10. Sarbu, M.; Ica, R.; Zamfir, A.D. Gangliosides as Biomarkers of Human Brain Diseases: Trends in Discovery and Characterization by High-Performance Mass Spectrometry. Int. J. Mol. Sci. 2022, 23, 693. [Google Scholar] [CrossRef]
  11. Huang, F.; Bailey, L.S.; Gao, T.; Jiang, W.; Yu, L.; Bennett, D.A.; Zhao, J.; Basso, K.B.; Guo, Z. Analysis and Comparison of Mouse and Human Brain Gangliosides via Two-Stage Matching of MS/MS Spectra. ACS Omega 2022, 7, 6403–6411. [Google Scholar] [CrossRef] [PubMed]
  12. Fukami, Y.; Ariga, T.; Yamada, M.; Yuki, N. Brain Gangliosides in Alzheimer’s Disease: Increased Expression of Cholinergic Neuron-Specific Gangliosides. Curr. Alzheimer Res. 2017, 14, 586–591. [Google Scholar] [CrossRef] [PubMed]
  13. Yanagisawa, K. Role of gangliosides in Alzheimer’s disease. Biochim. Biophys. Acta 2007, 1768, 1943–1951. [Google Scholar] [CrossRef] [Green Version]
  14. Mlinac, K.; Kalanj Bognar, S. Role of gangliosides in brain aging and neurodegeneration. Transl. Neurosci. 2010, 1, 8. [Google Scholar] [CrossRef]
  15. Sandhoff, R.; Schulze, H.; Sandhoff, K. Ganglioside Metabolism in Health and Disease. Prog. Mol. Biol. Transl. Sci. 2018, 156, 1–62. [Google Scholar] [CrossRef] [PubMed]
  16. Simpson, M.A.; Cross, H.; Proukakis, C.; Priestman, D.A.; Neville, D.C.; Reinkensmeier, G.; Wang, H.; Wiznitzer, M.; Gurtz, K.; Verganelaki, A.; et al. Infantile-onset symptomatic epilepsy syndrome caused by a homozygous loss-of-function mutation of GM3 synthase. Nat. Genet. 2004, 36, 1225–1229. [Google Scholar] [CrossRef] [PubMed] [Green Version]
  17. Fragaki, K.; Ait-El-Mkadem, S.; Chaussenot, A.; Gire, C.; Mengual, R.; Bonesso, L.; Beneteau, M.; Ricci, J.E.; Desquiret-Dumas, V.; Procaccio, V.; et al. Refractory epilepsy and mitochondrial dysfunction due to GM3 synthase deficiency. Eur. J. Hum. Genet. 2013, 21, 528–534. [Google Scholar] [CrossRef] [Green Version]
  18. Yu, R.K.; Holley, J.A.; Macala, L.J.; Spencer, D.D. Ganglioside changes associated with temporal lobe epilepsy in the human hippocampus. Yale J. Biol. Med. 1987, 60, 107–117. [Google Scholar]
  19. Sarbu, M.; Dehelean, L.; Munteanu, C.; Ica, R.; Petrescu, A.J.; Zamfir, A.D. Human caudate nucleus exhibits a highly complex ganglioside pattern as revealed by high-resolution multistage Orbitrap MS. J. Carbohydr. Chem. 2019, 38, 21. [Google Scholar] [CrossRef]
  20. Ica, R.; Petrut, A.; Munteanu, C.V.A.; Sarbu, M.; Vukelic, Z.; Petrica, L.; Zamfir, A.D. Orbitrap mass spectrometry for monitoring the ganglioside pattern in human cerebellum development and aging. J. Mass Spectrom. 2020, 55, e4502. [Google Scholar] [CrossRef]
  21. Ica, R.; Simulescu, A.; Sarbu, M.; Munteanu, C.V.A.; Vukelic, Z.; Zamfir, A.D. High resolution mass spectrometry provides novel insights into the ganglioside pattern of brain cavernous hemangioma. Anal. Biochem. 2020, 609, 113976. [Google Scholar] [CrossRef] [PubMed]
  22. Dehelean, L.; Sarbu, M.; Petrut, A.; Zamfir, A.D. Trends in Glycolipid Biomarker Discovery in Neurodegenerative Disorders by Mass Spectrometry. Adv. Exp. Med. Biol. 2019, 1140, 703–729. [Google Scholar] [CrossRef] [PubMed]
  23. Sarbu, M.; Ica, R.; Petrut, A.; Vukelic, Z.; Munteanu, C.V.A.; Petrescu, A.J.; Zamfir, A.D. Gangliosidome of human anencephaly: A high resolution multistage mass spectrometry study. Biochimie 2019, 163, 142–151. [Google Scholar] [CrossRef] [PubMed]
  24. Yu, F.; Fang, H.; Xiao, K.; Liu, Y.; Xue, B.; Tian, Z. Mass measurement accuracy of the Orbitrap in intact proteome analysis. Rapid Commun. Mass Spectrom. 2016, 30, 1391–1397. [Google Scholar] [CrossRef]
  25. Vukelic, Z.; Zarei, M.; Peter-Katalinic, J.; Zamfir, A.D. Analysis of human hippocampus gangliosides by fully-automated chip-based nanoelectrospray tandem mass spectrometry. J. Chromatogr. A 2006, 1130, 238–245. [Google Scholar] [CrossRef]
  26. Wu, G.; Lu, Z.H.; Wang, J.; Wang, Y.; Xie, X.; Meyenhofer, M.F.; Ledeen, R.W. Enhanced susceptibility to kainate-induced seizures, neuronal apoptosis, and death in mice lacking gangliotetraose gangliosides: Protection with LIGA 20, a membrane-permeant analog of GM1. J. Neurosci. 2005, 25, 11014–11022. [Google Scholar] [CrossRef] [Green Version]
  27. Goldman, J.E.; Reynolds, R. A reappraisal of ganglioside GD3 expression in the CNS. Glia 1996, 16, 291–295. [Google Scholar] [CrossRef]
  28. Simon, B.M.; Malisan, F.; Testi, R.; Nicotera, P.; Leist, M. Disialoganglioside GD3 is released by microglia and induces oligodendrocyte apoptosis. Cell Death Differ. 2002, 9, 758–767. [Google Scholar] [CrossRef] [Green Version]
  29. Gershen, L.D.; Zanotti-Fregonara, P.; Dustin, I.H.; Liow, J.S.; Hirvonen, J.; Kreisl, W.C.; Jenko, K.J.; Inati, S.K.; Fujita, M.; Morse, C.L.; et al. Neuroinflammation in Temporal Lobe Epilepsy Measured Using Positron Emission Tomographic Imaging of Translocator Protein. JAMA Neurol. 2015, 72, 882–888. [Google Scholar] [CrossRef] [Green Version]
  30. Kato, K.; Iwamori, M.; Hirabayashi, Y. Increase of GQ1b in the hippocampus of mice following kindled-seizures. Neurosci. Lett. 2008, 441, 286–290. [Google Scholar] [CrossRef]
  31. Nakamura, Y.; Morimoto, K.; Okamoto, M. Modification of amygdala kindling by intracerebroventricularly administered gangliosides in rats. Exp. Neurol. 1989, 106, 61–69. [Google Scholar] [CrossRef]
  32. Fujii, S.; Igarashi, K.; Sasaki, H.; Furuse, H.; Ito, K.; Kaneko, K.; Kato, H.; Inokuchi, J.; Waki, H.; Ando, S. Effects of the mono- and tetrasialogangliosides GM1 and GQ1b on ATP-induced long-term potentiation in hippocampal CA1 neurons. Glycobiology 2002, 12, 339–344. [Google Scholar] [CrossRef] [Green Version]
  33. Ilic, K.; Lin, X.; Malci, A.; Stojanovic, M.; Puljko, B.; Rozman, M.; Vukelic, Z.; Heffer, M.; Montag, D.; Schnaar, R.L.; et al. Plasma Membrane Calcium ATPase-Neuroplastin Complexes Are Selectively Stabilized in GM1-Containing Lipid Rafts. Int. J. Mol. Sci. 2021, 22, 13590. [Google Scholar] [CrossRef] [PubMed]
  34. Ajith, A.; Mondal, S.; Chattopadhyay, S.; Kumar, A.; Sthanikam, Y.; Chacko, A.G.; Prabhu, K.; Chacko, G.; Vanjare, H.A.; Rajesh, V.; et al. Mass Spectrometry Imaging Deciphers Dysregulated Lipid Metabolism in the Human Hippocampus Affected by Temporal Lobe Epilepsy. ACS Chem. Neurosci. 2021, 12, 4187–4194. [Google Scholar] [CrossRef] [PubMed]
  35. Svennerholm, L.; Fredman, P. A procedure for the quantitative isolation of brain gangliosides. Biochim. Biophys. Acta 1980, 617, 97–109. [Google Scholar] [CrossRef]
  36. Mlinac, K.; Fabris, D.; Vukelic, Z.; Rozman, M.; Heffer, M.; Bognar, S.K. Structural analysis of brain ganglioside acetylation patterns in mice with altered ganglioside biosynthesis. Carbohydr. Res. 2013, 382, 1–8. [Google Scholar] [CrossRef] [Green Version]
  37. Schnaar, R.L. Isolation of glycosphingolipids. Methods Enzymol. 1994, 230, 348–370. [Google Scholar] [CrossRef]
  38. Wells, M.A.; Dittmer, J.C. The Use of Sephadex for the Removal of Nonlipid Contaminants from Lipid Extracts. Biochemistry 1963, 2, 1259–1263. [Google Scholar] [CrossRef]
  39. Svennerholm, L. Quantitative estimation of sialic acids. II. A colorimetric resorcinol-hydrochloric acid method. Biochim. Biophys. Acta 1957, 24, 604–611. [Google Scholar] [CrossRef]
  40. Mlinac-Jerkovic, K.; Ilic, K.; Zjalic, M.; Mandic, D.; Debeljak, Z.; Balog, M.; Damjanovic, V.; Macek Hrvat, N.; Habek, N.; Kalanj-Bognar, S.; et al. Who’s in, who’s out? Re-evaluation of lipid raft residents. J. Neurochem. 2021, 158, 657–672. [Google Scholar] [CrossRef]
  41. Schnaar, R.L.; Needham, L.K. Thin-layer chromatography of glycosphingolipids. Methods Enzymol. 1994, 230, 371–389. [Google Scholar] [CrossRef] [PubMed]
  42. Svennerholm, L. Ganglioside designation. Adv. Exp. Med. Biol. 1980, 125, 11. [Google Scholar] [CrossRef] [PubMed]
  43. Domon, B.; Costello, C.E. A systematic nomenclature for carbohydrate fragmentations in FAB-MS/MS spectra of glycoconjugates. Glycoconj. J. 1988, 5, 13. [Google Scholar] [CrossRef]
  44. Costello, C.E.; Juhasz, P.; Perreault, H. New mass spectral approaches to ganglioside structure determinations. Prog. Brain Res. 1994, 101, 45–61. [Google Scholar] [CrossRef] [PubMed]
Figure 1. Composition of brain gangliosides isolated from the hippocampus affected by temporal epilepsy (TLE) and control hippocampus (C) was analyzed by high-performance thin-layer chromatography and compared with standard ganglioside mixture (ST).
Molecules 27 04056 g001
Figure 2. (−) NanoESI HR MS of ganglioside mixture isolated from human hippocampal tissue sample in temporal epilepsy. Sample concentration: 5 pmol·μL−1 in MeOH; spray voltage: 0.70 kV; cone voltage: −30 V; acquisition time: 2 min.
Molecules 27 04056 g002
Figure 3. (−) NanoESI HR MS of ganglioside mixture derived from control hippocampal tissue sample. Conditions as in Figure 2.
Molecules 27 04056 g003
Figure 4. The distribution of the ganglioside species in TLE and control hippocampal tissue samples vs. their glycan chain composition.
Molecules 27 04056 g004
Figure 5. (−) NanoESI HR HCD MS/MS of the [M − 4H+]4− detected at m/z 603.7844 assigned according to mass calculation to the tetrasialotetraose GQ1(d18:1/18:0). The mass spectrum is a sum of the scans acquired over the entire Elab collision energy range of (35–80) eV, using stepped HCD method; acquisition time: 2 min; other conditions as in Figure 2.
Molecules 27 04056 g005
Figure 6. Fragmentation scheme by HCD MS/MS of the [M − 4H+]4− detected at m/z 603.7844 and the generated product ions.
Molecules 27 04056 g006
Figure 7. Schematic representation of the presumed relationship between a higher degree of sialylation, ganglioside species modifications and disturbed ion homeostasis occurring in temporal lobe epilepsy.
Molecules 27 04056 g007
Table 1. The assignment of the ions detected in the spectrum in Figure 2 and the ganglioside species identified in hippocampal sample in temporal epilepsy by (−) nanoESI HR MS screening. d: dihydroxylated sphingoid base; t: trihydroxylated sphingoid base; O-Ac: O-acetyl; Fuc: fucose.
No.m/zexpm/ztheorProposed StructureMolecular Ionppm
1603.7844603.783GQ1(d18:1/18:0)[M − 4H+]4−2.32
2608.7863608.783GQ1(d18:1/20:0)[M − 4H+]4−5.43
3610.7934610.7909GQ1(d18:1/20:0) and/or GQ1(d20:1/18:0)[M − 4H+]4−4.10
4613.7989613.8000GQ1(d18:0/22:0)[M − H2O − 4H+]4−1.79
5614.2888614.2855GQ1(t18:1/20:1)[M − 4H+]4−5.37
6617.8014617.799GQ1(d18:1/22:0)[M − 4H+]4−3.89
7620.8065620.8076GQ1(d18:0/24:0)[M − H2O − 4H+]4−1.77
8624.3059624.3024GQ1(d18:1/24:1)[M − 4H+]4−5.61
9637.9702637.967Fuc-GT3(t18:1/16:1)[M − 4H+ +Na+]3−5.02
10674.8742674.8728GM2(d18:1/16:2)[M − 2H+]2−2.08
11699.0083699.0040GT1(d18:1/16:0)[M − 3H+]3−6.15
12708.3524708.3482GT1(d18:1/18:0)[M − 3H+]3−5.93
13713.0035713.008GT1(t18:1/18:1)[M − 3H+]3−6.31
14714.3526714.3512GT1(t18:0/18:0)[M − 3H+]3−1.96
15717.6958717.692GT1(d18:1/20:0) and/or GT1(d20:1/18:0)[M − 3H+]3−5.30
16720.8998720.8964GD3(d18:1/16:0)[M − 2H+]2−4.72
17722.355722.3522GT1(t18:1/20:1)[M − 3H+]3−3.88
18726.3673726.363GT1(d18:1/22:1)[M − 3H+]3−5.92
19727.0393727.036GT1(d18:1/22:0)[M − 3H+]3−4.54
20731.699731.695GT1(t18:1/22:1)[M − 3H+]3−5.47
21734.9159734.9121GD3(d18:1/18:0)[M − 2H+]2−5.18
22733.9079733.9043GD3(d18:1/18:0)[M − 2H+]2−4.91
23735.7112735.7073O-Ac-GT1(d18:0/22:0)[M − H2O − 3H+]3−5.31
24741.0423741.0389O-Ac-GT1(d18:1/22:0)[M − 3H+]3−4.59
25745.3402745.3465GQ2(d18:1/17:0)[M − 3H+]3−8.46
26746.0239746.0184GQ2(d18:1/17:1)[M − 3H+]3−7.37
27771.9344771.9304GM1(d18:1/18:0)[M − 2H+]2−5.19
28775.9554775.9512GD3 (d18:1/24:1)[M − 2H+]2−5.42
29776.9585776.959GD3(d18:1/24:0)[M − 2H+]2−0.64
30789.9623789.9669GD3(d18:1/26:1)[M − 2H+]2−5.83
31796.0399796.036GQ1(d18:1/16:0)[M − 3H+]3−4.90
32804.7126804.708GQ1(d18:1/18:1)[M − 3H+]3−5.72
33805.3842805.3797GQ1(d18:1/18:0)[M − 3H+]3−5.59
34808.7044808.7079GQ1(d18:1/19:2)[M − 3H+]3−4.33
35812.7114812.707GQ1(d18:1/18:0)[M − 4H+ + Na+]3−5.42
36814.728814.724GQ1(d18:1/20:0) and/or GQ1(d20:1/18:0)[M − 3H+]3−4.91
37819.3877819.3832O-Ac-GQ1(d18:1/18:0)[M − 3H+]3−5.49
38820.7048820.7063GQ1(d18:0/18:0)[M − 5H+ + 2Na+]3−1.83
39822.0551822.0508GQ1(d18:1/20:0) and/or GQ1(d20:1/18:0)[M − 4H+ + Na+]3−5.23
40824.0505824.0433O-Ac-GQ1(t18:1/18:1)[M − 3H+]3−8.74
41828.7063828.7028(CH3COO) GQ1(t18:1/18:3)[M − 3H+]3−4.23
42830.0556830.05GQ1(d18:0/20:0)[M − 5H+ + 2Na+]3−6.75
830.0556830.0509GQ1(d18:1/22:2)[M − 4H+ + Na+]35.66
43831.4135831.4115GD2(d18:1/16:2)[M − 3H+ + Na+]2−2.41
44832.7429832.7391GQ1(t18:1/24:0)[M − H2O − 3H+]3−4.57
45835.4501835.4439GD2(d18:1/18:1)[M − 2H+]2−7.43
46836.456836.452GD2(d18:1/18:0)[M − 2H+]2−4.78
47846.4407846.4349GD2(d18:1/18:1)[M − 3H+ + Na+]2−6.86
48850.4719850.467GD2(d18:1/20:0) and/or GD2(d20:1/18:0)[M − 2H+]2−5.76
49877.4571877.4532(CH3COO) GD2(d18:1/18:0)[M − 3H+ + Na+]2−4.45
50891.4515891.4508GT3(d18:1/18:0)[M − 3H+ + Na+]2−0.79
51903.4677903.462GD1(d18:1/16:0)[M − 2H+]2−6.31
53916.4758916.4705GD1(d18:1/18:1)[M − 2H+]2−5.79
54917.4836917.478GD1(d18:1/18:0)[M − 2H+]2−6.11
55924.4726924.4678GD1(t18:1/18:1)[M − 2H+]2−5.19
56927.4695927.4613GD1(d18:1/18:1)[M − 3H+ + Na+]2−8.85
57928.4746928.473GD1(d18:1/18:0)[M − 3H+ + Na+]2−1.72
58930.4907930.486GD1(d18:1/20:1)[M − 2H+]2−5.05
59931.4988931.494GD1(d18:1/20:0) and/or GD1(d20:1/18:0)[M − 2H+]2−5.16
60938.4883938.4834GD1(t18:1/20:1)[M − 2H+]2−5.22
61939.4917939.4912GD1(t18:1/20:0)[M − 2H+]2−0.53
62942.4897942.4848GD1(d18:1/20:0) and/or GD1(d20:1/18:0)[M − 3H+ + Na+]2−5.20
63944.5055944.5016GD1(d18:1/22:1)[M − 2H+]2−4.13
64945.5143945.5102GD1 (d18:1/22:0) or[M − 2H+]2−4.34
65945.4976O-Ac-GT3(d18:1/24:0)[M − H2O − 3H+ +Na+]2−17.67
66946.4793946.4808(CH3COO) GD1(d18:1/18:1)[M − H+]2−1.59
67951.5007951.4912O-Ac-GD1(d18:1/20:1)[M − 2H+]2−9.99
68954.5082954.5147GD1(t18:0/22:0)[M − 2H+]2−6.81
69957.4667957.4537Fuc-GT3(t18:1/16:1)[M − 3H+ + Na+]2−13.58
70958.4738958.4798(CH3COO) GD1(d18:1/18:0)[M − 2H+ + Na+]2−6.26
71958.5225958.5173GD1(d18:1/24:1)[M − 2H+]2−5.43
72967.4978967.504Fuc-GT3(d18:1/20:0)[M − 2H+]2−6.41
73968.4676968.4628(CH3COO) GD1(d18:1/18:1)[M − 4H+ + 2Na+]2−4.96
74979.9872979.9865GT2(d18:0/16:0)[M − 3H+ + Na+]2−0.72
75983.4586983.4682Fuc-GT3(t18:1/18:0)[M − 4H+ + 2Na+]2−9.77
76985.4728985.4668Fuc-GD1(d18:1/18:2)[M − 3H+ + Na+]2−6.09
77987.4903987.4837Fuc-GD1(d18:1/18:3)[M − 2H+]2−6.69
78988.4889988.4915Fuc-GD1(d18:1/18:2)[M − 2H+]2−2.63
79989.4889989.4999Fuc-GD1(d18:1/18:1)[M − 2H+]2−11.12
80990.5087990.5071Fuc-GD1(d18:1/18:0)[M − 2H+]2−1.62
81999.519999.5123Fuc-GD1(t18:0/18:0)[M − 2H+]2−6.71
821007.49321007.498Fuc-(CH3COO) GT3(d18:1/20:1)[M − 2H+ + Na+]2−4.77
831012.49271012.4903Fuc-GD1(d18:1/20:3)[M − 3H+ + Na+]2−2.37
841017.94571017.9555GT1(d18:1/12:3)[M − 2H+]2−9.64
851019.00331019.006Fuc-(CH3COO) GD1(d18:1/18:2)[M − H+]2−2.65
861033.98271033.987GT1(d18:1/14:1)[M − 2H+]2−4.16
871063.03171063.026GT1(d18:1/14:1)[M − 2H+]2−5.36
881074.01241074.017GT1(d18:1/18:0)[M − 3H+ + Na+]2−4.28
891077.04711077.042GT1(d18:1/20:0) and/or GT1(d20:1/18:0[M − 2H+]2−4.74
901084.03651084.0311GT1(t18:1/20:1)[M − 2H+]2−4.98
911087.02891087.026GT1(d18:1/22:4)[M − 2H+]2−2.67
921088.03681088.034GT1(d18:1/22:3)[M − 2H+]22.57
931095.00251094.9923GT1(d18:1/20:3)[M − 4H+ + 2Na+]2−9.32
941098.01241098.0157GT1(d18:1/20:1)[M − 4H+ + 2Na+]2−3.01
951103.00931103.02(CH3COO) GT1(d18:1/18:1)[M − 2H+ + Na+]2−9.70
961109.04281109.0365GT1(t18:1/20:0)[M − 4H+ + 2Na+]2−5.68
971115.06111115.056GT1(d18:1/24:1)[M − 3H+ + Na+]2−4.57
981117.0771117.0716GT1(d18:0/24:0)[M − 3H+ + Na+]2−4.83
991208.56471208.574GQ1(d18:1/18:0)[M − 2H+]27.70
1001218.55521218.557GQ1(d18:1/18:1)[M − 3H+ + Na+]2−1.48
1011219.56961219.565GQ1(d18:1/18:0)[M − 3H+ + Na+]2−3.77
1021223.58951223.597GQ1(d18:0/20:0)[M − 2H+]26.13
1031244.5771244.571GQ1(d18:1/20:0) and/or GQ1(d20:1/18:0)[M − 4H+ + 2Na+]2−4.82
1041544.87661544.869GM1(d18:1/18:0)[M − H+]4.92
1051572.90641572.917GM1(d18:1/20:0)[M − H+]6.74
Table 2. The assignment of the ions detected in the spectrum in Figure 3 and the ganglioside species identified in control hippocampal tissue sample by (−) nanoESI HR MS screening. d: dihydroxylated sphingoid base; t: trihydroxylated sphingoid base: O-Ac: O-acetyl; Fuc: fucose.
No.m/zexpm/ztheorProposed StructureMolecular Ionppm
1610.7952610.791GQ1(d18:1/20:0)[M − 4H+]4−6.89
2614.2895614.2855GQ1(t18:1/20:1)[M − 4H+]4−6.51
3643.3823643.3802GM3(d18:1/24:1)[M − H2O − 4H+ + 2Na+]3−3.27
4683.6524683.657GT1(d18:1/14:0)[M − 3H+]3−6.73
5699.0085699.004GT1(d18:1/16:0)[M − 3H+]3−6.44
6702.3481702.3444GT1(d18:1/18:0)[M − H2O − 3H+]3−5.27
7708.3528708.3482GT1(d18:1/18:0)[M − 3H+]3−6.50
8714.3559714.3512GT1(t18:0/18:0)[M − 3H+]3−6.58
9717.6961717.692GT1(d18:1/20:0) and/or GT1(d20:1/18:0)[M − 3H+]3−5.72
10720.9006720.8964GD3(d18:1/16:0)[M − 2H+]2−5.83
11722.3559722.3522GT1(t18:1/20:1)[M − 3H+]3−5.12
12727.0396727.036GT1(d18:1/22:0)[M − 3H+]3−4.95
13731.6997731.695GT1(t18:1/22:1)[M − 3H+]3−6.43
14733.9087733.9043GD3(d18:1/18:1)[M − 2H+]2−6.00
15734.9164734.9121GD3(d18:1/18:0)[M − 2H+]2−5.86
16735.6994735.7073O-Ac-GT1(d18:0/22:0)[M − H2O − 3H+]3−10.75
17748.9321748.9277GD3(d18:1/20:0) and/or GD3(d20:1/18:0)[M − 2H+]2−5.88
18789.964789.9669GD3(d18:1/26:1)[M − 2H+]2−3.68
19804.7145804.708GQ1(d18:1/18:1)[M − 3H+]3−8.08
20805.3848805.3797GQ1(d18:1/18:0)[M − 3H+]3−6.34
21812.7127812.707GQ1(d18:1/18:0)[M − 4H+ + Na+]3−7.02
22814.7285814.724GQ1(d18:1/20:0) and/or GQ1(d20:1/18:0)[M − 3H+]3−5.53
23818.7164818.7113O-Ac-GQ1(d18:1/18:1)[M − 3H+]3−6.23
24819.3885819.3832O-Ac-GQ1(d18:1/18:0)[M − 3H+]3−6.47
25822.0567822.0508GQ1(d18:1/20:0) and/or GQ1(d20:1/18:0)[M − 4H+ + Na+]3−7.18
26836.4568836.452GD2(d18:1/18:0)[M − 2H+]2−5.74
27850.4725850.467GD2(d18:1/20:0) and/or GD2(d20:1/18:0)[M − 2H+]2−6.47
28857.472857.4752GD2(d18:1/21:0)[M − 2H+]23.73
29865.4962865.4908GD2(d18:0/22:0)[M − 2H+]26.24
30880.4648880.4597GT3(t18:0/18:0)[M − H2O − 2H+]2−5.80
31903.4683903.462GD1(d18:1/16:0)[M − 2H+]2−6.98
32916.4763916.4705GD1(d18:1/18:1)[M − 2H+]2−6.33
33917.484917.478GD1(d18:1/18:0)[M − 2H+]2−6.54
34924.4712924.4678GD1(t18:1/18:1)[M − 2H+]2−3.68
35926.489926.4834GD1(t18:0/18:0)[M − 2H+]2−6.05
36930.4915930.486GD1(d18:1/20:1)[M − 2H+]2−5.91
37931.4995931.494GD1(d18:1/20:0) and/or GD1(d20:1/18:0)[M − 2H+]2−5.91
38938.4892938.4834GD1(t18:1/20:1)[M − 2H+]2−6.18
39940.5046940.499GD1(t18:0/20:0)[M − 2H+]2−5.96
40945.5149945.5102GD1 (d18:1/22:0)[M − 2H+]2−4.97
41946.4831946.4808(CH3COO) GD1(d18:1/18:1)[M − H+]2−2.43
42951.4943951.4912O-Ac-GD1(d18:1/20:1)[M − 2H+]2−3.26
43952.5049952.499O-Ac-GD1(d18:1/20:0)[M − 2H+]2−6.20
44955.4321955.4381Fuc-GT3(t18:1/16:3)[M − 3H+ + Na+]2−6.28
45960.5486960.548GD1 (d18:1/24:0)[M − 2H+]2−0.62
46967.5075967.5044Fuc-GT3(d18:1/20:0)[M − 2H+]2−3.21
47969.4736969.4706(CH3COO) GD1(d18:1/18:0)[M − 3H+ + 2Na+]2−3.10
48975.4827975.4835(CH3COO)2 GD1(d18:1/18:2)[M − 2H+]2−0.82
49985.4627985.4668Fuc-GD1(d18:1/16:2)[M − 3H+ + Na+]2−4.16
50987.4895987.4837Fuc-GD1(d18:1/18:3)[M − 2H+]2−5.88
51989.499989.4999Fuc-GD1(d18:1/18:1)[M − 2H+]2−0.91
52990.5132990.5078Fuc-GD1(d18:1/18:0)[M − 2H+]2−5.45
53991.5171991.515Fuc-GD1(d18:0/18:0)[M − 2H+]2−2.12
54992.5197992.512Fuc-GT3(d18:1/24:3)[M − 2H+]2−7.76
55999.5188999.5123Fuc-GD1(t18:0/18:0)[M − 2H+]2−6.51
561004.5221004.523Fuc-GD1(d18:1/20:0)[M − 2H+]2−1.00
571007.48421007.482(CH3COO) GD1(d18:1/22:1)[M − 4H+ + 3Na+]2−2.18
581009.51751009.512(CH3COO) Fuc-GT3(d18:1/22:2)[M − 2H+]2−5.45
591013.49271013.496Fuc-GD1(d18:1/20:2)[M − 3H+ + Na+]23.26
601014.49951014.506Fuc-GD1(d18:1/20:1)[M − 3H+ + Na+]26.41
611018.95811018.96GT1(d18:1/12:2)[M − 2H+]2−1.87
621025.54971025.544Fuc-GD1(d18:1/23:0)[M − 2H+]2−5.56
631049.01691049.0102GT1(d18:1/16:0)[M − 2H+]2−6.39
641053.98231053.9842GT1(t18:1/16:3)[M − 2H+]2−1.80
651060.00791060.0010GT1(d18:1/16:0)[M − 3H+ + Na+]2−6.51
661062.0251062.018GT1(d18:1/18:1)[M − 2H+]2−6.59
671063.03291063.0260GT1(d18:1/18:0)[M − 2H+]2−6.49
681074.02311074.018GT1(d18:1/20:3)[M − 2H+]2−4.75
691077.04781077.042GT1(d18:1/20:0) and/or GT1(d20:1/18:0)[M − 2H+]2−5.39
701081.00811081.0065GT1(t18:1/18:1)[M − 3H+ + Na+]2−1.48
711083.00081082.992GT1(d18:1/18:2)[M − 4H+ + 2Na+]2−8.13
721084.03751084.031GT1(t18:1/20:1)[M − 2H+]2−6.00
731085.04061085.039GT1(t18:1/20:0)[M − 2H+]2−1.47
741086.05341086.047GT1(t18:0/20:0)[M − 2H+]2−5.89
751088.03821088.034GT1(d18:1/22:3)[M − 2H+]2−3.86
761091.06281091.0579GT1(d18:1/22:0)[M − 2H+]2−4.49
771095.02811095.023GT1(t18:1/22:4)[M − 2H+]2−4.66
781097.04441097.039GT1(t18:1/22:2)[M − 2H+]2−4.92
791102.05441102.048GT1(d18:1/22:0)[M − 3H+ + Na+]2−5.81
801103.01021103.02(CH3COO) GT1(d18:1/18:1)[M − 2H+ + Na+]2−8.88
811109.04381109.0390GT1(t18:1/24:4)[M − 2H+]2−4.33
821112.0611112.0624GT1(t18:1/24:1)[M − 2H+]2−1.26
831114.08181114.078GT1(t18:0/24:0)[M − 2H+]2−3.41
841117.07791117.0716GT1(d18:0/24:0)[M − 3H+ + 2Na+]2−7.43
851208.58081208.574GQ1(d18:1/18:0)[M − 2H+]2−5.63
861218.56621218.557GQ1(d18:1/18:1)[M − 3H+ + Na+]2−7.55
871219.57131219.565GQ1(d18:1/18:0)[M − 3H+ + Na+]2−5.17
881222.59671222.5899GQ1(d18:1/20:0)[M − 2H+]2−5.56
891229.58711229.579O-Ac-GQ1(d18:1/18:0)[M − 2H+]2−6.59
901244.57841244.571GQ1(d18:1/20:0) and/or GQ1(d20:1/18:0)[M − 4H+ + 2Na+]2−5.95
911544.87651544.869GM1(d18:1/18:0)[M − H+]4.86
Publisher’s Note: MDPI stays neutral with regard to jurisdictional claims in published maps and institutional affiliations.

