1. Introduction
Nanoparticles (NPs) have been widely employed in drug delivery systems (DDS) because they can increase drug absorption and bioavailability by enhancing drug dissolution rates and improving selective uptake in certain tissues. As important as DDS, organic polymeric methoxy poly (ethylene glycol)-poly (ε-caprolactone) (mPEG-PCL) NPs have attracted considerable attention due to their characteristics involving amphiphilicity, biodegradability, and excellent biocompatibility [
1]. Taking advantage of enhanced permeability and retention (EPR) effects [
2], many NPs synthesised by mPEG-PCL copolymers have been designed to deliver antineoplastic drugs to tumours. However, only a very small number of mPEG-PCL NP formulations have entered clinical research phases, mainly because few studies have evaluated the biodistribution of mPEG-PCL NPs in vivo [
1]. Furthermore, it has been estimated that, on average, only 0.7% of NP doses can enter tumours [
3]. Therefore, it is important to understand the in vivo behaviour of NPs to assess their efficacy and toxicity. Physiologically based pharmacokinetic (PBPK) modelling can be a valuable tool for describing, predicting, and simulating the in vivo absorption, distribution, metabolism, and excretion (ADME) of NPs. Based on the physiological values and anatomical features integrated by a system of mathematical equations, these models can not only predict and quantify drug exposure in blood and each organ, but also compare data from different administration routes and scale-up such data from animals to humans [
4].
PBPK modelling is a useful tool for dealing with various types of NPs such as quantum dots (QDs) [
5], silver NPs [
6], gold/dendrimer composite NPs [
7], and poly (lactic-co-glycolic) acid (PLGA) NPs [
8]. For example, a model of titanium dioxide (TiO
2) NPs has been extrapolated from animals to humans and has been demonstrated to be useful in assessing the risk of ingesting nano-TiO
2 [
9]. Early models did not address cellular phagocytosis, which is an important process affecting the behaviour of NPs in the body [
10]. However, a number of recent models have begun to consider cellular phagocytosis [
5,
7]. Liang et al. developed a PBPK model to characterise and predict the in vivo behaviour of long-circulating inorganic QD NPs (QD/NPs), suggesting that the biodistribution of QD/NPs is largely determined by the uptake and release of phagocytic cells (PCs) by targeted organs [
5]. Compared with PBPK models of inorganic metallic NPs and QD/NPs, much less research involving organic polymeric NPs and cellular phagocytosis has been reported. To date, there have been only a small number of reports concerning polymeric NPs and mechanisms involved in cellular phagocytosis [
7,
11,
12,
13,
14,
15]. For example, Li et al. evaluated the biodistribution of polyethylene glycol-coated polyacrylamide (PEG/PAA) NPs using a PBPK model based on the mechanism of cellular phagocytosis, which indicated that the phagocytosing cell (PC) system greatly affected the pharmacokinetic behaviour of PEG/PAA NPs [
11].
According to previous studies, when developing and validating PBPK models of NPs, one of the main challenges is the lack of rapid and reliable analytical approaches [
16,
17]. This is because the ADME processes involving NPs are much more complex than those of small molecules. In addition, it is much more difficult to isolate NPs from tissues than from plasma samples. In contrast to radioactivity measurements and traditional isolation methods, in our study, we developed a novel type of NP using environmentally responsive near-infrared (NIR) aza-boron-dipyrromethene (aza-BODIPY) dyes, as shortened to P2 [
18]. A distinctive characteristic of P2-labelled mPEG-PCL NPs is their ability to emit fluorescence with an integral state of NPs, and in quenching fluorescence immediately after the P2 dye is released from the NPs and makes contact with water. By tracking the signals of P2, we were able to explore the in vivo fate of integral NPs. Here, we synthesised five mPEG-PCL NP formulations with different sizes, different ratios of mPEG-PCL/PCL, and different weights of mPEG coating. Next, a PBPK model for the five mPEG-PCL NP formulations was successfully generated by directly fitting the observed concentration data at the organ level in mice. This PBPK model of NPs can be used to quantitatively describe and predict concentration–time profiles and exposure of the five NP formulations in blood and individual organs. Our results showed that the PBPK model was accurate, reliable, and highly predictive of the in vivo pharmacokinetics of NPs, and could be potentially used to guide NP design and extrapolate pharmacokinetic data obtained in animals to those in humans. Our findings suggested that PBPK modelling offers a superior understanding of the in vivo fate of polymeric NPs through the comparison of key parameters in such PBPK models.
3. Discussion
It is important to understand the ADME properties of polymeric NPs because many of them are used in therapeutic and imaging fields [
19,
20]. PBPK modelling has been a useful tool for evaluating the in vivo distribution of NPs. However, to date, there are few papers that have referred to polymeric NPs in PBPK modelling [
7,
8,
11,
12,
13,
14,
21,
22], and so far, there have been no reports dealing with mPEG-PCL NPs using PBPK models. We synthesised five mPEG-PCL NP formulations involving different sizes, different ratios of mPEG-PCL/PCL, and different weights of coating mPEG. Then, a PBPK model for the five mPEG-PCL NP formulations was successfully built by directly fitting the observed concentration data at the organ level in mice. The PBPK modelling of five mPEG-PCL NPs can not only provide a strategy to study the in vivo behaviour of mPEG-PCL NPs, but also can help to extrapolate from animals to humans and predict likely pharmacokinetic parameters involving mPEG-PCL NPs in humans. In PBPK modelling of NPs, identifying integral particles from probe signals has been one of the biggest challenges in analytical approaches toward NPs [
16]. It has been reported that the signals of 1, 10-dioctadecyl-3, 3, 30, 30-tetramethylindotricarbocyanine iodide dye-encapsulated NPs (DiR-NPs) can display sustained, high level fluorescence at even when DiR is released from NPs [
23]. The radioactivity measurement of dissected animal organs is not only time consuming and tedious, but also it is difficult to determine whether the NPs are integrated particles [
16]. In our studies, the water-quenching NIR fluorescent probe P2 has been proven one of the more accurate signals for monitoring the in vivo fate and integrity of NPs [
23]. Thus, the PBPK model established in this study was much more accurate for predicting and simulating the in vivo biodistribution of mPEG-PCL NPs.
A very important issue for PBPK modelling of NPs is the selection of the model structure. According to transportation mechanisms, PBPK models are generally divided into two groups: blood-flow-limited and membrane-limited models [
4]. Previous studies have shown that the pharmacokinetics of NPs with small sizes, such as PEG-coated gold NPs (AuNPs) of 13 nm, are well described by the membrane-limited model, whereas 100 nm AuNPs worked well in the blood-flow-limited model [
7]. In the PBPK models of PEG/PAA NPs [
11,
12], blood flow- and membrane-limited models were adopted to describe the ADME process. The capillary blood and tissue compartments in the organs are described as membrane-limited processes. The two blood compartments were divided into two sub-compartments in which a blood-flow-limited process was adopted. In our PBPK models, we investigated both blood-flow- and membrane-limited models and found that membrane-limited models could be used to best simulate our experimental data. We also investigated whether phagocytosis in blood could help fit the model. However, no significant improvement was observed. Therefore, we did not include a subcompartment of PCs in the blood compartments. Thus, our PBPK structure was different to that of polymeric NPs and would be helpful for mPEG-PCL NPs in later PBPK modelling.
Some PBPK models of polymeric NPs did not consider the phagocytosis process [
8,
21], whereas a small number of studies do include them in PBPK models [
7,
11,
12]. Phagocytosis is a mechanistic process by which specific cells engulf NPs, forming an internal compartment named the phagosome. These specific cells, namely PCs, include reticuloendothelial system cells (mononuclear phagocyte system cells), organ-located cells such as Kupffer cells in the liver, red pulp macrophages in the spleen, alveolar macrophages in the lungs, and intraglomerular mesangial cells in the kidney. It has been reported that NP uptake by PCs causes several side effects [
2]. On the one hand, the body’s immune system can be damaged as NPs accumulate in organs over time. On the other hand, NPs resident in PCs could still act as a deposit inside the body and extend organ exposure duration when the stored NPs are slowly released from organs over time [
11]. Thus, it is crucial to describe the contribution and uptake mechanism involving phagocytosis of PCs in the in vivo disposition of NPs for the development of their safe use. In our studies, mPEG-PCL NPs were taken up by PCs immediately after they were injected into the bloodstream, which was consistent with the results of previous studies regarding polymeric NPs using PBPK models [
7,
21]. Tumour compartments need to be carefully constructed owing to their abnormal physiological features as well as their different mechanisms and kinetics for the disposition of NPs in normal tissues [
17]. To the best of our knowledge, we first attempted to integrate EPR effects into a tumour sub-compartment in a PBPK-based model involving polymeric NPs based on assumptions defined in previous studies [
24]. The tumour in our PBPK model was considered as a compartment and divided into two sub-compartments, capillary blood and EPR, to study the EPR effects of mPEG-PCL NPs quantitatively (supporting information from the EPR-PBPK model). However, we found that it was still better to divide the tumour compartment into three sub-compartments, including PCs.
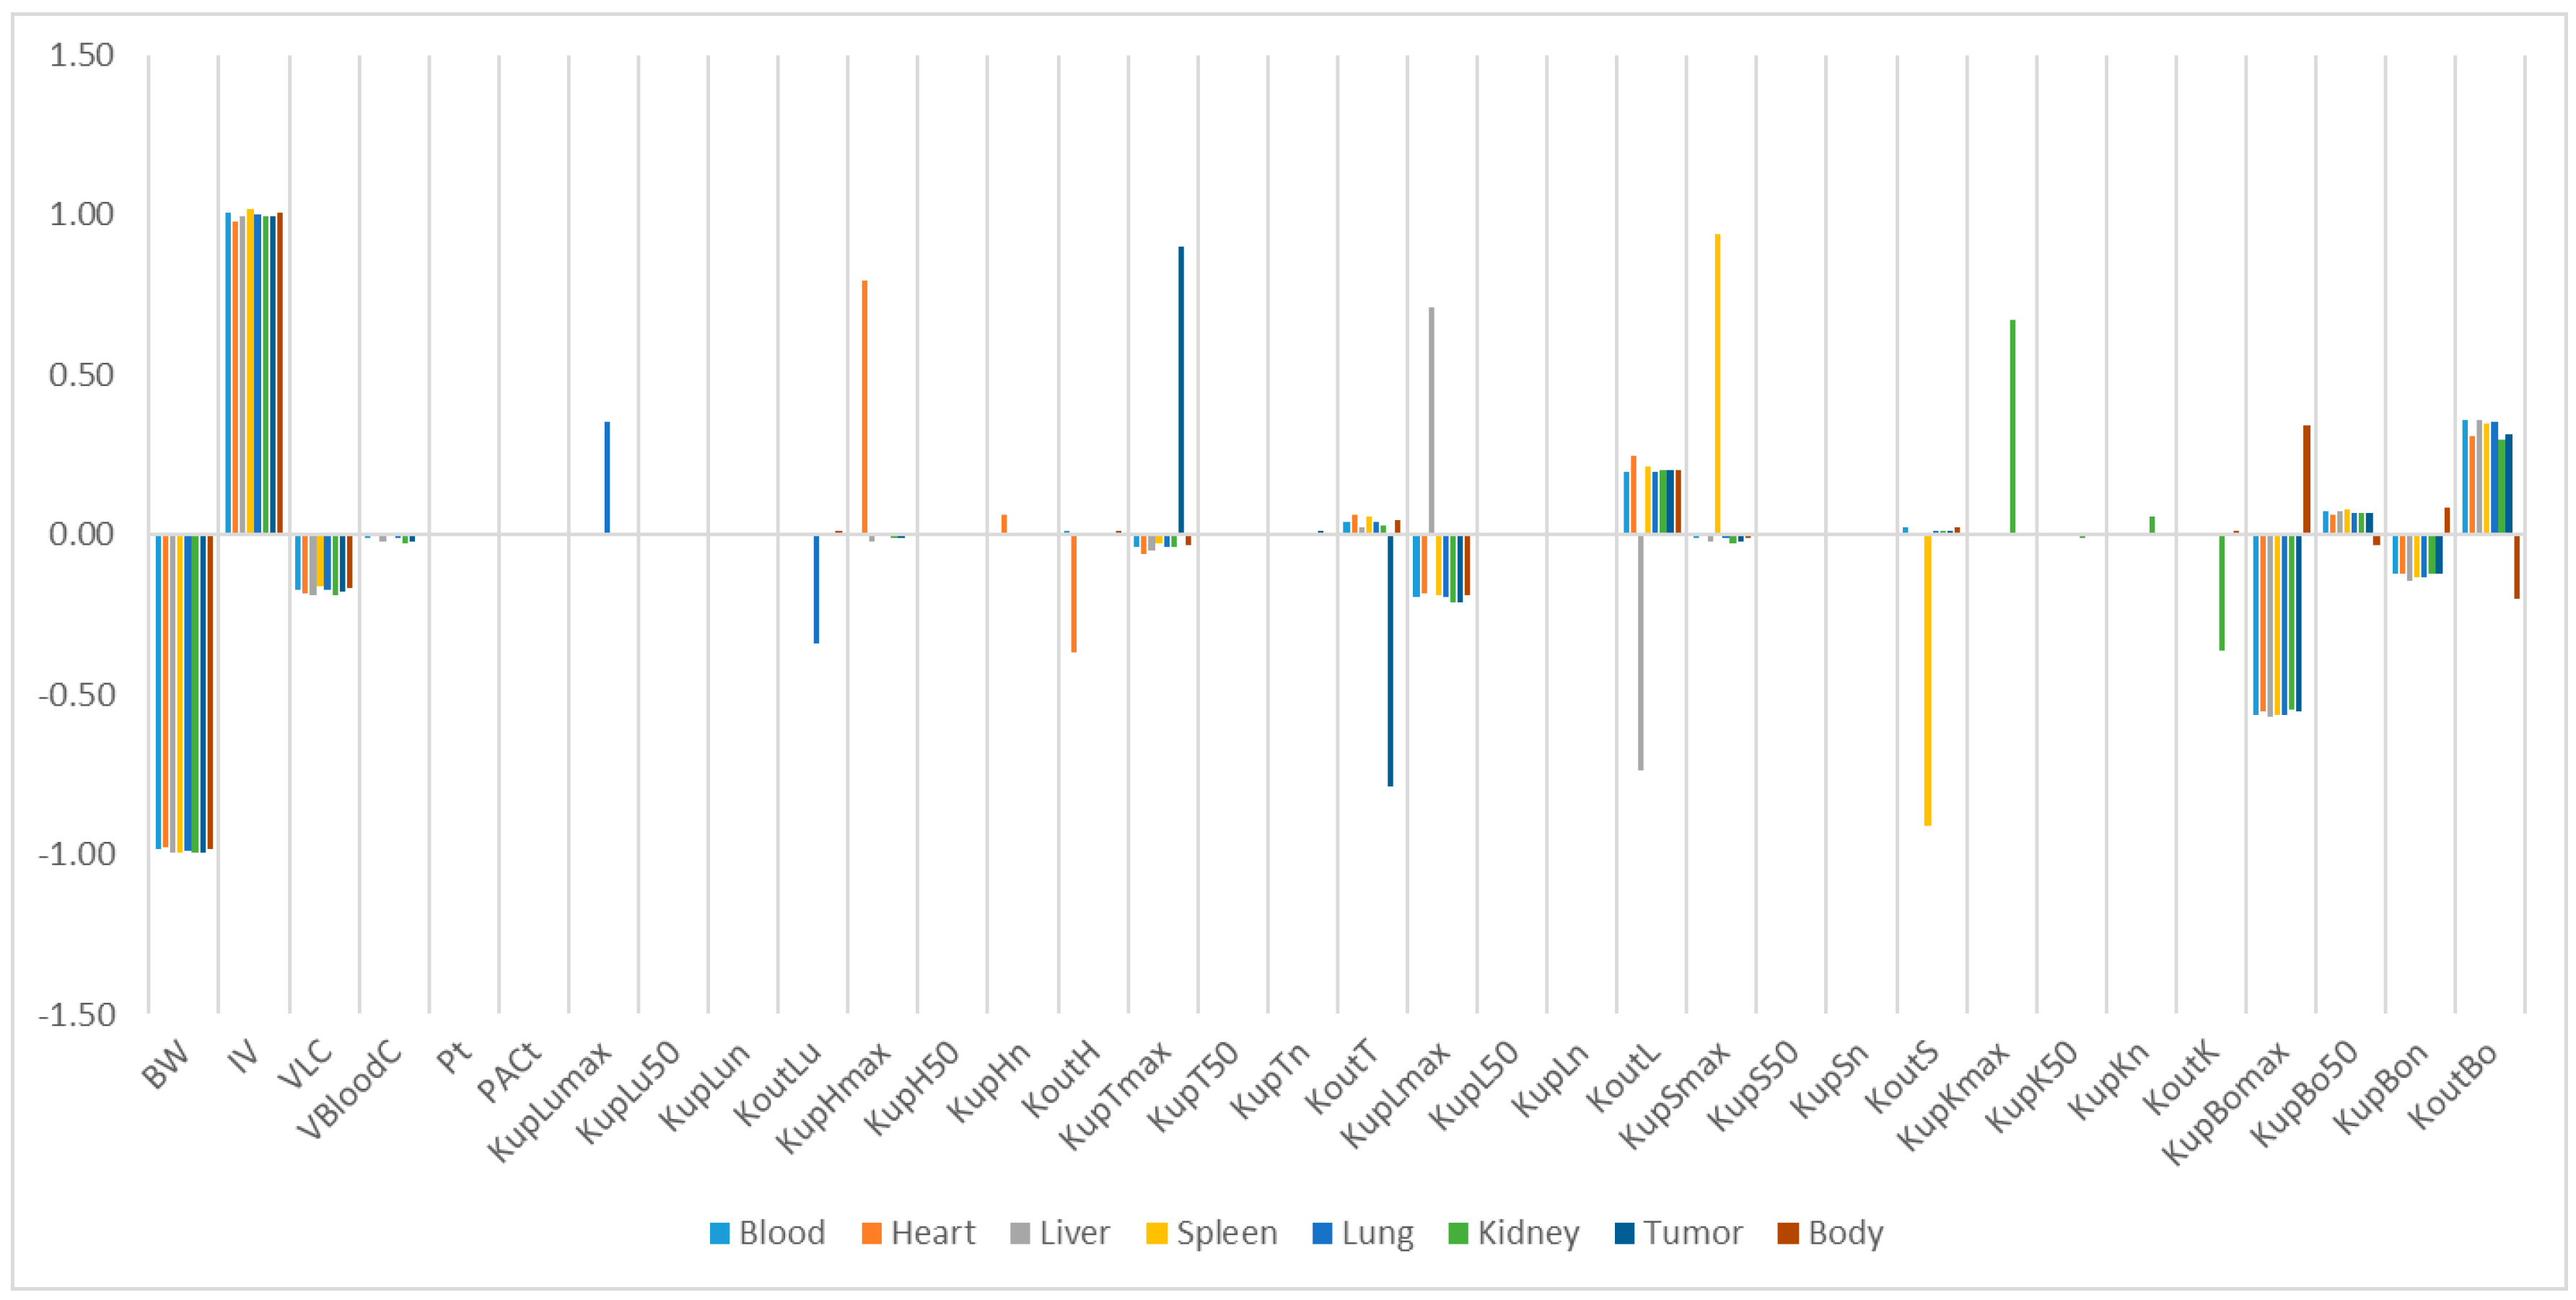
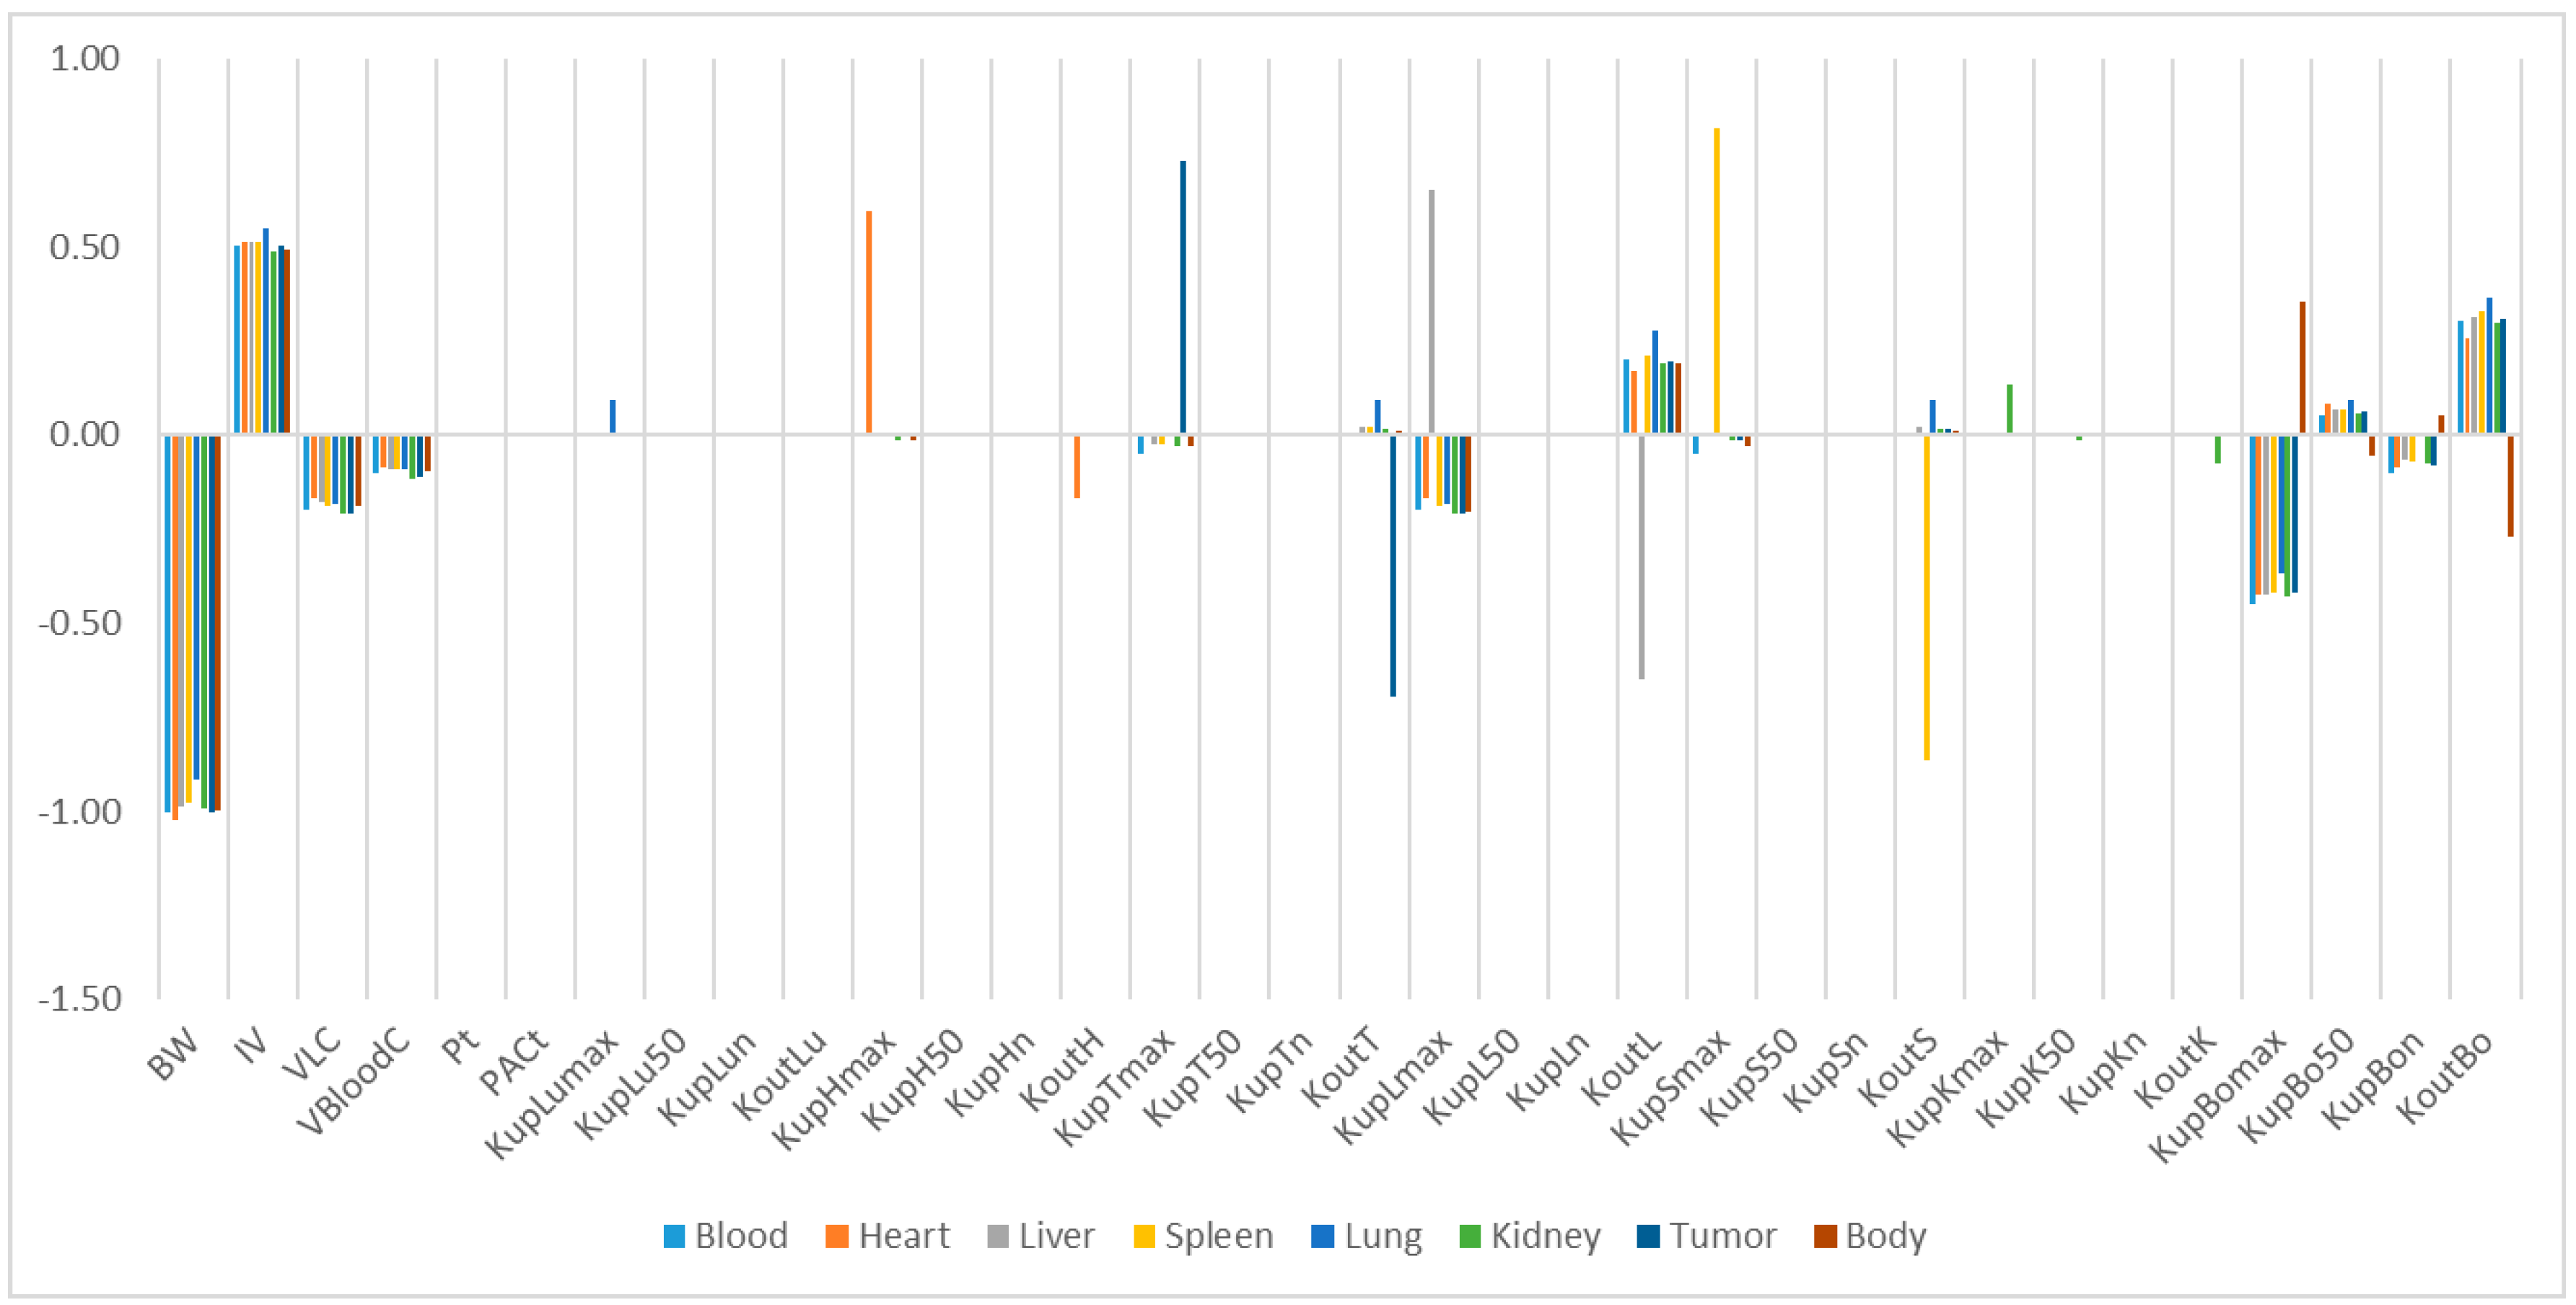
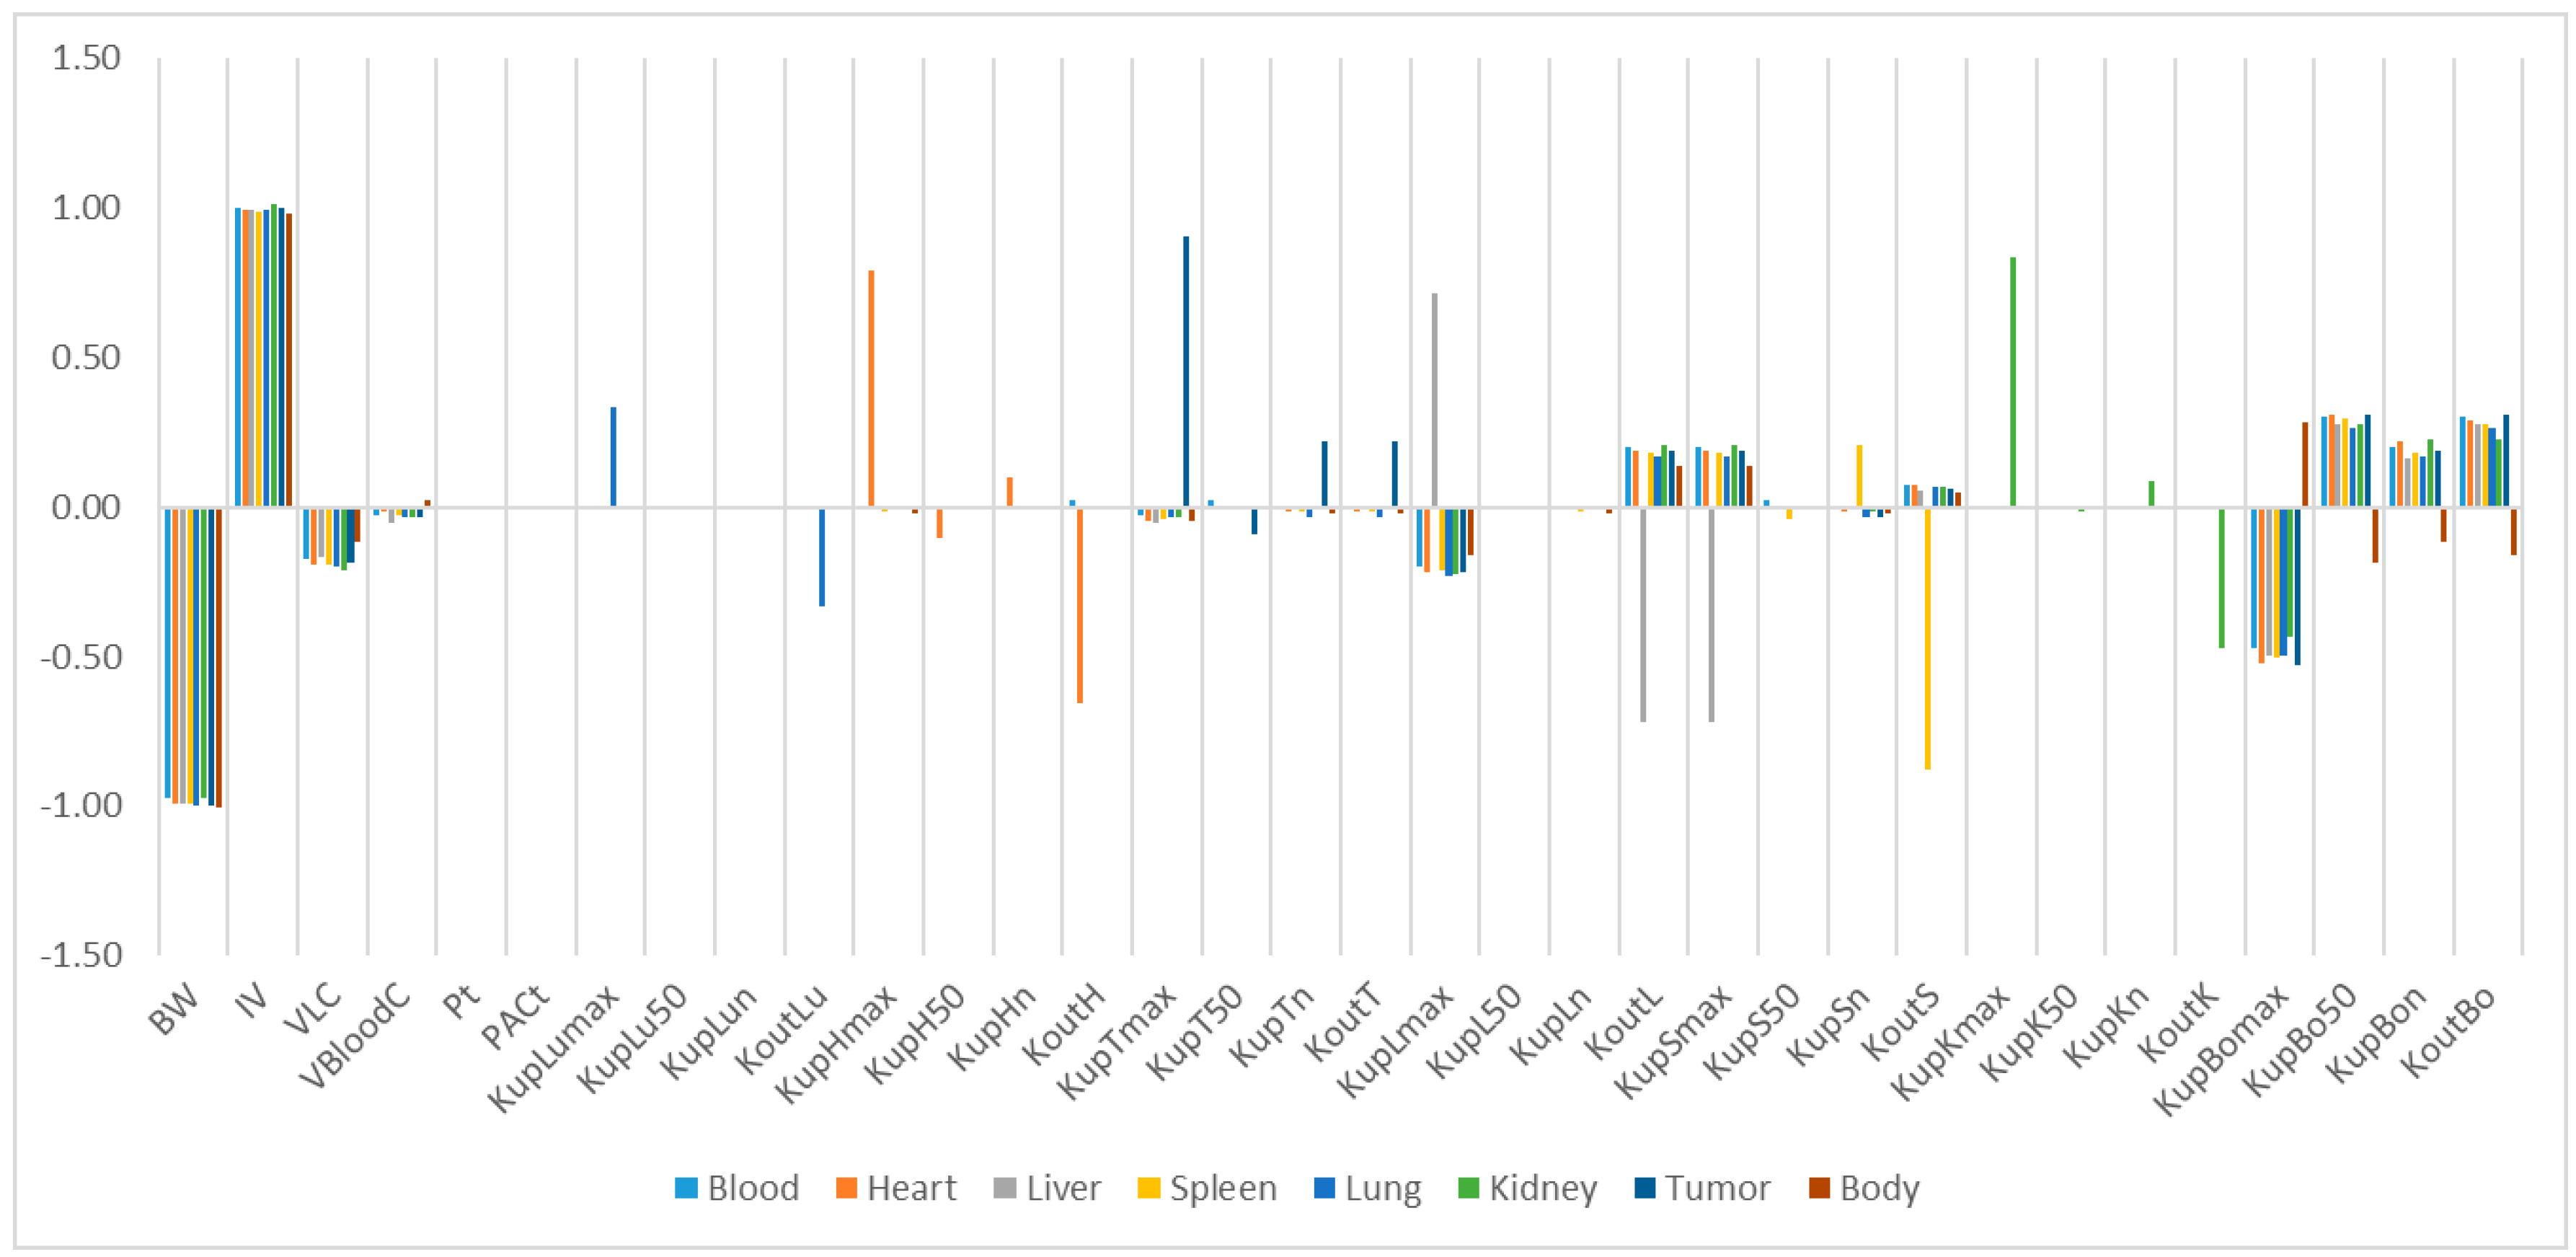
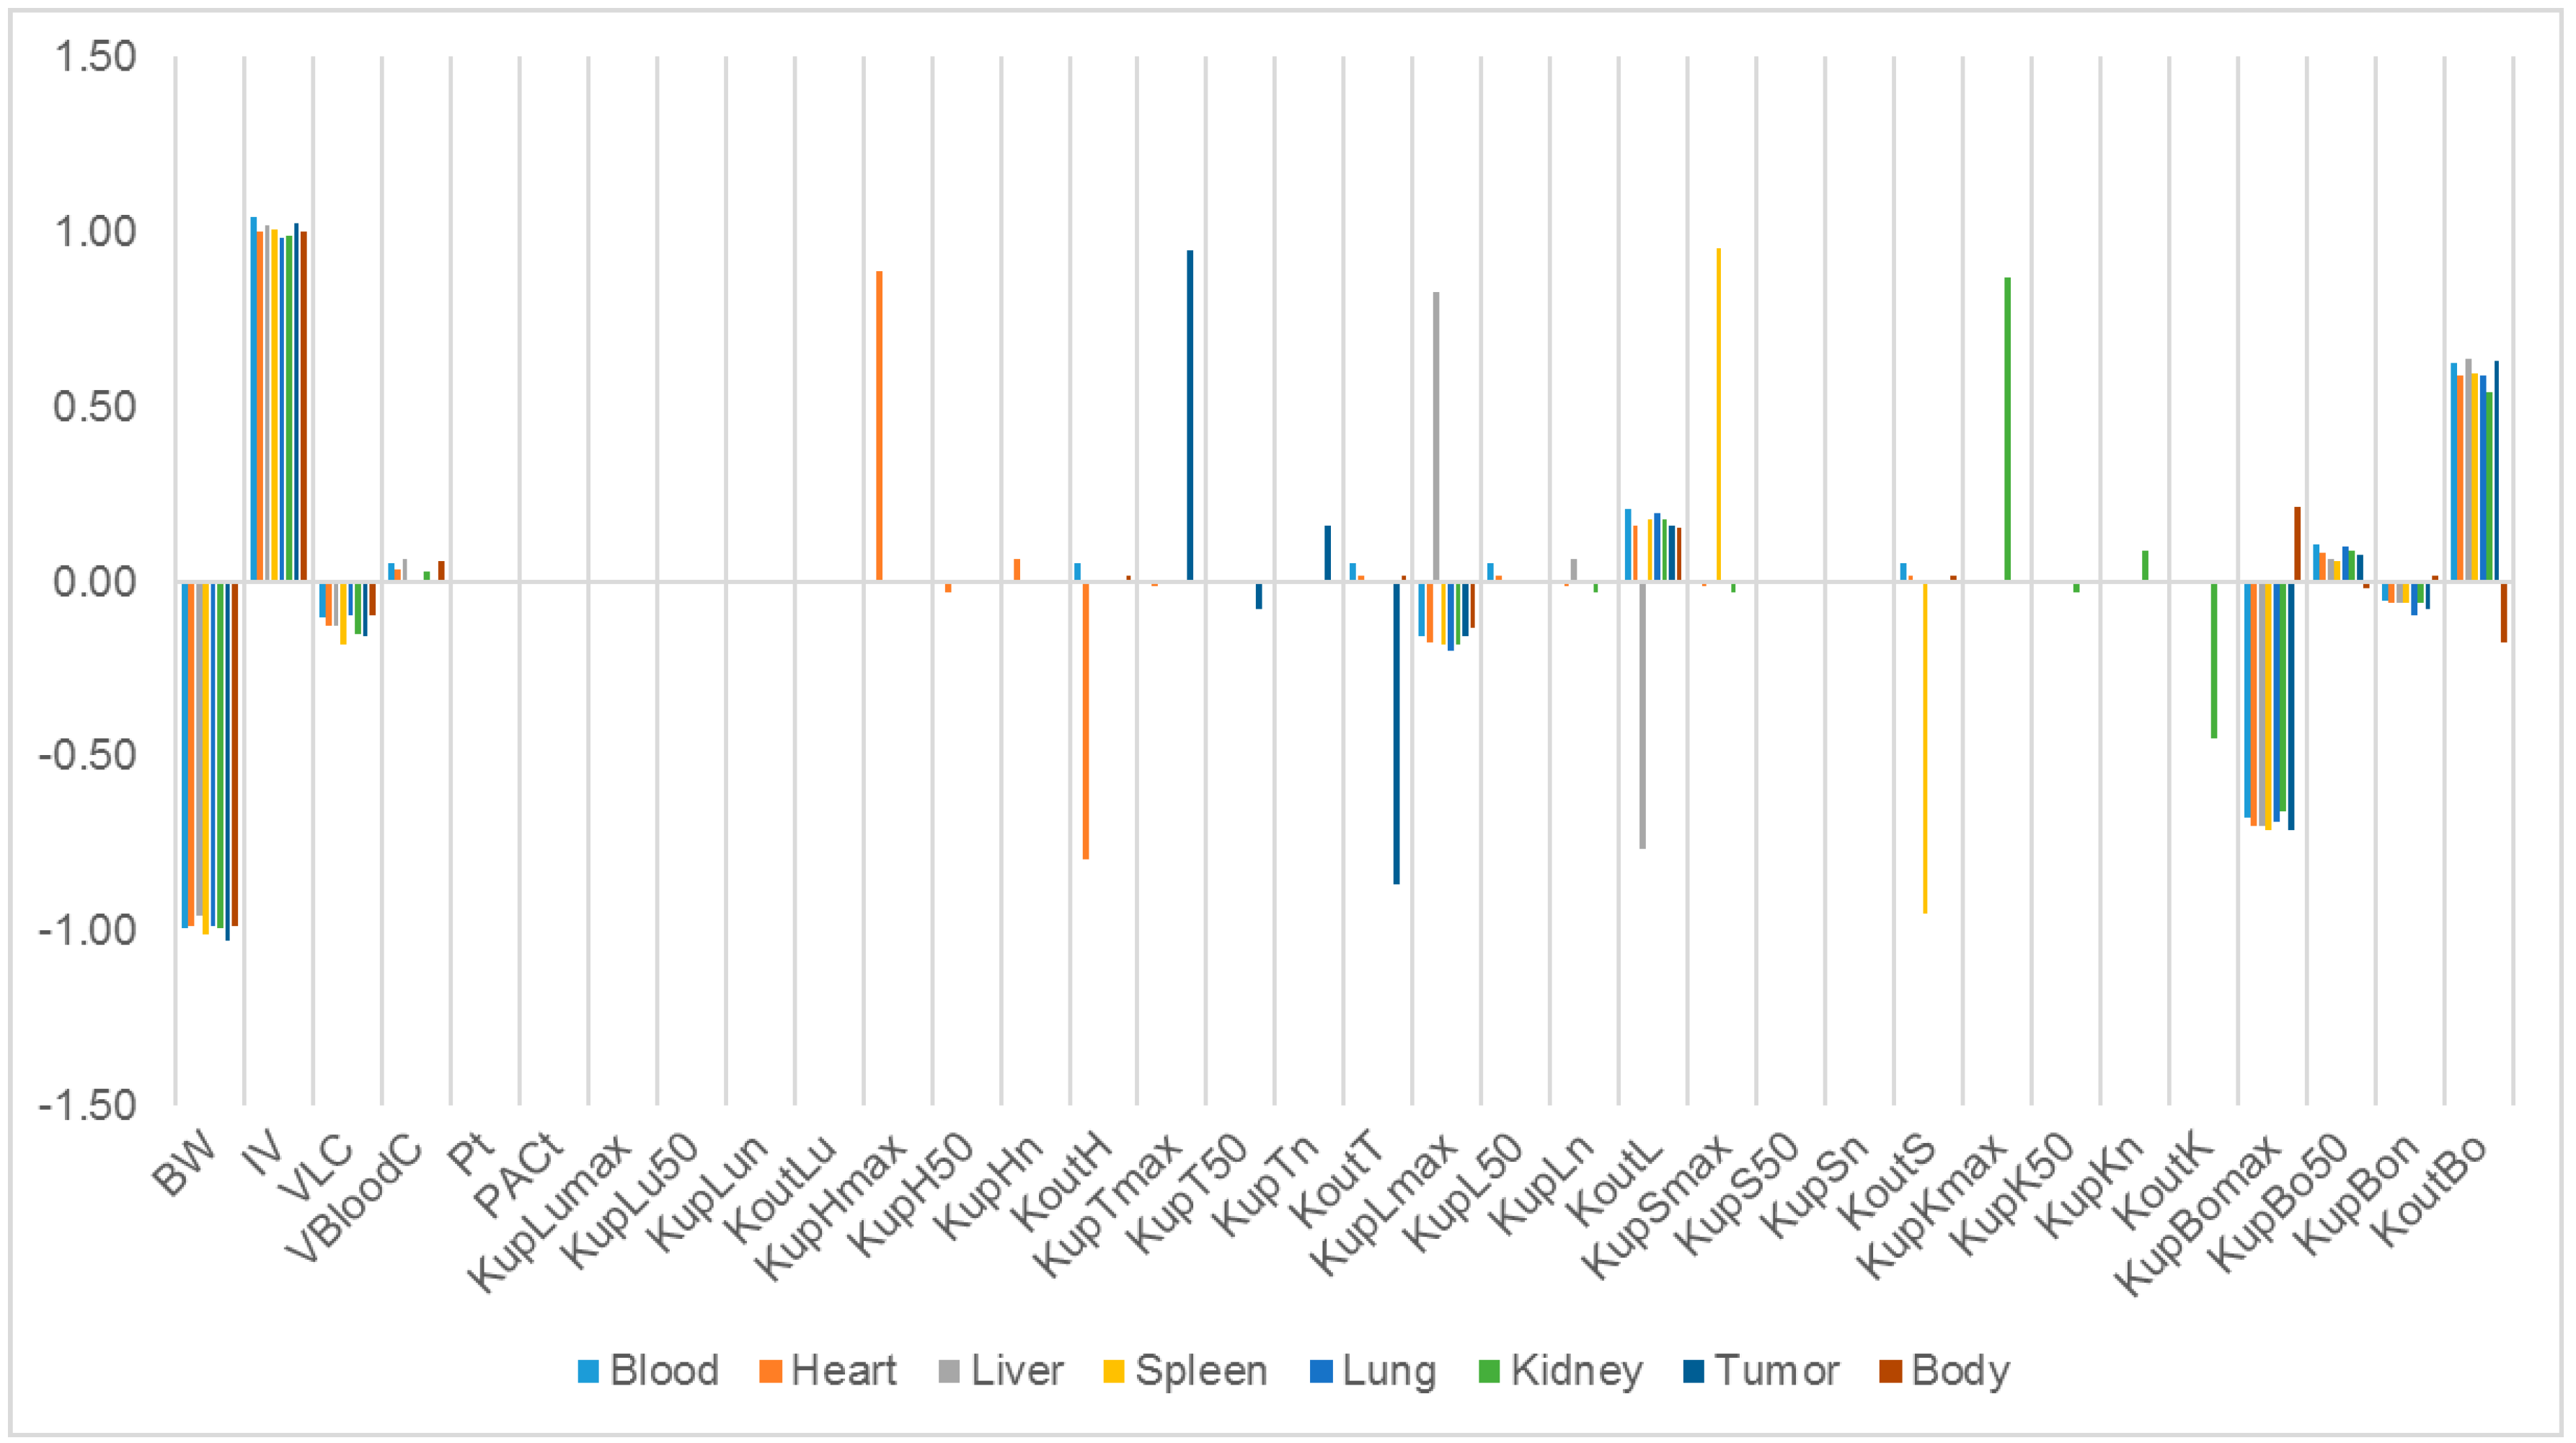
Our study identified some highly influential parameters in the biodistribution of mPEG-PCL NPs, such as BW, IV, K
max, and K
out of the tissues. The sensitivity analysis showed that K
max and K
out were two of the most influential parameters determining mPEG-PCL NP concentrations in organs. This is consistent with previous research [
7,
11,
20], indicating that phagocytosis is a key process for the biodistribution of mPEG-PCL NPs. We compared the K
max of the different NPs, which included phagocytosis as a compartment, and found that the K
max of PCs in our PBPK model was generally higher than those reported [
7,
11,
20]. This might be the reason that polymeric NPs are capable of actively targeting organs and cells such as hepatocytes [
21].
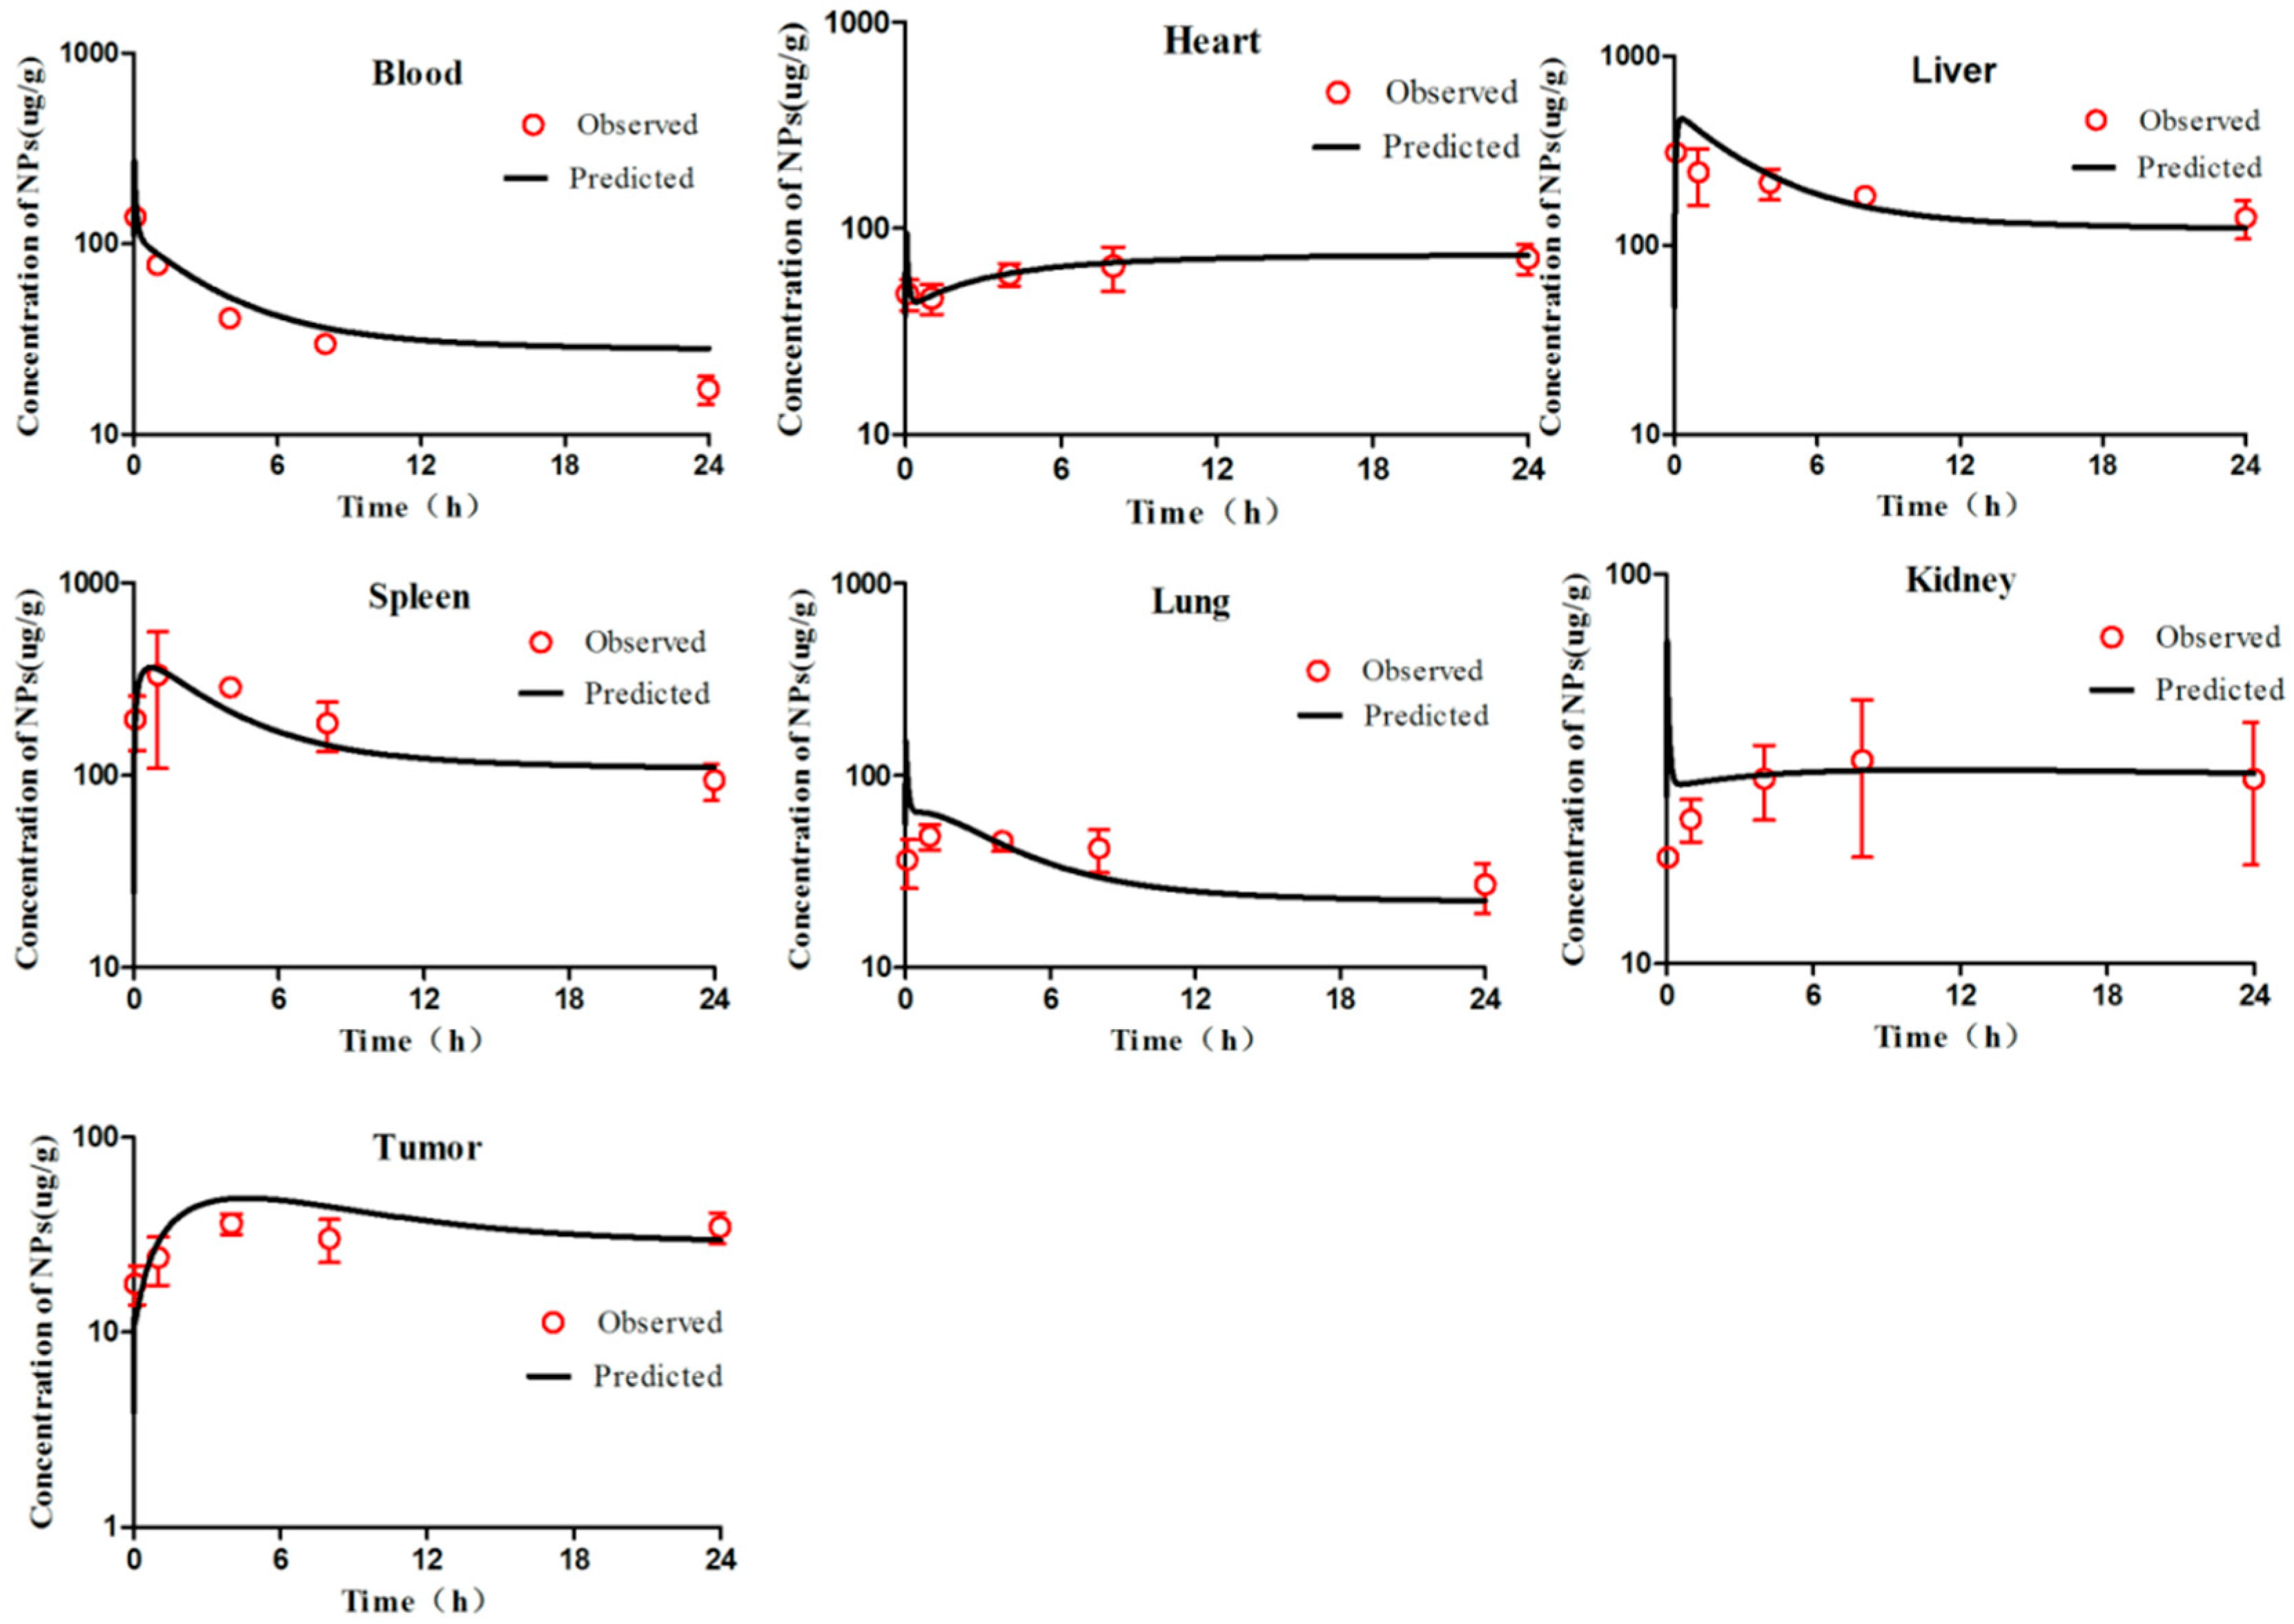
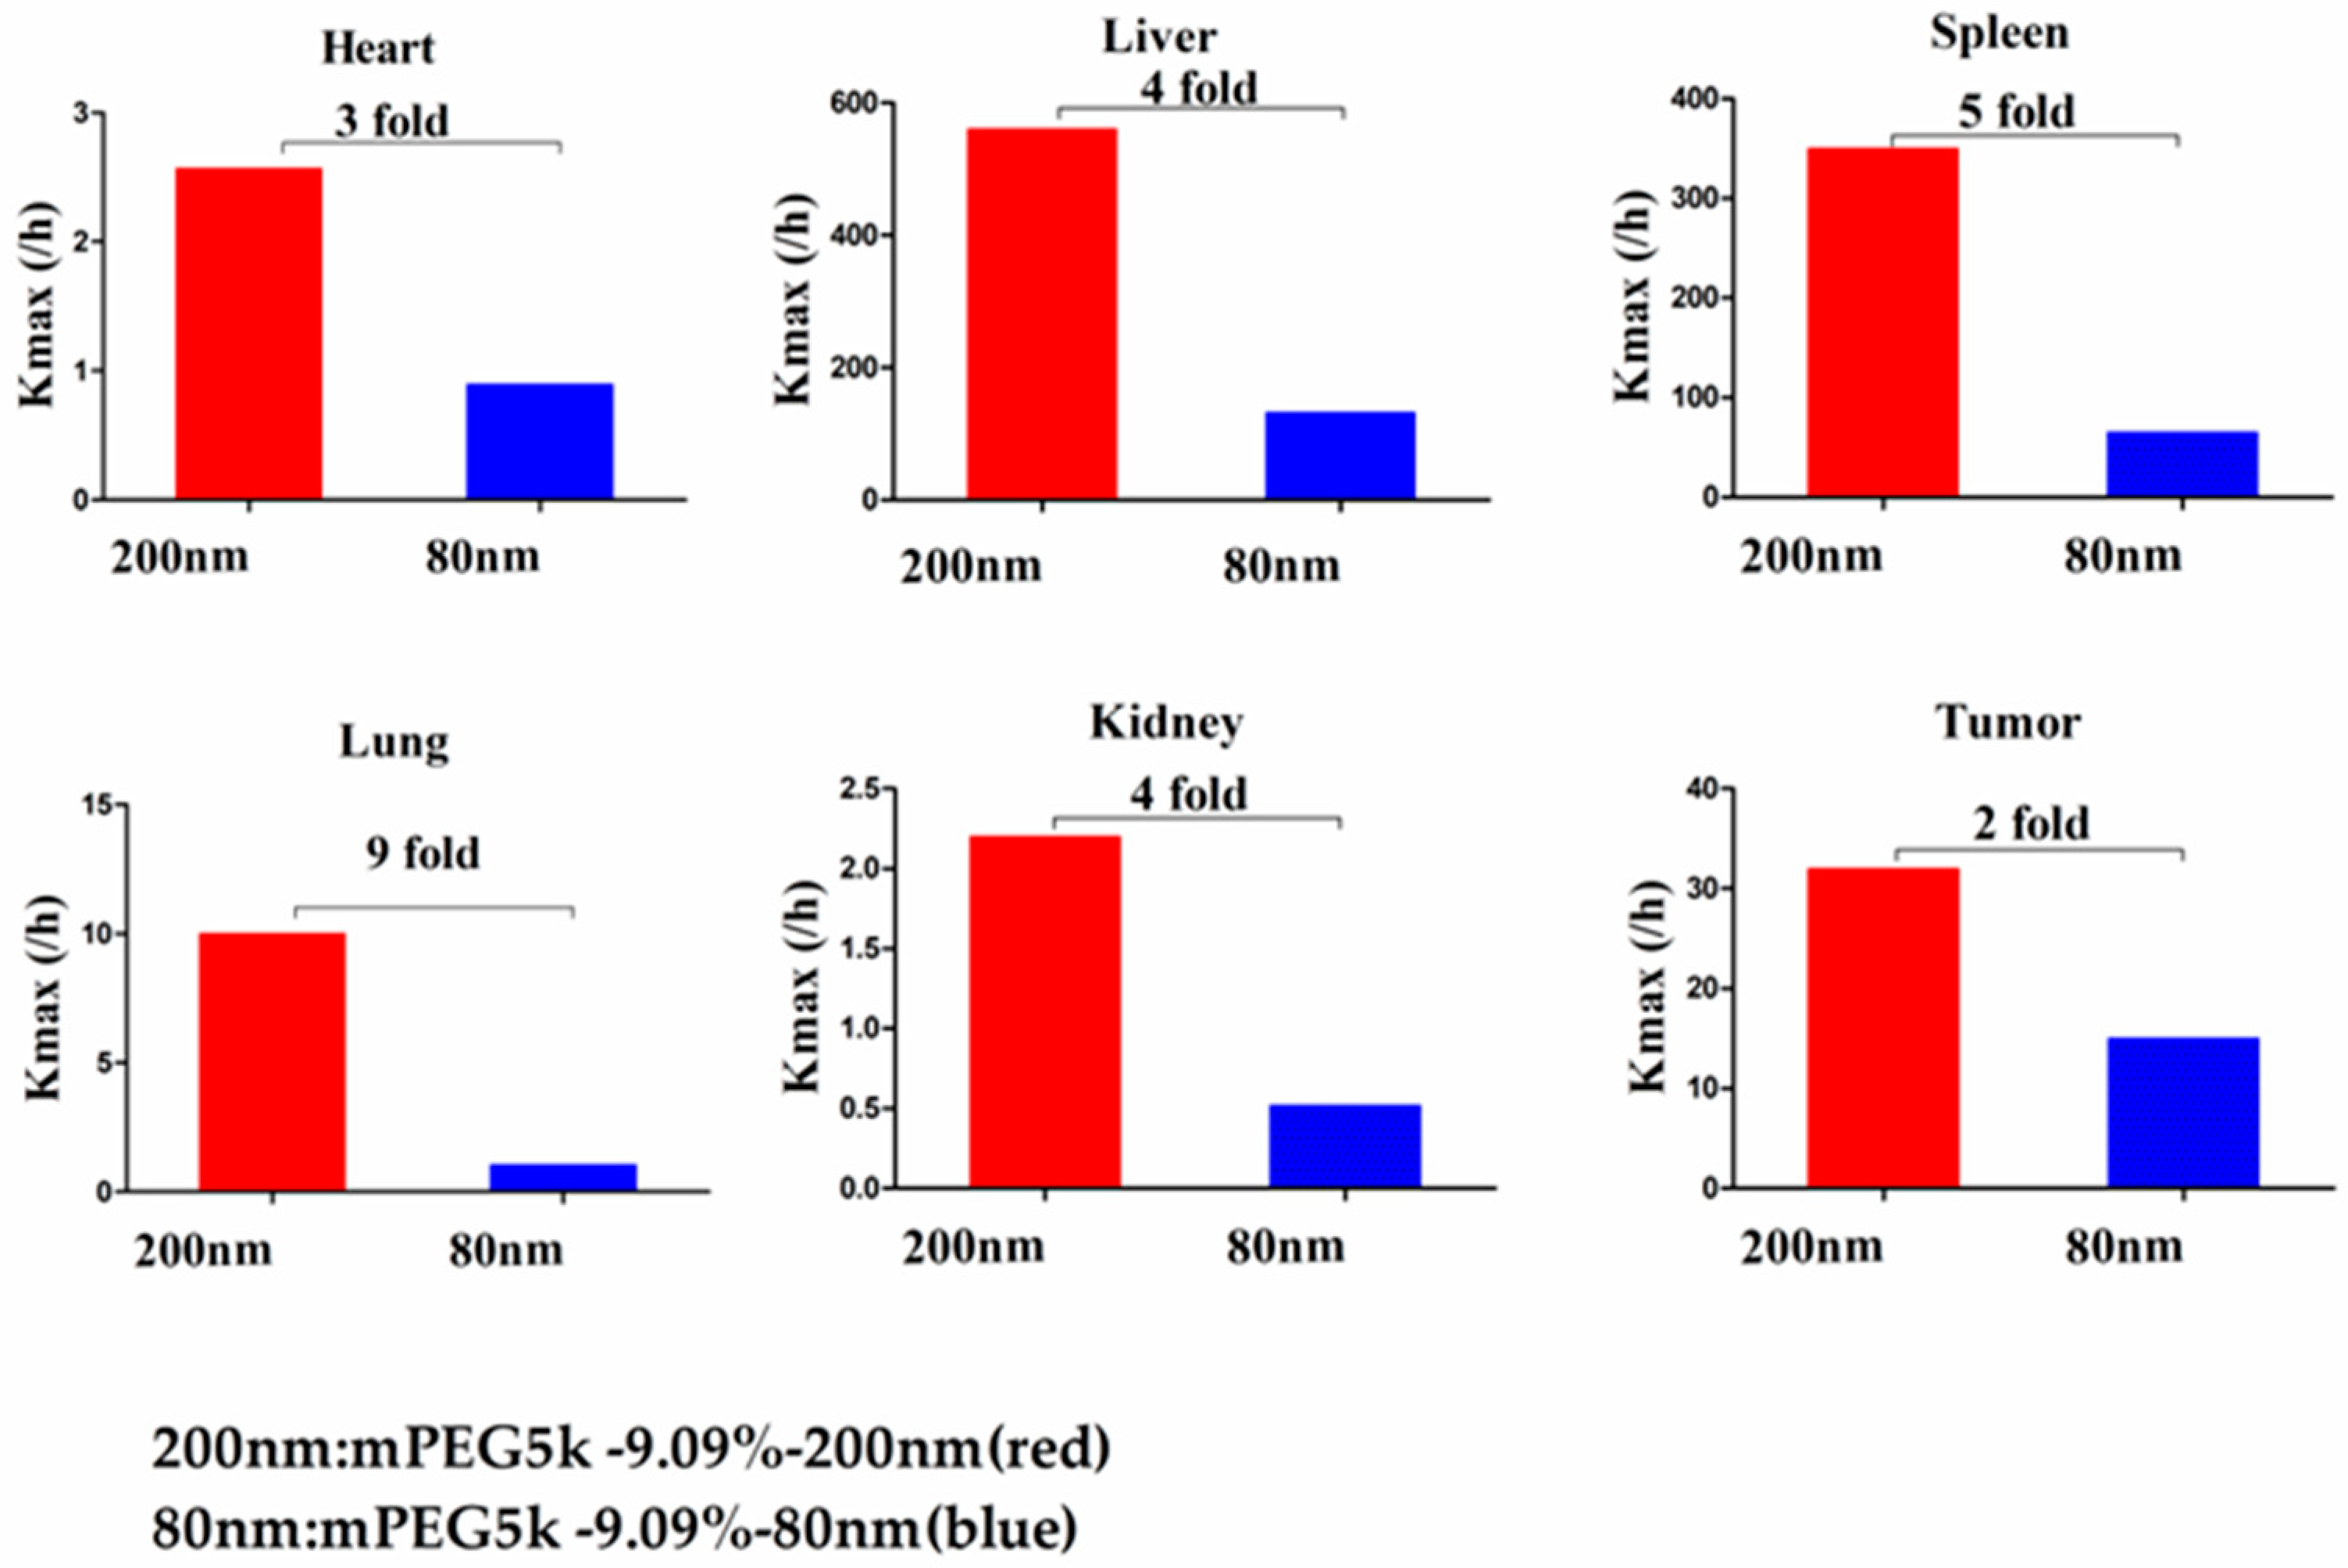
Compared with mPEG5k-9.09%-80 nm (
Figure 12), K
max (/h) in the PBPK model for mPEG5k-9.09%-200 nm was > two times in each tissue, and the K
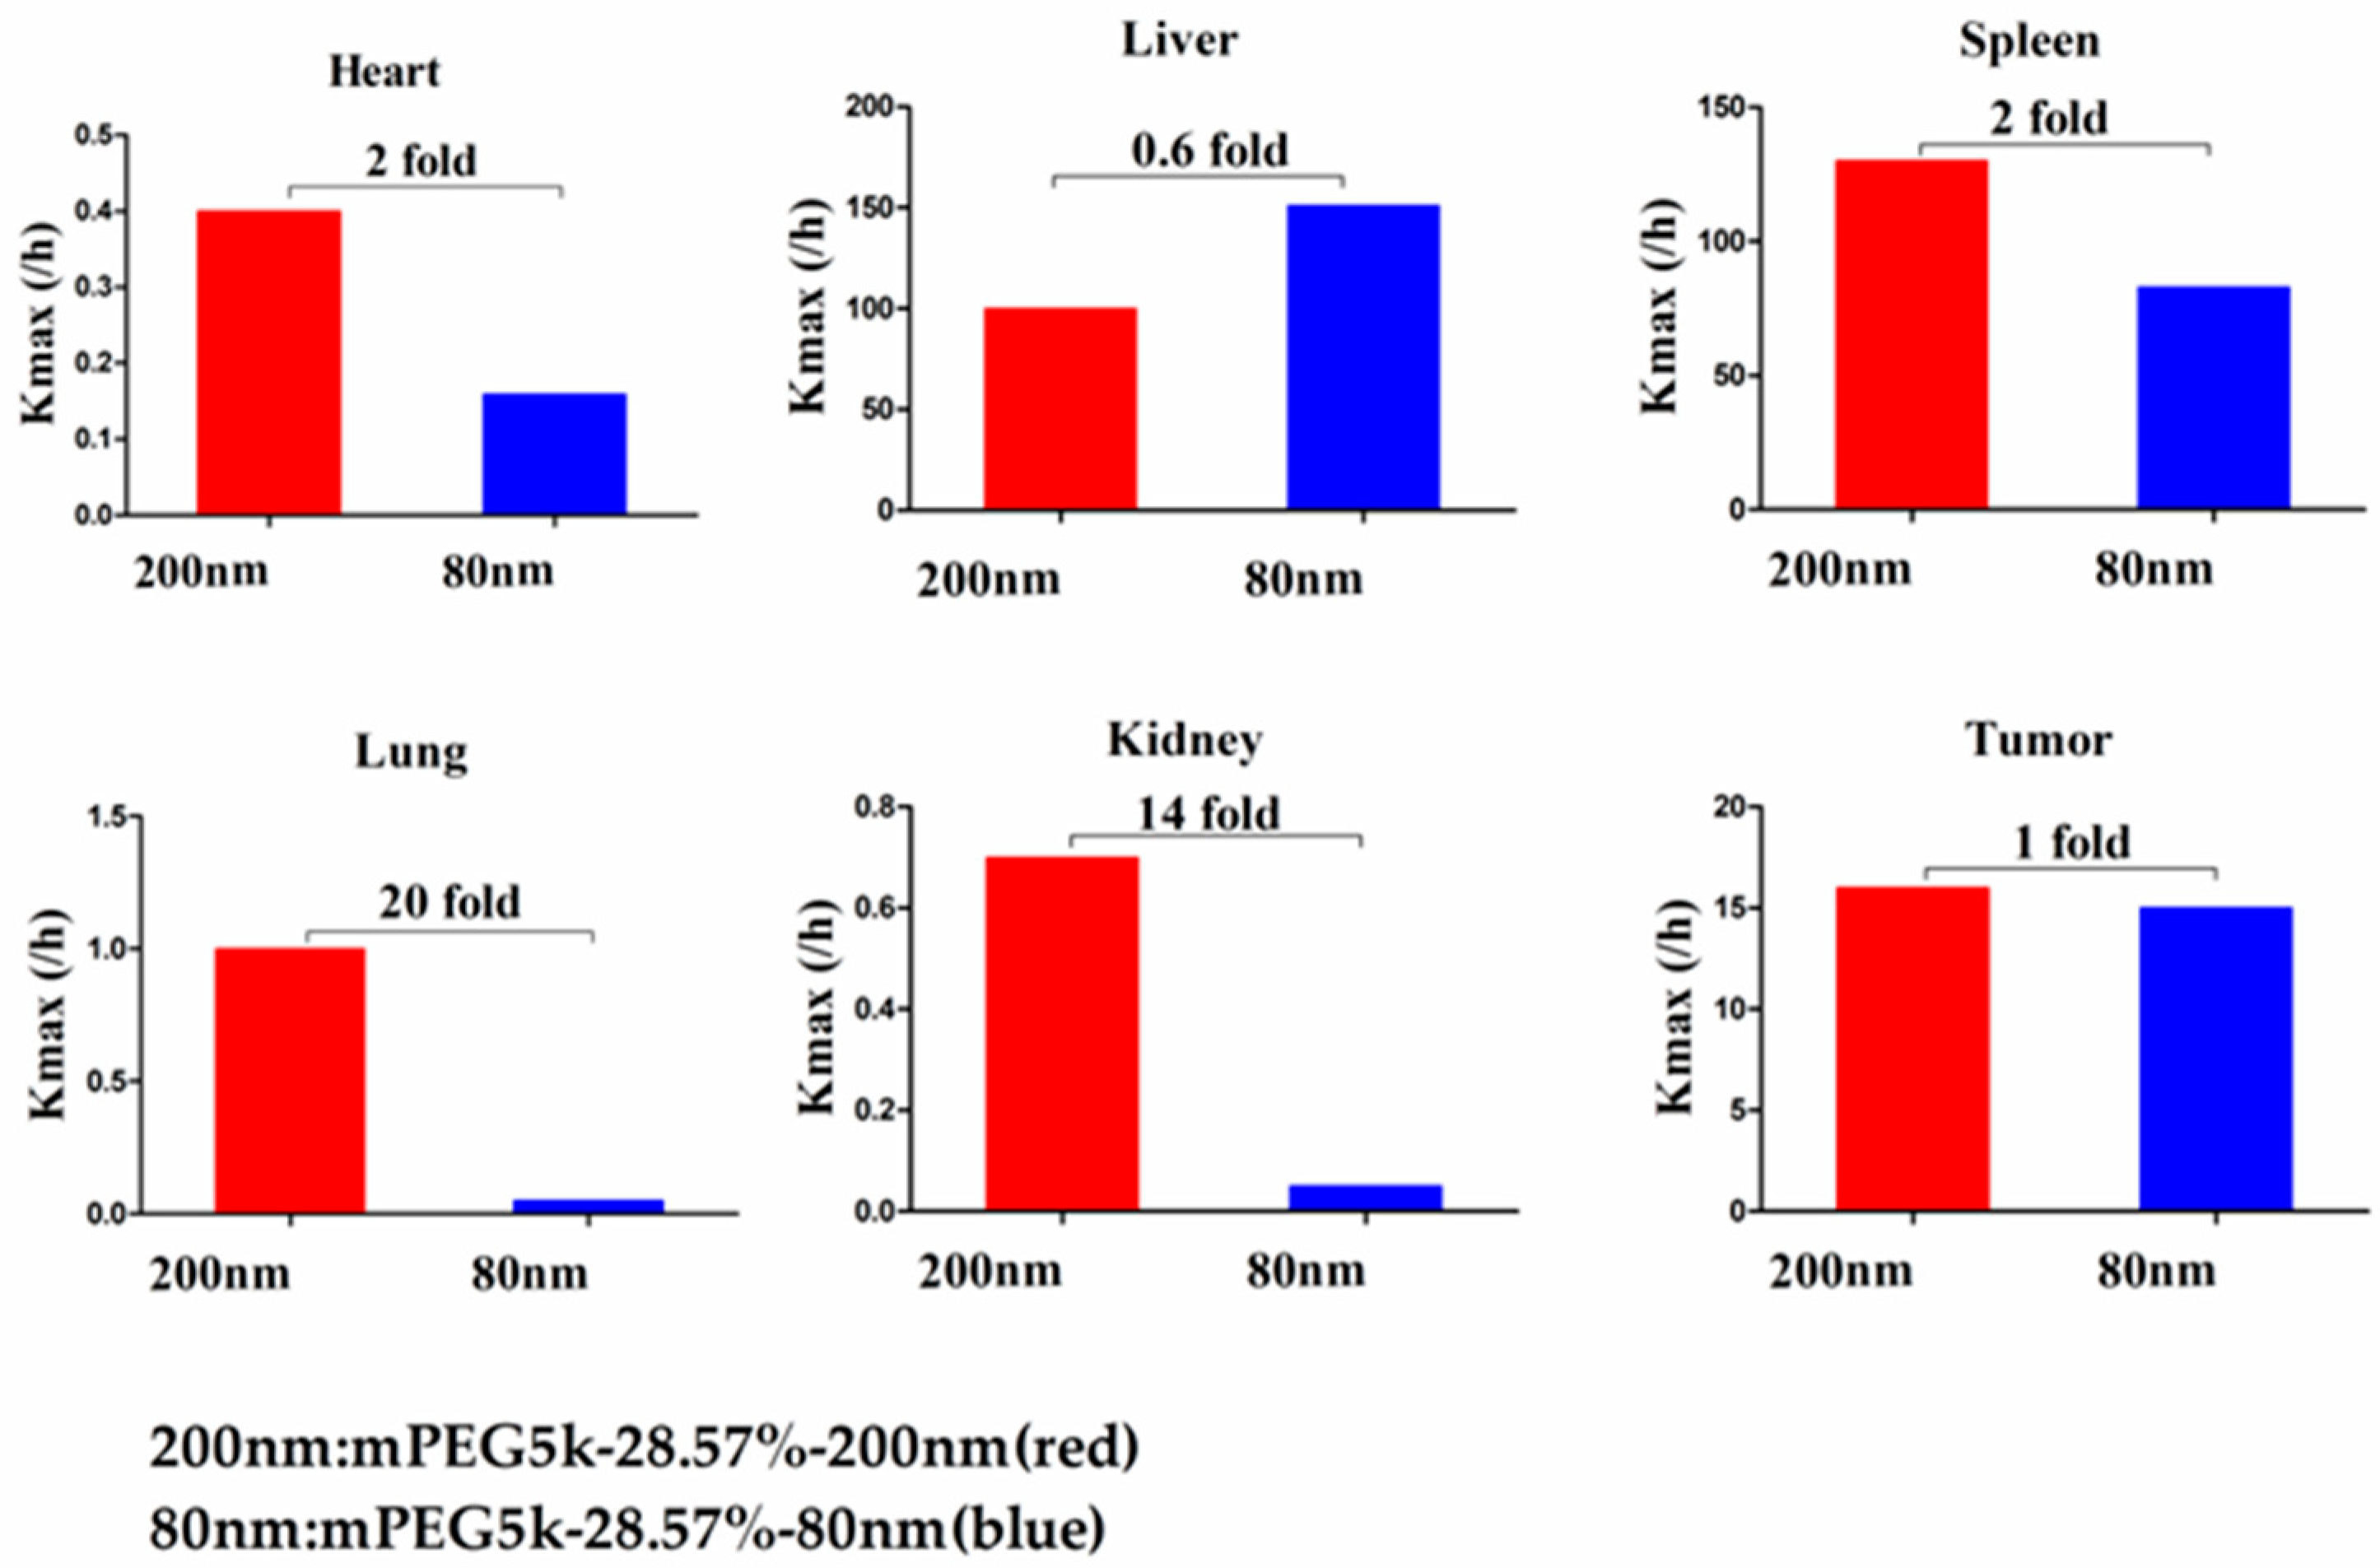
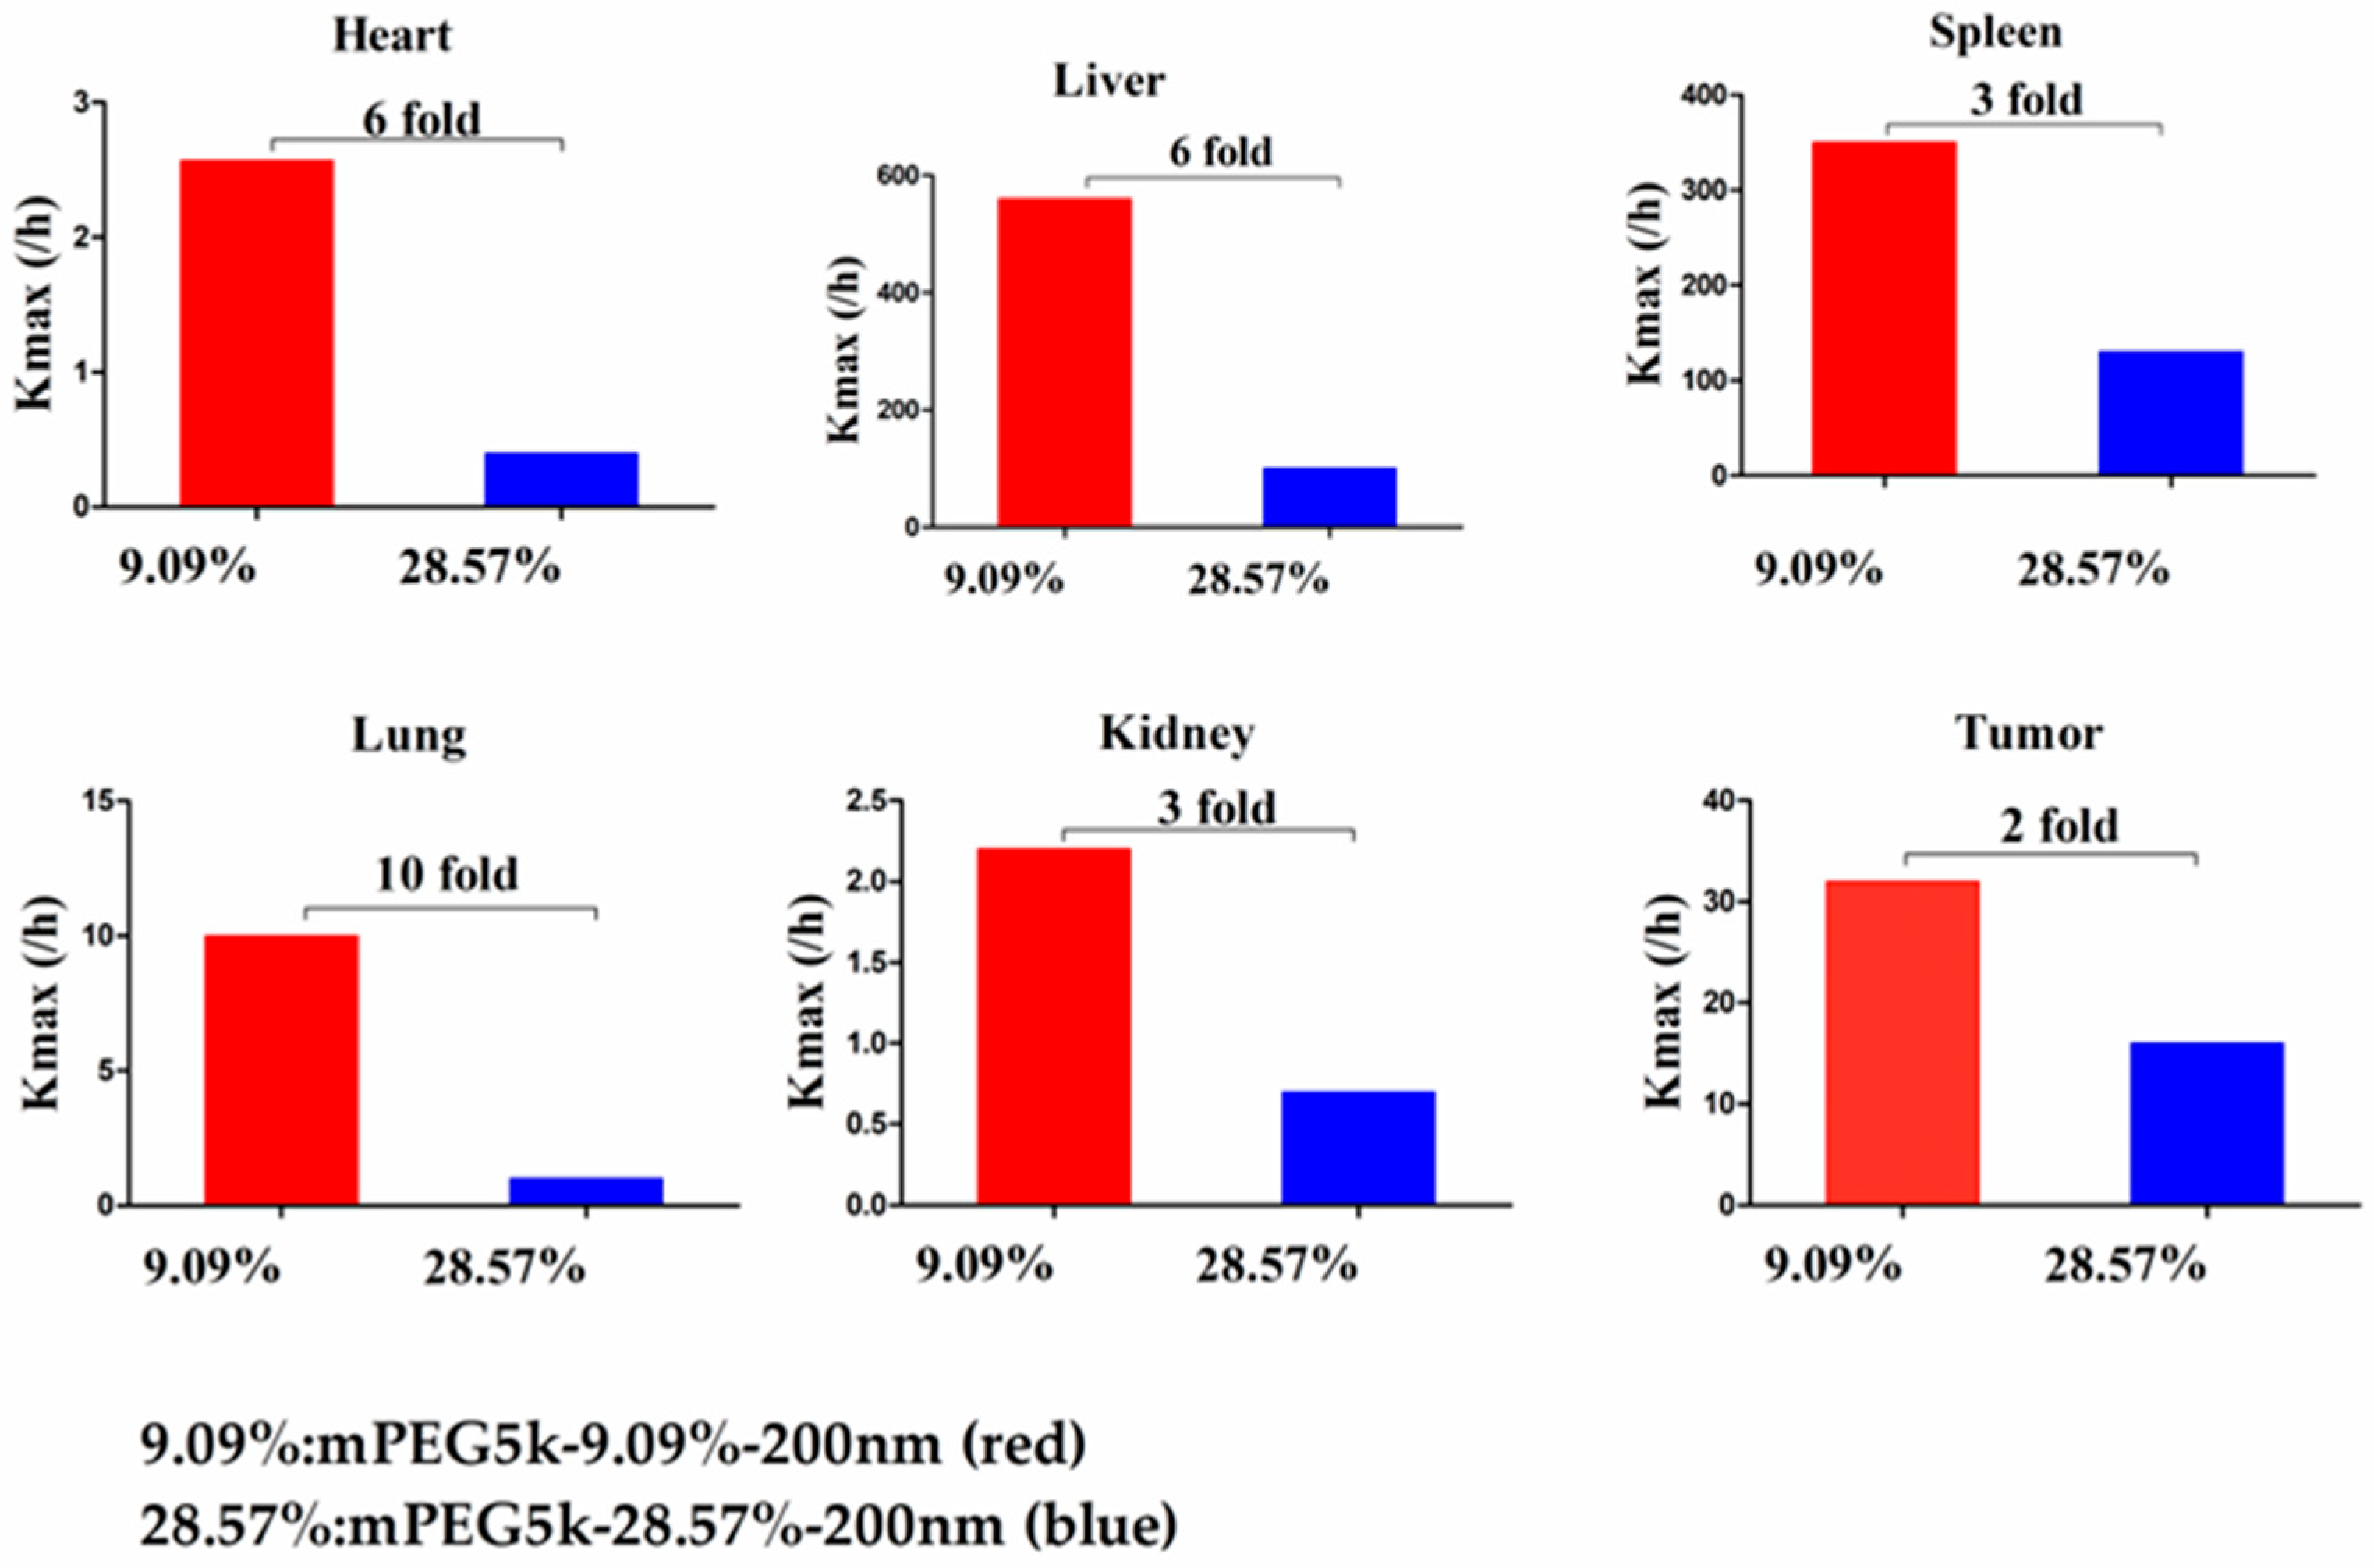
max (/h) in the lung was 9.62 times, and 2.13 times for tumours. Thus, we speculated that with the same mPEG5k modification of 9.09%, the 200 nm NPs were more easily phagocytosed by PCs in the tissues than 80 nm NPs, reducing the amount of NPs in blood, leading to a decreased amount circulating into the tumour tissue. For the two formulations of mPEG5k-28.57%-80 nm and mPEG5k-28.57%-200 nm (
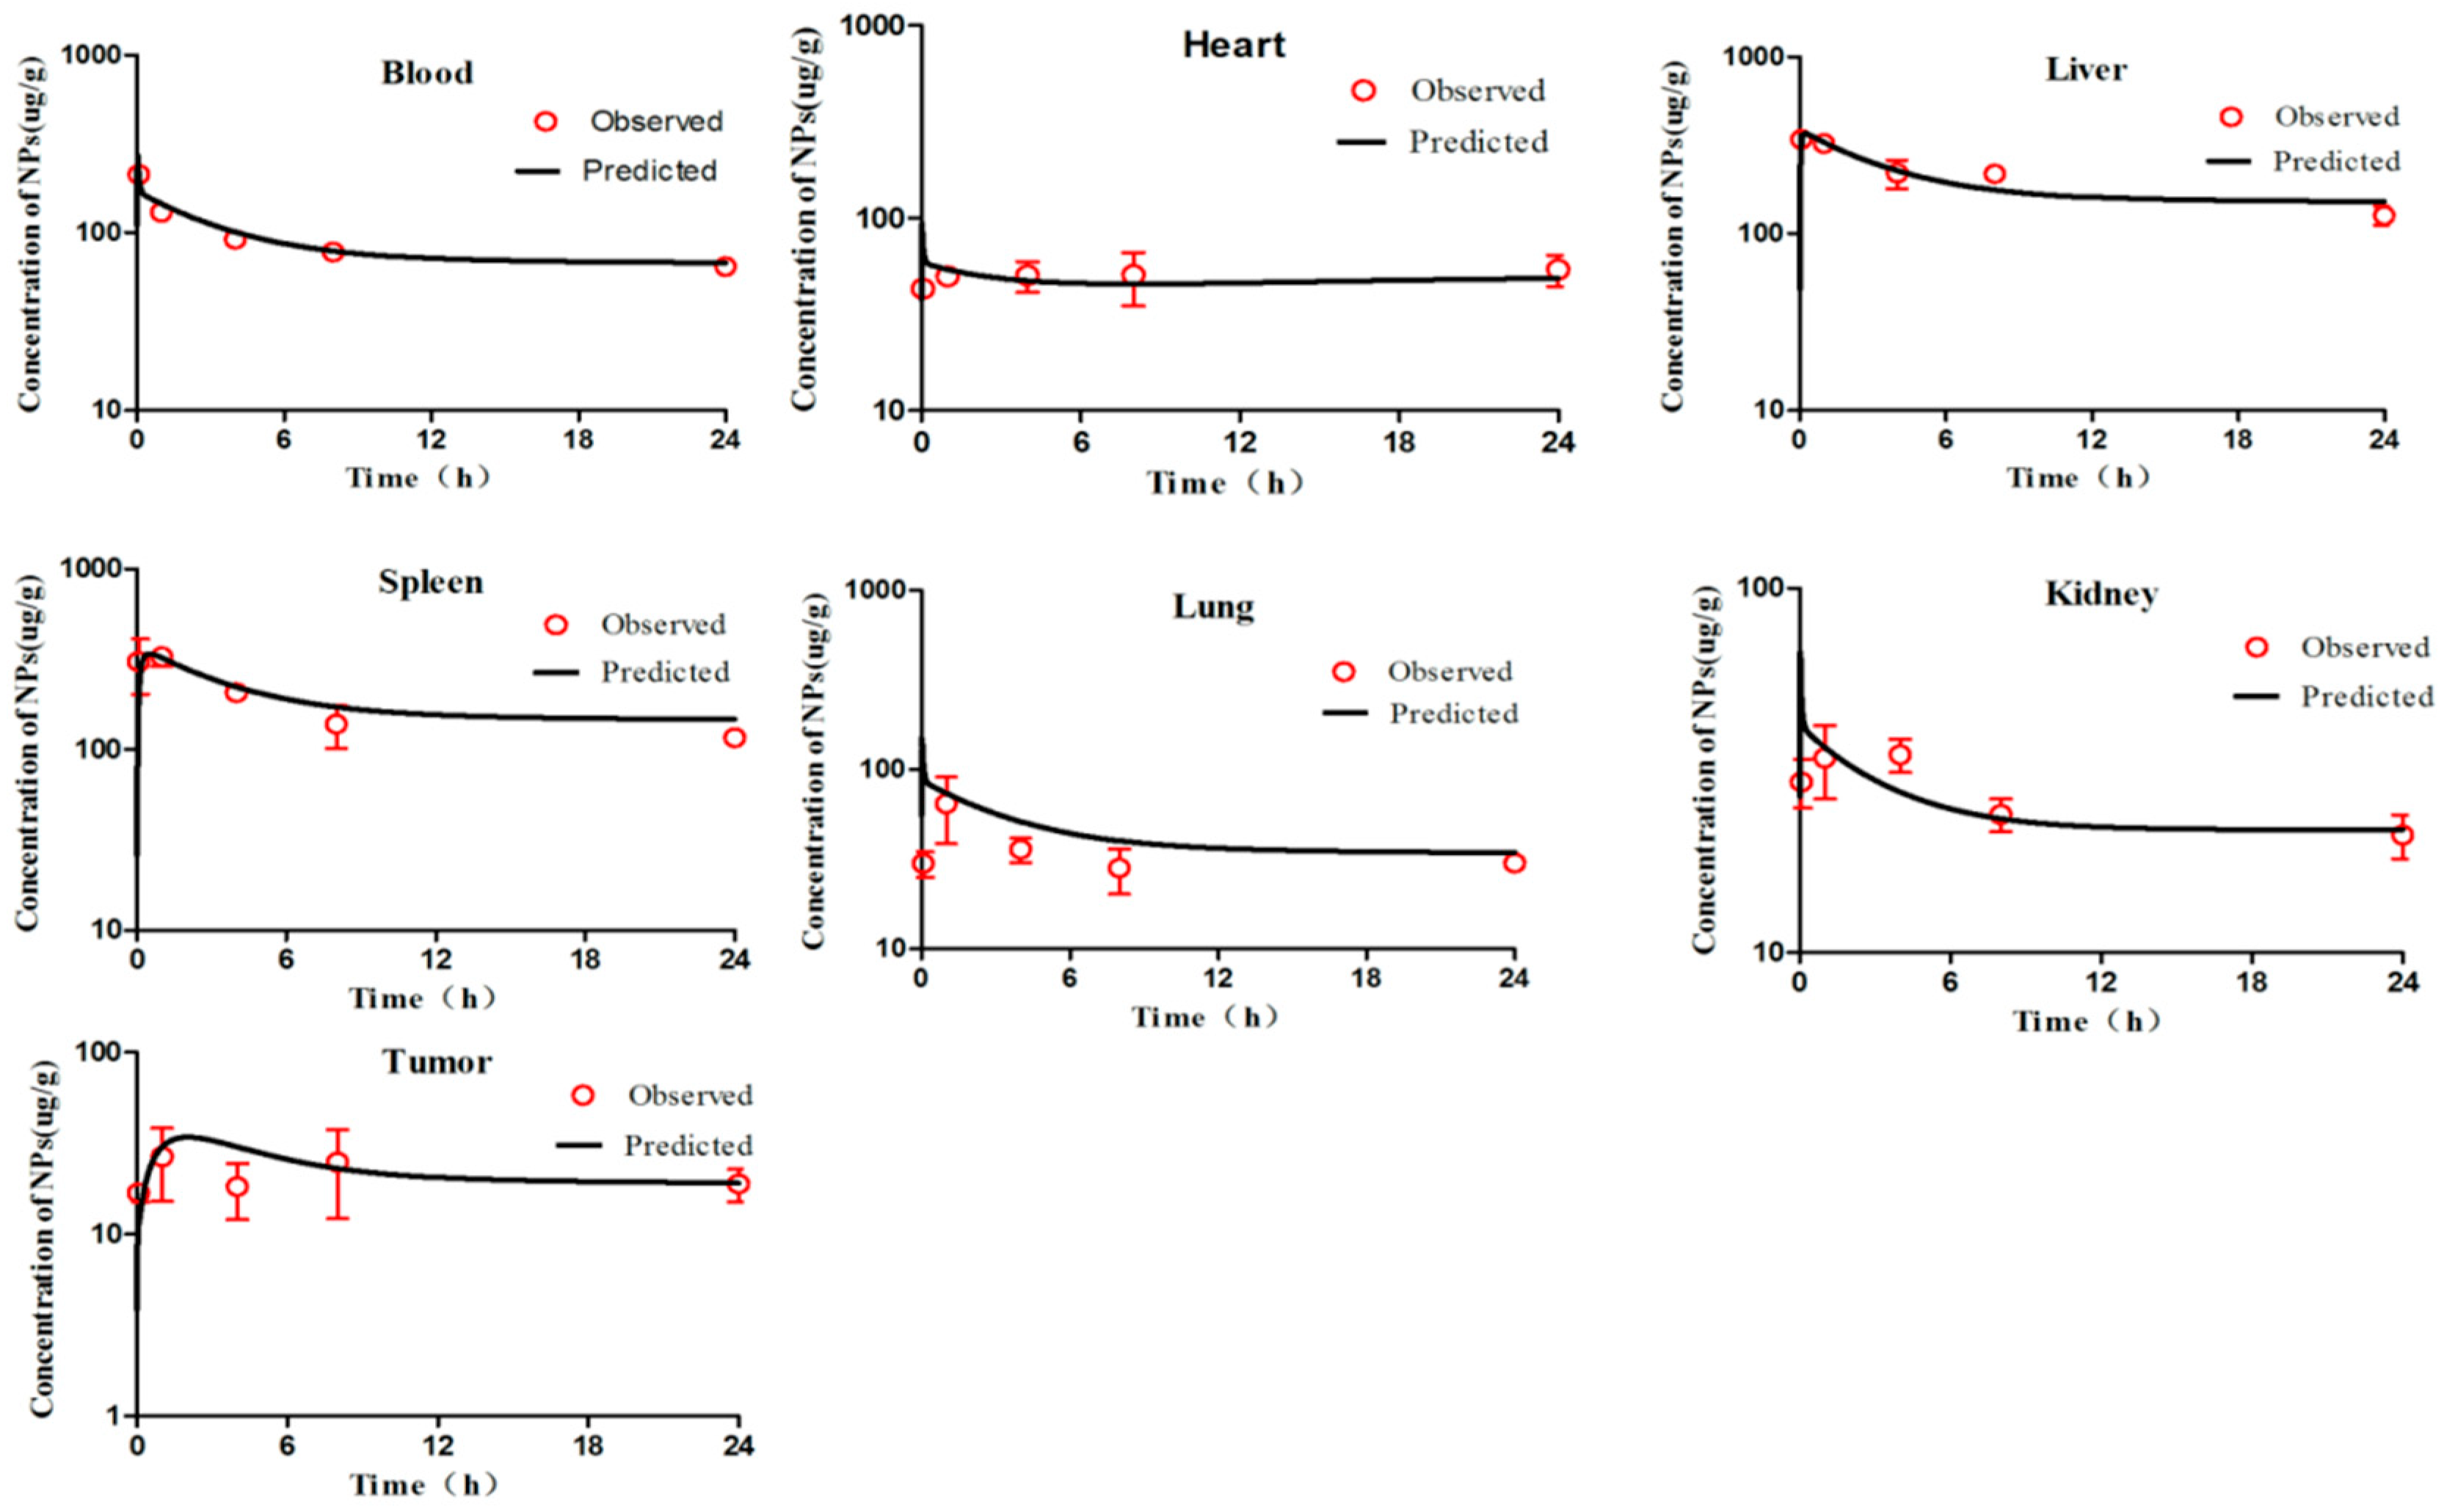
Figure 13), K
max(/h), the PBPK models for liver and spleen tissues were both <two-fold different, indicating that in the same mPEG5k and 28.57% ratio modification, the diameter of NPs had no significant effect on the distribution of NPs in liver and spleen. However, for the heart, and especially for the lungs and kidneys, K
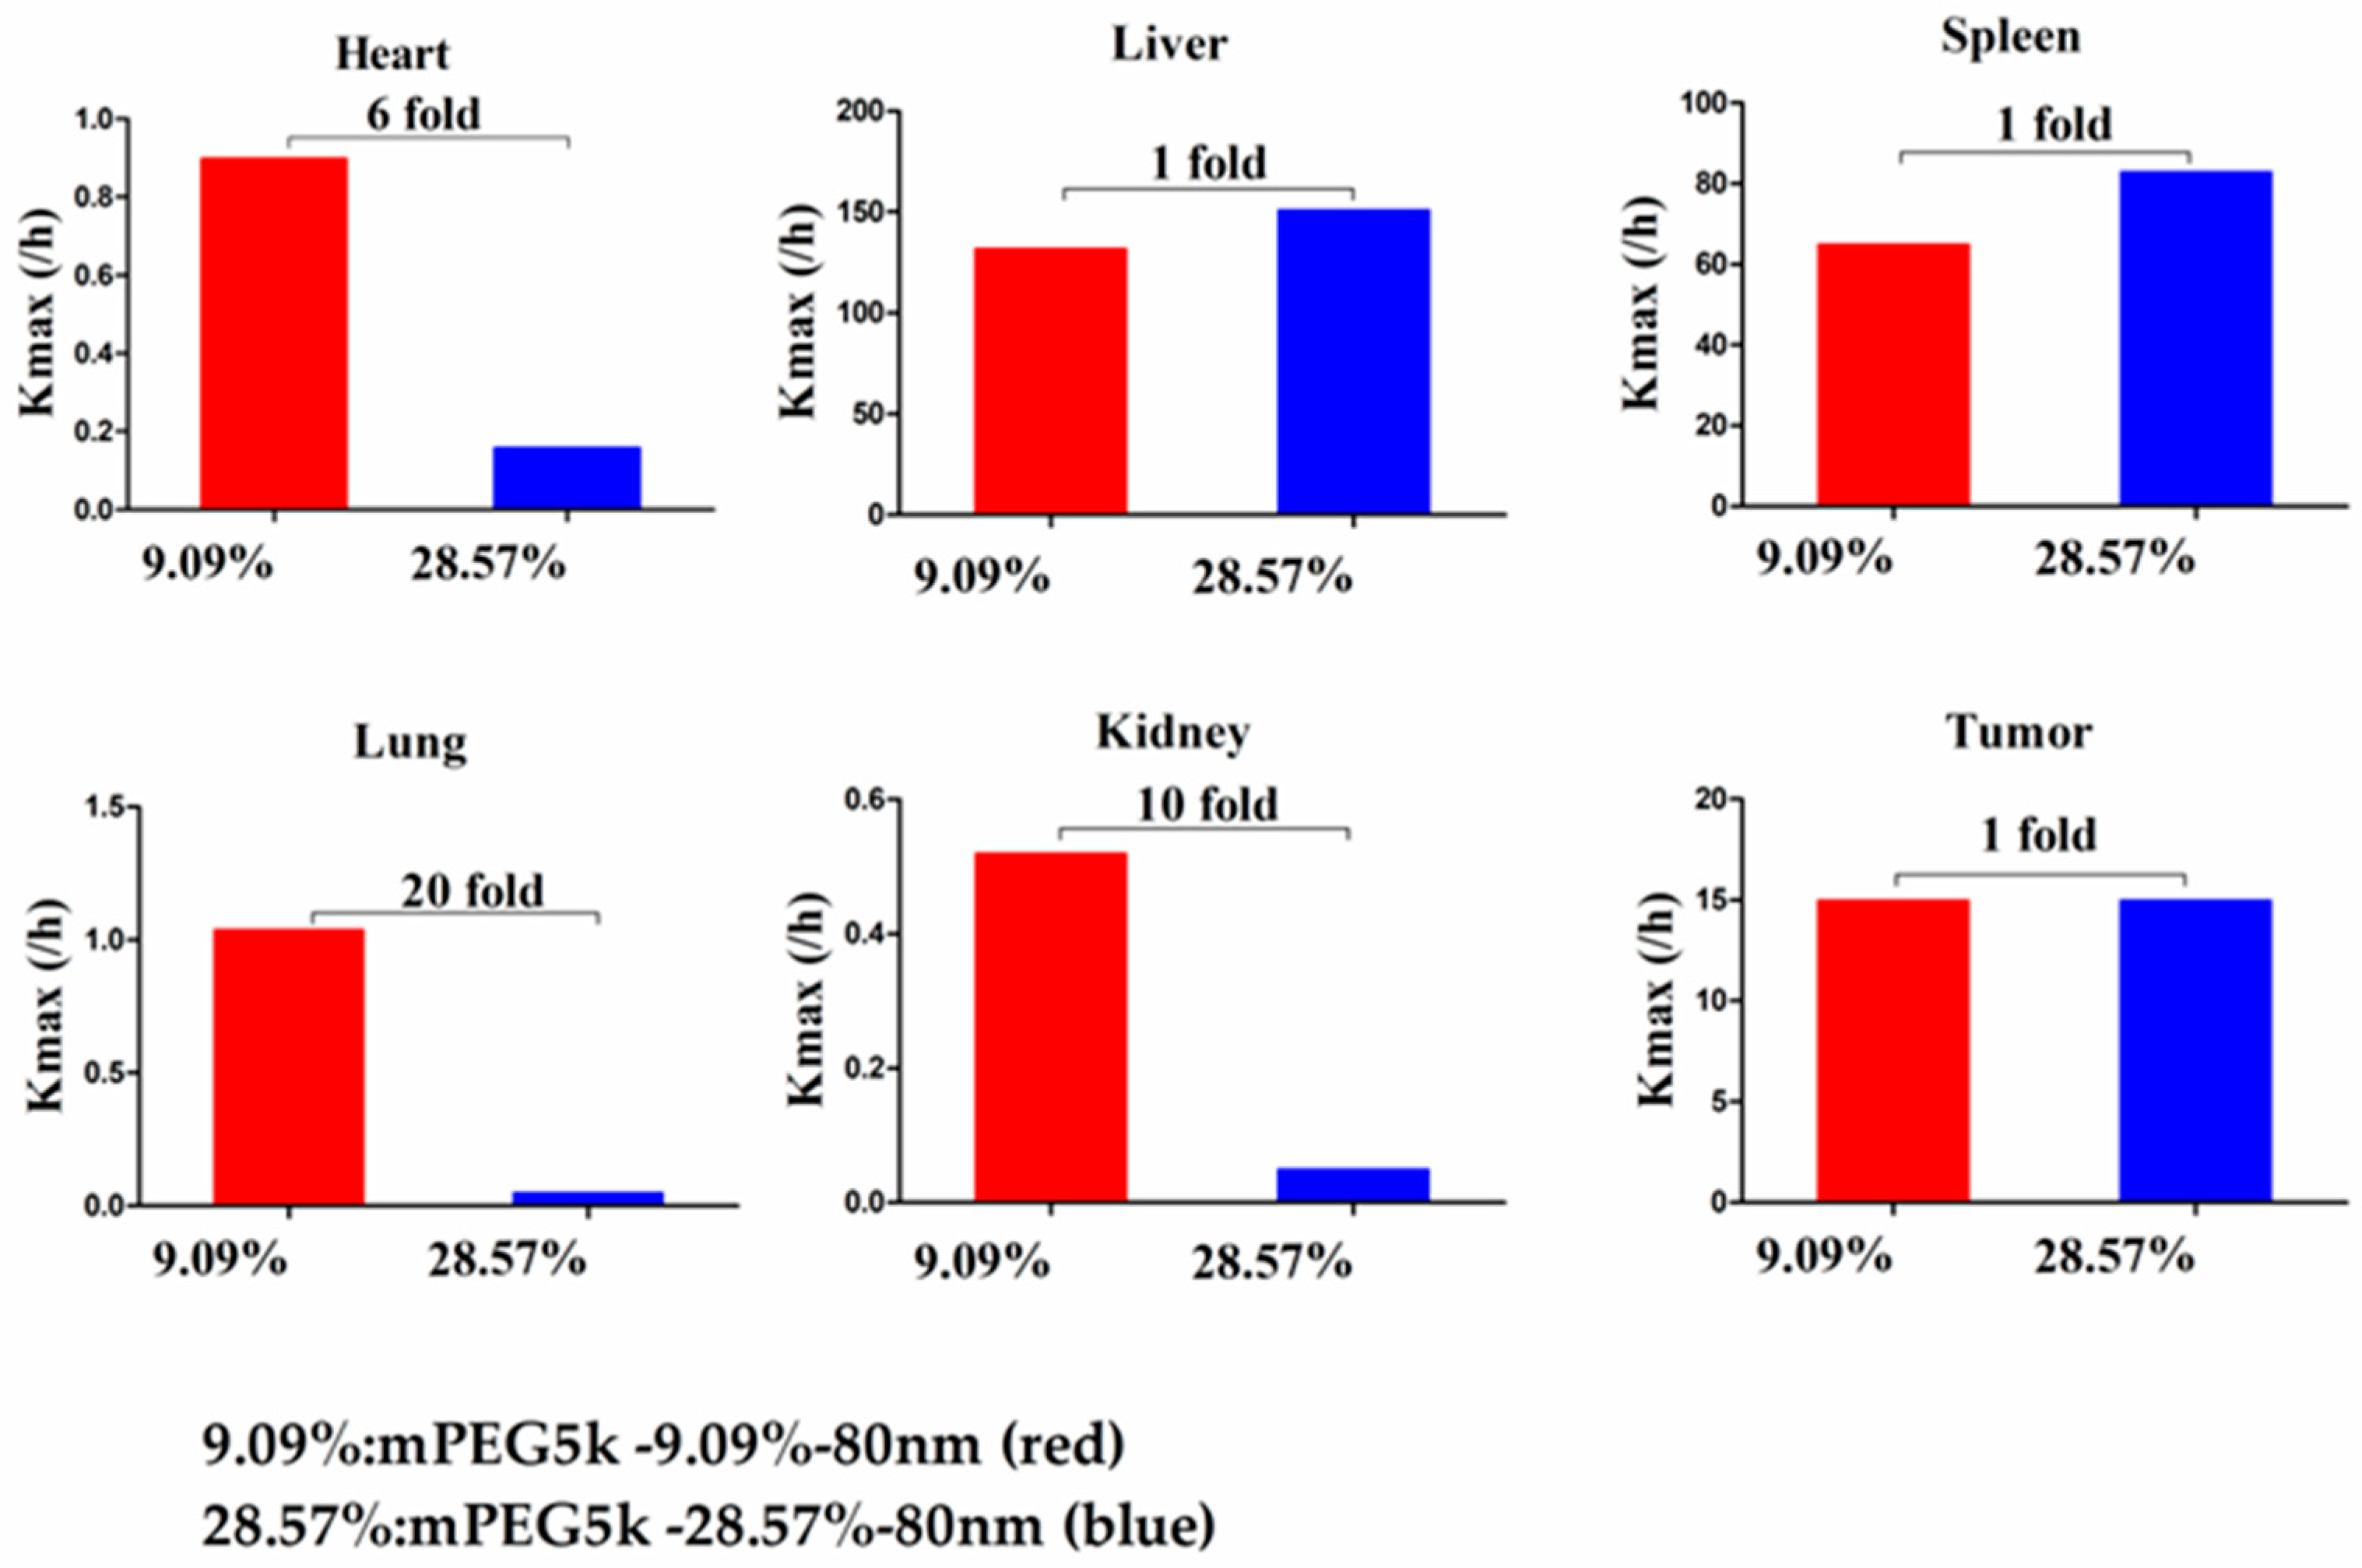
max(/h) exhibited large differences, and the largest difference could reach 20-fold, indicating that NP size had a significant influence in these three tissues for the mPEG5k-28.57%-80 nm and mPEG5k-28.57%-200 nm formulations. There were almost no differences observed in tumours. From this, we speculated that with the 28.57% mPEG5k modification, the 200 nm NPs were more easily phagocytosed by the PCs in the heart, lung, and kidney, while the PCs in the liver, spleen, and in tumours were less affected. In the two formulations of mPEG5k-9.09%-80 nm and mPEG5k-28.57%-80 nm (
Figure 14), the K
max (/h) in the PBPK model for liver and spleen tissues were both within two-fold. However, in the heart, and especially in the lung and kidney, the K
max (/h) difference was higher. The largest difference could reach 20-fold, and there was no difference in tumours. K
max (/h) in the PBPK model for mPEG5k-9.09%-200 nm was more than two-fold different in each tissue than mPEG5k-28.57%-200 nm (
Figure 15). K
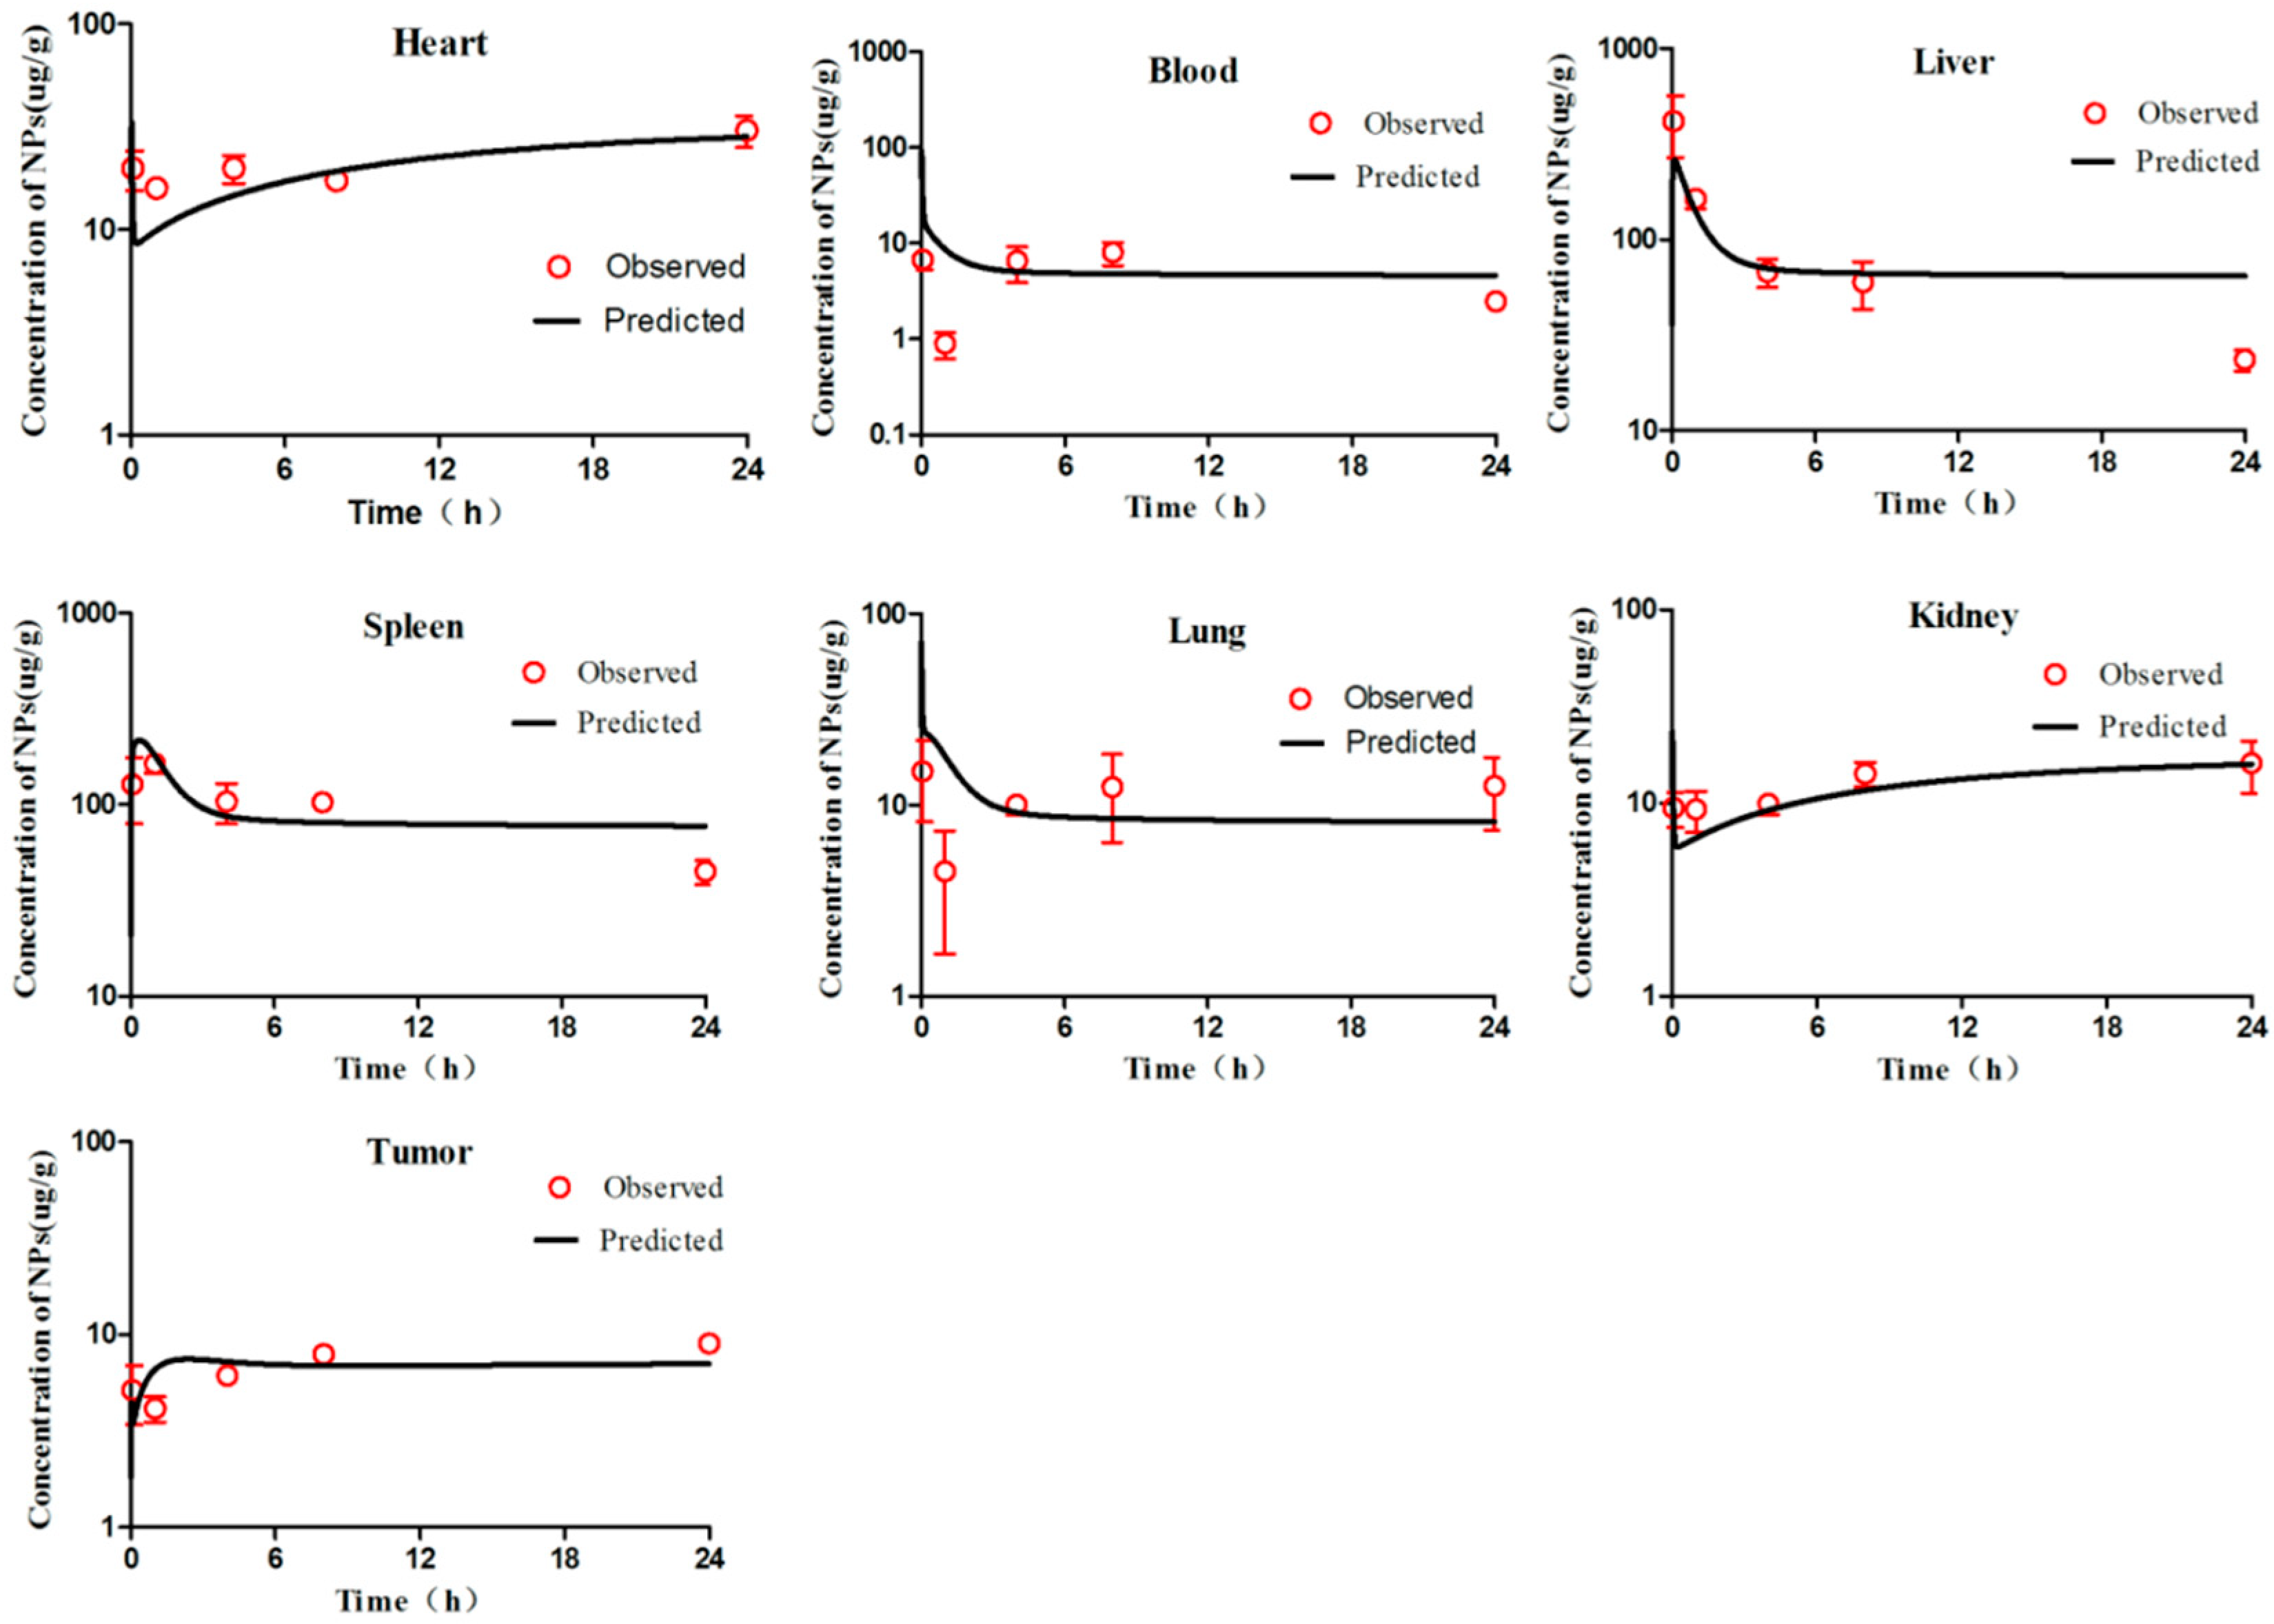
max (/h) in the lung was 10 times the maximum and two-fold higher in tumour tissue. It was concluded that NPs with less mPEG5k content are easily phagocytosed by PCs in tissues. In the two formulations of mPEG5k-28.57%-80 nm and mPEG2k-28.57%-200 nm (
Figure 16), there was no significant difference for K
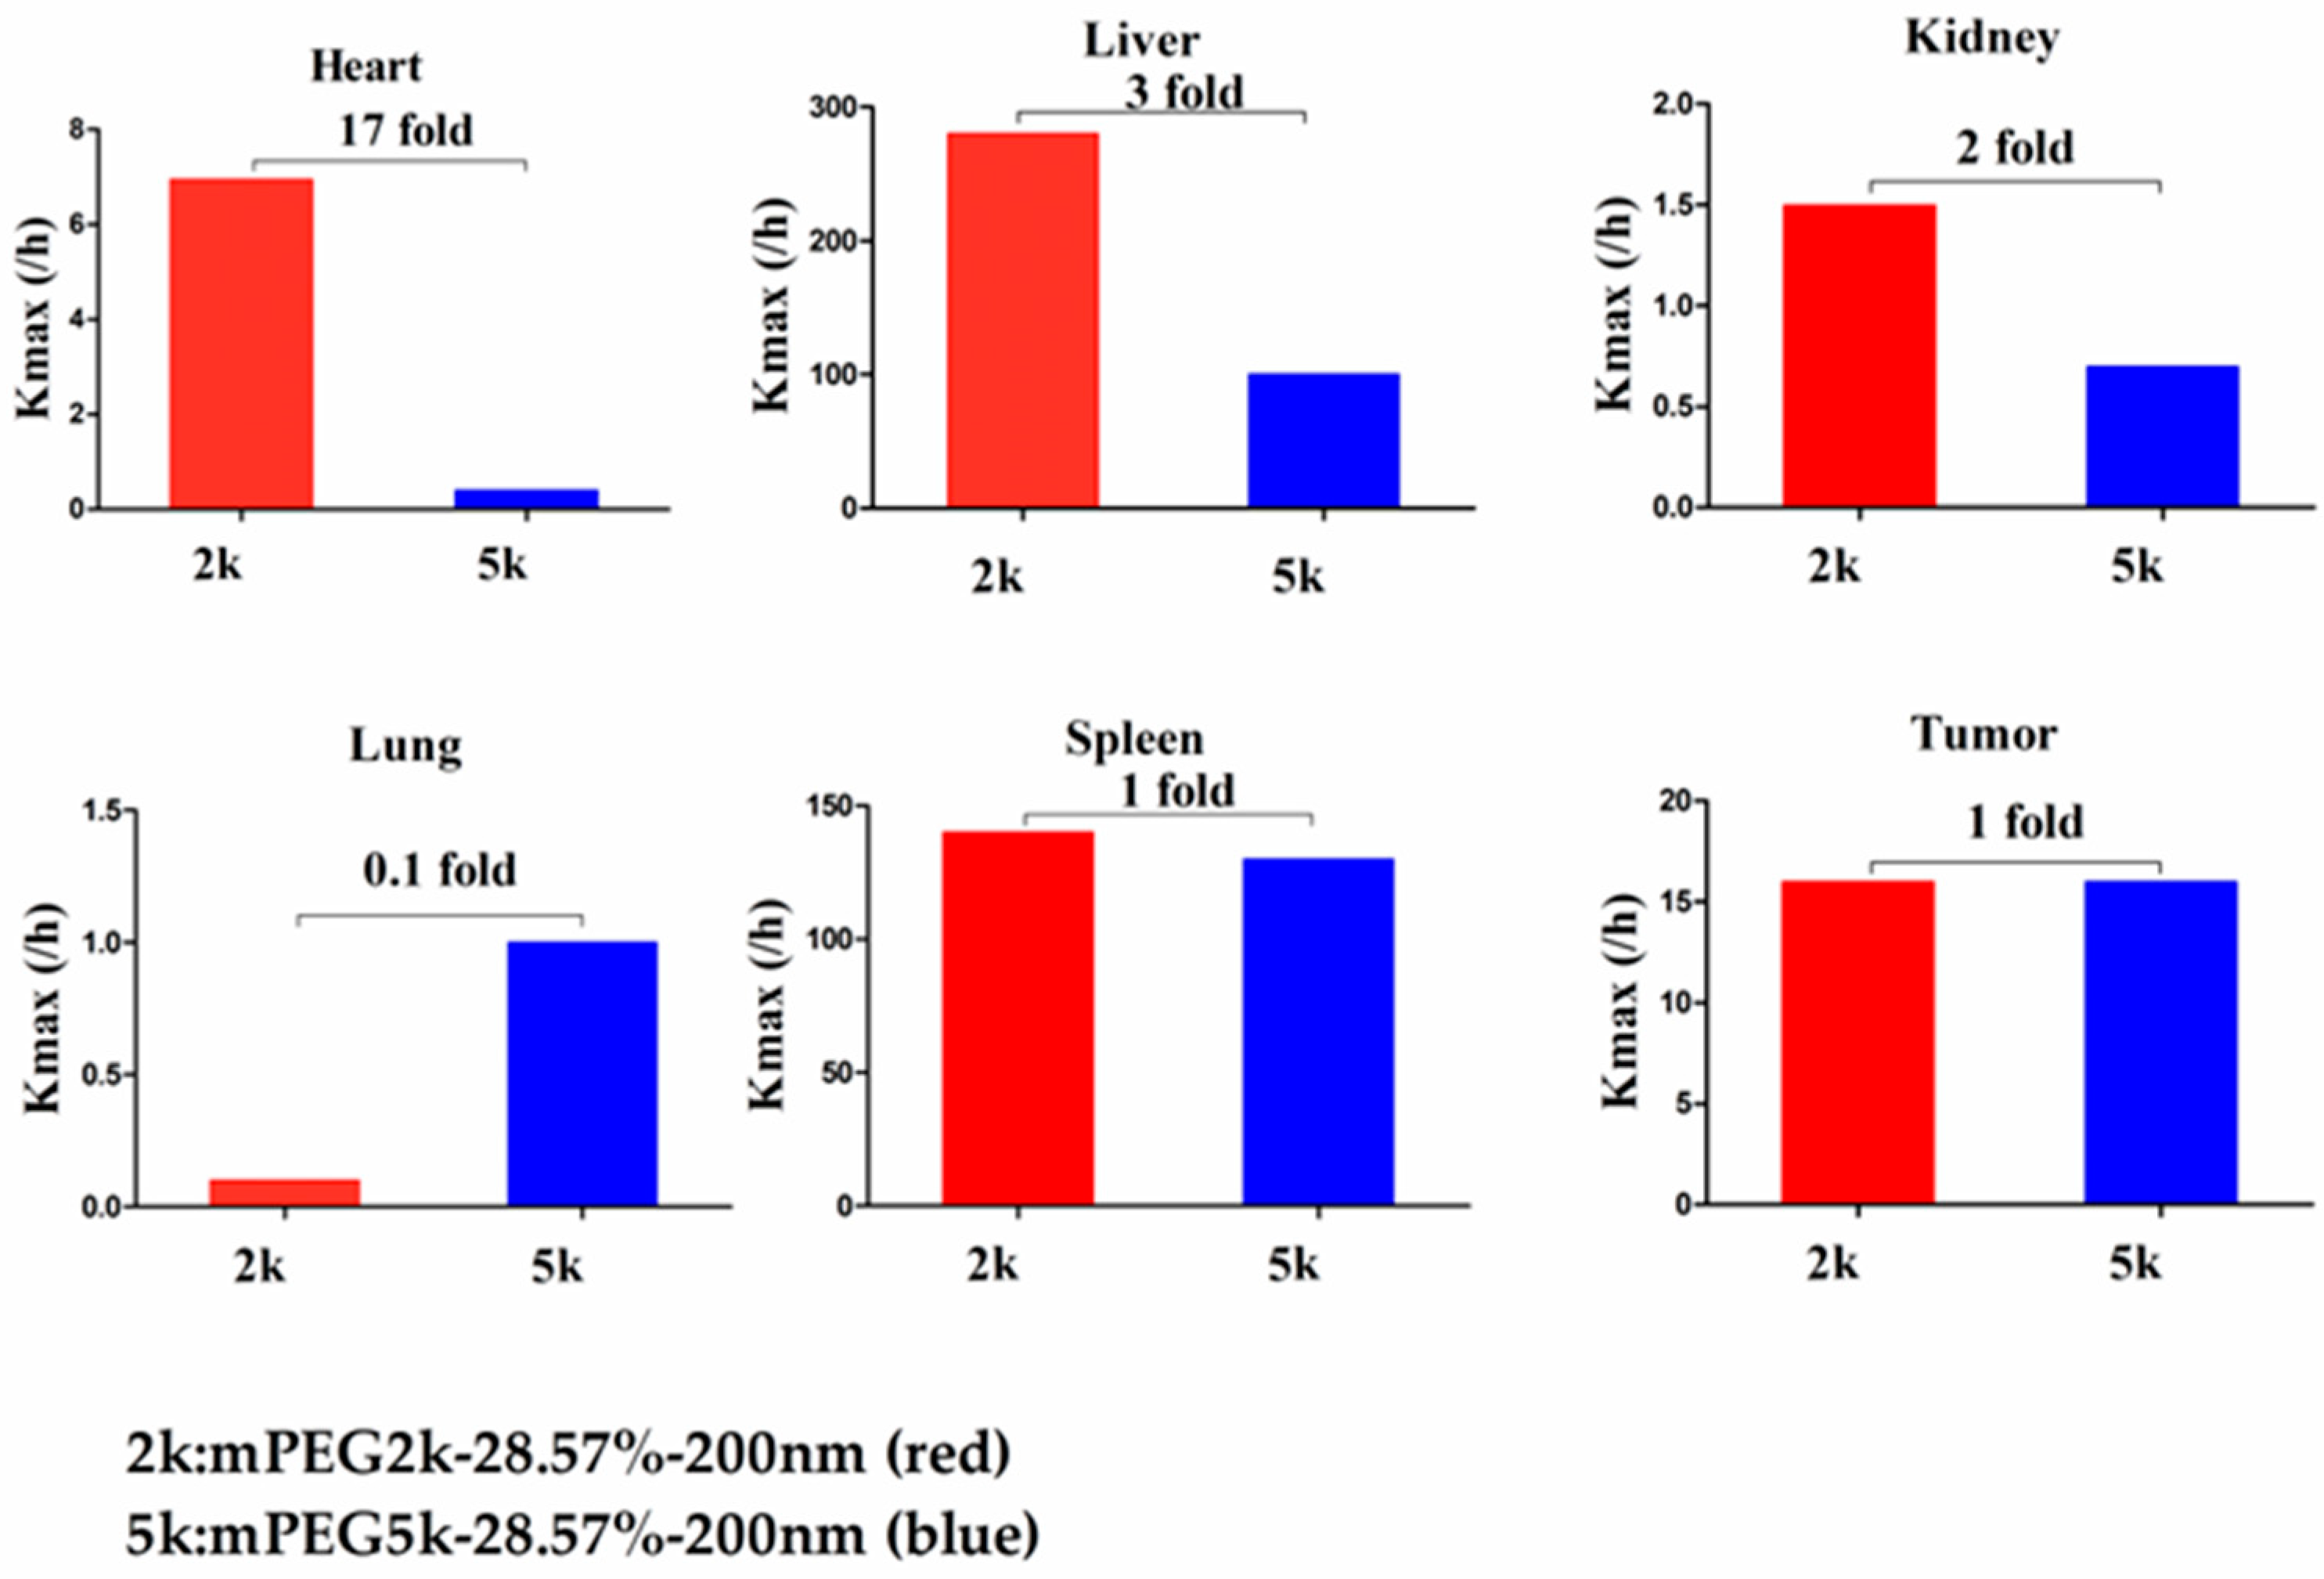
max(/h) between the spleen and tumour tissues, indicating that under the same amount of 28.57% mPEG, the mPEG molecular weight had little effect on the distribution of NPs in spleen and tumour tissues. However, in the liver and kidneys, and especially in the heart, the K
max (/h) in the PBPK model was 17 times that of the two NP formulations. In the lungs, however, the opposite was observed. Therefore, we can speculate that in the two NP formulations with the same amount of 28.57% mPEG and 200 nm size, the mPEG molecular weight of 2K formulations was easily phagocytosed by the PCs of the heart, liver, and kidneys, and quite the opposite in the lungs, whereas no significant differences were observed for the spleen and tumours.
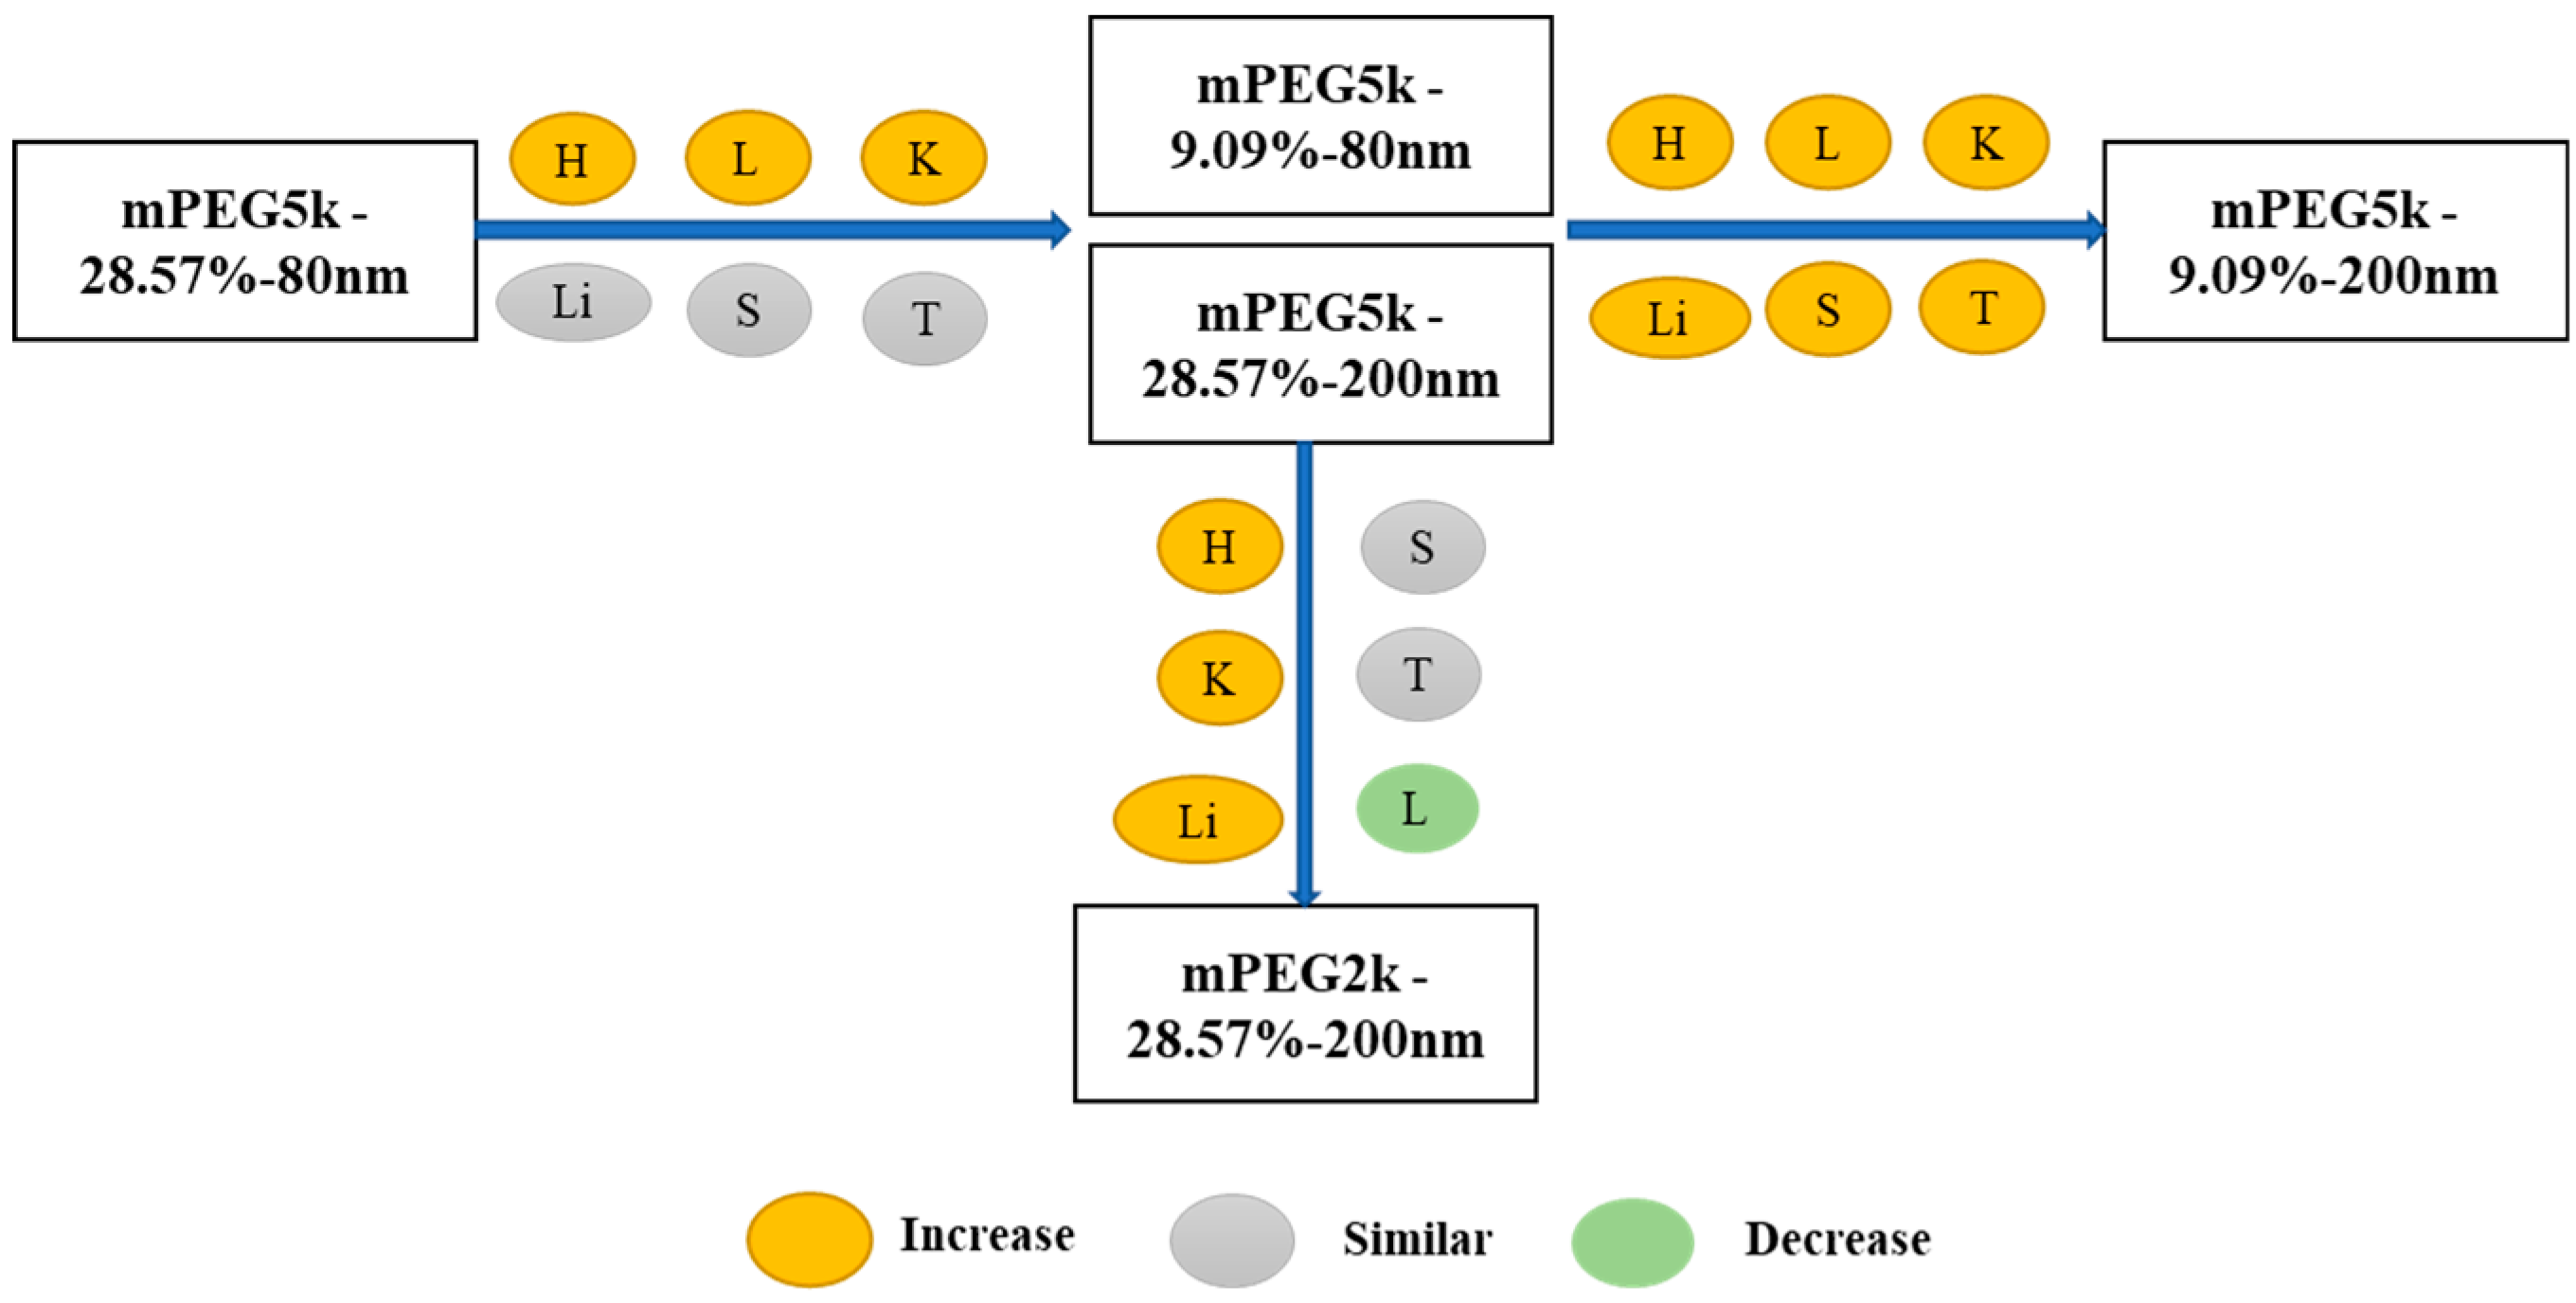
In summary, as shown in
Figure 17, compared with the mPEG5k-28.57%-80 nm formulation, the distribution of mPEG5k-9.09%-80 nm and mPEG5k-28.57%-200 nm in the heart, lung and kidney increased, reducing the circulating NP delivery to tumour sites. The distribution of mPEG5k-9.09%-200 nm was increased in all tissues. Compared with mPEG5k-28.57%-200 nm, mPEG2k-28.57%-200 nm levels were increased in the heart, liver, and kidney, but decreased in the lungs.
Pt is one of the key parameters in PBPK models that represent the tissue/plasma distribution coefficient. The value of Pt might be related to the formation of a biocorona complex around NPs because the composition of interstitial fluid differs from that of plasma [
25]. Biocorona formation can not only dramatically alter the biodistribution of NPs, but also potentially impact interspecies extrapolation of NP biodistribution [
24]. The formation of the biocorona can be influenced by the properties of the NPs, such as size, surface charge, and ligands, and then change the interactions involving NPs and the biological system [
25]. In the PBPK model of PEG/PAA NPs [
11], Pt was obtained by fitting the unknown model parameters to the experimental data. Here, we assigned the same Pt value from the published PBPK models for 100 nm Au NPs [
7] for all organs except the liver. Similar to previously reported PBPK models of 100 nm Au NPs, the sensitivity analysis in our PBPK models showed that Pt had no significant effect on mPEG-PCL NP distribution, implying that greater changes to these parameters would have little influence on the model outputs. In contrast to the 13 nm Au NPs [
7], Pt is a highly influential parameter on the model outputs. PAC
t is described as diffusion between capillary blood and tissue, which could affect how rapidly the NPs deviate from capillary blood into surrounding tissues. We used the same permeability coefficient for all organs except the spleen for our five types of mPEG-PCL NPs based on the reported PBPK models of 100 nm Au NPs [
7]. According to the sensitivity analysis, PAC
t also had little influence on the output result in our PBPK model, which was consistent with the PBPK model of 100 nm Au NPs and in contrast to that of the PBPK model for 13 nm Au NPs. The permeability of NPs is regulated by opsonisation, in which proteins bind to NP surfaces almost instantaneously once NPs enter the blood circulation and form NP-protein complexes. Thus, the opsonisation process can change the physicochemical properties of the original NPs. In addition, the different morphological features of blood vessel endothelium, classified as continuous or discontinuous, also influence NP distribution from the blood compartment into tissues. Furthermore, blood supply to tissues may also play an important role in the permeability of NPs when they are distributed into the tissue very rapidly, or where the blood supply is quite limited in some tissues [
11].
The extrapolation capacity of the PBPK model is highly desirable. Thus, external validation of the PBPK model is a crucial step in demonstrating the value of application of PBPK models. In the future, we will focus on these highly influential parameters to help understand the relationship between such properties and the biodistribution of mPEG-PCL NPs. In addition, more knowledge is needed regarding how mPEG-PCL NP properties influence PC uptake quantitatively in different organs in order to improve the predictive capacity of PBPK models.
4. Materials and Methods
4.1. Chemicals
Poly(ε-caprolactone) (PCL, MW = 45,000) and polyvinyl alcohol (PVA, MW = 13,000–23,000, 87–89% alcoholised) were supplied by Sigma–Aldrich (St. Louis, MO, USA). Methoxy PEG-poly(ε-caprolactone) (mPEG-PCL) copolymers with different mPEG and PCL chain lengths (mPEG
5k-PCL
45k, mPEG
2k-PCL
45k) were synthesised according to previous procedures [
26,
27] and were kindly provided by Professor Zhiyong Qian of Sichuan University, Chengdu, China. The fluorescent probe P2 (
λabs/
λem = 708/732 nm) was synthesised in our lab according to previous procedures [
28,
29]. Dichloromethane (DCM was purchased from Sinopharm Chemical Reagent Co., Ltd. (Shanghai, China). Roswell Park Memorial Institute (RPMI)-1640, Dulbecco’s modified Eagle’s medium (DMEM), penicillin streptomycin (PenStrep), 0.25% trypsin–0.02% ethylenediamine tetraacetic acid (EDTA), and D-Hank’s balanced salt solution were purchased from Gibco (USA). Foetal bovine serum (FBS) was supplied by Invitrogen (Carlsbad, CA, USA). Purified water was prepared using a Milli-Q purification system (Molsheim, France). All other reagents used in this study were of analytical grade and used as received.
4.2. Preparation of Fluorescently Labelled mPEG-PCL NPs
mPEG-PCL NPs labelled with P2 were prepared by an oil-in-water type emulsification/solvent evaporation method according to our previous work [
5]. Briefly, as shown in
Table S1, 200 mg of PCL and a certain amount of mPEG-PCL, together with the fluorescent probe (100 μg), were dissolved in 5 mL of DCM to form an organic phase. The aqueous phase was 20 mL of a 1% (
w/w) PVA solution. The organic phase was then mixed with the aqueous phase and emulsified by probe ultrasonication (Scientz Biotechnology Co., Ltd., Ningbo, China) for 3 min in an ice bath to obtain a coarse emulsion. After mechanical stirring for 4 h at room temperature to remove the DCM, mPEG-PCL NPs with a particle size of 200 nm were obtained. The 80-nm NPs were prepared using 20 mL of 5% (
w/w) PVA solution as the aqueous phase, subsequently disrupting the coarse emulsion at a pressure of 1000 bar for 3 min using a high-pressure homogeniser (Scientz Biotechnology Co.), followed by mechanical stirring for 4 h to remove the residual DCM. The obtained NP suspensions were stored at 4 °C for further analysis and animal experiments. NPs with different PEG coating chain lengths and coating densities were prepared by incorporating various amounts of mPEG-PCL with different mPEG chain lengths into the PCL matrix.
4.3. Characterisation of mPEG-PCL NPs
The physicochemical properties of various NPs were characterised after 20-fold dilution with purified water. The hydrodynamic diameter and zeta potential were determined using a Zetasizer Nano (Malvern Instruments, Malvern, Liverpool, UK) at 25 °C. The particle size was reported as the Z-average value. Samples (100 μL) were added to a 96-well plate and fluorescently quantified using an IVIS®spectrum live imaging system (PerkinElmer, CA, USA) with excitation/emission wavelengths of 710/760 nm.
4.4. Cell Culture
The murine carcinoma cell line S180, originating from the American Type Culture Collection (ATCC), was cultured as previously reported [
30]. Briefly, S180 cells were seeded and cultured at 37 °C, 5% CO
2, and 90% relative humidity in a 25 cm
2 culture flask. The culture medium, composed of RPMI 1640 with 10% FBS, 1.0 mM sodium pyruvate, 0.1 mM nonessential amino acids and 1.5 g/L sodium bicarbonate, was changed every second day.
4.5. Biodistribution of mPEG-PCL NPs in S180-Bearing Mice
Kunming mice (18 ± 2 g) were subcutaneously inoculated with S180 tumour cells (1–2 × 10⁶ cells per mouse) via the right hindlimb, and subsequently raised under 25 ± 2 °C, 75 ± 5% relative humidity, and natural daylight for 8–12 days. Tumour diameters were measured every other day, and tumour volumes were calculated as (a2 × b)/2, where a and b refer to the long and short diameters, respectively. Animals with similar tumour volumes (0.51–0.59 cm3) were included for further study.
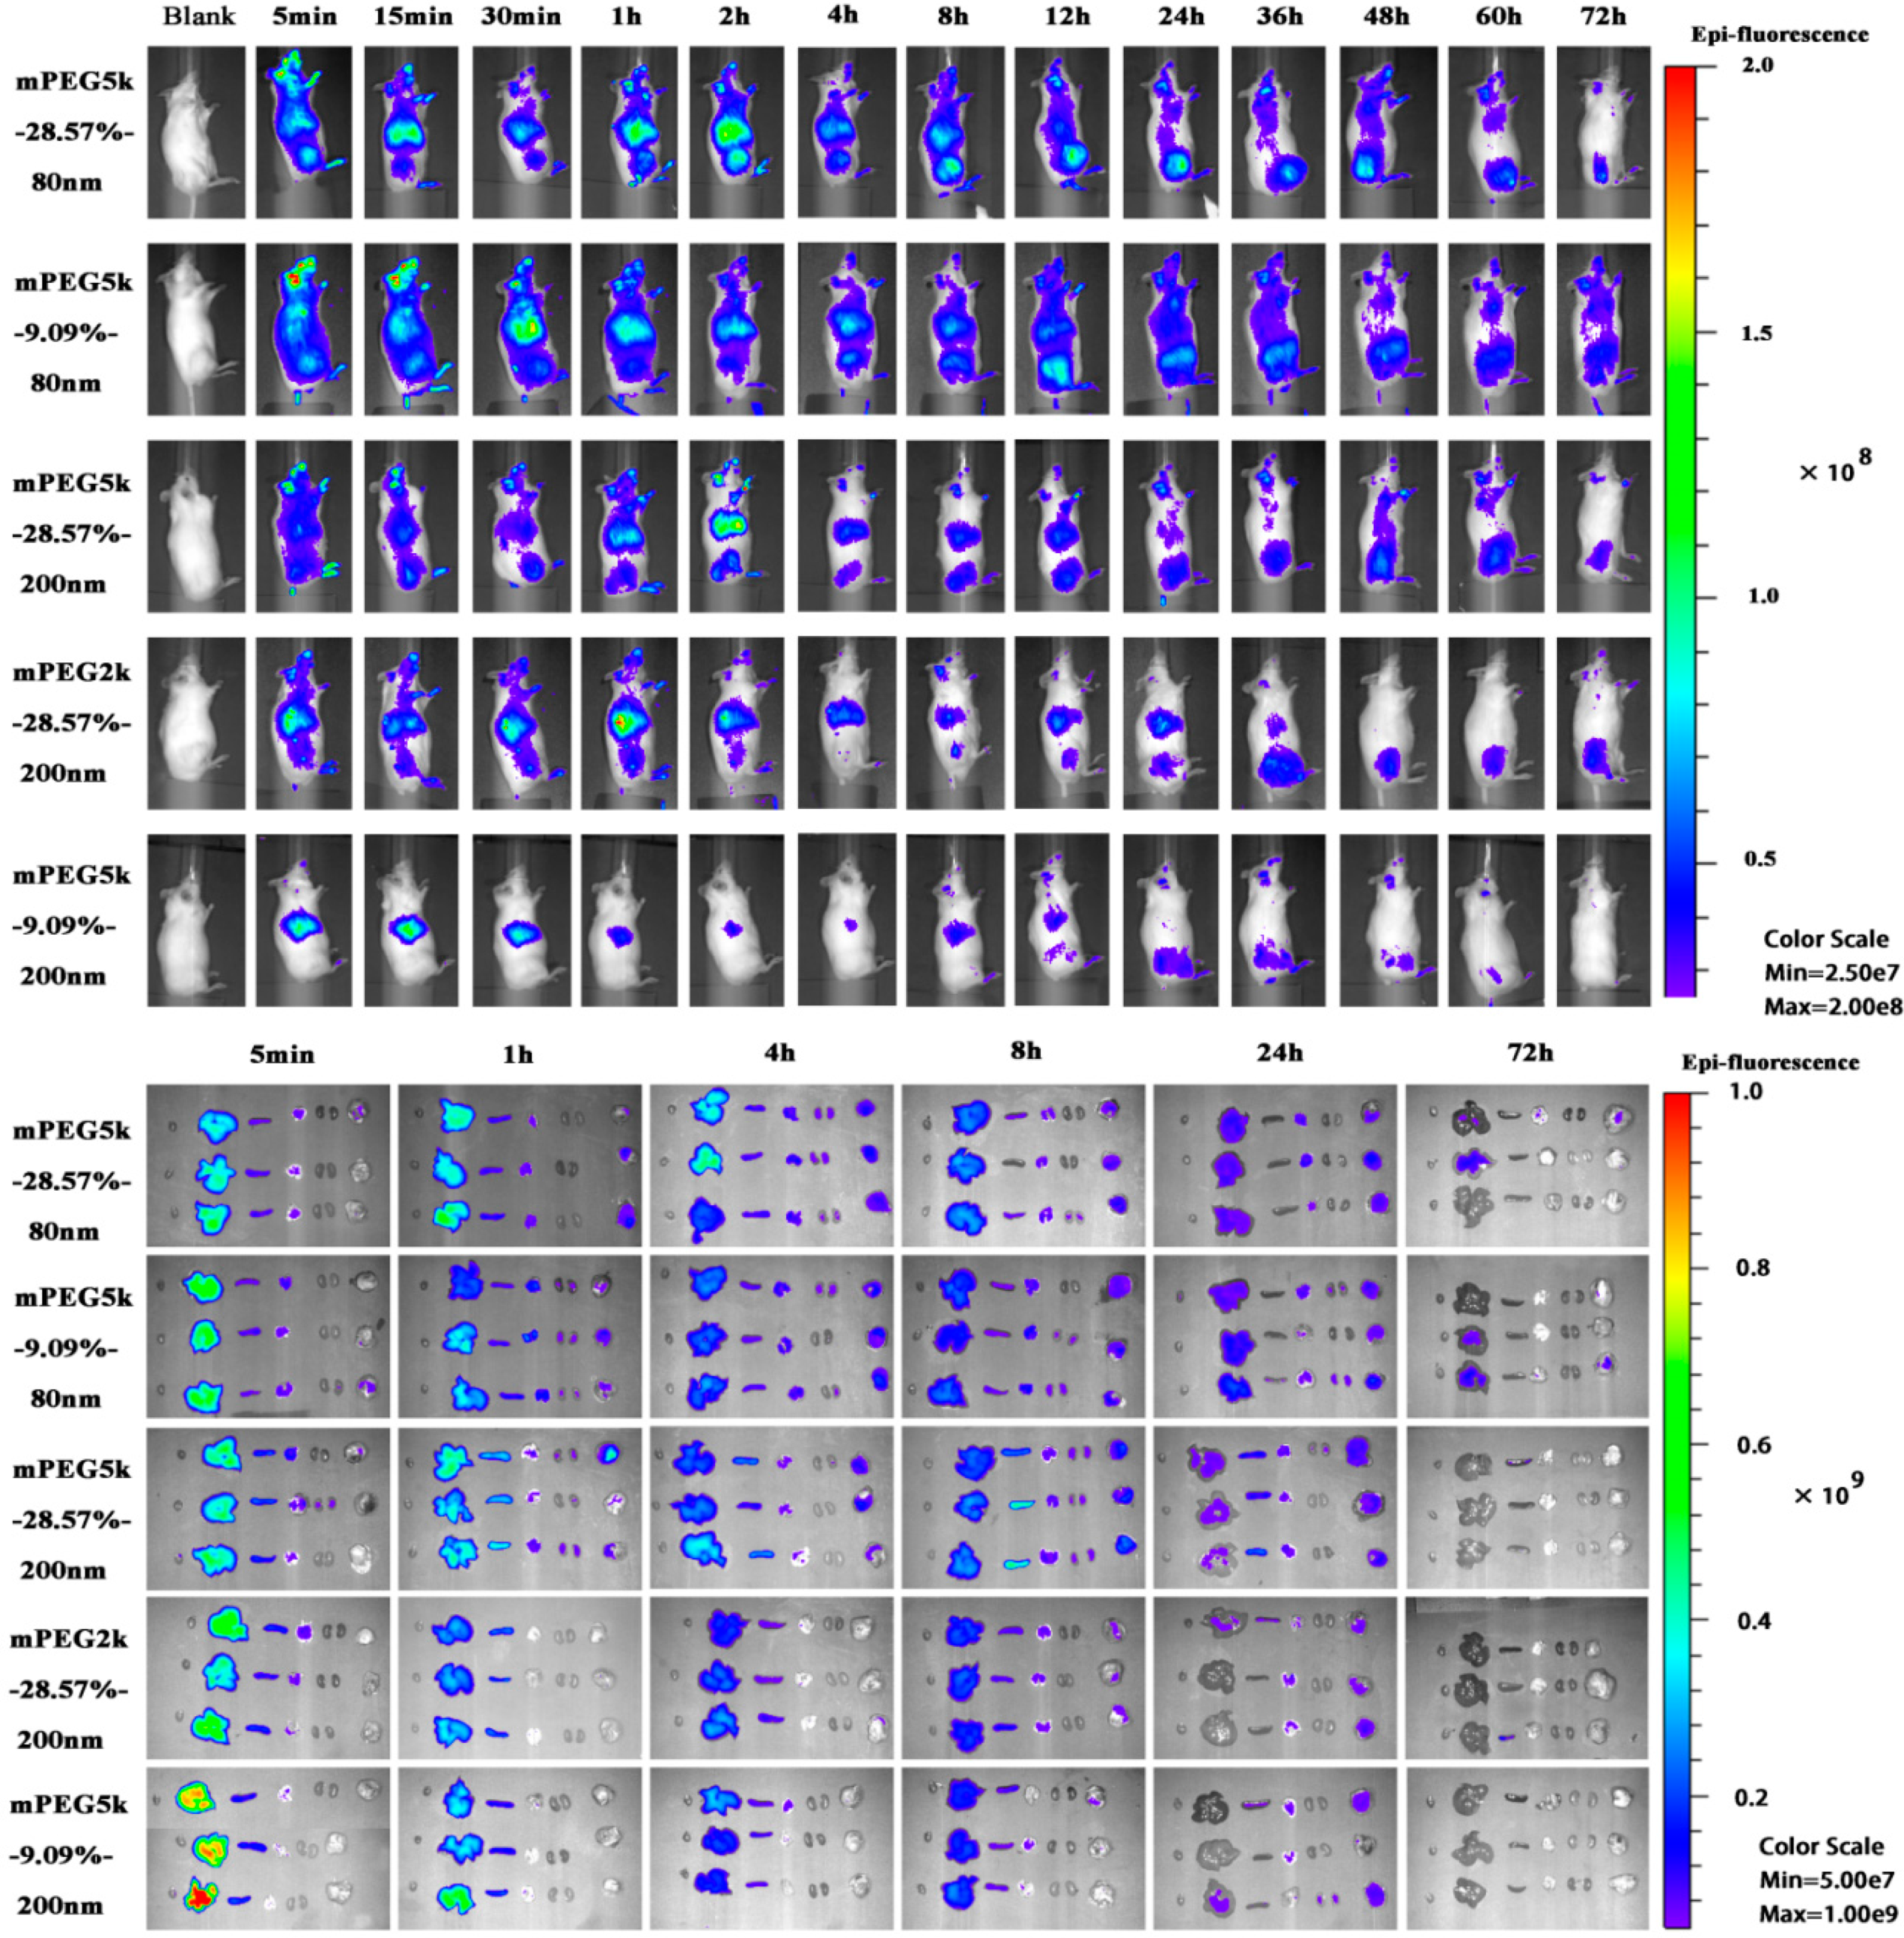
The tumour-bearing mice were injected intravenously with 0.2 mL of mPEG-PCL NP suspension. All formulations were adjusted to the same fluorescent intensity level by slight dilution with deionised water. The biodistribution of mPEG-PCL NPs in S180 tumour-bearing mice was first investigated by whole animal imaging using an IVIS spectrum live imaging system with excitation/emission wavelengths of 710/760 nm. After administration, images of mice were captured at predetermined time intervals for as long as 72 h, whereas blank images were taken before administration as a control. During the image-capturing process, animals were narcotised using an on-line gas anaesthesia system using isoflurane (Shandong Keyuan Pharmaceutical Co., Ltd., China).
To further investigate the biodistribution of mPEG-PCL NPs in tumour-bearing mice, the animals were sacrificed and dissected at predetermined time intervals of 0.083, 1, 4, 8, 24, and 72 h post administration. Various organs and tissues were collected after cardiac perfusion and imaged using an IVIS live imaging system, as mentioned above, to visualise the mPEG-PCL NPs. Blood samples were withdrawn prior to perfusion for further quantification.
To accurately quantify mPEG-PCL NPs in organs and tissues, samples were cut into pieces and homogenised using a high-shear homogeniser (IKA, CA, USA). Water was excluded during homogenisation to remove any potential influence on the quenching of the P2 probe encapsulated in the NPs. Then, 100 μg of each sample was precisely weighed and added to a 96-well plate. The fluorescence of the samples was measured using an IVIS spectrum live imaging system with excitation/emission wavelengths of 710/760 nm. Images were captured using an automatic exposure mode, regions of interest (ROIs) were drawn over the fluorescent signals, and the total radiant efficiency (TRE) within the ROIs was measured by vendor software for subsequent quantitative analysis [
18,
23]. The fluorescence of the blood samples was measured as mentioned above, whereas homogenisation was excluded. All quantification of NPs was conducted based on the corresponding calibration curve, which was made by plotting the fluorescence of standard samples versus the concentration of mPEG-PCL NPs. Standard samples were prepared by adding a specific amount of NPs to organs or tissues, followed by homogenisation, as described above. The linear ranges of calibration curves for all formulations were 0.0078125–0.5 mg/g for the heart, 0.0078125–1 mg/g for the liver, 0.0078125–1 mg/g for the spleen, 0.00390625–0.5 mg/g for the lung, 0.00390625–0.5 mg/g for the kidney, 0.00390625–1 mg/g for tumours, and 0.01–0.5 mg/g for blood. The linear equation and corresponding linear coefficients are shown in
Table S2.
4.6. PBPK Modelling
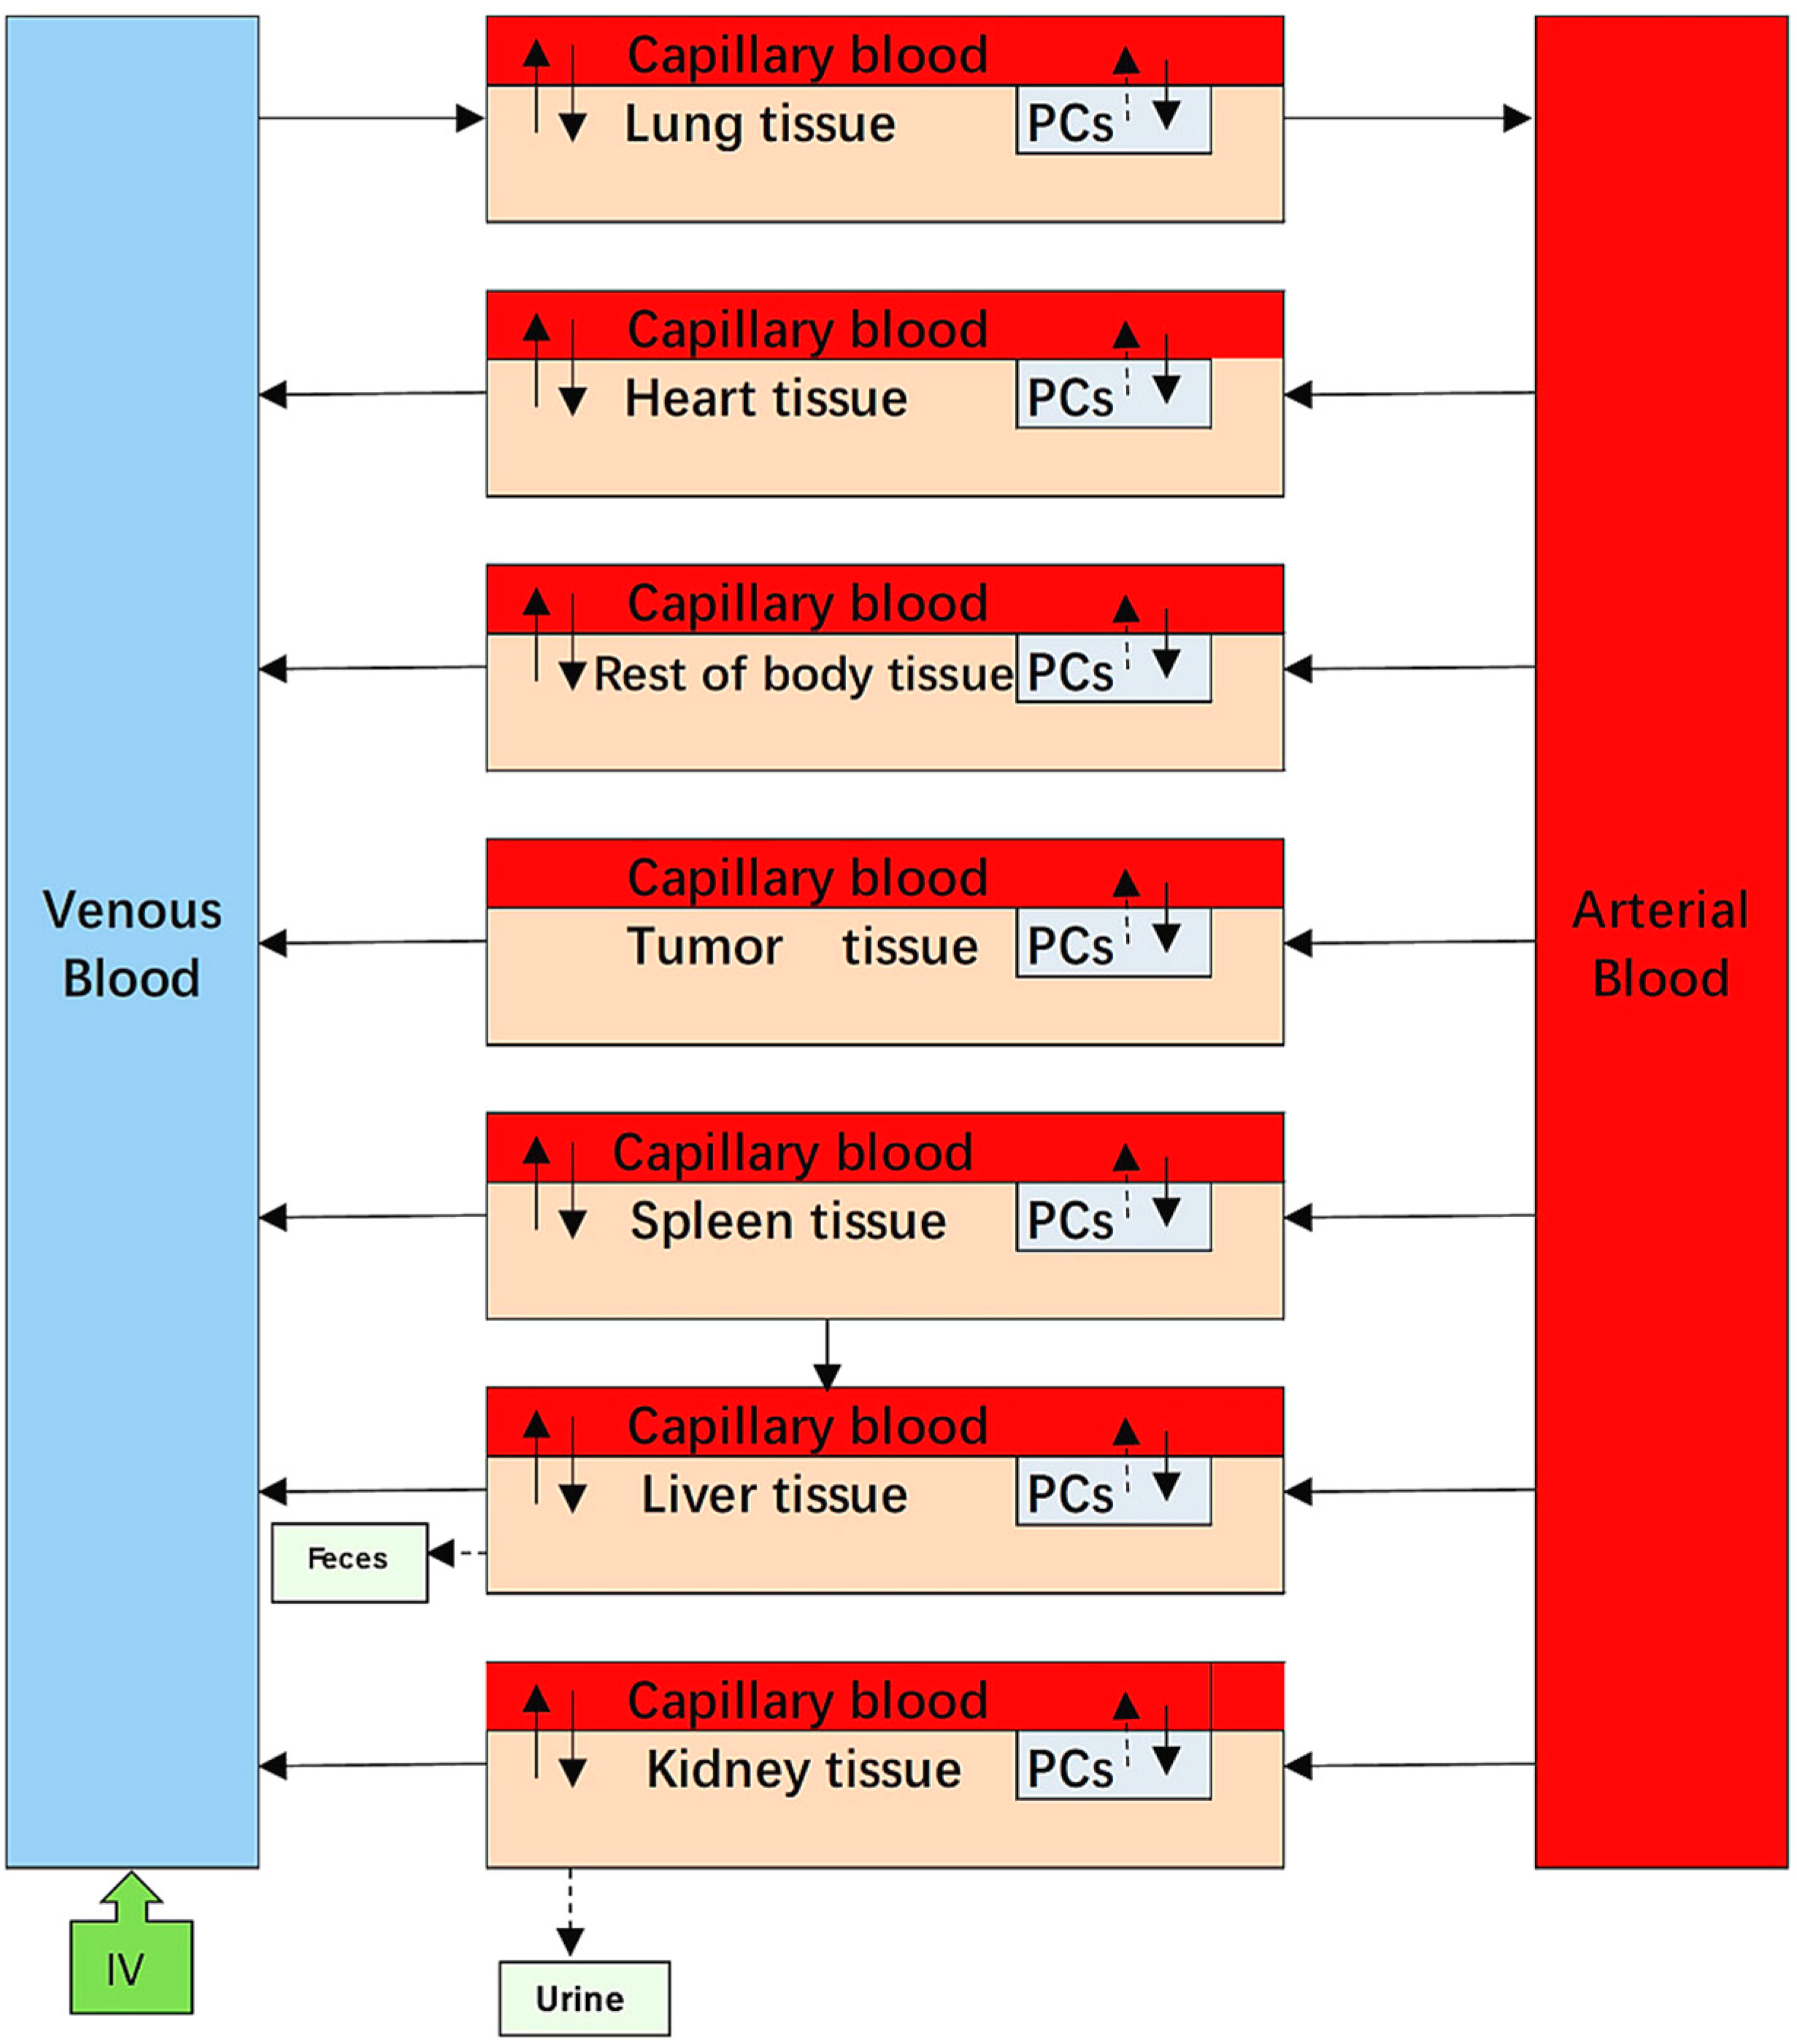
The PBPK model was divided into nine compartments: venous blood, arterial blood, heart, liver, spleen, lungs, kidneys, and tumour, which are regarded as physiological organ compartments, as well as the rest of the body. Each organ compartment consisted of three sub-compartments: capillary blood, tissue, and PCs. All compartments were interconnected by venous and arterial blood. According to the available literature, NPs can be taken up via a wide variety of endocytic pathways [
16]. To simplify these complex pathways, two general pathways were generated based on the transportation mechanisms involved. In the blood-flow-limited method, NPs were directly transferred from the bloodstream into macrophages located at the tissue capillary blood vessels, while the membrane-limited method was that the NPs were diffused into tissue and further taken up by tissue macrophages. Based on the earlier approaches employed in the reported NP PBPK models [
7,
11], we attempted to describe phagocytosis of 80 nm and 200 nm mPEG-PCL NPs by both blood flow- and membrane-limited processes. We found that it was better to describe phagocytosis using a flow-limited method for all five mPEG-PCL NP formulations (
Figure 18).
Based on mass balances, we used three main model equations to describe the extent of cellular uptake of mPEG-PCL NPs from the blood (or interstitial space of tissue) and their subsequent release back to the blood (or interstitial tissue spaces) in the three sub-compartments. The mathematical equations that explain these processes are as follows:
For PCs in organs:
where
Pt represents the tissue/plasma distribution coefficient for organ t;
PAt represents the permeability area cross product between the blood and the tissue of the organ t (
PAt =
PACt ×
Qt;
PACt represents the permeability coefficient of NPs between capillary blood and tissue);
CVt represents the mPEG-PCL NP concentration in the venous blood of the organ t,
APC_t represents the amount of mPEG-PCL NPs in the PC sub-compartment of organ t,
Qt represents the blood flow to organ t,
VV_t represents the blood volume of the organ t,
VT represents tissue volume (interstitial space for mPEG-PCL NPs), CA represents the mPEG-PCL NP concentration in the arterial blood,
CT_t is the MPEG-PCL NP concentration in the tissue sub-compartment of the organ t,
kup_t is the uptake rate constant of organ t, and
Kout_t is the release rate constant of organ t. More detailed information related to the process of the model and the mathematical equations are provided in the Supporting Information (physiological parameters used in the PBPK model for NPs in mice
Table S3; mass balance equations).
It was suggested that the processes of release and excretion of NPs in organs were assumed to follow first-order kinetics. Because the uptake rate of PCs decreases as the amount of captured NPs approaches PC saturation levels, the time-dependent uptake rate constant (
kup) of mPEG-PCL NPs by PCs can be accurately described by the Hill function, as based on previous reports [
5,
7].
where
Kmax is the maximum uptake rate constant,
K50 is the time required to reach half of
Kmax,
T is the time, and
n is the Hill coefficient.
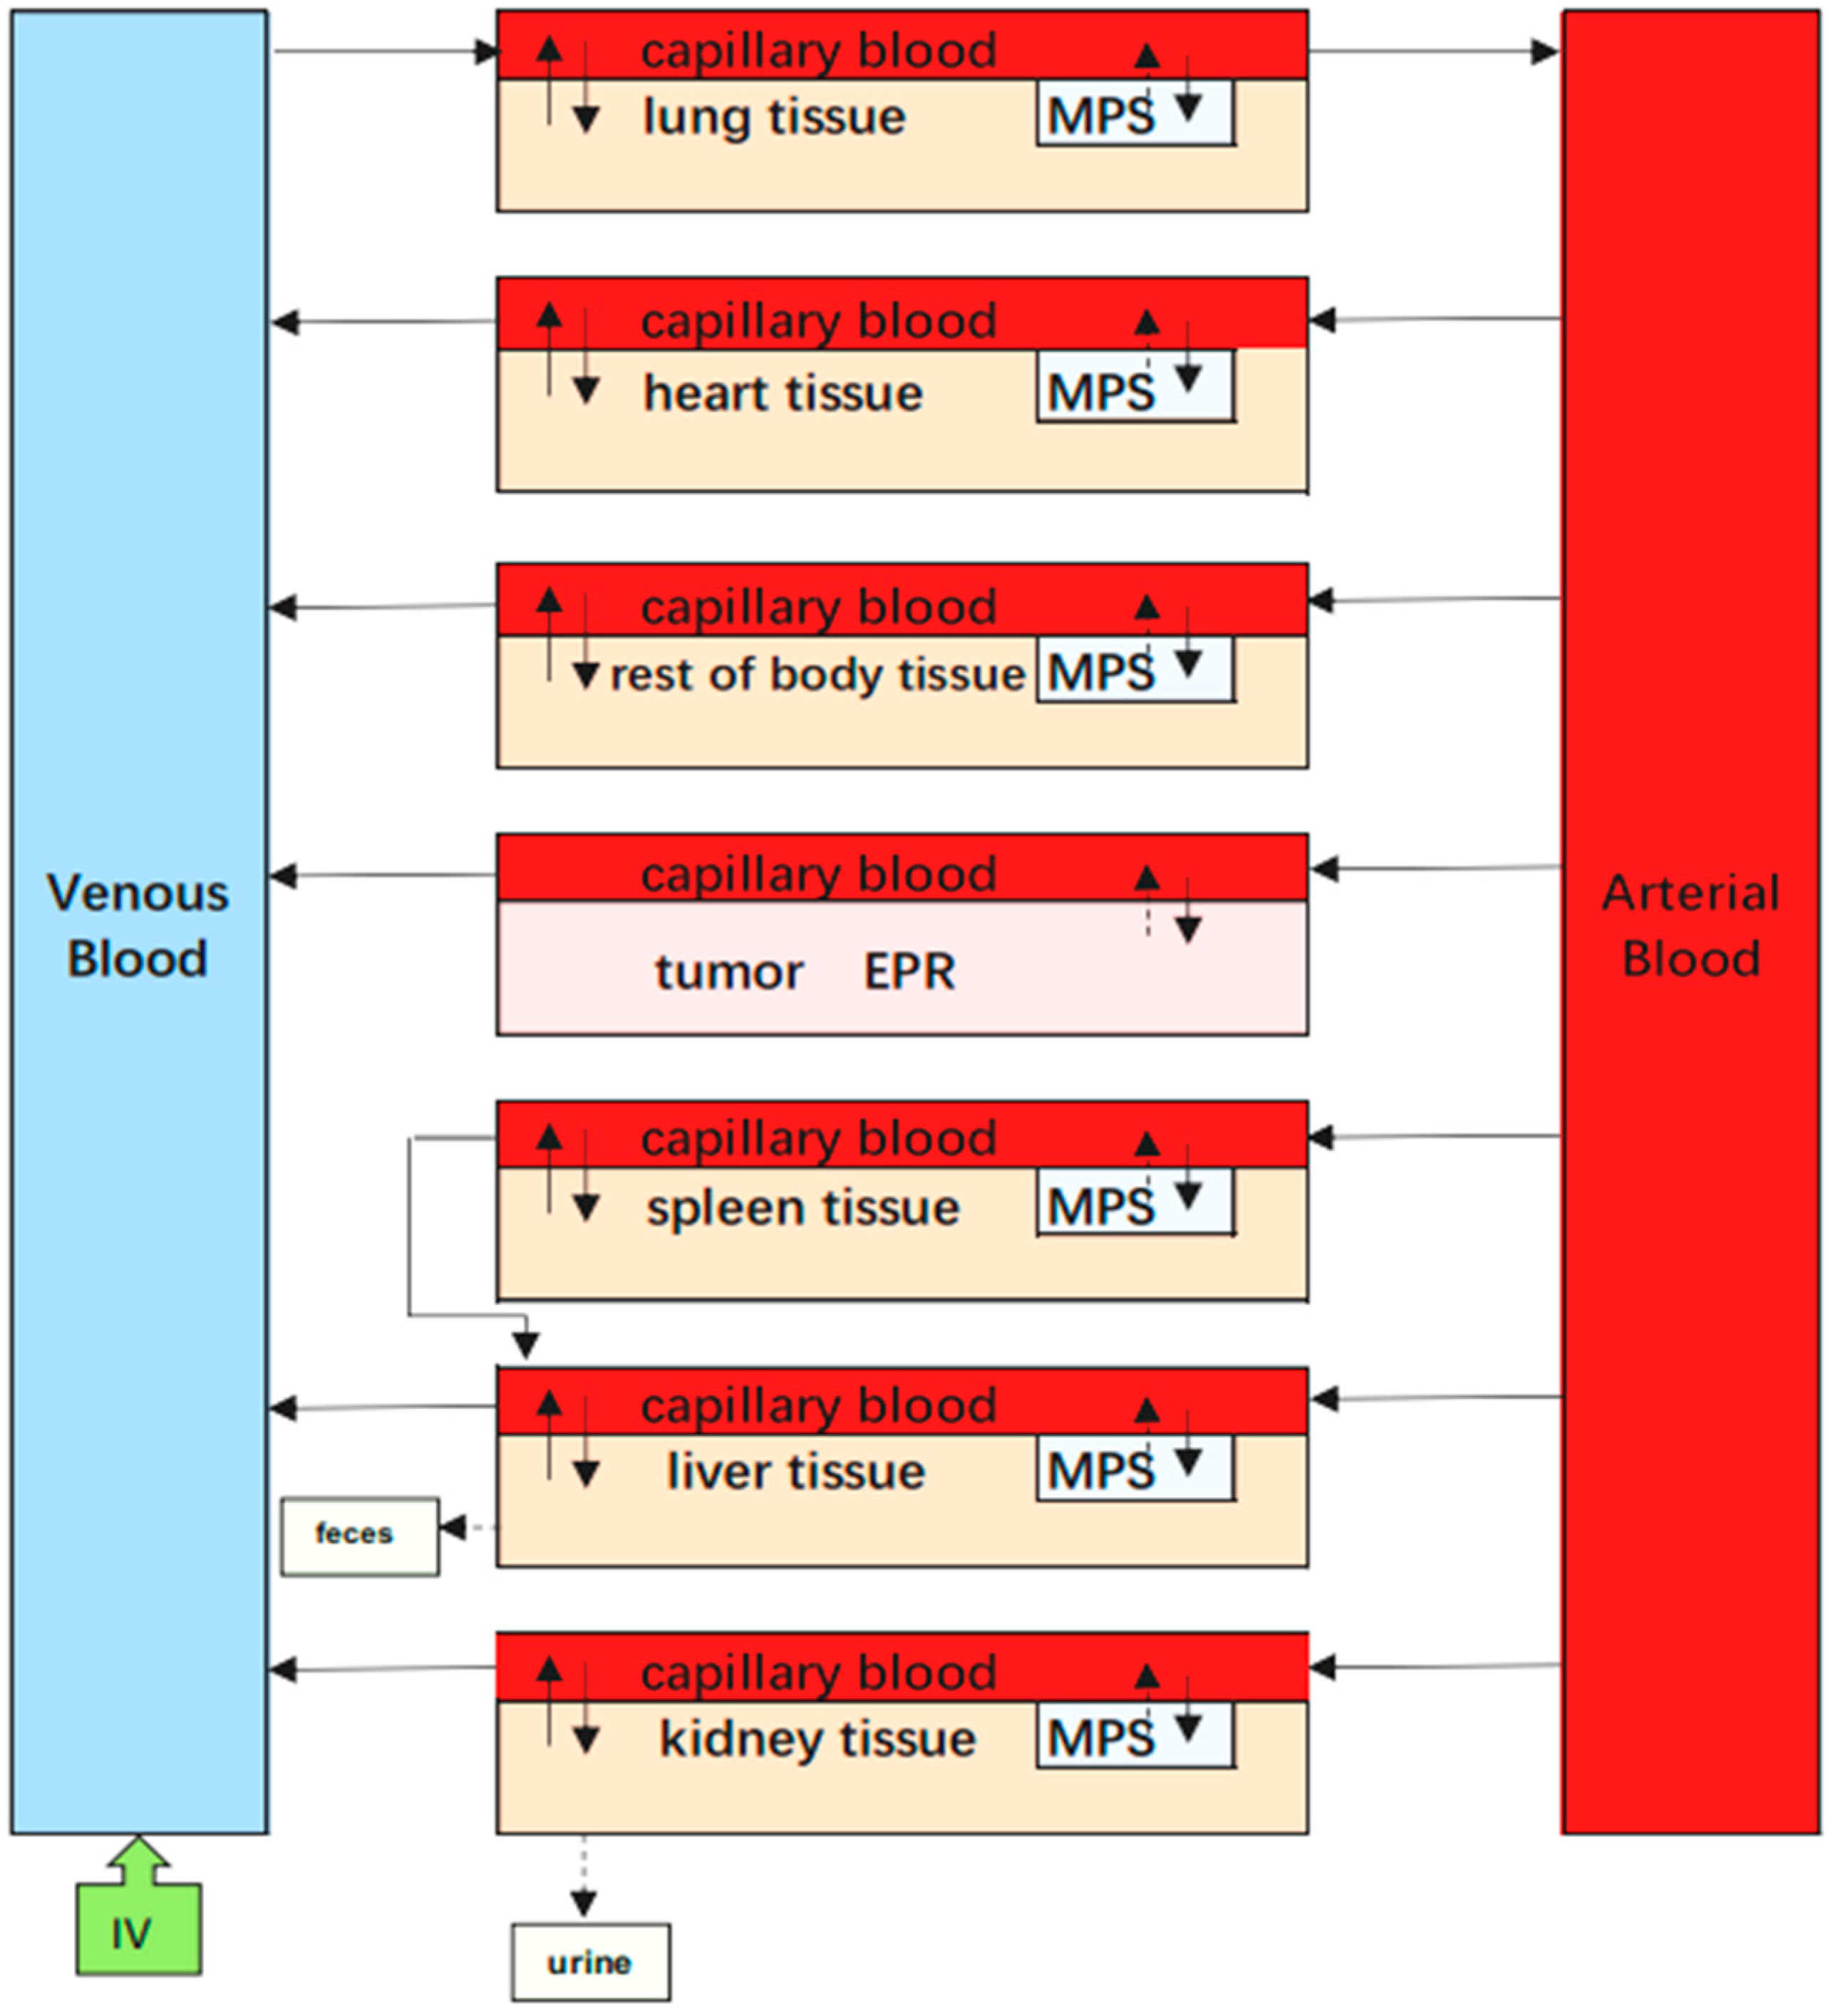
4.7. EPR-PBPK Model for mPEG-PCL NPs
In addition to the PBPK model describing the dynamics of mPEG-PCL NPs between and within organs involved in cellular phagocytosis, we also tried to integrate EPR effects as a sub-compartment to evaluate the EPR effects on tumours (
Figure 19).
In this PBPK model, the tumour was divided into two compartments, namely the vascular and EPR spaces. Here, we considered the EPR as an independent compartment, which was described by first-order rate constants of K1 and K2 to quantitatively investigate the transfer of NPs between the vascular and EPR spaces in tumour tissue.
Parameters such as VV_T, CVT, could be collected from the literature. The rate constant K1 represents the extravasation of mPEG-PCL NPs from circulation into the tumour, while the rate constant K2 describes the intravasation of mPEG-PCL NPs from the tumour back into the circulation. represents the mPEG-PCL NP concentration in the tumour-EPR compartment.
We used Berkeley Madonna v.8.3.23 (University of California, Berkeley, CA, USA) to execute the code (the code in the PBPK model for IV injection of NPs can be found in the Supporting Information) for the PBPK model, and to run the simulations. The initial values of P and PAC were obtained from the PBPK model for Au NPs [
7] and were further optimised by visually fitting to the measured data of mPEG-PCL NP concentrations after intravenous injection. The mPEG-PCL NP-specific parameters (
Kmax,
K50,
Kout, and
n) for each organ were estimated in a tissue-by-tissue manner by fitting the concentration–time of mPEG-PCL NPs in both tissue and plasma samples into a simplified “open loop” model with only one tissue compartment. Curve fitting performed with Berkeley Madonna was conducted to obtain the minimal weighted least squares fit of the model between the predicted and experimental values. The values of the parameters obtained from the “open loop” models were then used as initial estimates in the whole-body PK model [
5]. The concentration–time profiles of mPEG-PCL NPs in tissues and plasma were fitted simultaneously to obtain mPEG-PCL NPs and tissue-specific parameters.
4.8. Goodness of Fit
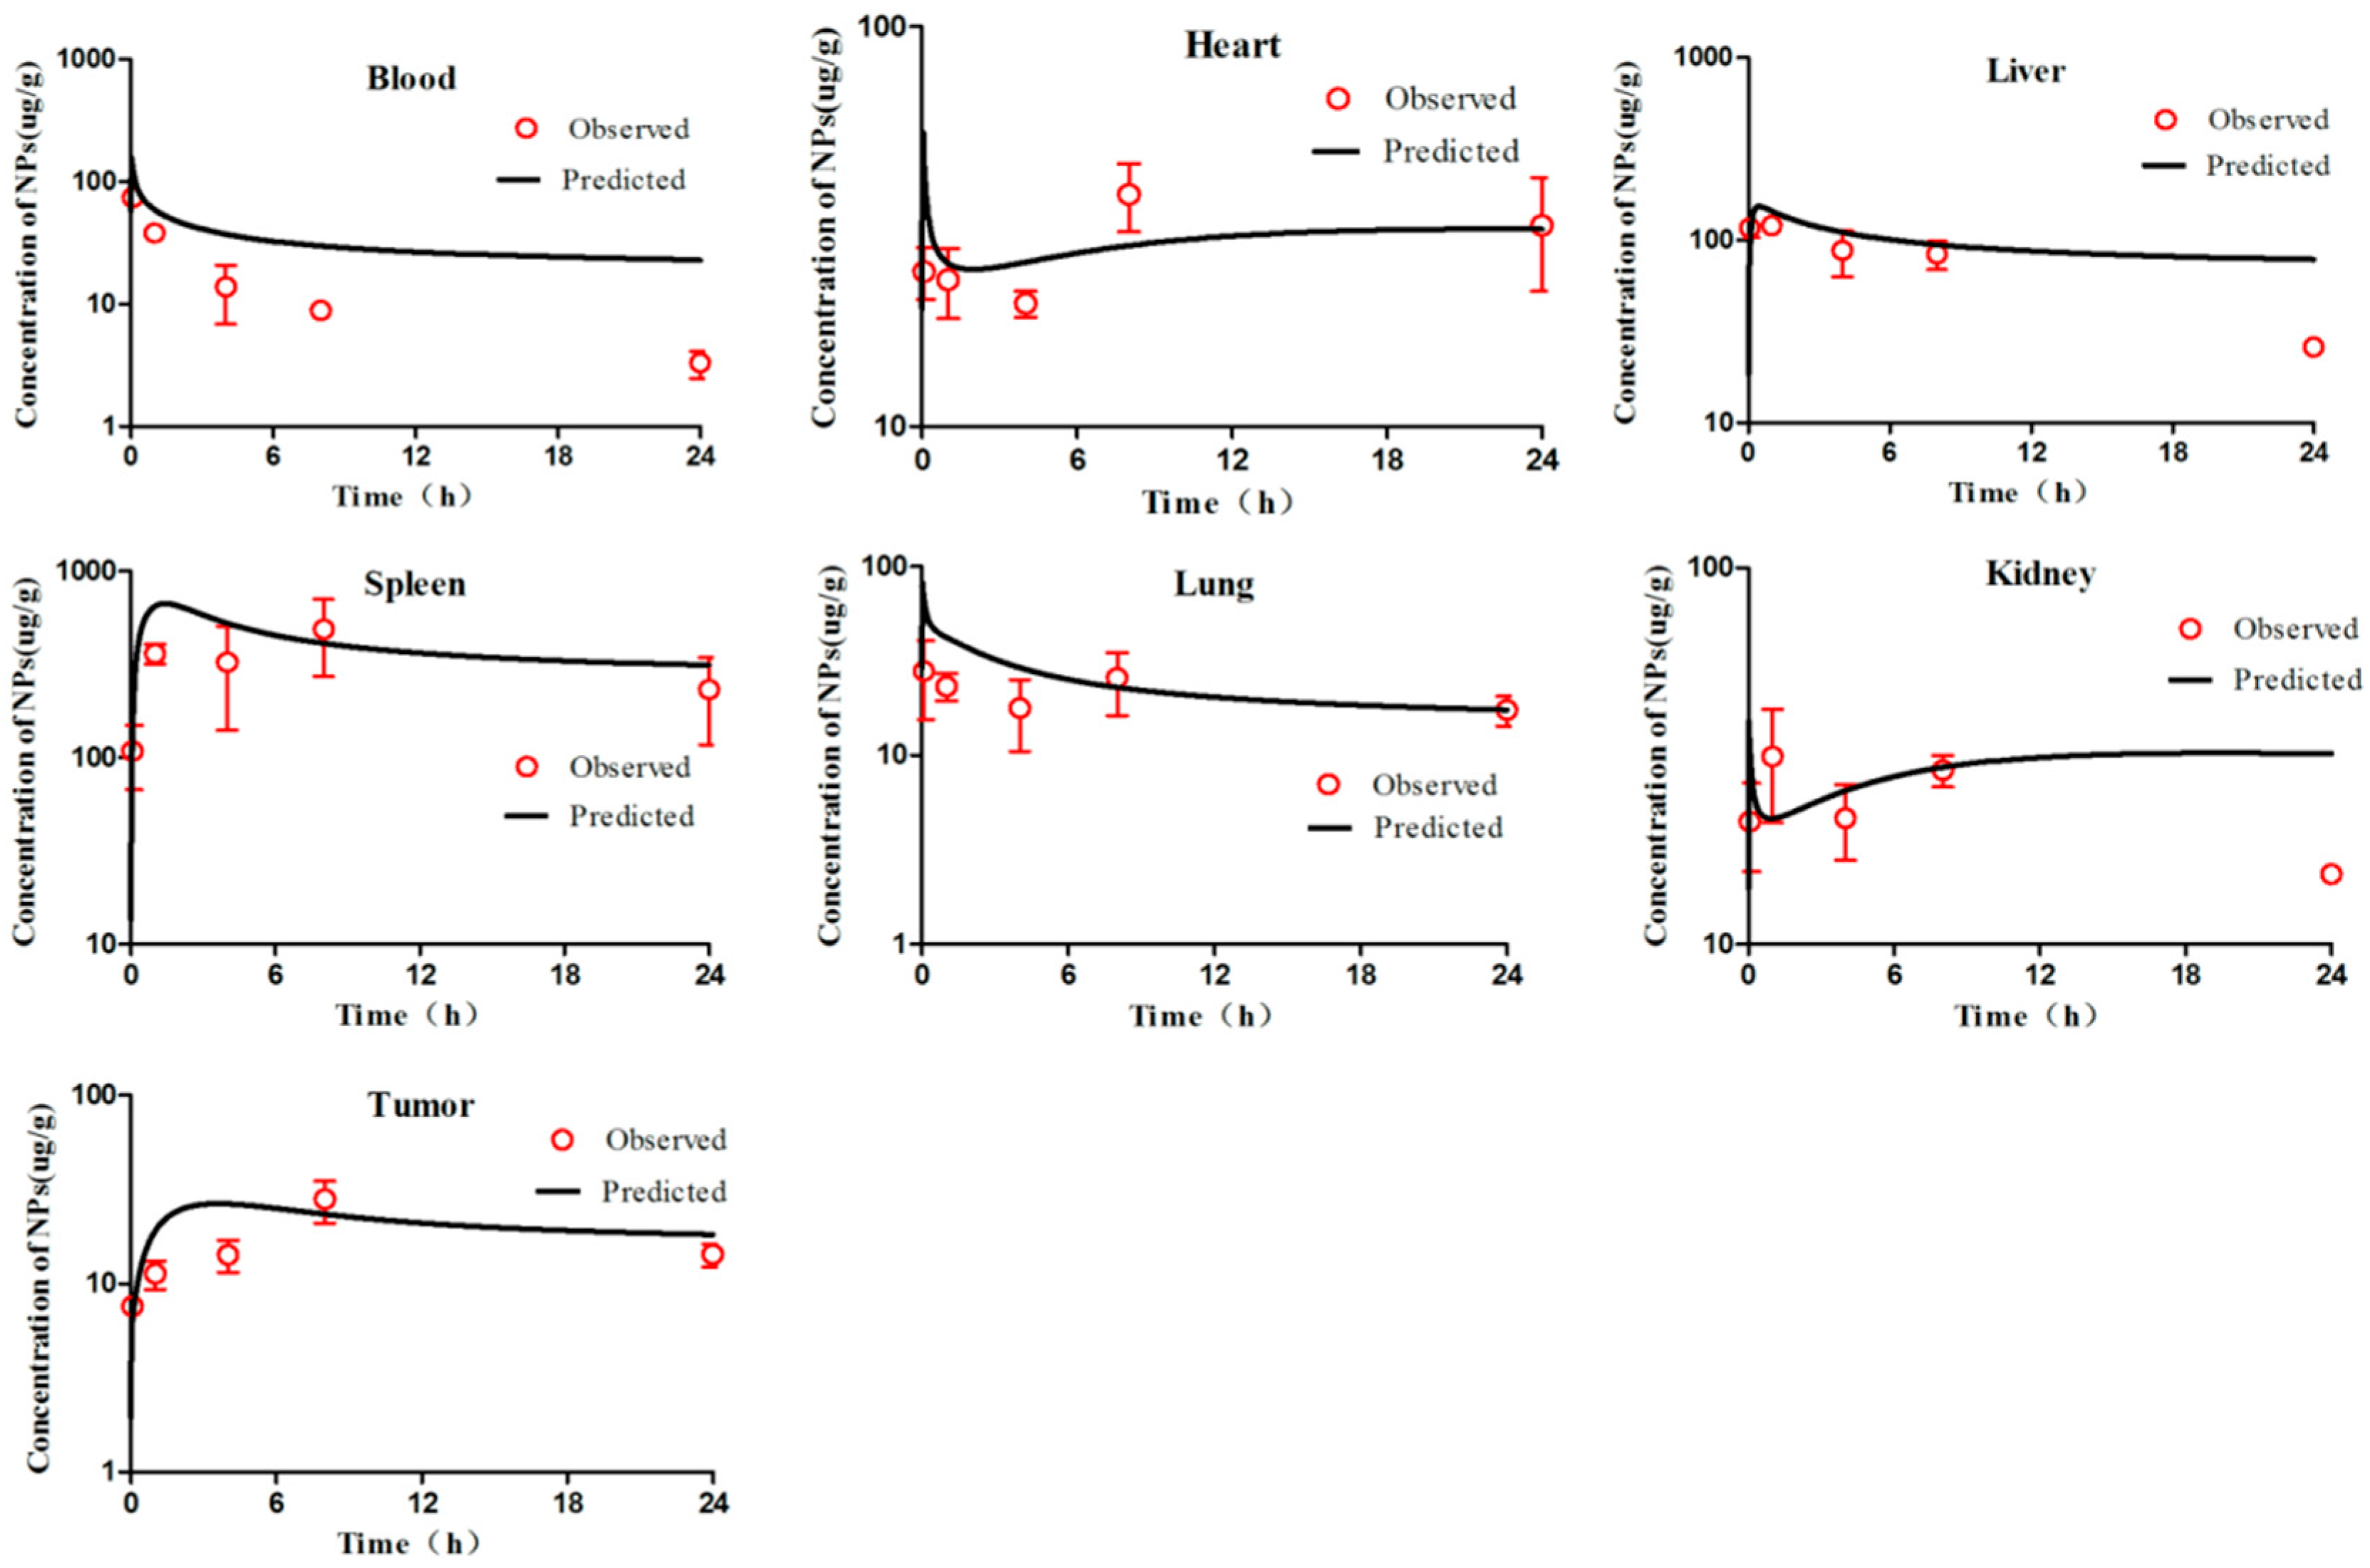
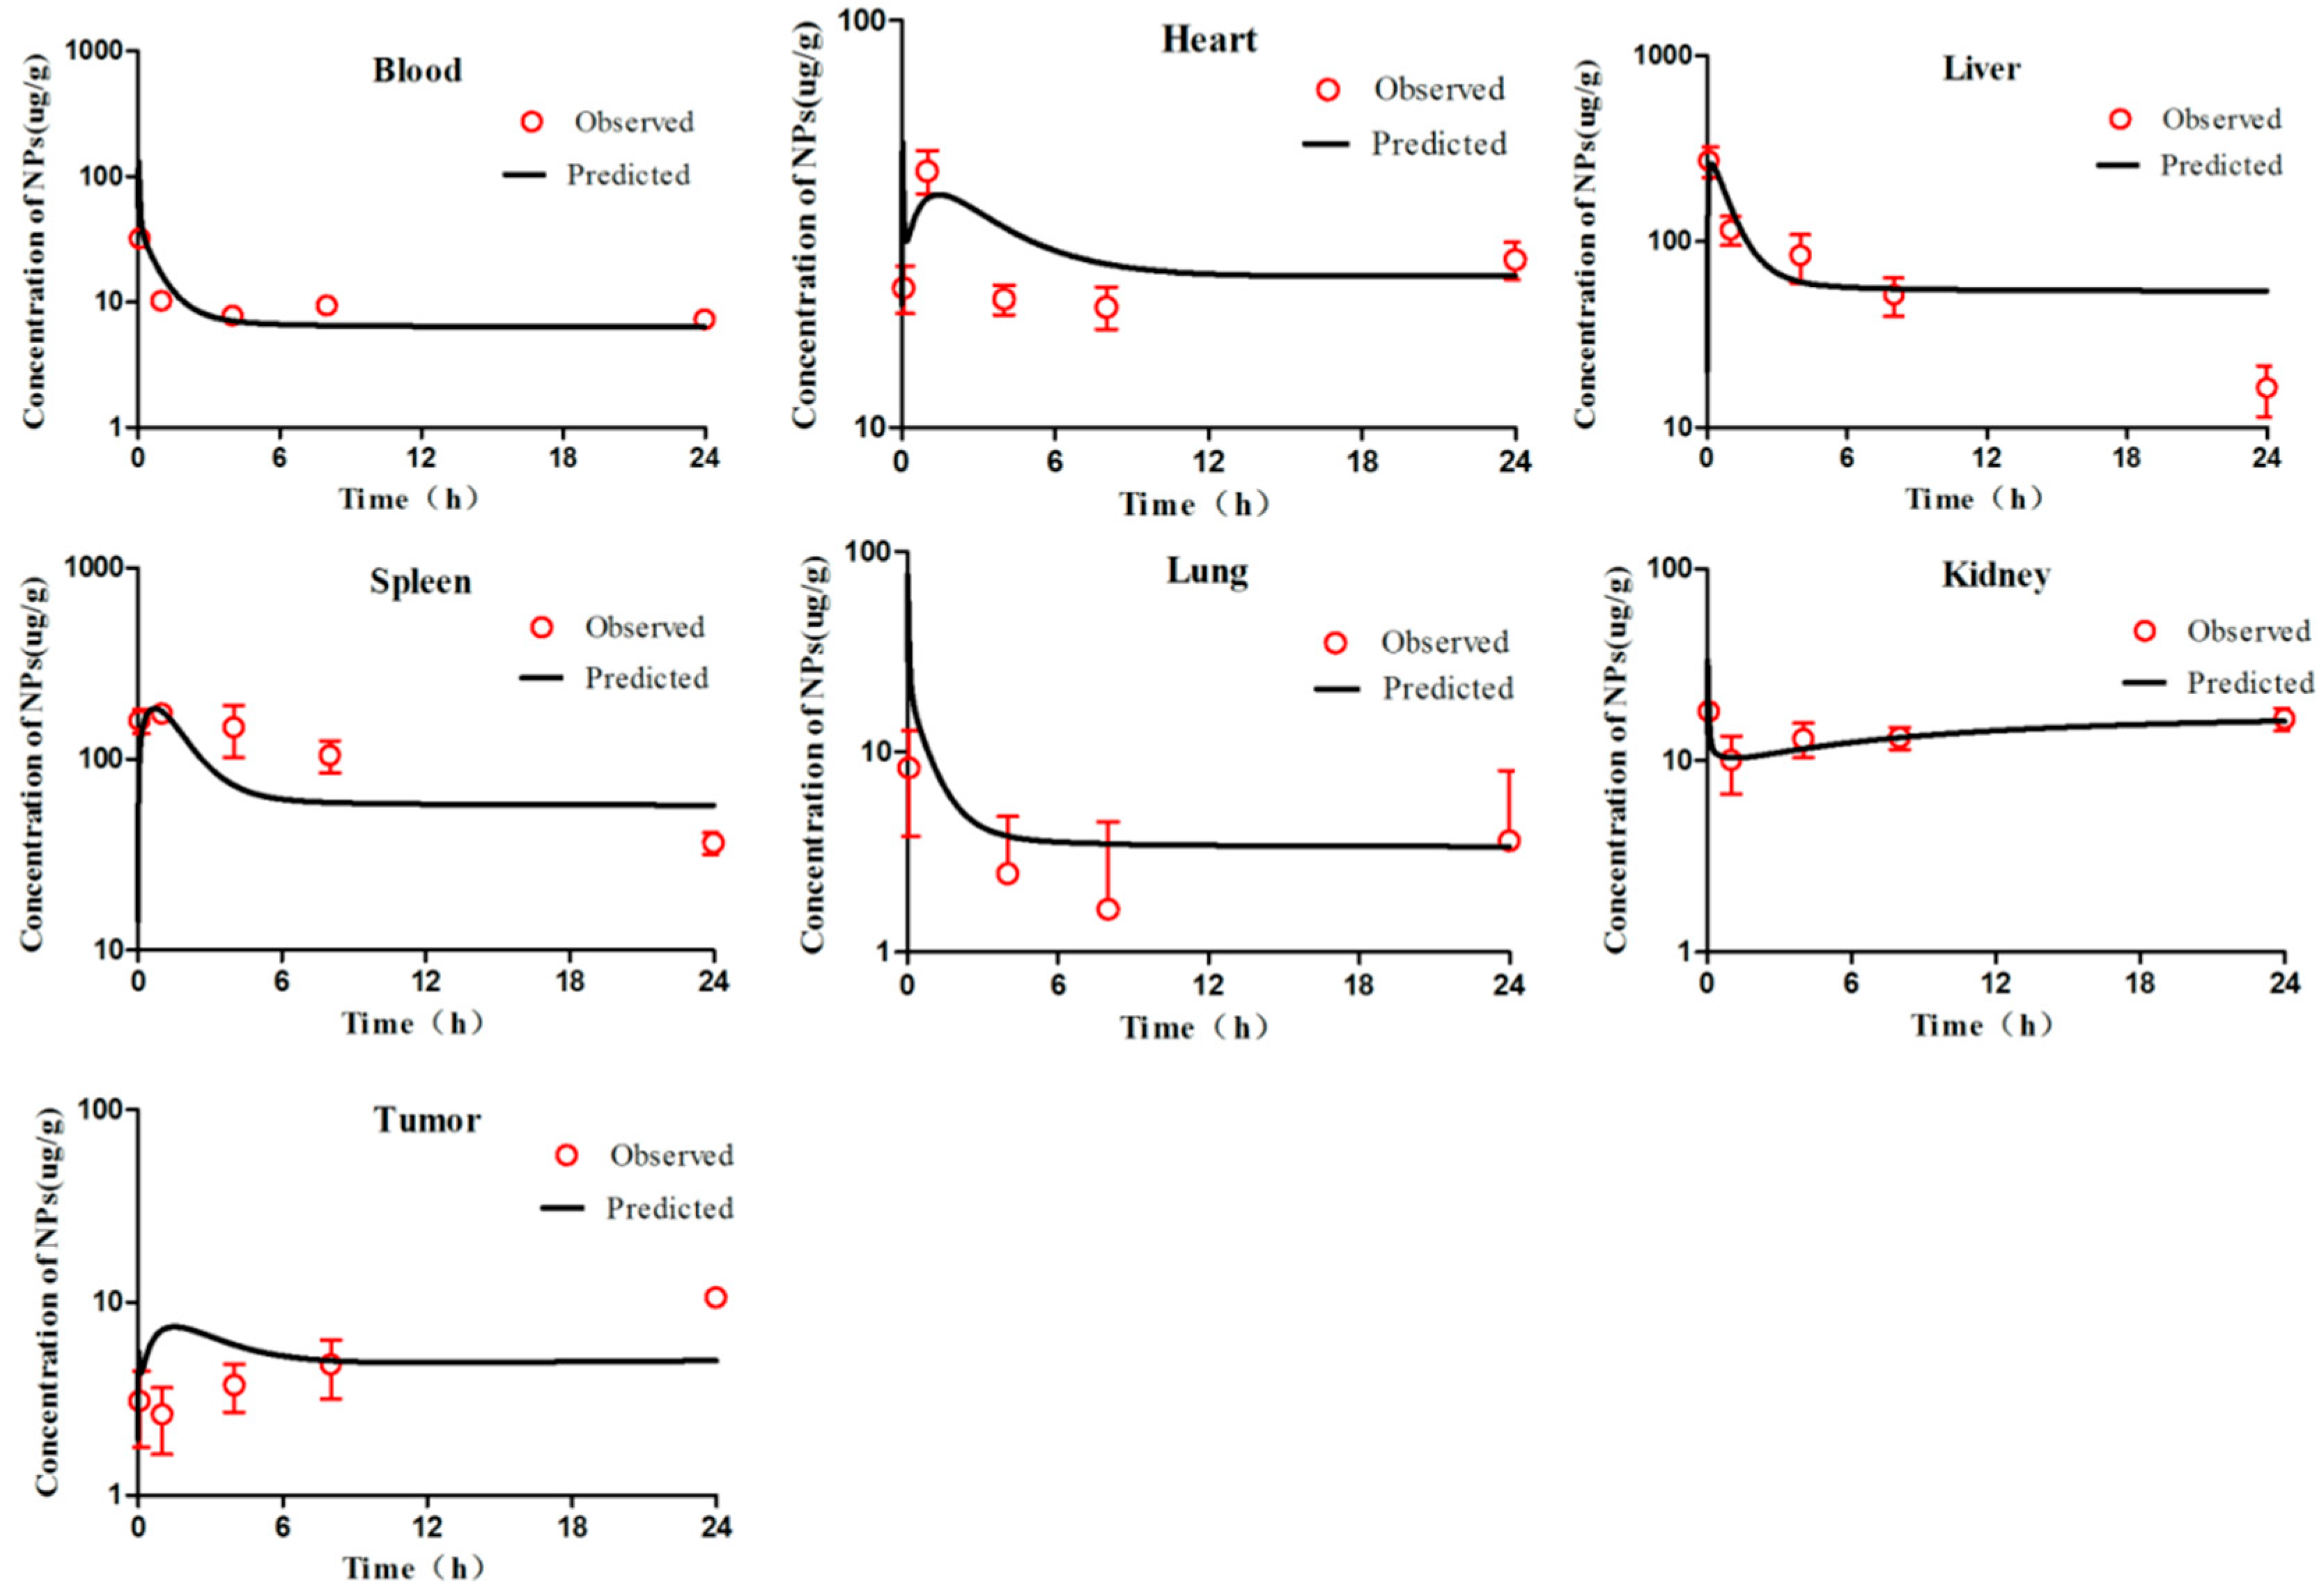
First, we visually compared the time courses involving the amounts of NPs between the experimental data and predicted concentrations in the blood and in various tissues in both the PCs-PBPK and EPR-PBPK models. Then, linear regression analyses of log values for all the experimental and predicted concentrations were conducted, and R
2 values were compared to assess the goodness of fit (
Figures S3 and S9).
4.9. Sensitivity Analysis
To determine the most influential parameters in the model simulation, sensitivity analysis was performed for all organs until 24 h after injection. First, we separately multiplied and divided each parameter by a factor of 2 and compared the NP amount in a given organ such as the liver compartment over time to determine the relative sensitivity parameters. Then, the values of relative sensitivity parameters were increased by 1% and the area under the curve (AUC) for the mPEG-PCL NP concentrations was analysed from the model simulations in all the compartments except for blood. The relative sensitivity coefficients (RSC) were calculated for all parameters (p) and compartments, as shown in Equation (5). If the absolute values of RSC were >0.5, they were viewed as highly sensitive parameters.


 ,
, 


