
Spectral Properties of Foams and Emulsions


Abstract
:1. Introduction
2. Foams
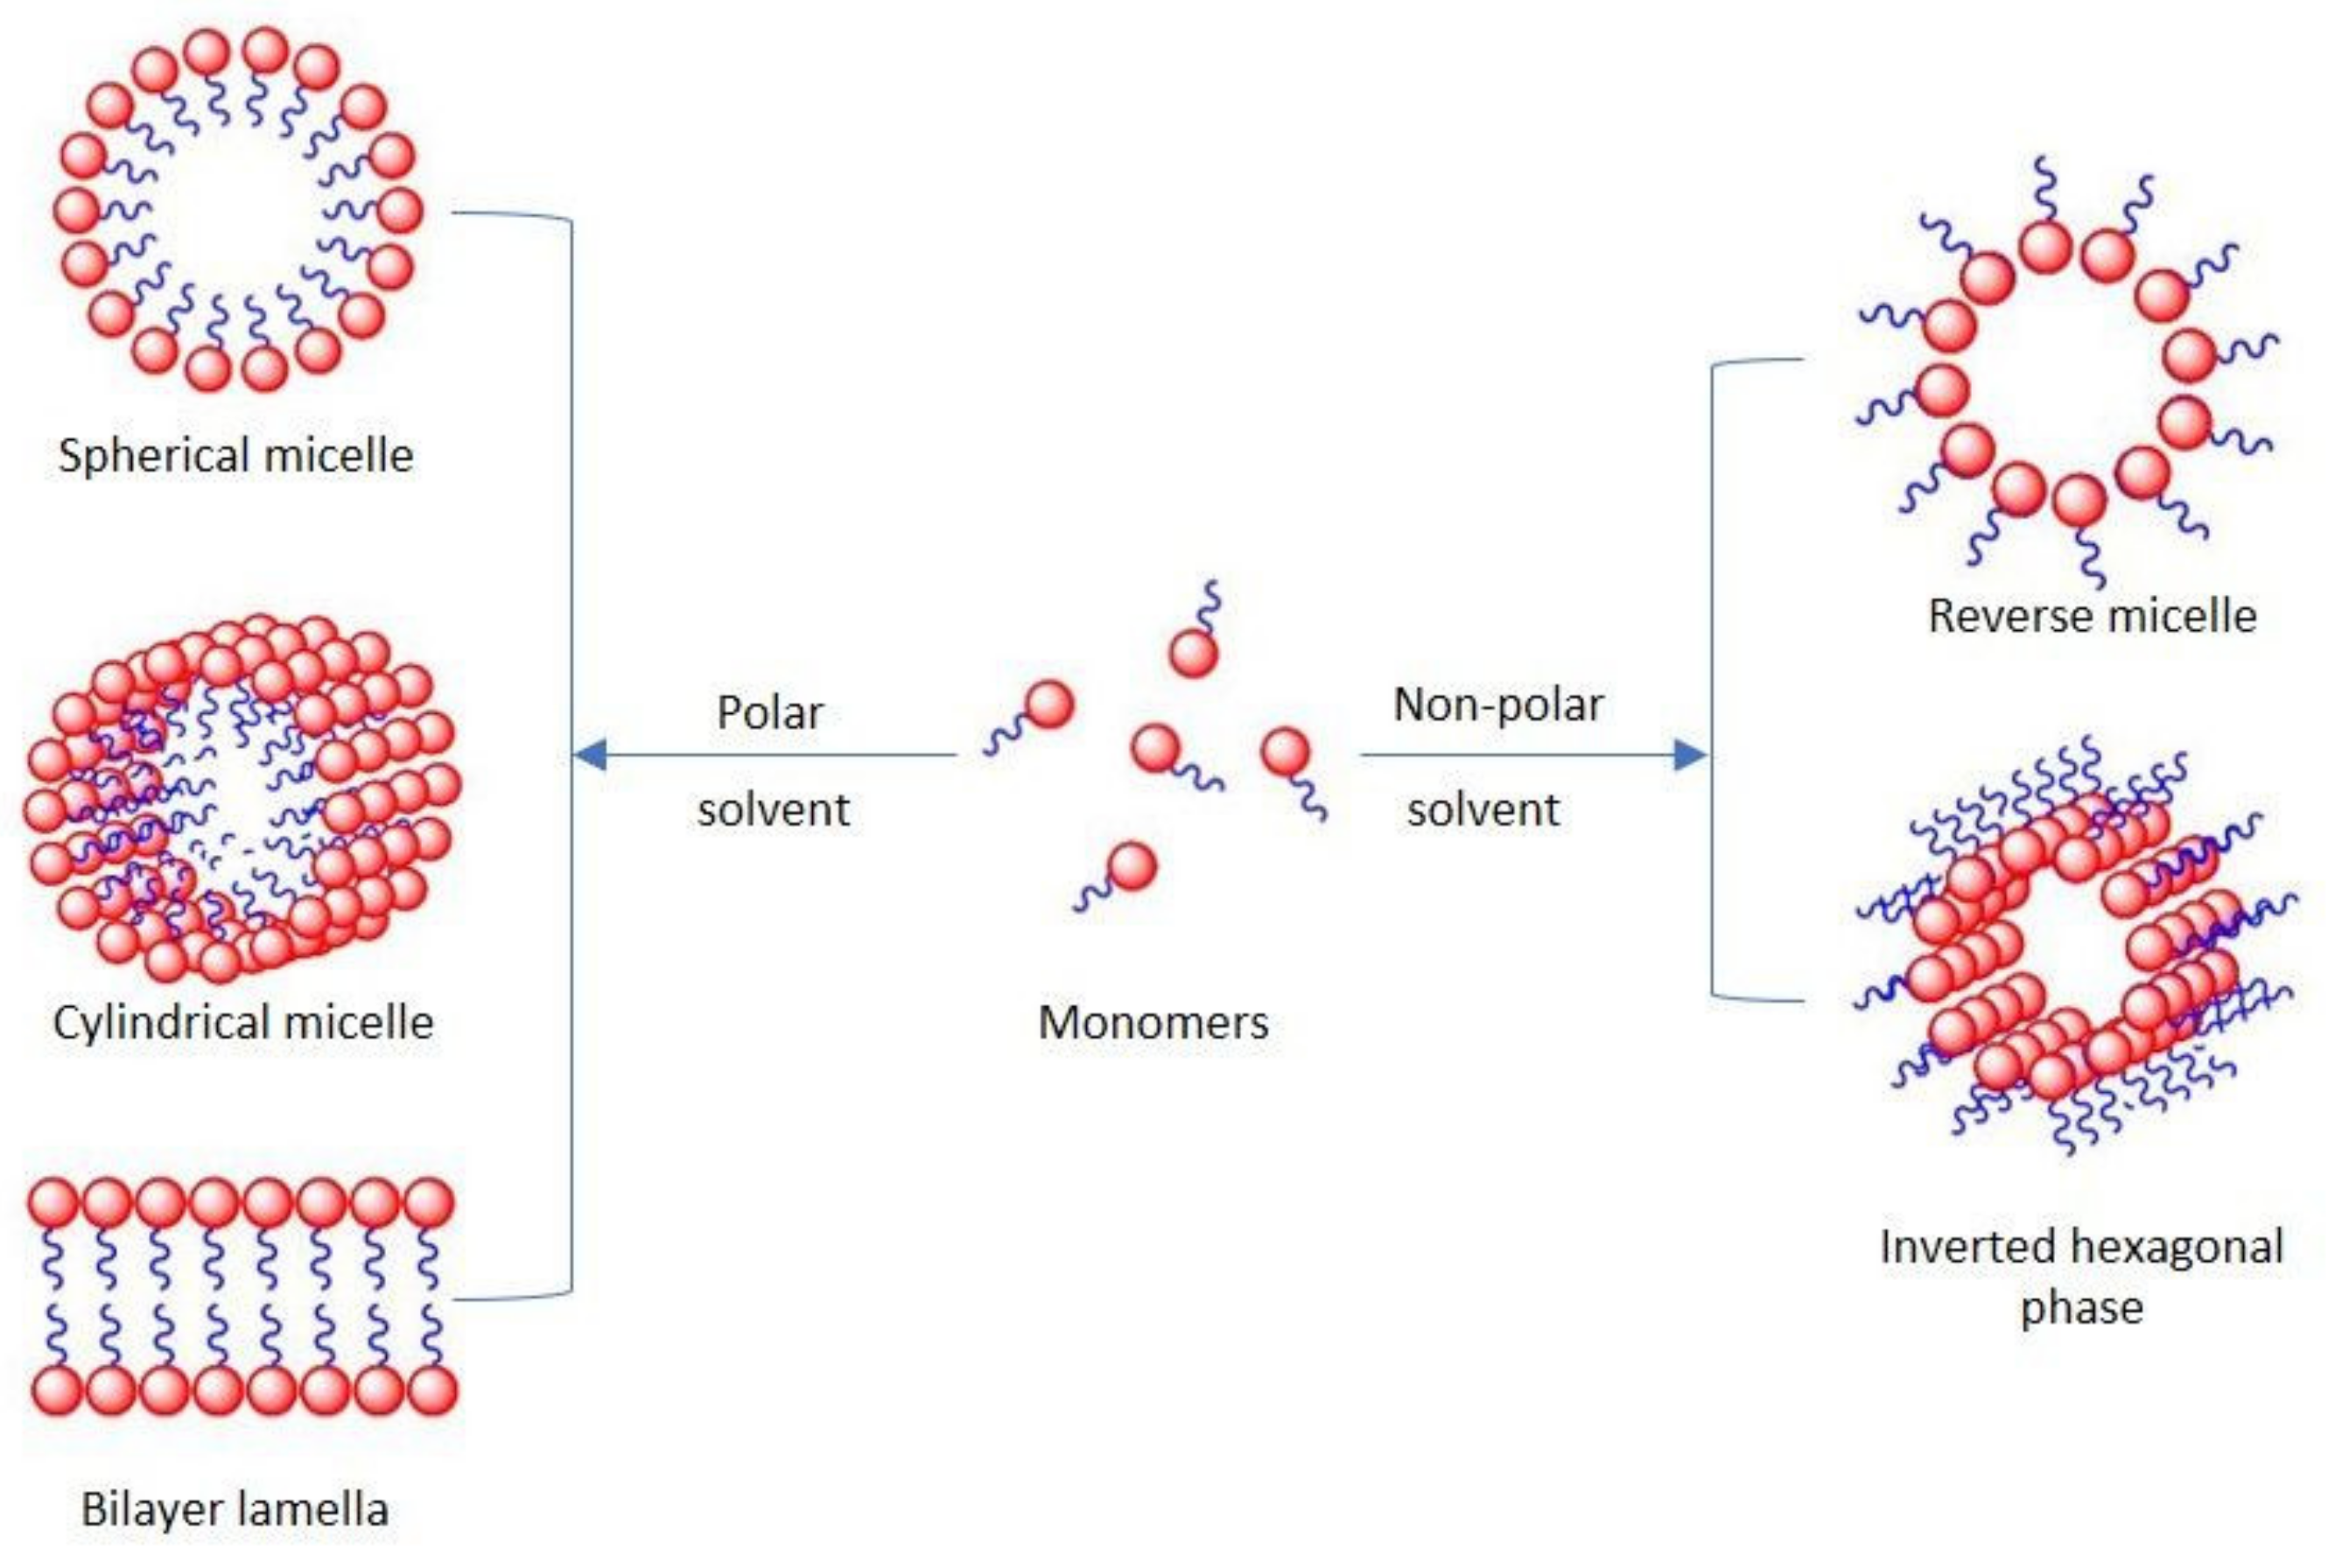
2.1. Surfactants
2.2. Particles as Emulsion and Foam Stabilizers
2.3. Methods of Foam Generation
2.4. Spectral Studies of Foams
3. Emulsions
3.1. Emulsifiers
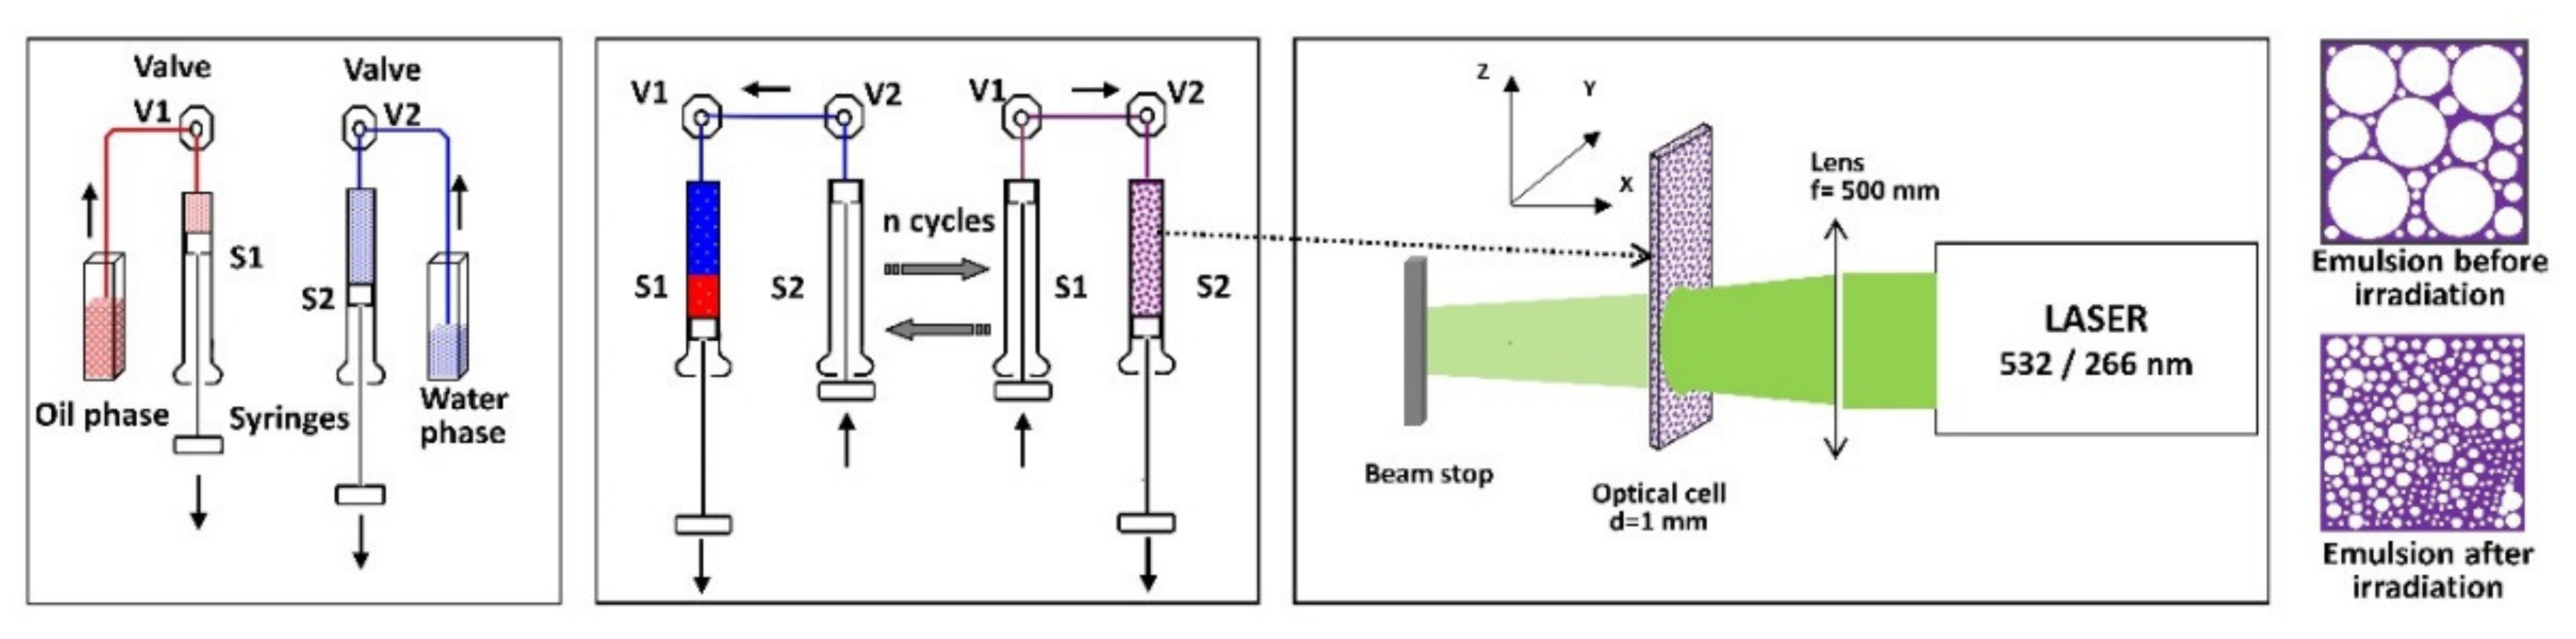
3.2. Techniques of Emulsification
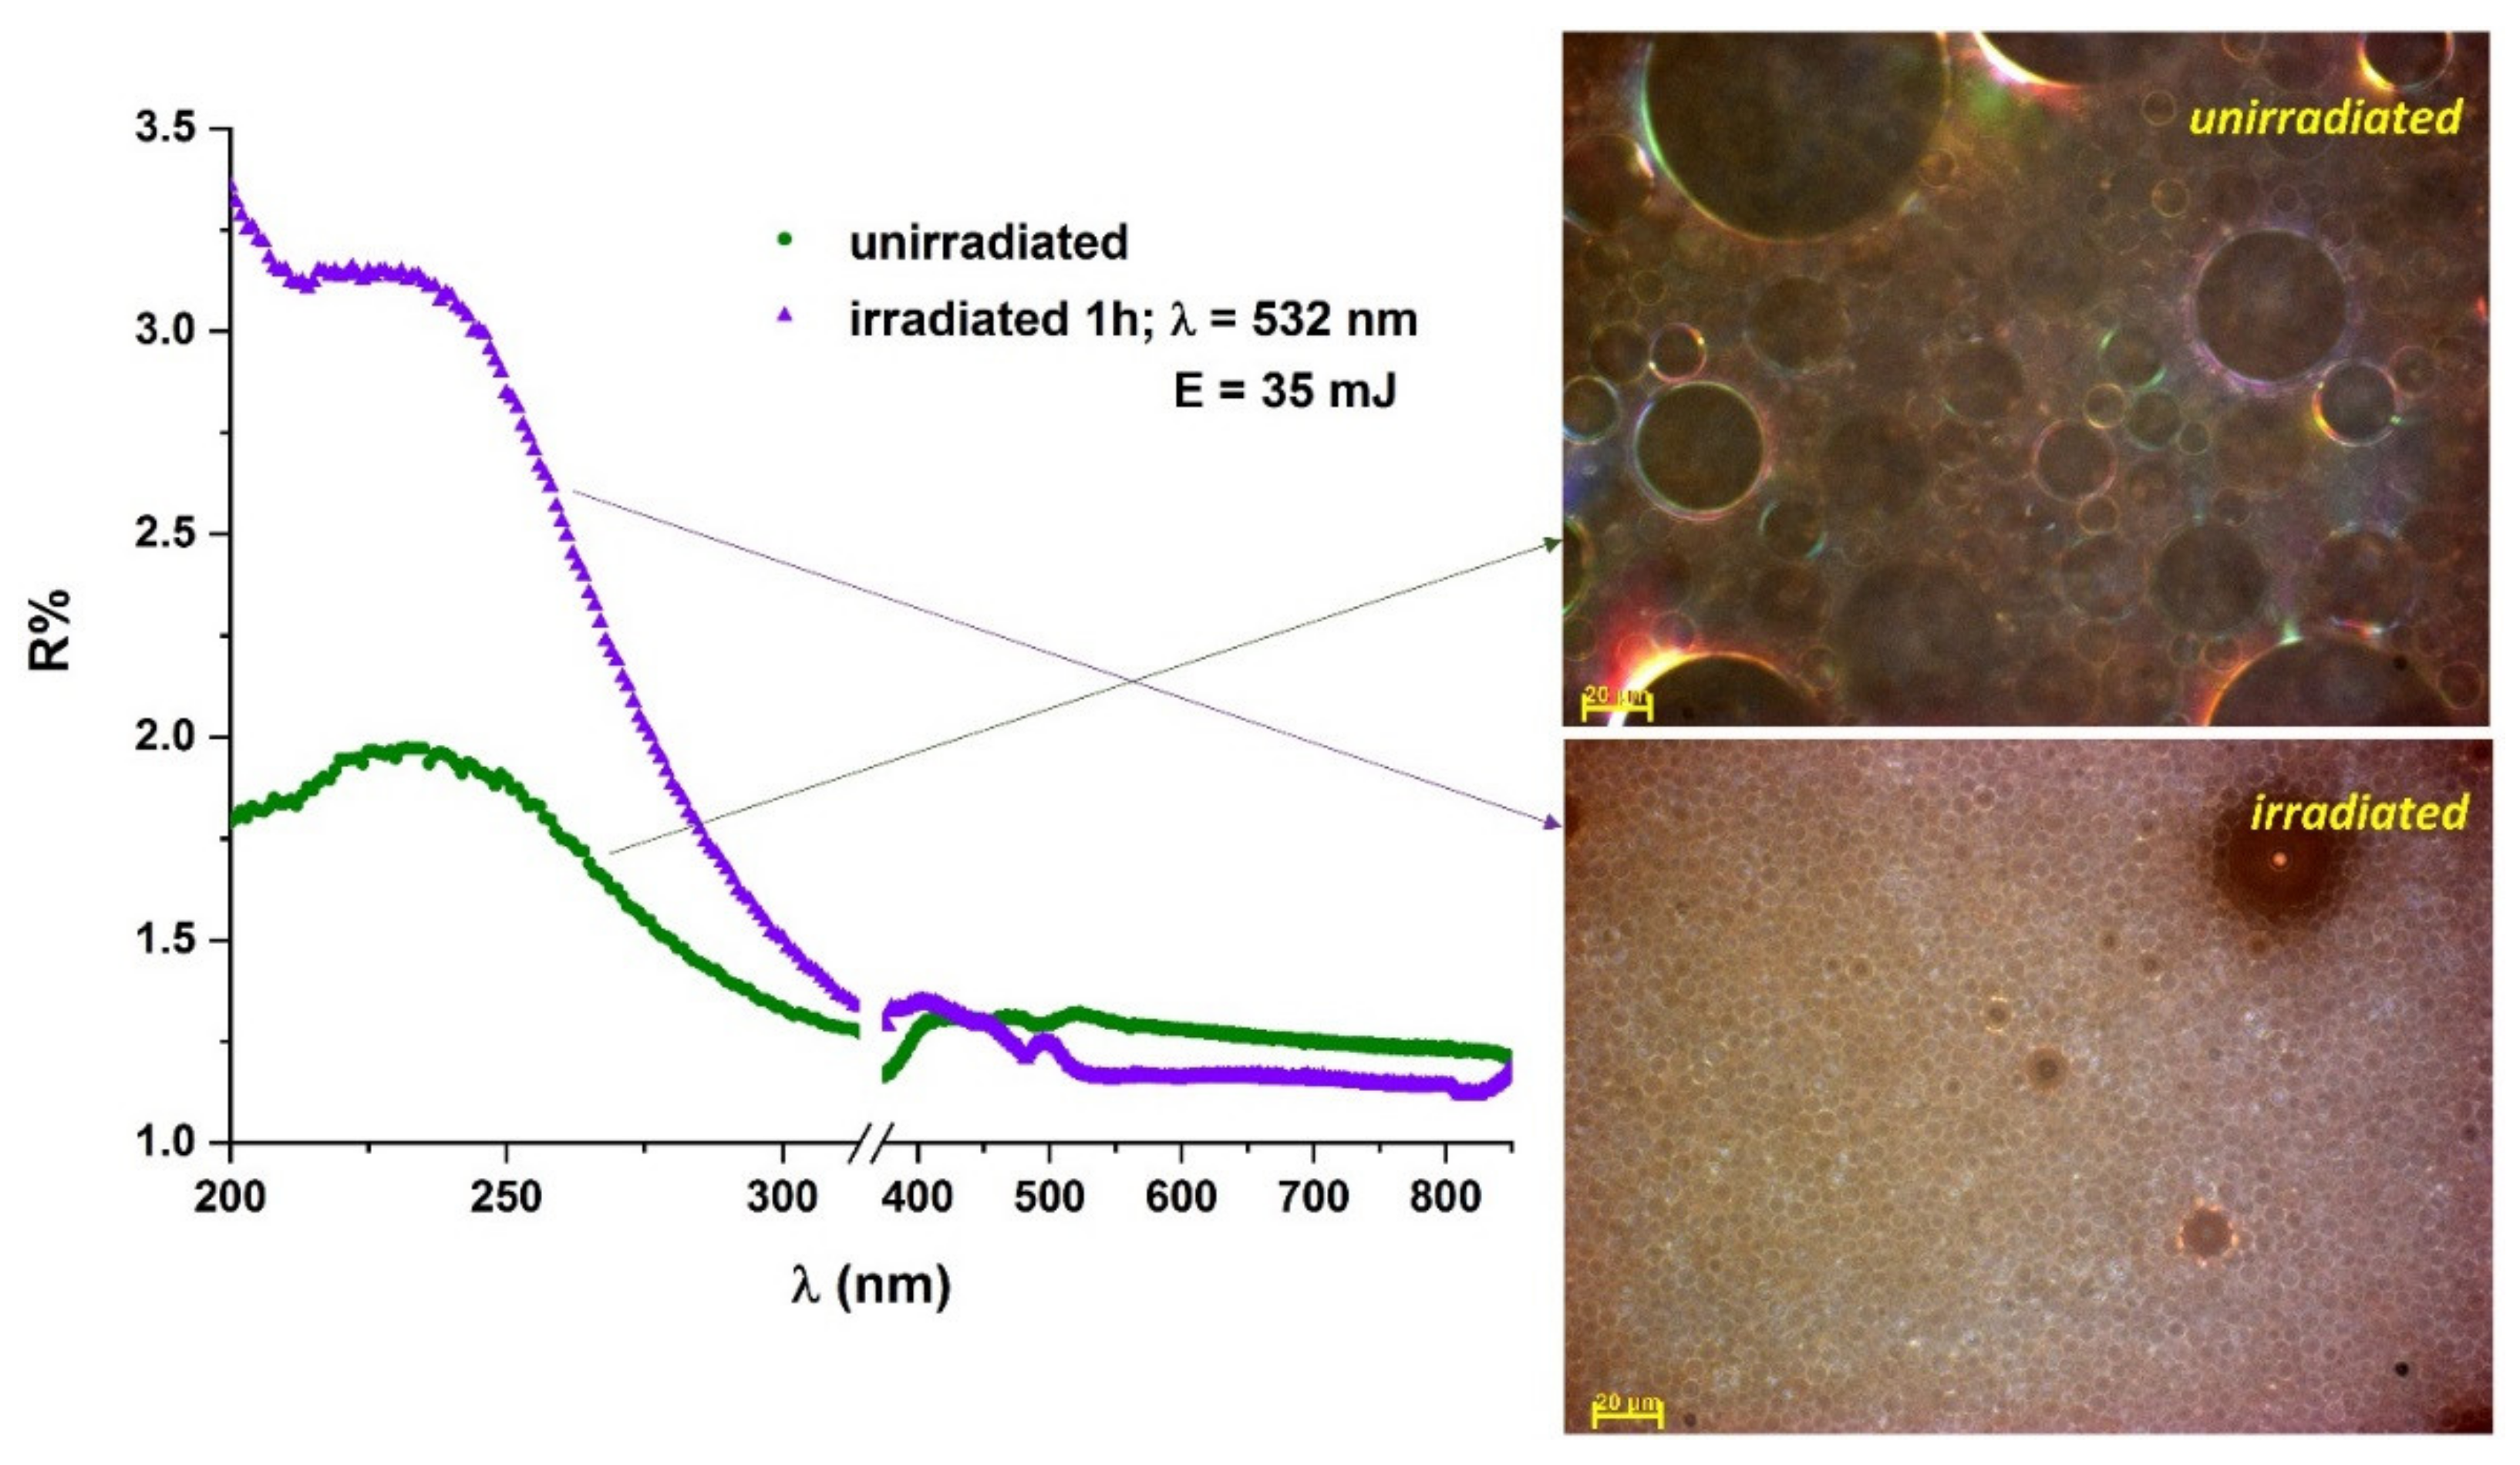
3.3. Spectral Properties of Emulsions
4. Spectral Characterization Techniques
4.1. Optical Absorption Spectroscopy
4.1.1. Absorption Spectroscopy
4.1.2. Reflectance Spectroscopy
4.2. Vibrational Spectroscopy
4.2.1. Infrared Spectroscopy
4.2.2. Raman Spectroscopy
4.3. Diffusing Wave Spectroscopy
5. Conclusions
Author Contributions
Funding
Conflicts of Interest
References
- Drenckhan, W.; Testouri, A.; Saint-Jalmes, A. Fundamentals of Foam Formation. In Foam Films and Foams: Fundamentals and Applications, 1st ed.; Ekserova, D.R., Gochev, G., Platikanov, D., Liggieri, L., Miller, R., Eds.; CRC Press, Taylor and Francis Group: Boca Raton, FL, USA, 2019; ISBN 978-1-351-11772-2. [Google Scholar]
- McClements, D.J. Food Emulsions: Principles, Practices, and Techniques, 2nd ed.; CRC Series in Contemporary Food Science; CRC Press: Boca Raton, FL, USA, 2005; ISBN 978-0-8493-2023-1. [Google Scholar]
- Food Emulsions, Friberg, S.; Larsson, K.; Sjöblom, J. (Eds.) Food Science and Technology; 4th ed.; rev. expanded; Marcel Dekker: New York, NY, USA, 2004; ISBN 978-0-8247-4696-4. [Google Scholar]
- Sis, H.; Kelbaliyev, G.; Chander, S. Kinetics of Drop Breakage in Stirred Vessels under Turbulent Conditions. J. Dispers. Sci. Technol. 2005, 26, 565–573. [Google Scholar] [CrossRef]
- Sugiura, S.; Nakajima, M.; Yamamoto, K.; Iwamoto, S.; Oda, T.; Satake, M.; Seki, M. Preparation Characteristics of Water-in-Oil-in-Water Multiple Emulsions Using Microchannel Emulsification. J. Colloid Interface Sci. 2004, 270, 221–228. [Google Scholar] [CrossRef] [PubMed]
- Pascu, M.L. Laser Optofluidics in Fighting Multiple Drug Resistance; Bentham Science Publishers: Sharjah, United Arab Emirates, 2017; ISBN 978-1-68108-498-5. [Google Scholar]
- Goodarzi, F.; Zendehboudi, S. A Comprehensive Review on Emulsions and Emulsion Stability in Chemical and Energy Industries. Can. J. Chem. Eng. 2019, 97, 281–309. [Google Scholar] [CrossRef] [Green Version]
- Boni, M.; Nastasa, V.; Andrei, I.R.; Staicu, A.; Pascu, M.L. Enhanced Fluorescence Emitted by Microdroplets Containing Organic Dye Emulsions. Biomicrofluidics 2015, 9, 014126. [Google Scholar] [CrossRef] [Green Version]
- Boni, M.; Nastasa, V.; Militaru, A.; Smarandache, A.; Andrei, I.R.; Staicu, A.; Pascu, M.L. Laser Beams Interaction With Liquids in Optofluidic Experiments. Romanian Rep. Phys. 2012, 64, 1179–1194. [Google Scholar]
- Boni, M.; Staicu, A.; Andrei, I.R.; Smarandache, A.; Nastasa, V.; Comor, M.; Saponjic, Z.; Pascu, M.L. Studies on Laser Induced Emission of Microdroplets Containing Rhodamine 6G Solutions in Water Doped with TiO2 Nanoparticles. Colloids Surf. Physicochem. Eng. Asp. 2017, 519, 238–244. [Google Scholar] [CrossRef]
- Boni, M.; Andrei, I.R.; Pascu, M.L.; Staicu, A. Fluorescence and Time-Delayed Lasing during Single Laser Pulse Excitation of a Pendant Mm-Sized Dye Droplet. Molecules 2019, 24, 4464. [Google Scholar] [CrossRef] [Green Version]
- Ma, L.X.; Wang, F.Q.; Wang, C.A.; Wang, C.C.; Tan, J.Y. Investigation of the Spectral Reflectance and Bidirectional Reflectance Distribution Function of Sea Foam Layer by the Monte Carlo Method. Appl. Opt. 2015, 54, 9863. [Google Scholar] [CrossRef]
- Brozio, S.; O’Shaughnessy, E.M.; Woods, S.; Hall-Barrientos, I.; Martin, P.E.; Kennedy, M.W.; Lamprou, D.A.; Hoskisson, P.A. Frog Nest Foams Exhibit Pharmaceutical Foam-like Properties. R. Soc. Open Sci. 2021, 8, 210048. [Google Scholar] [CrossRef]
- Deotale, S.; Dutta, S.; Moses, J.A.; Balasubramaniam, V.M.; Anandharamakrishnan, C. Foaming Characteristics of Beverages and Its Relevance to Food Processing. Food Eng. Rev. 2020, 12, 229–250. [Google Scholar] [CrossRef]
- Deng, Y.; Zhang, X.; Shen, H.; He, Q.; Wu, Z.; Liao, W.; Yuan, M. Application of the Nano-Drug Delivery System in Treatment of Cardiovascular Diseases. Front. Bioeng. Biotechnol. 2020, 7, 489. [Google Scholar] [CrossRef] [Green Version]
- Asane, J.K.; Qi, Z.; Biener, M.M.; Liberman, V.; Noginov, M.A. Optical Properties of Nanoporous Gold Foams. AIP Adv. 2018, 8, 095302. [Google Scholar] [CrossRef] [Green Version]
- Schramm, L.L. Emulsions, Foams, Suspensions, and Aerosols: Microscience and Applications, 2nd ed.; Wiley-VCH Verlag GmbH & Co. KGaA: Weinheim, Germany, 2014; ISBN 978-3-527-33706-4. [Google Scholar]
- Frouin, R.; Schwindling, M.; Deschamps, P.-Y. Spectral Reflectance of Sea Foam in the Visible and Near-Infrared: In Situ Measurements and Remote Sensing Implications. J. Geophys. Res. Oceans 1996, 101, 14361–14371. [Google Scholar] [CrossRef]
- Langevin, D. Coalescence in Foams and Emulsions: Similarities and Differences. Curr. Opin. Colloid Interface Sci. 2019, 44, 23–31. [Google Scholar] [CrossRef]
- Maestro, A.; Rio, E.; Drenckhan, W.; Langevin, D.; Salonen, A. Foams Stabilised by Mixtures of Nanoparticles and Oppositely Charged Surfactants: Relationship between Bubble Shrinkage and Foam Coarsening. Soft Matter 2014, 10, 6975–6983. [Google Scholar] [CrossRef]
- Parsa, M.; Trybala, A.; Malik, D.J.; Starov, V. Foam in Pharmaceutical and Medical Applications. Curr. Opin. Colloid Interface Sci. 2019, 44, 153–167. [Google Scholar] [CrossRef]
- Fameau, A.-L.; Fujii, S. Stimuli-Responsive Liquid Foams: From Design to Applications. Curr. Opin. Colloid Interface Sci. 2020, 50, 101380. [Google Scholar] [CrossRef]
- Denkov, N.; Tcholakova, S.; Politova-Brinkova, N. Physicochemical Control of Foam Properties. Curr. Opin. Colloid Interface Sci. 2020, 50, 101376. [Google Scholar] [CrossRef]
- Morrison, I.D. Ross’s Rule: Sydney Ross and the Phase Diagram. Colloids Surf. Physicochem. Eng. Asp. 1996, 118, 257–261. [Google Scholar] [CrossRef]
- Pugh, R.J. Bubble and Foam Chemistry; Cambridge University Press: Cambridge, UK, 2016; ISBN 978-1-107-09057-6. [Google Scholar]
- Burlatsky, S.F.; Atrazhev, V.V.; Dmitriev, D.V.; Sultanov, V.I.; Timokhina, E.N.; Ugolkova, E.A.; Tulyani, S.; Vincitore, A. Surface Tension Model for Surfactant Solutions at the Critical Micelle Concentration. J. Colloid Interface Sci. 2013, 393, 151–160. [Google Scholar] [CrossRef] [Green Version]
- Denkov, N.D.; Tcholakova, S.; Golemanov, K.; Ananthpadmanabhan, K.P.; Lips, A. The Role of Surfactant Type and Bubble Surface Mobility in Foam Rheology. Soft Matter 2009, 5, 3389–3408. [Google Scholar] [CrossRef] [Green Version]
- Monteux, C. Adsorption of Soluble Polymers at Liquid Interfaces and in Foams. Comptes Rendus Phys. 2014, 15, 775–785. [Google Scholar] [CrossRef]
- Wilson, A. Foams: Physics, Chemistry and Structure; Springer: Berlin/Heidelberg, Germany, 1989; ISBN 978-1-4471-3807-5. [Google Scholar]
- Briceño-Ahumada, Z.; Soltero-Martínez, J.F.A.; Castillo, R. Aqueous Foams and Emulsions Stabilized by Mixtures of Silica Nanoparticles and Surfactants: A State-of-the-Art Review. Chem. Eng. J. Adv. 2021, 7, 100116. [Google Scholar] [CrossRef]
- Petkova, R.; Tcholakova, S.; Denkov, N.D. Foaming and Foam Stability for Mixed Polymer–Surfactant Solutions: Effects of Surfactant Type and Polymer Charge. Langmuir 2012, 28, 4996–5009. [Google Scholar] [CrossRef] [PubMed]
- Miyazawa, T.; Itaya, M.; Burdeos, G.C.; Nakagawa, K.; Miyazawa, T. A Critical Review of the Use of Surfactant-Coated Nanoparticles in Nanomedicine and Food Nanotechnology. Int. J. Nanomed. 2021, 16, 3937–3999. [Google Scholar] [CrossRef]
- Heinz, H.; Pramanik, C.; Heinz, O.; Ding, Y.; Mishra, R.K.; Marchon, D.; Flatt, R.J.; Estrela-Lopis, I.; Llop, J.; Moya, S.; et al. Nanoparticle Decoration with Surfactants: Molecular Interactions, Assembly, and Applications. Surf. Sci. Rep. 2017, 72, 1–58. [Google Scholar] [CrossRef]
- Alexandrov, D.V.; Alexandrova, I.V. From Nucleation and Coarsening to Coalescence in Metastable Liquids. Philos. Trans. R. Soc. Math. Phys. Eng. Sci. 2020, 378, 20190247. [Google Scholar] [CrossRef] [Green Version]
- Dutta, A.K. Introductory Chapter: Surfactants in Household and Personal Care Formulations—An Overview; IntechOpen: London, UK, 2019; ISBN 978-1-78984-661-4. [Google Scholar]
- Deamer, D.W.; Pashley, R.M. Amphiphilic Components of the Murchison Carbonaceous Chondrite: Surface Properties and Membrane Formation. Orig. Life Evol. Biosphere J. Int. Soc. Study Orig. Life 1989, 19, 21–38. [Google Scholar] [CrossRef]
- Schramm, L.L.; Stasiuk, E.N.; Marangoni, D.G. 2 Surfactants and Their Applications. Annu. Rep. Sect. C Phys. Chem. 2003, 99, 3–48. [Google Scholar] [CrossRef]
- Micelle Formation by Surfactants. In Surfactants and Interfacial Phenomena; John Wiley & Sons, Ltd.: Hoboken, NJ, USA, 2004; pp. 105–177. ISBN 978-0-471-67056-8.
- Abel, S.; Waks, M.; Marchi, M.; Urbach, W. Effect of Surfactant Conformation on the Structures of Small Size Nonionic Reverse Micelles: A Molecular Dynamics Simulation Study. Langmuir 2006, 22, 9112–9120. [Google Scholar] [CrossRef]
- Cortés, H.; Hernández-Parra, H.; Bernal-Chávez, S.A.; Prado-Audelo, M.L.D.; Caballero-Florán, I.H.; Borbolla-Jiménez, F.V.; González-Torres, M.; Magaña, J.J.; Leyva-Gómez, G. Non-Ionic Surfactants for Stabilization of Polymeric Nanoparticles for Biomedical Uses. Materials 2021, 14, 3197. [Google Scholar] [CrossRef]
- Mashaghi, S.; Jadidi, T.; Koenderink, G.; Mashaghi, A. Lipid Nanotechnology. Int. J. Mol. Sci. 2013, 14, 4242–4282. [Google Scholar] [CrossRef]
- Katz, J.S.; Nolin, A.; Yezer, B.A.; Jordan, S. Dynamic Properties of Novel Excipient Suggest Mechanism for Improved Performance in Liquid Stabilization of Protein Biologics. Mol. Pharm. 2019, 16, 282–291. [Google Scholar] [CrossRef]
- McCoy, T.M.; Marlow, J.B.; Armstrong, A.J.; Clulow, A.J.; Garvey, C.J.; Manohar, M.; Darwish, T.A.; Boyd, B.J.; Routh, A.F.; Tabor, R.F. Spontaneous Self-Assembly of Thermoresponsive Vesicles Using a Zwitterionic and an Anionic Surfactant. Biomacromolecules 2020, 21, 4569–4576. [Google Scholar] [CrossRef]
- Clendennen, S.K.; Boaz, N.W. Chapter 14 - Betaine Amphoteric Surfactants—Synthesis, Properties, and Applications. In Biobased Surfactants, 2nd ed.; Hayes, D.G., Solaiman, D.K.Y., Ashby, R.D., Eds.; Academic Press: Cambridge, MA, USA; AOCS Press (Elsevier): Amsterdam, The Netherlands, 2019; pp. 447–469. ISBN 978-0-12-812705-6. [Google Scholar]
- Lin, W.; Kampf, N.; Klein, J. Designer Nanoparticles as Robust Superlubrication Vectors. ACS Nano 2020, 14, 7008–7017. [Google Scholar] [CrossRef]
- Nastasa, V.; Samaras, K.; Ampatzidis, C.; Karapantsios, T.D.; Trelles, M.A.; Moreno-Moraga, J.; Smarandache, A.; Pascu, M.L. Properties of Polidocanol Foam in View of Its Use in Sclerotherapy. Int. J. Pharm. 2015, 478, 588–596. [Google Scholar] [CrossRef]
- Raffa, P.; Wever, D.A.Z.; Picchioni, F.; Broekhuis, A.A. Polymeric Surfactants: Synthesis, Properties, and Links to Applications. Chem. Rev. 2015, 115, 8504–8563. [Google Scholar] [CrossRef]
- Uversky, V.N. Natively Unfolded Proteins: A Point Where Biology Waits for Physics. Protein Sci. 2002, 11, 739–756. [Google Scholar] [CrossRef] [Green Version]
- Wang, Y.; Zhang, Y.; Li, X.; Sun, M.; Wei, Z.; Wang, Y.; Gao, A.; Chen, D.; Zhao, X.; Feng, X. Exploring the Effects of Different Types of Surfactants on Zebrafish Embryos and Larvae. Sci. Rep. 2015, 5, 10107. [Google Scholar] [CrossRef] [Green Version]
- Lémery, E.; Briançon, S.; Chevalier, Y.; Bordes, C.; Oddos, T.; Gohier, A.; Bolzinger, M.-A. Skin Toxicity of Surfactants: Structure/Toxicity Relationships. Colloids Surf. Physicochem. Eng. Asp. 2015, 469, 166–179. [Google Scholar] [CrossRef]
- Hoc, D.; Haznar-Garbacz, D. Foams as Unique Drug Delivery Systems. Eur. J. Pharm. Biopharm. 2021, 167, 73–82. [Google Scholar] [CrossRef]
- AlYousef, Z.; Almobarky, M.; Schechter, D. Enhancing the Stability of Foam by the Use of Nanoparticles. Energy Fuels 2017, 31, 10620–10627. [Google Scholar] [CrossRef]
- Bayat, A.E.; Rajaei, K.; Junin, R. Assessing the Effects of Nanoparticle Type and Concentration on the Stability of CO2 Foams and the Performance in Enhanced Oil Recovery. Colloids Surf. Physicochem. Eng. Asp. 2016, 511, 222–231. [Google Scholar] [CrossRef]
- Arditty, S.; Schmitt, V.; Giermanska-Kahn, J.; Leal-Calderon, F. Materials Based on Solid-Stabilized Emulsions. J. Colloid Interface Sci. 2004, 275, 659–664. [Google Scholar] [CrossRef]
- Emile, J.; Werts, M.H.V.; Artzner, F.; Casanova, F.; Emile, O.; Navarro, J.R.G.; Meneau, F. Foam Films in the Presence of Functionalized Gold Nanoparticles. J. Colloid Interface Sci. 2012, 383, 124–129. [Google Scholar] [CrossRef]
- Zhang, Y.; Liu, Q.; Ye, H.; Yang, L.; Luo, D.; Peng, B. Nanoparticles as Foam Stabilizer: Mechanism, Control Parameters and Application in Foam Flooding for Enhanced Oil Recovery. J. Pet. Sci. Eng. 2021, 202, 108561. [Google Scholar] [CrossRef]
- Yekeen, N.; Padmanabhan, E.; Idris, A.K.; Ibad, S.M. Surfactant Adsorption Behaviors onto Shale from Malaysian Formations: Influence of Silicon Dioxide Nanoparticles, Surfactant Type, Temperature, Salinity and Shale Lithology. J. Pet. Sci. Eng. 2019, 179, 841–854. [Google Scholar] [CrossRef]
- Yang, K.; Li, S.; Zhang, K.; Wang, Y. Synergy of Hydrophilic Nanoparticle and Nonionic Surfactant on Stabilization of Carbon Dioxide-in-Brine Foams at Elevated Temperatures and Extreme Salinities. Fuel 2021, 288, 119624. [Google Scholar] [CrossRef]
- Binks, B.P. Particles as Surfactants—Similarities and Differences. Curr. Opin. Colloid Interface Sci. 2002, 7, 21–41. [Google Scholar] [CrossRef]
- Kaptay, G. Interfacial Criteria for Stabilization of Liquid Foams by Solid Particles. Colloids Surf. Physicochem. Eng. Asp. 2003, 230, 67–80. [Google Scholar] [CrossRef]
- Shojaei, M.J.; Méheust, Y.; Osman, A.; Grassia, P.; Shokri, N. Combined Effects of Nanoparticles and Surfactants upon Foam Stability. Chem. Eng. Sci. 2021, 238, 116601. [Google Scholar] [CrossRef]
- Srivastava, A.; Qiao, W.; Wu, Y.; Li, X.; Bao, L.; Liu, C. Effects of Silica Nanoparticles and Polymers on Foam Stability with Sodium Dodecylbenzene Sulfonate in Water–Liquid Paraffin Oil Emulsions at High Temperatures. J. Mol. Liq. 2017, 241, 1069–1078. [Google Scholar] [CrossRef]
- Ahmed, S.; Alameri, W.; Ahmed, W.W.; Khan, S.A. Rheological Behavior of ScCO2-Foam for Improved Hydrocarbon Recovery: Experimental and Deep Learning Approach. J. Pet. Sci. Eng. 2021, 203, 108646. [Google Scholar] [CrossRef]
- Zhang, W.; Shen, J.; Su, H.; Mu, G.; Sun, J.-H.; Tan, C.-P.; Liang, X.-J.; Ji, L.-N.; Mao, Z.-W. Co-Delivery of Cisplatin Prodrug and Chlorin E6 by Mesoporous Silica Nanoparticles for Chemo-Photodynamic Combination Therapy to Combat Drug Resistance. ACS Appl. Mater. Interfaces 2016, 8, 13332–13340. [Google Scholar] [CrossRef]
- Kumar, B.; Kulanthaivel, S.; Mondal, A.; Mishra, S.; Banerjee, B.; Bhaumik, A.; Banerjee, I.; Giri, S. Mesoporous Silica Nanoparticle Based Enzyme Responsive System for Colon Specific Drug Delivery through Guar Gum Capping. Colloids Surf. B Biointerfaces 2017, 150, 352–361. [Google Scholar] [CrossRef]
- Salatin, S.; Maleki Dizaj, S.; Yari Khosroushahi, A. Effect of the Surface Modification, Size, and Shape on Cellular Uptake of Nanoparticles. Cell Biol. Int. 2015, 39, 881–890. [Google Scholar] [CrossRef]
- Voigt, N.; Henrich-Noack, P.; Kockentiedt, S.; Hintz, W.; Tomas, J.; Sabel, B.A. Surfactants, Not Size or Zeta-Potential Influence Blood–Brain Barrier Passage of Polymeric Nanoparticles. Eur. J. Pharm. Biopharm. 2014, 87, 19–29. [Google Scholar] [CrossRef]
- Smarandache, A. Laser Beams Interaction with Polidocanol Foam: Molecular Background. Photomed. Laser Surg. 2012, 30, 262–267. [Google Scholar] [CrossRef]
- Drenckhan, W.; Saint-Jalmes, A. The Science of Foaming. Adv. Colloid Interface Sci. 2015, 222, 228–259. [Google Scholar] [CrossRef]
- Deike, L.; Melville, W.K.; Popinet, S. Air Entrainment and Bubble Statistics in Breaking Waves. J. Fluid Mech. 2016, 801, 91–129. [Google Scholar] [CrossRef] [Green Version]
- Manikantan, H.; Squires, T.M. Surfactant Dynamics: Hidden Variables Controlling Fluid Flows. J. Fluid Mech. 2020, 892. [Google Scholar] [CrossRef]
- Cavezzi, A.; Tessari, L. Foam Sclerotherapy Techniques: Different Gases and Methods of Preparation, Catheter versus Direct Injection. Phlebology 2009, 24, 247–251. [Google Scholar] [CrossRef]
- Wu, C.; Nesset, K.; Masliyah, J.; Xu, Z. Generation and Characterization of Submicron Size Bubbles. Adv. Colloid Interface Sci. 2012, 179–182, 123–132. [Google Scholar] [CrossRef]
- Blake, J.R.; Ohl, C.; Kurz, T.; Geisler, R.; Lindau, O.; Lauterborn, W. Bubble Dynamics, Shock Waves and Sonoluminescence. Philos. Trans. R. Soc. Lond. Ser. Math. Phys. Eng. Sci. 1999, 357, 269–294. [Google Scholar] [CrossRef]
- Tanaka, Y.; Kitabata, T.; Nasu, K.; Watanabe, S.; Sakata, A. Suppression of Cavitation Surge in Turbopump with Inducer by Reduced-Diameter Suction Pipe with Swirl Brake. J. Fluids Eng. 2021. [Google Scholar] [CrossRef]
- Zwaan, E.; Le Gac, S.; Tsuji, K.; Ohl, C.-D. Controlled Cavitation in Microfluidic Systems. Phys. Rev. Lett. 2007, 98, 254501. [Google Scholar] [CrossRef] [Green Version]
- Sankin, G.N.; Yuan, F.; Zhong, P. Pulsating Tandem Microbubble for Localized and Directional Single-Cell Membrane Poration. Phys. Rev. Lett. 2010, 105, 078101. [Google Scholar] [CrossRef] [Green Version]
- Peruzzi, G.; Sinibaldi, G.; Silvani, G.; Ruocco, G.; Casciola, C.M. Perspectives on Cavitation Enhanced Endothelial Layer Permeability. Colloids Surf. B Biointerfaces 2018, 168, 83–93. [Google Scholar] [CrossRef] [PubMed]
- Dinache, A.; Boni, M.; Alexandru, T.; Radu, E.; Stoicu, A.; Andrei, I.R.; Staicu, A.; Liggieri, L.; Nastasa, V.; Pascu, M.L.; et al. Surface Properties of Vancomycin after Interaction with Laser Beams. Colloids Surf. Physicochem. Eng. Asp. 2015, 480, 328–335. [Google Scholar] [CrossRef]
- Paltauf, G.; Dyer, P.E. Photomechanical Processes and Effects in Ablation. Chem. Rev. 2003, 103, 487–518. [Google Scholar] [CrossRef] [PubMed]
- Kikuchi, K.; Ioka, A.; Oku, T.; Tanaka, Y.; Saihara, Y.; Ogumi, Z. Concentration Determination of Oxygen Nanobubbles in Electrolyzed Water. J. Colloid Interface Sci. 2009, 329, 306–309. [Google Scholar] [CrossRef]
- Bhushan, B.; Pan, Y.; Daniels, S. AFM Characterization of Nanobubble Formation and Slip Condition in Oxygenated and Electrokinetically Altered Fluids. J. Colloid Interface Sci. 2013, 392, 105–116. [Google Scholar] [CrossRef]
- Liu, Y.; Pan, L.; Liu, H.; Chen, T.; Yin, S.; Liu, M. Effects of Magnetic Field on Water Electrolysis Using Foam Electrodes. Int. J. Hydrog. Energy 2019, 44, 1352–1358. [Google Scholar] [CrossRef]
- Matis, K.A.; Peleka, E.N. Alternative Flotation Techniques for Wastewater Treatment: Focus on Electroflotation. Sep. Sci. Technol. 2010, 45, 2465–2474. [Google Scholar] [CrossRef]
- Swart, C.W.; Dithebe, K.; Pohl, C.H.; Swart, H.C.; Coetsee, E.; van Wyk, P.W.; Swarts, J.C.; Lodolo, E.J.; Kock, J.L. Gas Bubble Formation in the Cytoplasm of a Fermenting Yeast. Fems Yeast Res. 2012, 12, 867–869. [Google Scholar] [CrossRef]
- Blasco, L.; Viñas, M.; Villa, T.G. Proteins Influencing Foam Formation in Wine and Beer: The Role of Yeast. Int. Microbiol. Off. J. Span. Soc. Microbiol. 2011, 14, 61–71. [Google Scholar] [CrossRef] [Green Version]
- Kemp, B.; Condé, B.; Jégou, S.; Howell, K.; Vasserot, Y.; Marchal, R. Chemical Compounds and Mechanisms Involved in the Formation and Stabilization of Foam in Sparkling Wines. Crit. Rev. Food Sci. Nutr. 2019, 59, 2072–2094. [Google Scholar] [CrossRef]
- Pérez-Magariño, S.; Martínez-Lapuente, L.; Bueno-Herrera, M.; Ortega-Heras, M.; Guadalupe, Z.; Ayestarán, B. Use of Commercial Dry Yeast Products Rich in Mannoproteins for White and Rosé Sparkling Wine Elaboration. J. Agric. Food Chem. 2015, 63, 5670–5681. [Google Scholar] [CrossRef]
- Brey, S.E.; Bryce, J.H.; Stewart, G.G. The Loss of Hydrophobic Polypeptides during Fermentation and Conditioning of High Gravity and Low Gravity Brewed Beer. J. Inst. Brew. 2002, 108, 424–433. [Google Scholar] [CrossRef]
- Fameau, A.-L.; Carl, A.; Saint-Jalmes, A.; von Klitzing, R. Responsive Aqueous Foams. ChemPhysChem 2015, 16, 66–75. [Google Scholar] [CrossRef]
- Ritacco, H.A. Complexity and Self-Organized Criticality in Liquid Foams. A Short Review. Adv. Colloid Interface Sci. 2020, 285, 102282. [Google Scholar] [CrossRef] [PubMed]
- Xiang, W.; Preisig, N.; Laine, C.; Hjelt, T.; Tardy, B.L.; Stubenrauch, C.; Rojas, O.J. Surface Activity and Foaming Capacity of Aggregates Formed between an Anionic Surfactant and Non-Cellulosics Leached from Wood Fibers. Biomacromolecules 2019, 20, 2286–2294. [Google Scholar] [CrossRef]
- Nypelö, T.; Laine, C.; Aoki, M.; Tammelin, T.; Henniges, U. Etherification of Wood-Based Hemicelluloses for Interfacial Activity. Biomacromolecules 2016, 17, 1894–1901. [Google Scholar] [CrossRef]
- He, Y.; Li, S.; Zhou, L.; Wei, C.; Yu, C.; Chen, Y.; Liu, H. Cellulose Nanofibrils-Based Hybrid Foam Generated from Pickering Emulsion toward High-Performance Microwave Absorption. Carbohydr. Polym. 2021, 255, 117333. [Google Scholar] [CrossRef] [PubMed]
- Zhao, W.; Hou, Q.; Wang, X. The Influence of Gas Diffusion Mechanisms on Foam Stability for Foam Forming of Paper Products. BioResources 2019, 14, 9893–9903. [Google Scholar]
- Yoon, I.-H.; Yoon, S.B.; Sihn, Y.; Choi, M.-S.; Jung, C.-H.; Choi, W.-K. Stabilizing Decontamination Foam Using Surface-Modified Silica Nanoparticles Containing Chemical Reagent: Foam Stability, Structures, and Dispersion Properties. RSC Adv. 2021, 11, 1841–1849. [Google Scholar] [CrossRef]
- Gunashekar, S.; Abu-Zahra, N. Characterization of Functionalized Polyurethane Foam for Lead Ion Removal from Water. Int. J. Polym. Sci. 2014, 2014, e570309. [Google Scholar] [CrossRef] [Green Version]
- Seyam, O.A.; Elshimy, A.S.; Niazi, G.E.M.; ElGhareeb, M. Ultrasound-Guided Percutaneous Injection of Foam Sclerotherapy in Management of Lower Limb Varicose Veins (Pilot Study). Egypt. J. Radiol. Nucl. Med. 2020, 51, 175. [Google Scholar] [CrossRef]
- Jeong, S.; Kim, S.; Choi, Y.; Jung, H.N.; Lee, K.; Park, M.H. Development of Glycerol-Rose Bengal-Polidocanol (GRP) Foam for Enhanced Sclerosis of a Cyst for Cystic Diseases. PLoS ONE 2021, 16, e0244635. [Google Scholar] [CrossRef] [PubMed]
- Moreno-Moraga, J.; Pascu, M.L.; Alcolea, J.M.; Smarandache, A.; Royo, J.; David, F.; Trelles, M.A. Effects of 1064-Nm Nd:YAG Long-Pulse Laser on Polidocanol Microfoam Injected for Varicose Vein Treatment: A Controlled Observational Study of 404 Legs, after 5-Year-Long Treatment. Lasers Med. Sci. 2019, 34, 1325–1332. [Google Scholar] [CrossRef] [PubMed]
- Smarandache, A.; Moreno, J.; Staicu, A.; Trelles, M.; Pascu, M.-L. Applications of Polidocanol in Varicose Vein Treatment Assisted by Exposure to Nd:YAG Laser Radiation. Nd YAG Laser 2019. [Google Scholar]
- Star, P.; Connor, D.E.; Parsi, K. Novel Developments in Foam Sclerotherapy: Focus on Varithena® (Polidocanol Endovenous Microfoam) in the Management of Varicose Veins. Phlebology 2018, 33, 150–162. [Google Scholar] [CrossRef]
- Smarandache, A.; Staicu, A.; Nastasa, V.; Moreno-Moraga, J.; Royo de la Torre, J.; Trelles, M.; Pascu, M.-L. Physical Properties of Laser Irradiated Sclerosing Foams. Romanian Rep. Phys. 2015, 67, 1480–1490. [Google Scholar]
- Smarandache, A.; Trelles, M.; Pascu, M.L. Measurement of the Modifications of Polidocanol Absorption Spectra after Exposure to NIR Laser Radiation. J. Optoelectron. Adv. Mater. 2010, 12, 1942–1945. [Google Scholar]
- Hsu, S.L. Raman Spectroscopic Studies of Polymer Structure. In Raman Scattering in Materials Science; Weber, W.H., Merlin, R., Eds.; Springer Series in Materials Science; Springer: Berlin/Heidelberg, Germany, 2000; pp. 369–445. ISBN 978-3-662-04221-2. [Google Scholar]
- Zhao, D.; Zhang, L.; Siebold, D.; DeArmond, D.; Alvarez, N.T.; Shanov, V.N.; Heineman, W.R. Electrochemical Studies of Three Dimensional Graphene Foam as an Electrode Material. Electroanalysis 2017, 29, 1506–1512. [Google Scholar] [CrossRef]
- Liu, J.; Zhang, L.; Wu, H.B.; Lin, J.; Shen, Z.; Lou, X.W.D. High-Performance Flexible Asymmetric Supercapacitors Based on a New Graphene Foam/Carbon Nanotube Hybrid Film. Energy Environ. Sci. 2014, 7, 3709–3719. [Google Scholar] [CrossRef]
- Barik, T.K.; Bandyopadhyay, P.; Roy, A. Probing Internal Stress and Crystallinity in Wet Foam via Raman Spectroscopy. Int. J. Mod. Phys. B 2009, 23, 3913–3924. [Google Scholar] [CrossRef] [Green Version]
- Goutev, N.; Nickolov, Z.S. Raman Studies of Three-Dimensional Foam. Phys. Rev. E 1996, 54, 1725–1733. [Google Scholar] [CrossRef]
- Durian, D.J.; Weitz, D.A.; Pine, D.J. Multiple Light-Scattering Probes of Foam Structure and Dynamics. Science 1991, 252, 686–688. [Google Scholar] [CrossRef]
- Amer, M.S. (Ed.) Raman Spectroscopy for Soft Matter Applications; John Wiley & Sons, Inc.: Hoboken, NJ, USA, 2009; ISBN 978-0-470-47599-7. [Google Scholar]
- Vera, M.U.; Saint-Jalmes, A.; Durian, D.J. Scattering Optics of Foam. Appl. Opt. 2001, 40, 4210–4214. [Google Scholar] [CrossRef] [Green Version]
- Zhang, C.; Reufer, M.; Gaudino, D.; Scheffold, F. Improved Diffusing Wave Spectroscopy Based on the Automatized Determination of the Optical Transport and Absorption Mean Free Path. Korea-Aust. Rheol. J. 2017, 29, 241–247. [Google Scholar] [CrossRef] [Green Version]
- Höhler, R.; Cohen-Addad, S.; Durian, D.J. Multiple Light Scattering as a Probe of Foams and Emulsions. Curr. Opin. Colloid Interface Sci. 2014, 19, 242–252. [Google Scholar] [CrossRef]
- Kaplan, P.D.; Dinsmore, A.D.; Yodh, A.G.; Pine, D.J. Diffuse-Transmission Spectroscopy: A Structural Probe of Opaque Colloidal Mixtures. Phys. Rev. E 1994, 50, 4827–4835. [Google Scholar] [CrossRef]
- Cantat, I. Foams: Structure and Dynamics; First English edition; Oxford University Press: New York, NY, USA, 2013; ISBN 978-0-19-966289-0. [Google Scholar]
- Cohen-Addad, S.; Höhler, R. Bubble Dynamics Relaxation in Aqueous Foam Probed by Multispeckle Diffusing-Wave Spectroscopy. Phys. Rev. Lett. 2001, 86, 4700–4703. [Google Scholar] [CrossRef]
- Earnshaw, J.C.; Jaafar, A.H. Diffusing-Wave Spectroscopy of a Flowing Foam. Phys. Rev. E 1994, 49, 5408–5411. [Google Scholar] [CrossRef]
- Höhler, R.; Cohen-Addad, S.; Hoballah, H. Periodic Nonlinear Bubble Motion in Aqueous Foam under Oscillating Shear Strain. Phys. Rev. Lett. 1997, 79, 1154–1157. [Google Scholar] [CrossRef]
- Gopal, A.D.; Durian, D.J. Shear-Induced “Melting” of an Aqueous Foam. J. Colloid Interface Sci. 1999, 213, 169–178. [Google Scholar] [CrossRef]
- Crassous, J.; Saint-Jalmes, A. Probing the Dynamics of Particles in an Aging Dispersion Using Diffusing Wave Spectroscopy. Soft Matter 2012, 8, 7683. [Google Scholar] [CrossRef]
- Marze, S.; Langevin, D.; Saint-Jalmes, A. Aqueous Foam Slip and Shear Regimes Determined by Rheometry and Multiple Light Scattering. J. Rheol. 2008, 52, 1091–1111. [Google Scholar] [CrossRef]
- Isert, N.; Maret, G.; Aegerter, C.M. Studying Foam Dynamics in Levitated, Dry and Wet Foams Using Diffusing Wave Spectroscopy. Colloids Surf. Physicochem. Eng. Asp. 2015, 473, 40–45. [Google Scholar] [CrossRef] [Green Version]
- Chang, Q. Emulsion, Foam, and Gel. In Colloid and Interface Chemistry for Water Quality Control; Elsevier: Amsterdam, The Netherlands, 2016; pp. 227–245. ISBN 978-0-12-809315-3. [Google Scholar]
- McClements, D.J. Nanoemulsions versus Microemulsions: Terminology, Differences, and Similarities. Soft Matter 2012, 8, 1719–1729. [Google Scholar] [CrossRef]
- Miller, R. Emulsifiers: Types and Uses. In Encyclopedia of Food and Health; Elsevier: Amsterdam, The Netherlands, 2016; pp. 498–502. ISBN 978-0-12-384953-3. [Google Scholar]
- Wong, S.F.; Lim, J.S.; Dol, S.S. Crude Oil Emulsion: A Review on Formation, Classification and Stability of Water-in-Oil Emulsions. J. Pet. Sci. Eng. 2015, 135, 498–504. [Google Scholar] [CrossRef]
- Mason, T.G.; Wilking, J.N.; Meleson, K.; Chang, C.B.; Graves, S.M. Nanoemulsions: Formation, Structure, and Physical Properties. J. Phys. Condens. Matter 2006, 18, R635. [Google Scholar] [CrossRef] [Green Version]
- Anton, N.; Vandamme, T.F. Nano-Emulsions and Micro-Emulsions: Clarifications of the Critical Differences. Pharm. Res. 2011, 28, 978–985. [Google Scholar] [CrossRef]
- Schulman, J.H.; Montagne, J.B. Formation of Microemulsion by Amino Alkyl Alcohols. Ann. N. Y. Acad. Sci. 1961, 92, 366–371. [Google Scholar] [CrossRef]
- Calvo, P.; Vila-Jato, J.L.; Alonso, M.J. Comparative in Vitro Evaluation of Several Colloidal Systems, Nanoparticles, Nanocapsules, and Nanoemulsions, as Ocular Drug Carriers. J. Pharm. Sci. 1996, 85, 530–536. [Google Scholar] [CrossRef]
- Gupta, A.; Eral, H.B.; Hatton, T.A.; Doyle, P.S. Nanoemulsions: Formation, Properties and Applications. Soft Matter 2016, 12, 2826–2841. [Google Scholar] [CrossRef] [Green Version]
- Gupta, A. Nanoemulsions. In Nanoparticles for Biomedical Applications; Elsevier: Amsterdam, The Netherlands, 2020; pp. 371–384. ISBN 978-0-12-816662-8. [Google Scholar]
- Delmas, T.; Piraux, H.; Couffin, A.-C.; Texier, I.; Vinet, F.; Poulin, P.; Cates, M.E.; Bibette, J. How To Prepare and Stabilize Very Small Nanoemulsions. Langmuir 2011, 27, 1683–1692. [Google Scholar] [CrossRef]
- Solans, C.; Izquierdo, P.; Nolla, J.; Azemar, N.; Garciacelma, M. Nano-Emulsions. Curr. Opin. Colloid Interface Sci. 2005, 10, 102–110. [Google Scholar] [CrossRef]
- Winsor, P.A. Hydrotropy, Solubilisation and Related Emulsification Processes. Trans. Faraday Soc. 1948, 44, 376. [Google Scholar] [CrossRef]
- Ita, K. Microemulsions. In Transdermal Drug Delivery; Elsevier: Amsterdam, The Netherlands, 2020; pp. 97–122. ISBN 978-0-12-822550-9. [Google Scholar]
- Callender, S.P.; Mathews, J.A.; Kobernyk, K.; Wettig, S.D. Microemulsion Utility in Pharmaceuticals: Implications for Multi-Drug Delivery. Int. J. Pharm. 2017, 526, 425–442. [Google Scholar] [CrossRef]
- Whitby, C.P. Nanoparticles at Fluid Interfaces: From Surface Properties to Biomedical Applications. In Comprehensive Nanoscience and Nanotechnology; Elsevier: Amsterdam, The Netherlands, 2019; pp. 127–146. ISBN 978-0-12-812296-9. [Google Scholar]
- Chevalier, Y.; Bolzinger, M.-A. Emulsions Stabilized with Solid Nanoparticles: Pickering Emulsions. Colloids Surf. Physicochem. Eng. Asp. 2013, 439, 23–34. [Google Scholar] [CrossRef]
- Nakama, Y. Surfactants. In Cosmetic Science and Technology; Elsevier: Amsterdam, The Netherlands, 2017; pp. 231–244. ISBN 978-0-12-802005-0. [Google Scholar]
- Holmberg, K. Surfactants. In Ullmann’s Encyclopedia of Industrial Chemistry; Wiley-VCH Verlag GmbH & Co. KGaA: Weinheim, Germany, 2019; pp. 1–56. ISBN 978-3-527-30673-2. [Google Scholar]
- Bancroft, W.D. The Theory of Emulsification, V.J. Phys. Chem. 1913, 17, 501–519. [Google Scholar] [CrossRef] [Green Version]
- Ali, A.; Ansari, V.; Ahmad, U.; Akhtar, J.; Jahan, A. Nanoemulsion: An Advanced Vehicle For Efficient Drug Delivery. Drug Res. 2017, 67, 617–631. [Google Scholar] [CrossRef]
- Yang, Y.; Fang, Z.; Chen, X.; Zhang, W.; Xie, Y.; Chen, Y.; Liu, Z.; Yuan, W. An Overview of Pickering Emulsions: Solid-Particle Materials, Classification, Morphology, and Applications. Front. Pharmacol. 2017, 8, 287. [Google Scholar] [CrossRef] [Green Version]
- Li, X.; Li, H.; Xiao, Q.; Wang, L.; Wang, M.; Lu, X.; York, P.; Shi, S.; Zhang, J. Two-Way Effects of Surfactants on Pickering Emulsions Stabilized by the Self-Assembled Microcrystals of α-Cyclodextrin and Oil. Phys. Chem. Chem. Phys. 2014, 16, 14059–14069. [Google Scholar] [CrossRef]
- Zhao, Z.; Wang, W.; Xiao, J.; Chen, Y.; Cao, Y. Interfacial Engineering of Pickering Emulsion Co-Stabilized by Zein Nanoparticles and Tween 20: Effects of the Particle Size on the Interfacial Concentration of Gallic Acid and the Oxidative Stability. Nanomaterials 2020, 10, 1068. [Google Scholar] [CrossRef]
- Rosi Cappellani, M.; Perinelli, D.R.; Pescosolido, L.; Schoubben, A.; Cespi, M.; Cossi, R.; Blasi, P. Injectable Nanoemulsions Prepared by High Pressure Homogenization: Processing, Sterilization, and Size Evolution. Appl. Nanosci. 2018, 8, 1483–1491. [Google Scholar] [CrossRef]
- Dalmazzone, C. The Mechanical Generation of Emulsions. Lubr. Sci. 2005, 17, 197–237. [Google Scholar] [CrossRef]
- Dinache, A.; Smarandache, A.; Andrei, I.R.; Urzica, I.; Nichita, C.; Boni, M.; Nastasa, V.; Pascu, M.L. Laser Assisted Generation of Micro/Nanosize Emulsions. Colloids Surf. Physicochem. Eng. Asp. 2019, 577, 265–273. [Google Scholar] [CrossRef]
- Rocca, S.; García-Celma, M.J.; Calderó, G.; Pons, R.; Solans, C.; Stébé, M.J. Hydrophilic Model Drug Delivery from Concentrated Reverse Emulsions. Langmuir 1998, 14, 6840–6845. [Google Scholar] [CrossRef]
- Singh, Y.; Meher, J.G.; Raval, K.; Khan, F.A.; Chaurasia, M.; Jain, N.K.; Chourasia, M.K. Nanoemulsion: Concepts, Development and Applications in Drug Delivery. J. Controlled Release 2017, 252, 28–49. [Google Scholar] [CrossRef]
- Sánchez-López, E.; Guerra, M.; Dias-Ferreira, J.; Lopez-Machado, A.; Ettcheto, M.; Cano, A.; Espina, M.; Camins, A.; Garcia, M.L.; Souto, E.B. Current Applications of Nanoemulsions in Cancer Therapeutics. Nanomaterials 2019, 9, 821. [Google Scholar] [CrossRef] [Green Version]
- Jafari, S.M.; He, Y.; Bhandari, B. Optimization of Nano-Emulsions Production by Microfluidization. Eur. Food Res. Technol. 2007, 225, 733–741. [Google Scholar] [CrossRef]
- Piacentini, E.; Drioli, E.; Giorno, L. Membrane Emulsification Technology: Twenty-Five Years of Inventions and Research through Patent Survey. J. Membr. Sci. 2014, 468, 410–422. [Google Scholar] [CrossRef]
- Ren, G.; Sun, Z.; Wang, Z.; Zheng, X.; Xu, Z.; Sun, D. Nanoemulsion Formation by the Phase Inversion Temperature Method Using Polyoxypropylene Surfactants. J. Colloid Interface Sci. 2019, 540, 177–184. [Google Scholar] [CrossRef]
- Celis, M.-T.; Garcia-Rubio, L.H. Continuous Spectroscopy Characterization of Emulsions. J. Dispers. Sci. Technol. 2002, 23, 293–299. [Google Scholar] [CrossRef]
- Celis, M.; Garcia-Rubio, L.H. Characterization of Emulsions: A Systematic Spectroscopy Study. J. Dispers. Sci. Technol. 2008, 29, 20–26. [Google Scholar] [CrossRef]
- Dinache, A.; Tozar, T.; Smarandache, A.; Andrei, I.R.; Nistorescu, S.; Nastasa, V.; Staicu, A.; Pascu, M.-L.; Romanitan, M.O. Spectroscopic Characterization of Emulsions Generated with a New Laser-Assisted Device. Molecules 2020, 25, 1729. [Google Scholar] [CrossRef]
- Song, M.-G.; Cho, S.-H.; Kim, J.-Y.; Kim, J.-D. Novel Evaluation Method for the Water- in- Oil (W/O) Emulsion Stability by Turbidity Ratio Measurements. Korean J. Chem. Eng. 2002, 19, 425–430. [Google Scholar] [CrossRef]
- Alexandraki, S.; Leontidis, E. Towards the Systematic Design of Multilayer O/W Emulsions with Tannic Acid as an Interfacial Antioxidant. RSC Adv. 2021, 11, 23616–23626. [Google Scholar] [CrossRef]
- Shinoda, R.; Uchimura, T. Evaluating the Creaming of an Emulsion via Mass Spectrometry and UV–Vis Spectrophotometry. ACS Omega 2018, 3, 13752–13756. [Google Scholar] [CrossRef]
- França De Sá, S.; Viana, C.; Ferreira, J.L. Tracing Poly(Vinyl Acetate) Emulsions by Infrared and Raman Spectroscopies: Identification of Spectral Markers. Polymers 2021, 13, 3609. [Google Scholar] [CrossRef]
- Kiefer, J.; Frank, K.; Zehentbauer, F.; Schuchmann, H. Infrared Spectroscopy of Bilberry Extract Water-in-Oil Emulsions: Sensing the Water-Oil Interface. Biosensors 2016, 6, 13. [Google Scholar] [CrossRef] [Green Version]
- Kiefer, J.; Frank, K.; Schuchmann, H.P. Attenuated Total Reflection Infrared (ATR-IR) Spectroscopy of a Water-in-Oil Emulsion. Appl. Spectrosc. 2011, 65, 1024–1028. [Google Scholar] [CrossRef]
- Masmoudi, H.; Dréau, Y.L.; Piccerelle, P.; Kister, J. The Evaluation of Cosmetic and Pharmaceutical Emulsions Aging Process Using Classical Techniques and a New Method: FTIR. Int. J. Pharm. 2005, 289, 117–131. [Google Scholar] [CrossRef]
- Zhou, G.-W.; Li, G.-Z.; Chen, W.-J. Fourier Transform Infrared Investigation on Water States and the Conformations of Aerosol-OT in Reverse Microemulsions. Langmuir 2002, 18, 4566–4571. [Google Scholar] [CrossRef]
- Sechler, T.D.; DelSole, E.M.; Deák, J.C. Measuring Properties of Interfacial and Bulk Water Regions in a Reverse Micelle with IR Spectroscopy: A Volumetric Analysis of the Inhomogeneously Broadened OH Band. J. Colloid Interface Sci. 2010, 346, 391–397. [Google Scholar] [CrossRef]
- Nickolov, Z.S.; Paruchuri, V.; Shah, D.O.; Miller, J.D. FTIR–ATR Studies of Water Structure in Reverse Micelles during the Synthesis of Oxalate Precursor Nanoparticles. Colloids Surf. Physicochem. Eng. Asp. 2004, 232, 93–99. [Google Scholar] [CrossRef]
- Jorgensen, L.; Weert, M.V.D.; Vermehren, C.; Bjerregaard, S.; Frokjaer, S. Probing Structural Changes of Proteins Incorporated into Water-in-Oil Emulsions. J. Pharm. Sci. 2004, 93, 1847–1859. [Google Scholar] [CrossRef]
- Thaiphanit, S.; Anprung, P. Physicochemical and Emulsion Properties of Edible Protein Concentrate from Coconut (Cocos Nucifera L.) Processing by-Products and the Influence of Heat Treatment. Food Hydrocoll. 2016, 52, 756–765. [Google Scholar] [CrossRef]
- Whittinghill, J.M.; Norton, J.; Proctor, A. A Fourier Transform Infrared Spectroscopy Study of the Effect of Temperature on Soy Lecithin-Stabilized Emulsions. J. Am. Oil Chem. Soc. 1999, 76, 1393–1398. [Google Scholar] [CrossRef]
- Rajak, V.K.; Singh, I.; Kumar, A.; Mandal, A. Optimization of Separation of Oil from Oil-in-Water Emulsion by Demulsification Using Different Demulsifiers. Pet. Sci. Technol. 2016, 34, 1026–1032. [Google Scholar] [CrossRef]
- Marze, S.; Choimet, M.; Foucat, L. In Vitro Digestion of Emulsions: Diffusion and Particle Size Distribution Using Diffusing Wave Spectroscopy and Diffusion Using Nuclear Magnetic Resonance. Soft Matter 2012, 8, 10994. [Google Scholar] [CrossRef]
- Reufer, M.; Machado, A.H.E.; Niederquell, A.; Bohnenblust, K.; Müller, B.; Völker, A.C.; Kuentz, M. Introducing Diffusing Wave Spectroscopy as a Process Analytical Tool for Pharmaceutical Emulsion Manufacturing. J. Pharm. Sci. 2014, 103, 3902–3913. [Google Scholar] [CrossRef]
- Niederquell, A.; Machado, A.H.E.; Kuentz, M. A Diffusing Wave Spectroscopy Study of Pharmaceutical Emulsions for Physical Stability Assessment. Int. J. Pharm. 2017, 530, 213–223. [Google Scholar] [CrossRef]
- Lorusso, V.; Orsi, D.; Salerni, F.; Liggieri, L.; Ravera, F.; McMillin, R.; Ferri, J.; Cristofolini, L. Recent Developments in Emulsion Characterization: Diffusing Wave Spectroscopy beyond Average Values. Adv. Colloid Interface Sci. 2021, 288, 102341. [Google Scholar] [CrossRef]
- Kolman, M.; Boland, G.; Amin, S. Exploring the Utility of Diffusing Wave Spectroscopy (DWS) as a Novel Tool for Early Detection of Stability Issues in Cosmetic Emulsions. Cosmetics 2021, 8, 99. [Google Scholar] [CrossRef]
- Hu, Y.-T.; Ting, Y.; Hu, J.-Y.; Hsieh, S.-C. Techniques and Methods to Study Functional Characteristics of Emulsion Systems. J. Food Drug Anal. 2017, 25, 16–26. [Google Scholar] [CrossRef]
- Aizawa, H. Novel Pragmatic Turbidimetric Data Analysis Method for Evaluating the Stability of Emulsions. Int. J. Food Prop. 2014, 17, 1264–1274. [Google Scholar] [CrossRef]
- Swinehart, D.F. The Beer-Lambert Law. J. Chem. Educ. 1962, 39, 333. [Google Scholar] [CrossRef]
- NicDaéid, N. Forensic Sciences. Systematic Drug Identification. In Encyclopedia of Analytical Science, 3rd ed.; Worsfold, P., Poole, C., Townshend, A., Miró, M., Eds.; Elsevier: Amsterdam, The Netherlands, 2019; pp. 75–80. ISBN 978-0-08-101984-9. [Google Scholar]
- Kafle, B.P. Chemical Analysis and Material Characterization by Spectrophotometry; Elsevier: Amsterdam, The Netherlands, 2020; ISBN 978-0-12-814866-2. [Google Scholar]
- Alcaraz de la Osa, R.; Iparragirre, I.; Ortiz, D.; Saiz, J.M. The Extended Kubelka–Munk Theory and Its Application to Spectroscopy. ChemTexts 2019, 6, 2. [Google Scholar] [CrossRef]
- Springsteen, A. Standards for the Measurement of Diffuse Reflectance – an Overview of Available Materials and Measurement Laboratories. Anal. Chim. Acta 1999, 380, 379–390. [Google Scholar] [CrossRef]
- Aziz, A.; Hailes, H.C.; Ward, J.M.; Evans, J.R.G. Long-Term Stabilization of Reflective Foams in Sea Water. RSC Adv. 2014, 4, 53028–53036. [Google Scholar] [CrossRef]
- Larkin, P. Infrared and Raman Spectroscopy: Principles and Spectral Interpretation; Elsevier: Amsterdam, The Netherlands, 2011; ISBN 9780123870186. [Google Scholar]
- Schrader, B. Infrared and Raman Spectroscopy: Methods and Applications; VCH: Weinheim, Germany, 2008; ISBN 3-527-26446-9. [Google Scholar]
- Dutta, A. Chapter 4—Fourier Transform Infrared Spectroscopy. In Spectroscopic Methods for Nanomaterials Characterization; Thomas, S., Thomas, R., Zachariah, A.K., Mishra, R.K., Eds.; Micro and Nano Technologies; Elsevier: Amsterdam, The Netherlands, 2017; pp. 73–93. ISBN 978-0-323-46140-5. [Google Scholar]
- Hashimoto, K.; Badarla, V.R.; Kawai, A.; Ideguchi, T. Complementary Vibrational Spectroscopy. Nat. Commun. 2019, 10, 4411. [Google Scholar] [CrossRef] [Green Version]
- Reignier, J.; Méchin, F.; Sarbu, A. Chemical Gradients in PIR Foams as Probed by ATR-FTIR Analysis and Consequences on Fire Resistance. Polym. Test. 2021, 93, 106972. [Google Scholar] [CrossRef]
- Maciejewski, K.; Chomicz-Kowalska, A. Foaming Performance and FTIR Spectrometric Analysis of Foamed Bituminous Binders Intended for Surface Courses. Materials 2021, 14, 2055. [Google Scholar] [CrossRef]
- Das, R.S.; Agrawal, Y.K. Raman Spectroscopy: Recent Advancements, Techniques and Applications. Vib. Spectrosc. 2011, 57, 163–176. [Google Scholar] [CrossRef]
- Kekkonen, J.; Talala, T.; Nissinen, J.; Nissinen, I. On the Spectral Quality of Time-Resolved CMOS SPAD-Based Raman Spectroscopy With High Fluorescence Backgrounds. IEEE Sens. J. 2020, 20, 4635–4645. [Google Scholar] [CrossRef] [Green Version]
- Pine, D.J.; Weitz, D.A.; Chaikin, P.M.; Herbolzheimer, E. Diffusing Wave Spectroscopy. Phys. Rev. Lett. 1988, 60, 1134–1137. [Google Scholar] [CrossRef] [Green Version]
- Pine, D.J.; Weitz, D.A.; Zhu, J.X.; Herbolzheimer, E. Diffusing-Wave Spectroscopy: Dynamic Light Scattering in the Multiple Scattering Limit. J. Phys. 1990, 51, 2101–2127. [Google Scholar] [CrossRef] [Green Version]
- Weitz, D.A.; Zhu, J.X.; Durian, D.J.; Gang, H.; Pine, D.J. Diffusing-Wave Spectroscopy: The Technique and Some Applications. Phys. Scr. 1993, T49B, 610–621. [Google Scholar] [CrossRef]
- Kaplan, P.D.; Kao, M.H.; Yodh, A.G.; Pine, D.J. Geometric Constraints for the Design of Diffusing-Wave Spectroscopy Experiments. Appl. Opt. 1993, 32, 3828–3836. [Google Scholar] [CrossRef]
- Maret, G.; Wolf, P.E. Multiple Light Scattering from Disordered Media. The Effect of Brownian Motion of Scatterers. Z. Für Phys. B Condens. Matter 1987, 65, 409–413. [Google Scholar] [CrossRef]
- Durian, D. Accuracy of Diffusing-Wave Spectroscopy Theories. Phys. Rev. E 1995, 51, 3350–3358. [Google Scholar] [CrossRef] [PubMed] [Green Version]
- Stephen, M.J. Temporal Fluctuations in Wave Propagation in Random Media. Phys. Rev. B 1988, 37, 1–5. [Google Scholar] [CrossRef] [PubMed]
- Romer, S.; Scheffold, F.; Schurtenberger, P. Sol-Gel Transition of Concentrated Colloidal Suspensions. Phys. Rev. Lett. 2000, 85, 4980–4983. [Google Scholar] [CrossRef]
- Zakharov, P.; Cardinaux, F.; Scheffold, F. Multispeckle Diffusing-Wave Spectroscopy with a Single-Mode Detection Scheme. Phys. Rev. E 2006, 73, 011413. [Google Scholar] [CrossRef] [Green Version]
- Kim, H.S.; Şenbil, N.; Zhang, C.; Scheffold, F.; Mason, T.G. Diffusing Wave Microrheology of Highly Scattering Concentrated Monodisperse Emulsions. Proc. Natl. Acad. Sci. USA 2019, 116, 7766–7771. [Google Scholar] [CrossRef] [Green Version]
- Fahimi, Z.; Aangenendt, F.J.; Voudouris, P.; Mattsson, J.; Wyss, H.M. Diffusing-Wave Spectroscopy in a Standard Dynamic Light Scattering Setup. Phys. Rev. E 2017, 96, 062611. [Google Scholar] [CrossRef] [Green Version]


Publisher’s Note: MDPI stays neutral with regard to jurisdictional claims in published maps and institutional affiliations. |
© 2021 by the authors. Licensee MDPI, Basel, Switzerland. This article is an open access article distributed under the terms and conditions of the Creative Commons Attribution (CC BY) license (https://creativecommons.org/licenses/by/4.0/).
Share and Cite
Dinache, A.; Pascu, M.-L.; Smarandache, A. Spectral Properties of Foams and Emulsions. Molecules 2021, 26, 7704. https://doi.org/10.3390/molecules26247704
Dinache A, Pascu M-L, Smarandache A. Spectral Properties of Foams and Emulsions. Molecules. 2021; 26(24):7704. https://doi.org/10.3390/molecules26247704
Chicago/Turabian StyleDinache, Andra, Mihail-Lucian Pascu, and Adriana Smarandache. 2021. "Spectral Properties of Foams and Emulsions" Molecules 26, no. 24: 7704. https://doi.org/10.3390/molecules26247704