Article

Mechanical and Thermal Properties of Polyether Polytriazole Elastomers Formed by Click-Chemical Reaction Curing Glycidyl Azide Polymer

1
School of Environment and Safety Engineering, North University of China, Taiyuan 030051, China
2
Luzhou North Chemical Industries Co., Ltd., Luzhou 646000, Sichuan, China
*
Author to whom correspondence should be addressed.
Molecules 2020, 25(8), 1988; https://doi.org/10.3390/molecules25081988
Submission received: 28 March 2020 / Revised: 20 April 2020 / Accepted: 21 April 2020 / Published: 23 April 2020
(This article belongs to the Special Issue Advanced Chemistry of Energetic Materials)

Abstract

:
Energetic binders are a research hot-spot, and much emphasis has been placed on their mechanical properties. In this study, propargyl-terminated ethylene oxide-tetrahydrofuran copolymer (PTPET) was synthesized. Then, PTPET and low-molecular-weight ester-terminated glycidyl azide polymer (GAP) were reacted by the click reaction without using catalysts to obtain a polyether polytriazole elastomer. Through tensile tests, where R = 0.5, the tensile strength reached 0.332 MPa, with an elongation at break of 897.1%. Swelling tests were used to measure the cross-linked network and showed that the cross-linked network regularity was reduced as R increased. The same conclusions were confirmed by dynamic mechanical analysis (DMA). In DMA curves, Tg was around −70 to −65 °C, and a small amount of crystallization appeared at between −50 and −30 °C, because locally ordered structures were also present in random copolymers, thereby forming localized crystals. Their thermal performance was tested by Differential Scanning Calorimeter (DSC) and Thermal Gravimetric Analyzer (TG), and the main mass loss occurred at around 350 to 450 °C, which meant that they were stable. In conclusion, the polyether polytriazole elastomer can be used as a binder in a composite propellant.

1. Introduction

Exploring the universe is a human dream, and propellant is the power source of spacecraft. The binder is an important component of solid propellant, and attempts have been made to incorporate energetic components into the binder to impart energy to the binder while ensuring good mechanical properties to meet the higher requirements for binders [1,2,3,4,5,6,7,8].
Glycidyl azide polymer (GAP) can be added to composite solid propellants as an energetic component due to its high heat and density; however, in composite propellant binders, conventional curing methods utilize isocyanates as a curing agent for GAP. There are many disadvantages of this curing system: many side reactions, high toxicity, high activity of isocyanate, and sensitivity to moisture, affecting mechanical properties by reacting rapidly with water to form a urea group while releasing carbon dioxide, which can stay inside the propellant. Moreover, high-temperature curing readily causes product defects [9,10]. By contrast, click chemistry, as a simple, efficient, controllable, and fast synthesis method, has attracted wide attention since Kolb et al. proposed the concept of click chemistry in 2001 [11]. Compared with a hydroxy and isocyanate curing system, the alkynyl azide curing system has no side effects, is not sensitive to moisture, has greater thermal stability, and good compatibility with high-energy components (e.g., ammonium dinitramide, hydrazinium nitroformate) which are helpful for the practical application of high-energy components. [1,2,3,5,6,7,12,13].
When using click chemistry, scholars have tried a range of cross-linking agents, such as bis-propargyl-succinate (BPS), aromatic diyne (1,4-diethynylbenzene, 1,4-diacetylenecarbonylbenzene and 1,3-dicyanoethynylbenzene) [14], propargyltriazine (TPC) [15], and propargyl-terminated polyethylene glycol (PEG) [4]. In short, BPS is the preferred curing cross-linker [2,16,17]. According to the literature, due to the rapid reaction of BPS and GAP, it readily forms bubbles, depressions, and other defects; high modulus and low elongation (< 100%) also limit its further use. Herein, to improve the mechanical properties, we replaced BPS with alkynyl-terminated ethylene oxide-tetrahydrofuran copolymer (PTPET), forming GAP-crosslinked propargyl-terminated ethylene oxide-tetrahydrofuran copolymer (PTPET) polyether polytriazole elastomer with GAP. It is hoped that PTPET and GAP will meet the demands of energy performance and mechanical properties, after curing using click chemistry.

2. Results and Discussion

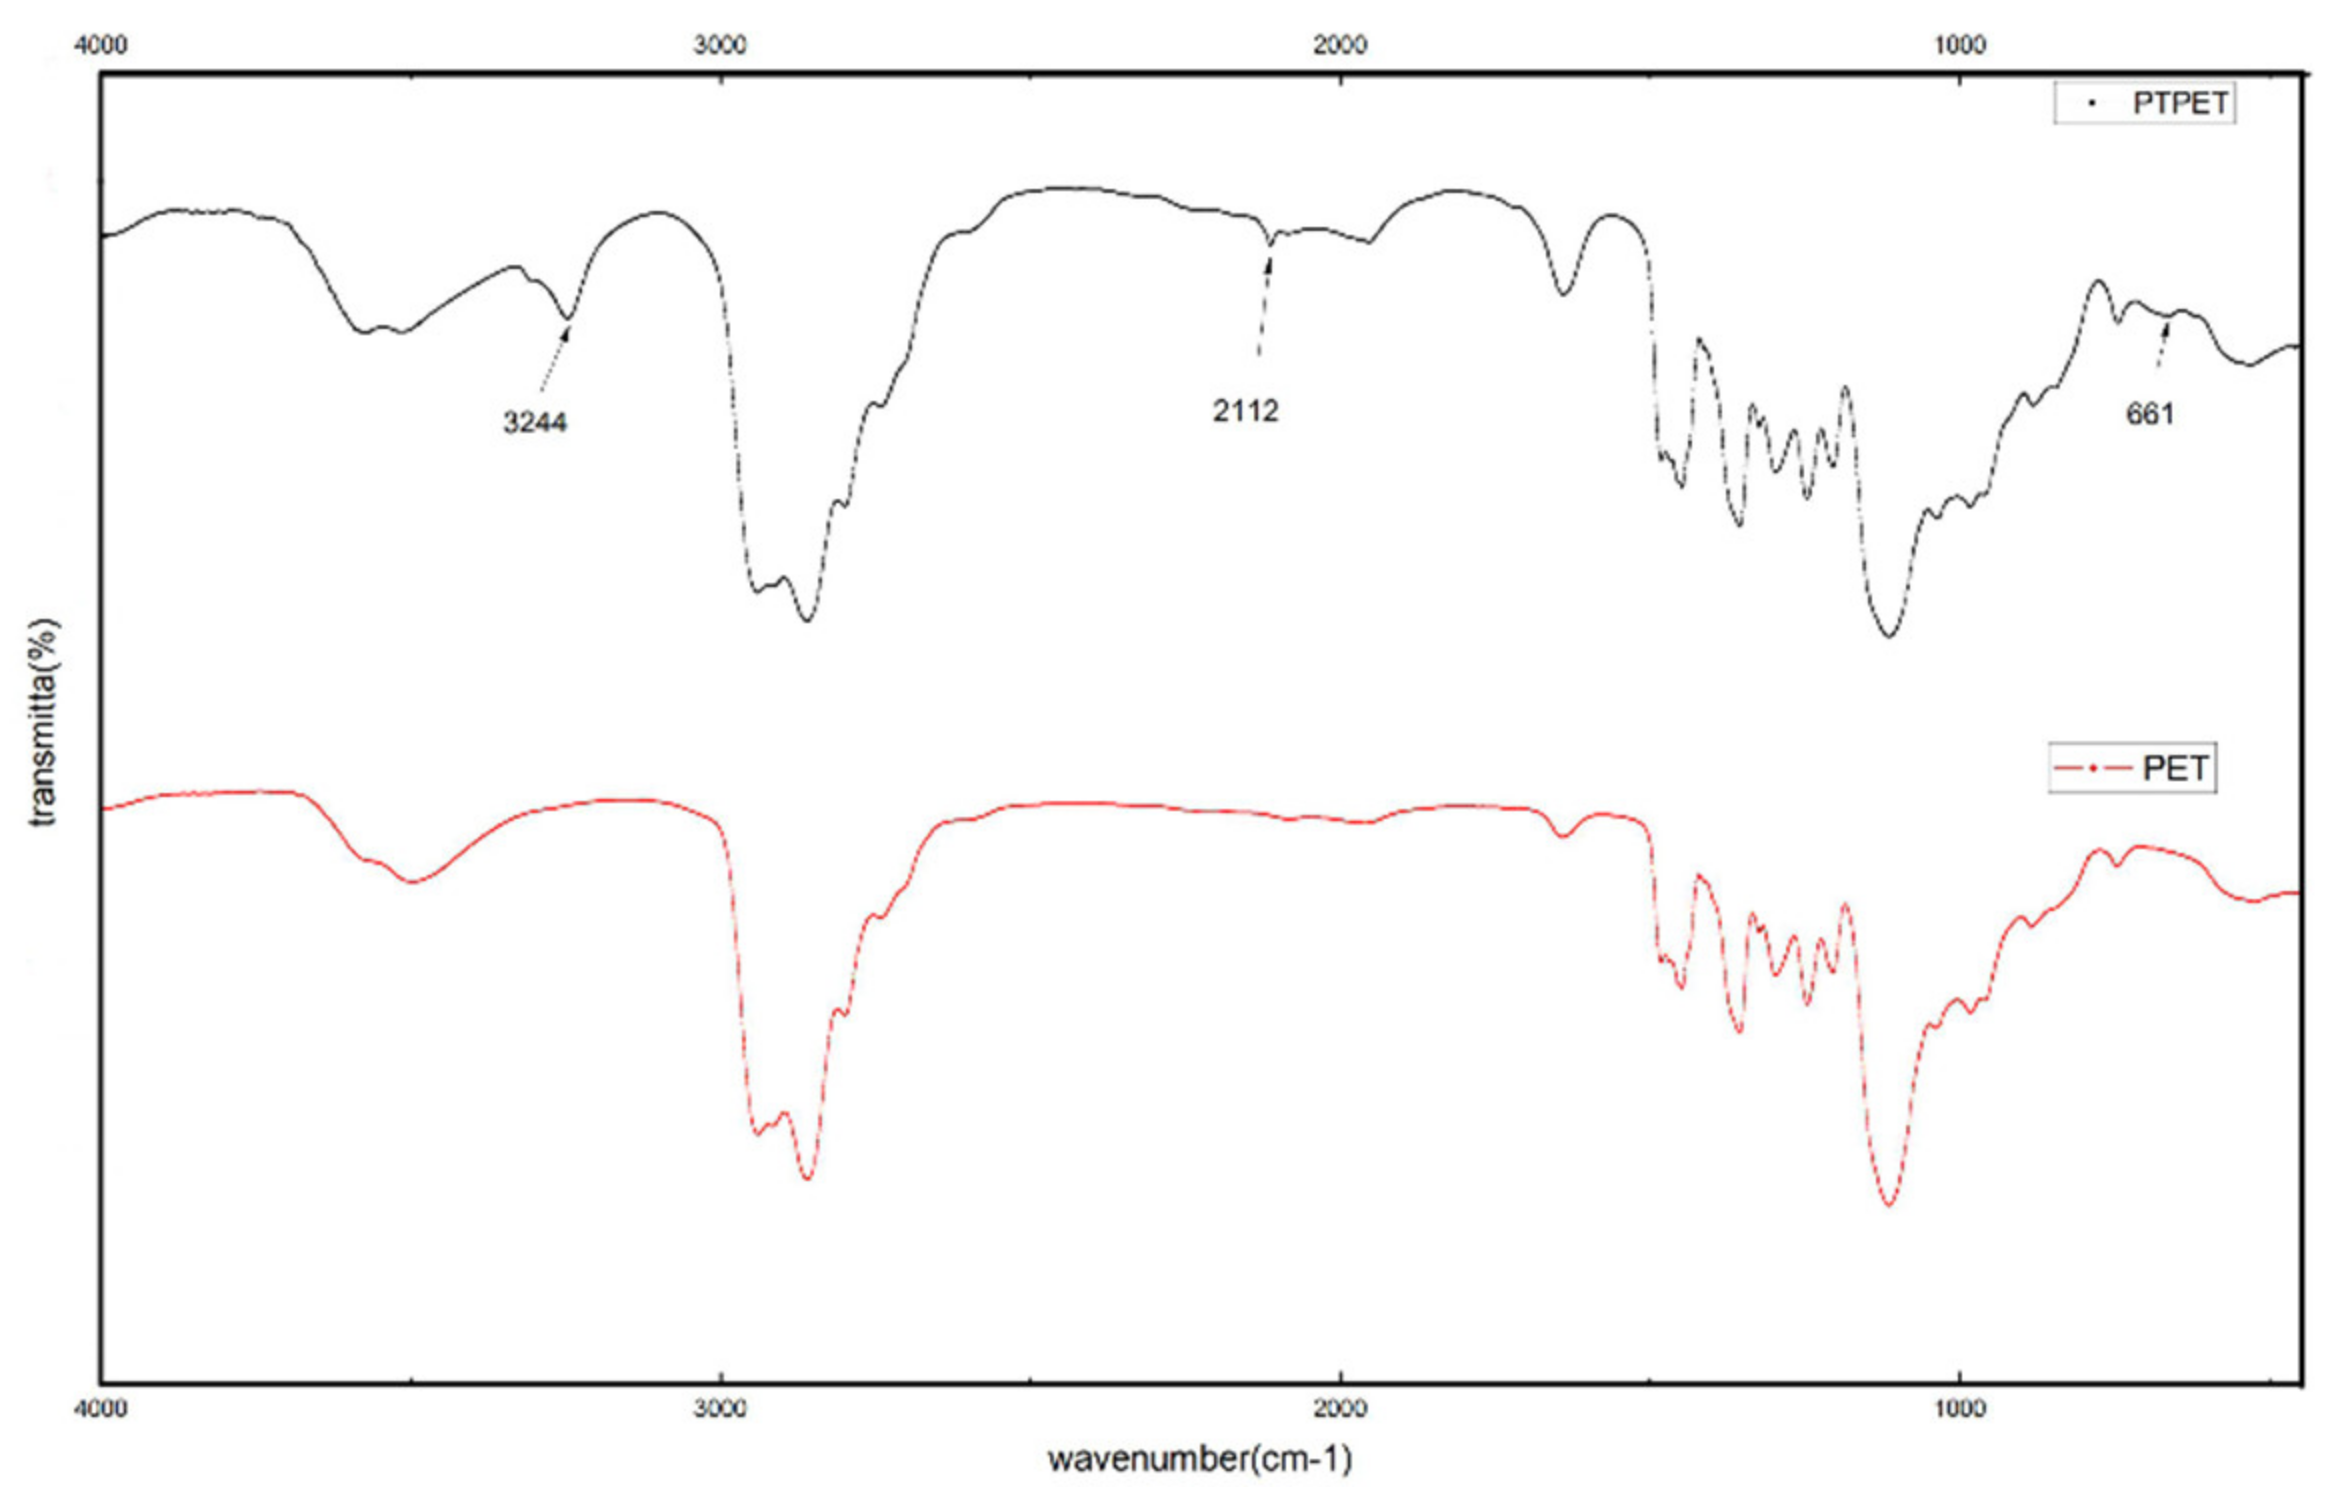
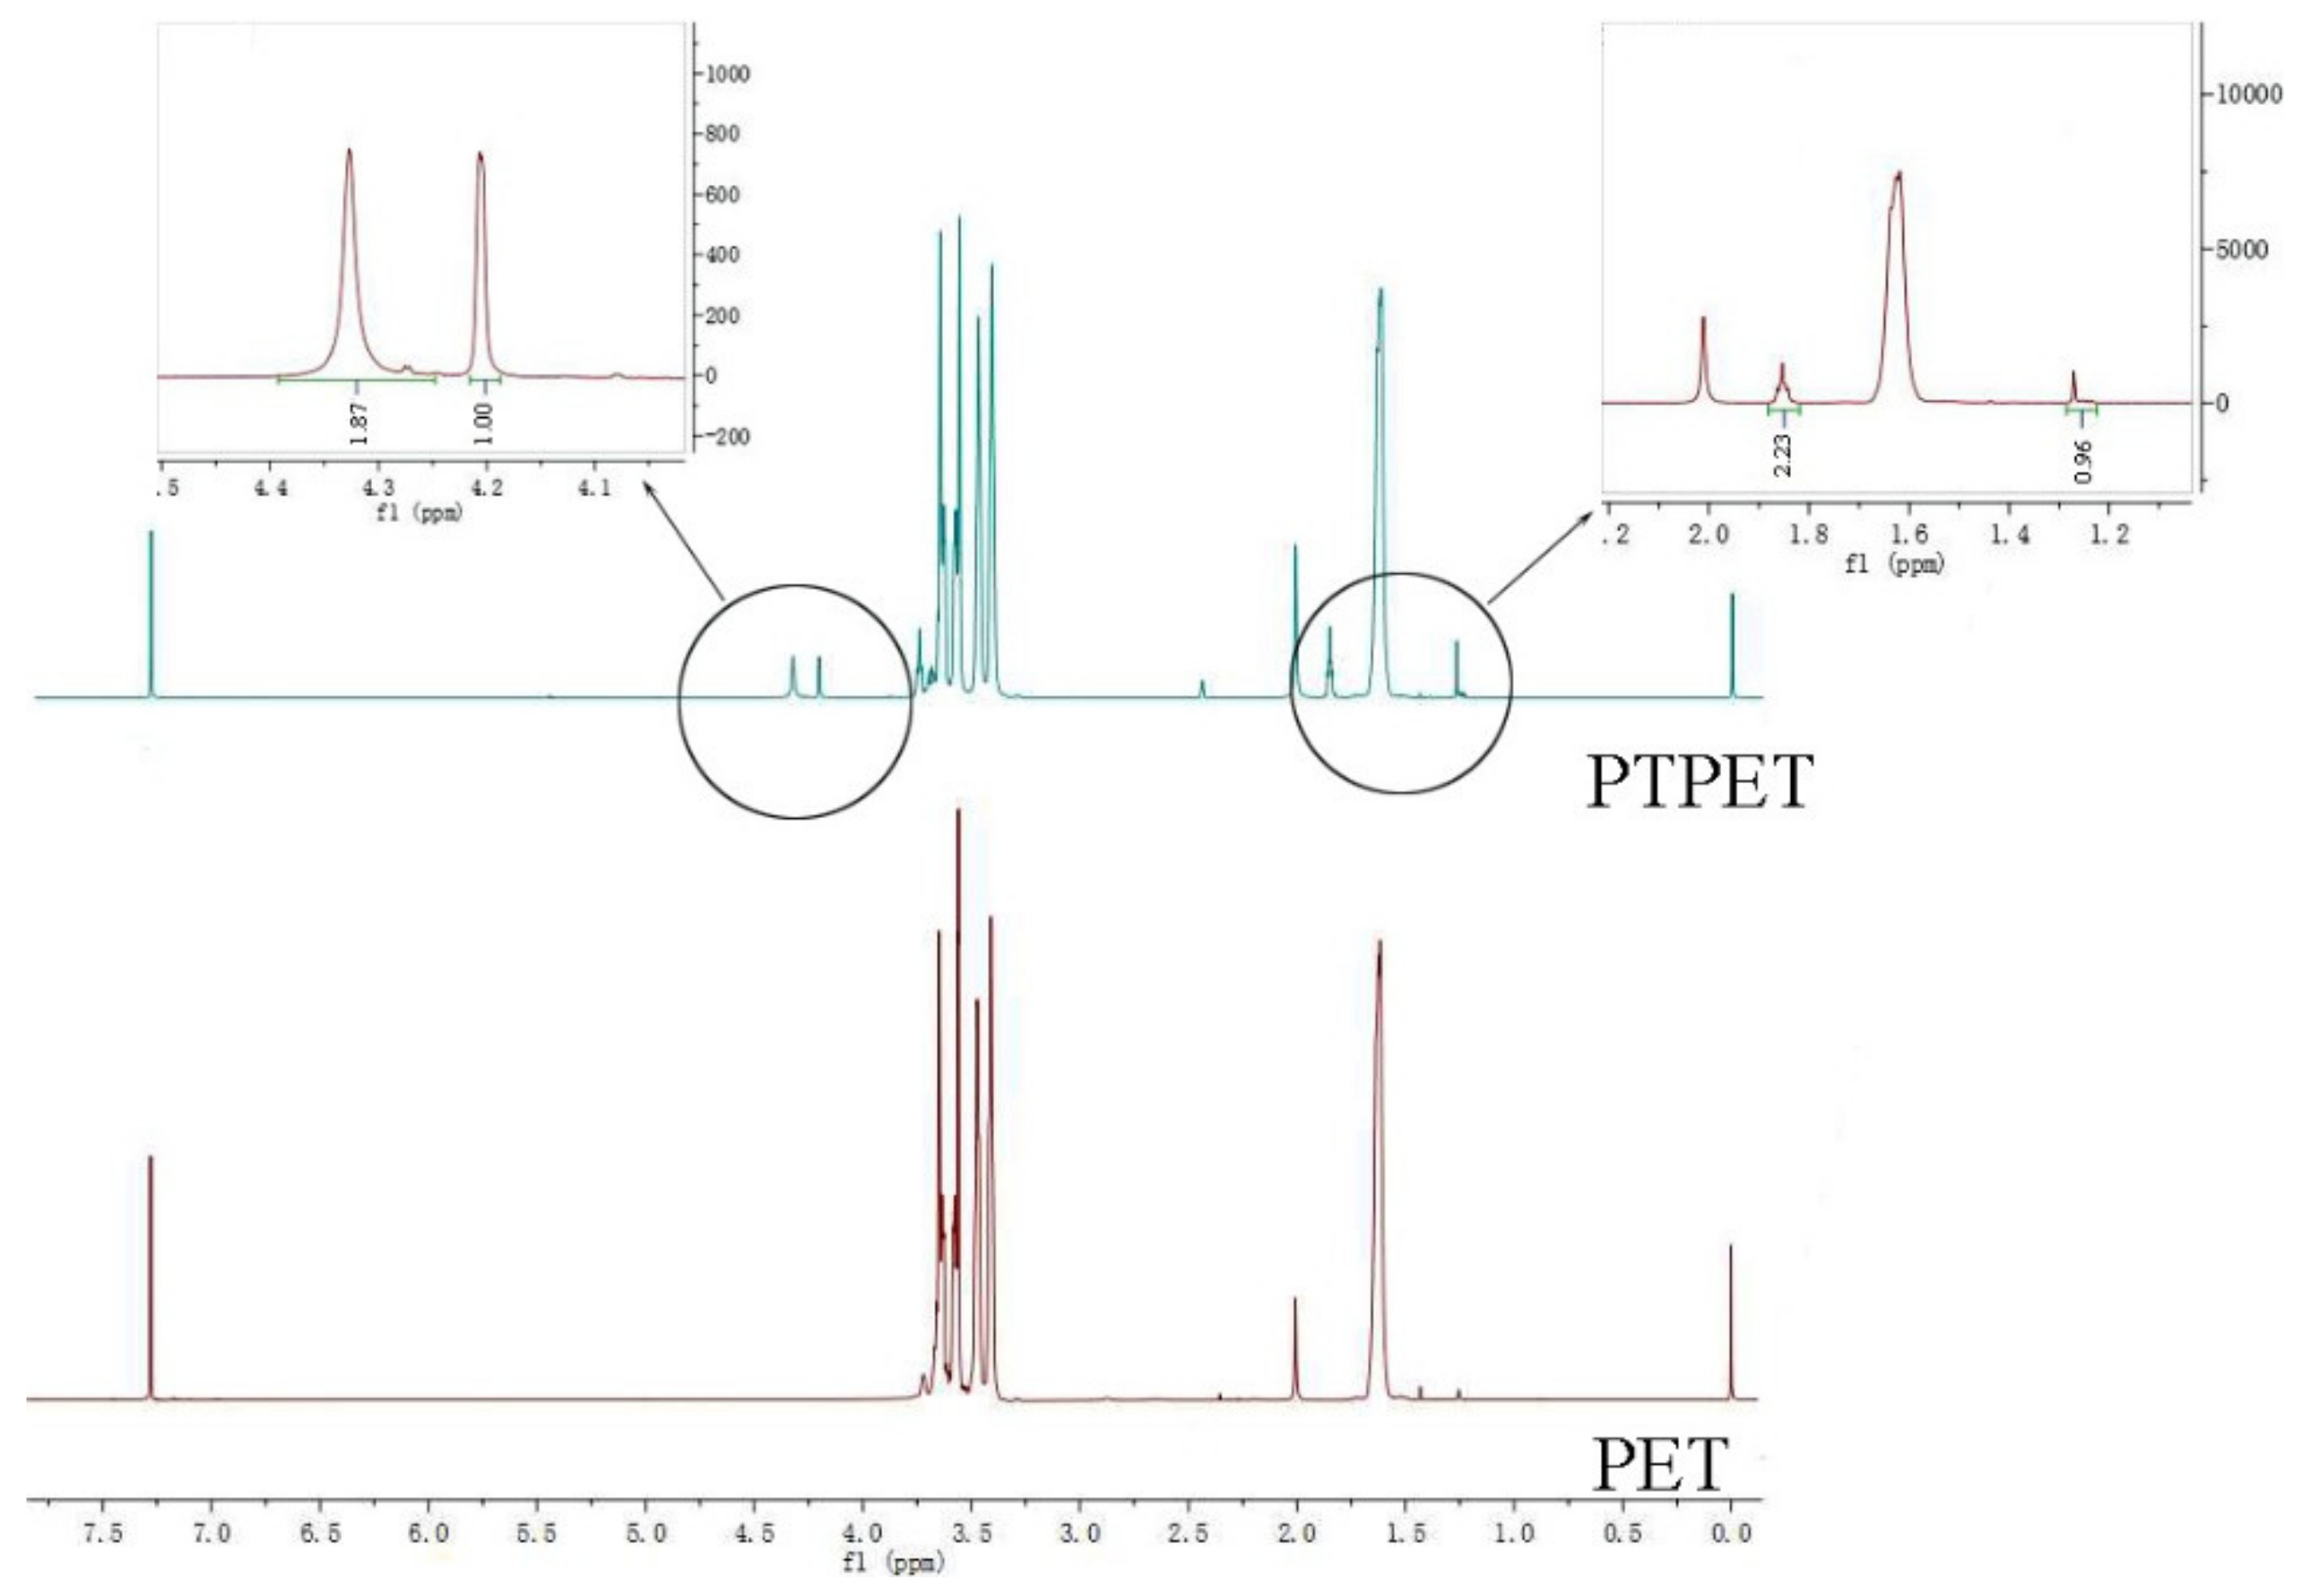
2.1. Structural Characterisation of PTPET

The FTIR spectra of ethylene oxide-tetrahydrofuran copolymer (PET) and PTPET are shown in Figure 1. In comparison with the PET spectrum, the PTPET spectrum shows three characteristic peaks of the alkynyl group, which are the characteristic peaks of ≡C-H at 3244 cm−1, C≡C at 2112 cm−1, and ≡C-H at 661cm−1. As a result of the PTPET backbone being a random copolymer of ethylene oxide and tetrahydrofuran, the two ends of the chain are asymmetric, so the absorption peaks of the alkynyl groups do not disappear.
The 1H NMR spectra of PET and PTPET are shown in Figure 2. From the 1H NMR, there are four peaks that can be divided into two groups in the approximate ratio of 1:2. This can be accounted for by the ratios of H on propargyl (-CH2-C≡CH) on -CH2- and -C≡CH. These indicate that the terminated hydroxyl has been replaced by propargyl, yielding the desired product: PTPET.

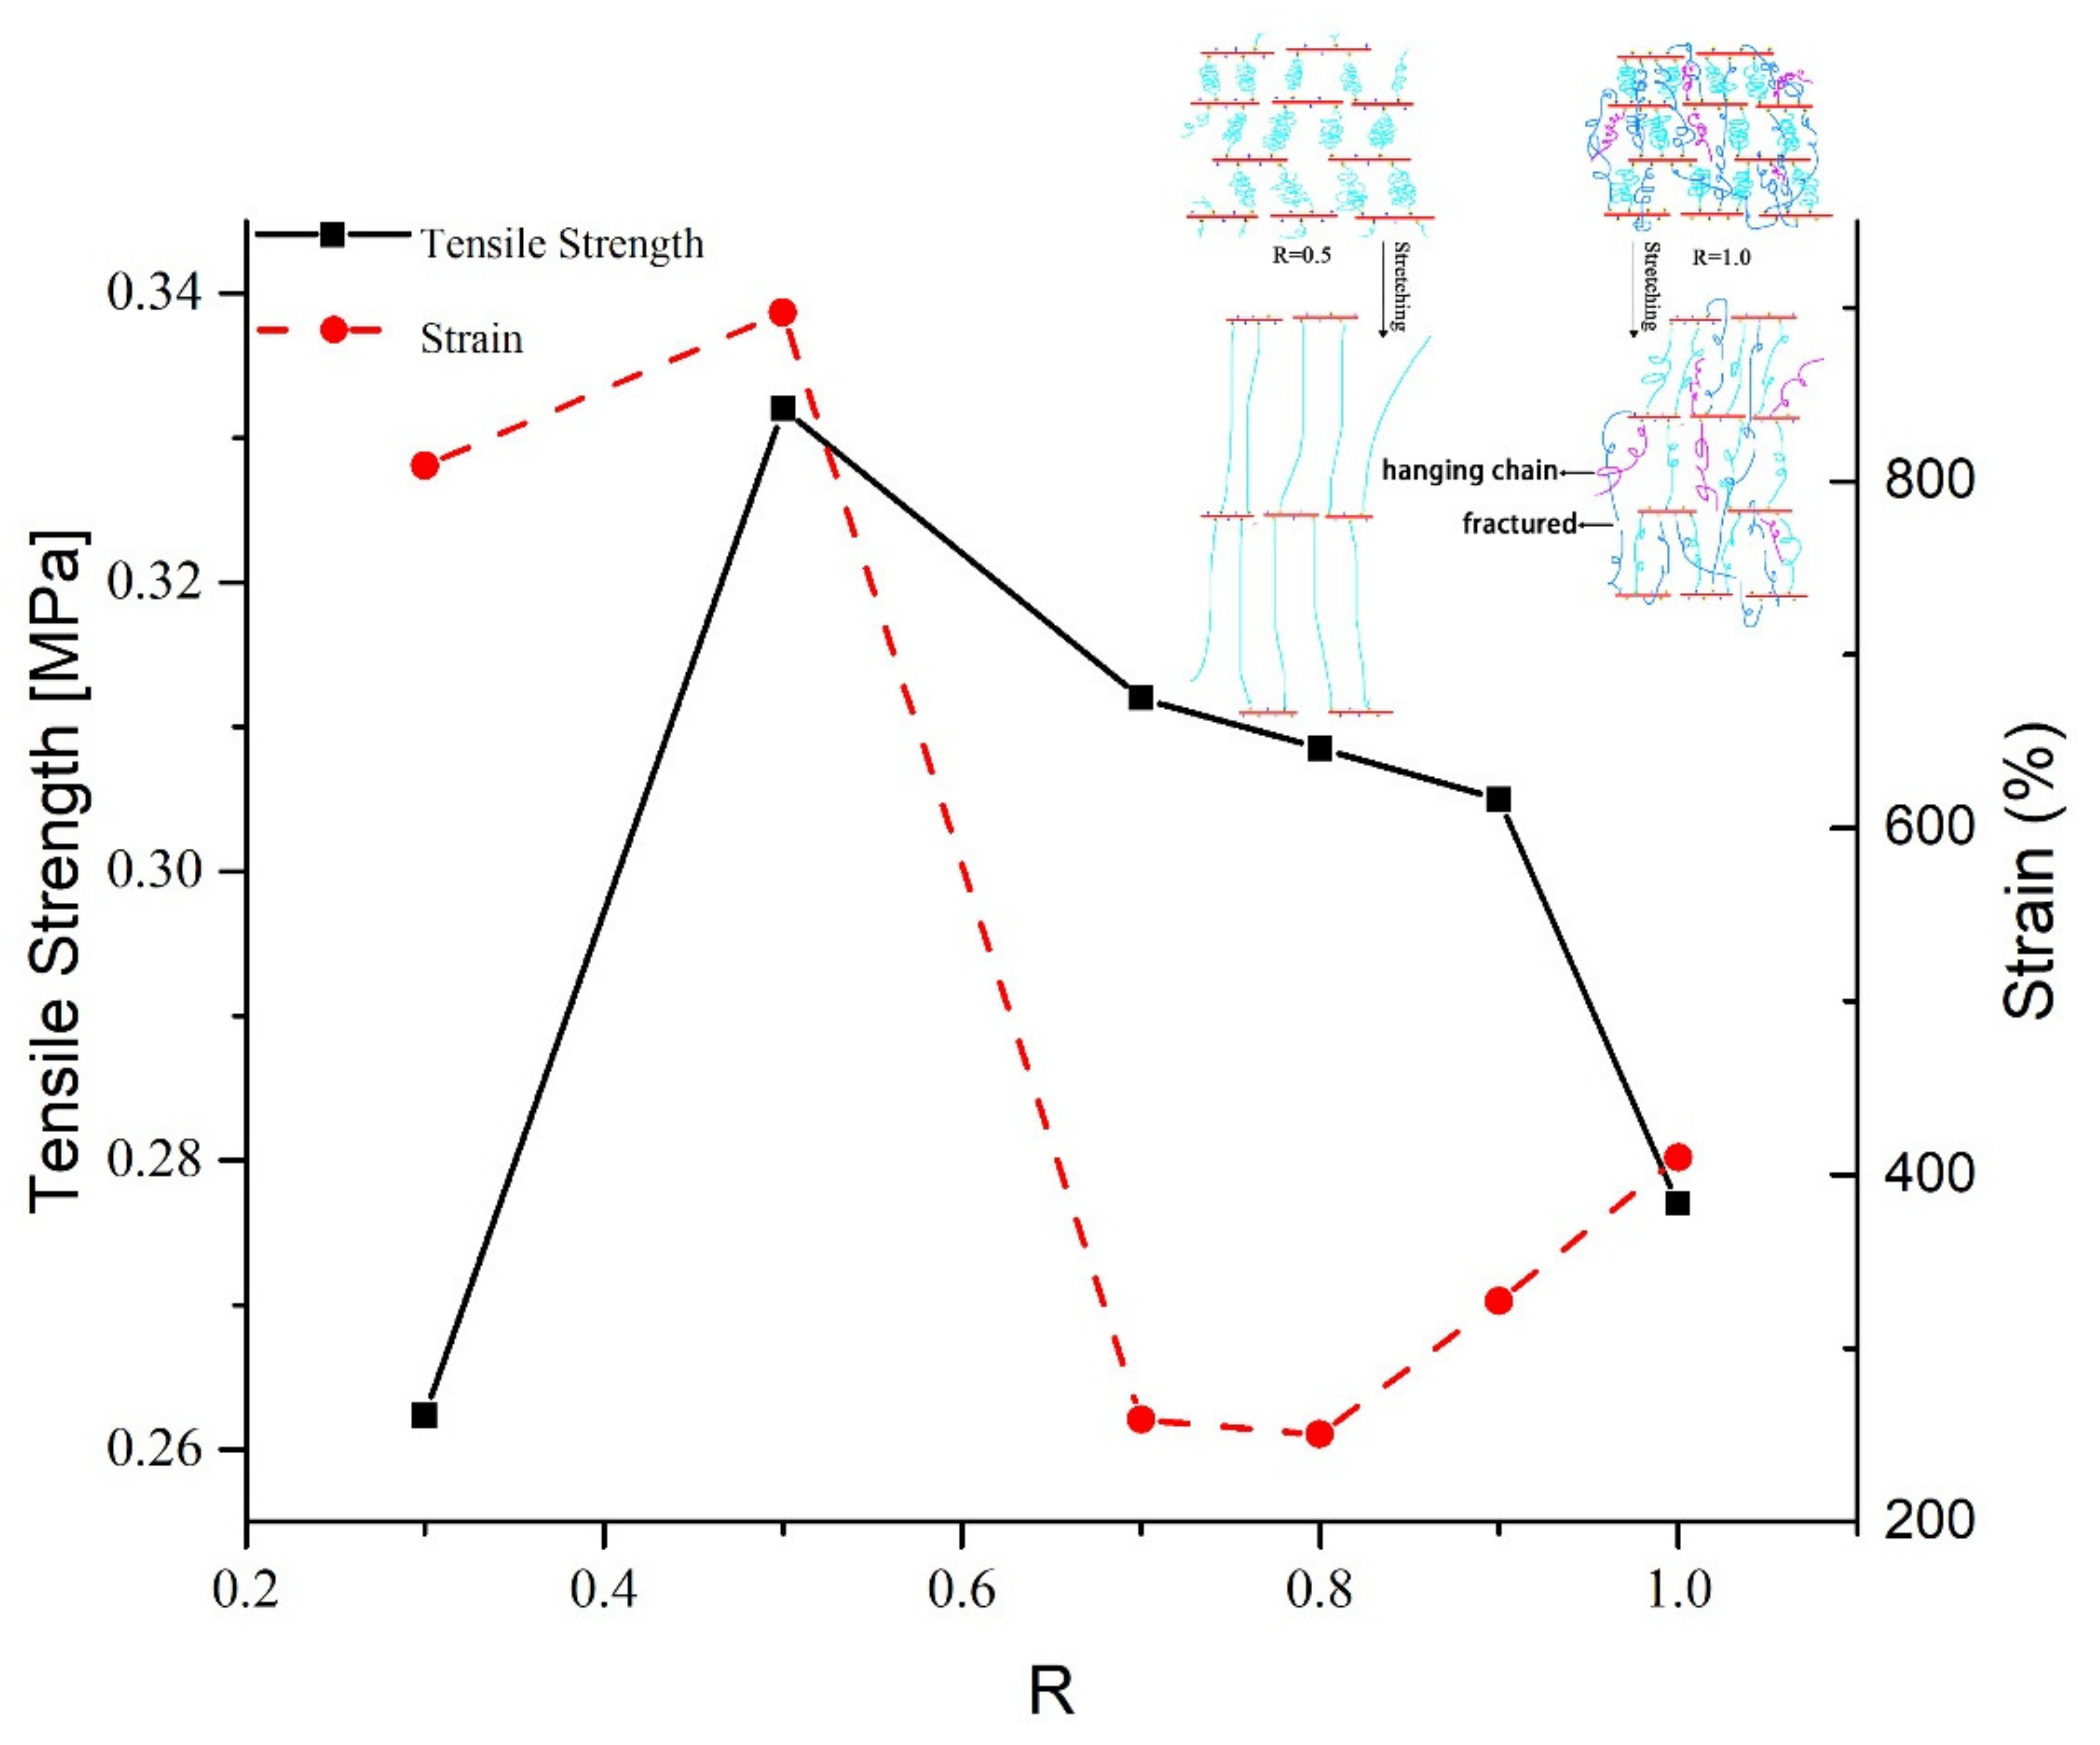
2.2. Mechanical Properties

The tensile strength and elongation of samples S0–S5 as a function of the R value are shown in Figure 3 with the mechanical properties of polytriazole elastomers listed in Table 1. As can be seen from the figure, the maximum tensile strength can reach 0.332 MPa. The tensile strength has a minimum value of R = 0.3, and then the tensile strength gradually decreases as R increases [1,4,12,13,17]. The regularity of the crosslinked network affects the mechanical properties of the polymer material. The reason for this phenomenon may be the molecular structure of GAP; because the number of atoms carried by the main chain interval in the molecular structure of GAP is small and a large -CH2N3 side chain is present, the intermolecular force is small [18]. Due to steric hindrance, when the R value is small, the alkynyl groups freely react with the azide groups on the GAP chain, in other words, steric hindrance can play a role in regulating the cross-linked network. When the R value is bigger, a competition arises and the active alkynyl groups preferentially reacts with the azide groups. After that, the unreacted alkynyl groups need to react with the remaining -N3 in a limited space, which will destroy the original regularity. Moreover, the regularity will be further destroyed by a formulate triazole ring. Hence, the bigger the R value, the more irregular the cross-linked network. At R = 0.3, because the number of alkynyl groups is too small, and the number of cross-linking points of the cross-linking network that can be formed is also too small, its tensile strength is very low and the elongation is also low. The parameters of the network structure will be discussed later.
The elongations are all above 200%, and some even approach 900%, showing excellent deformability. The elongation first decreases as the R increases, and has a minimum value at R = 0.8 (thereafter, the elongation increases). A maximum elongation, 897.1%, occurs at R = 0.5, a value far greater than that of other samples. When the R value is small, because there are fewer cross-linking points inside the sample, and the network structure is more regular, the contribution to elongation mainly derives from the orientation of the molecular chain of PTPET, scilicet changing from curled to stretched. However, as the R value increases, the number of cross-linking points increases. Physical entanglement and chemical entanglement between polymer chains decrease the elongation, albeit later it increases because a few cross-linking points in an irregular network may be destroyed preferentially during stretching, making the network more regular again and thus increasing elongation. In addition, as R increases, as a result of the greater apparent average molecular weight Mc (Table 2), the tensile strain is increased [19], the contribution of the number of triazole rings increases, and thus the elongation also increases, and the strain at break is increased.
Considering the comprehensive mechanical properties of PTPET, it can be found that when R = 0.5, the strongest tensile strength and a much better elongation can be obtained. In general, the use of PTPET is better than BPS, especially in terms of elongation. However, the tensile strength of elastomers is poor; thus, we need to continue to study methods to improve the tensile strength, for example, through the use of larger molecular weight azide-terminated glycidyl azide polymer (GAPA), or the introduction of a second network.

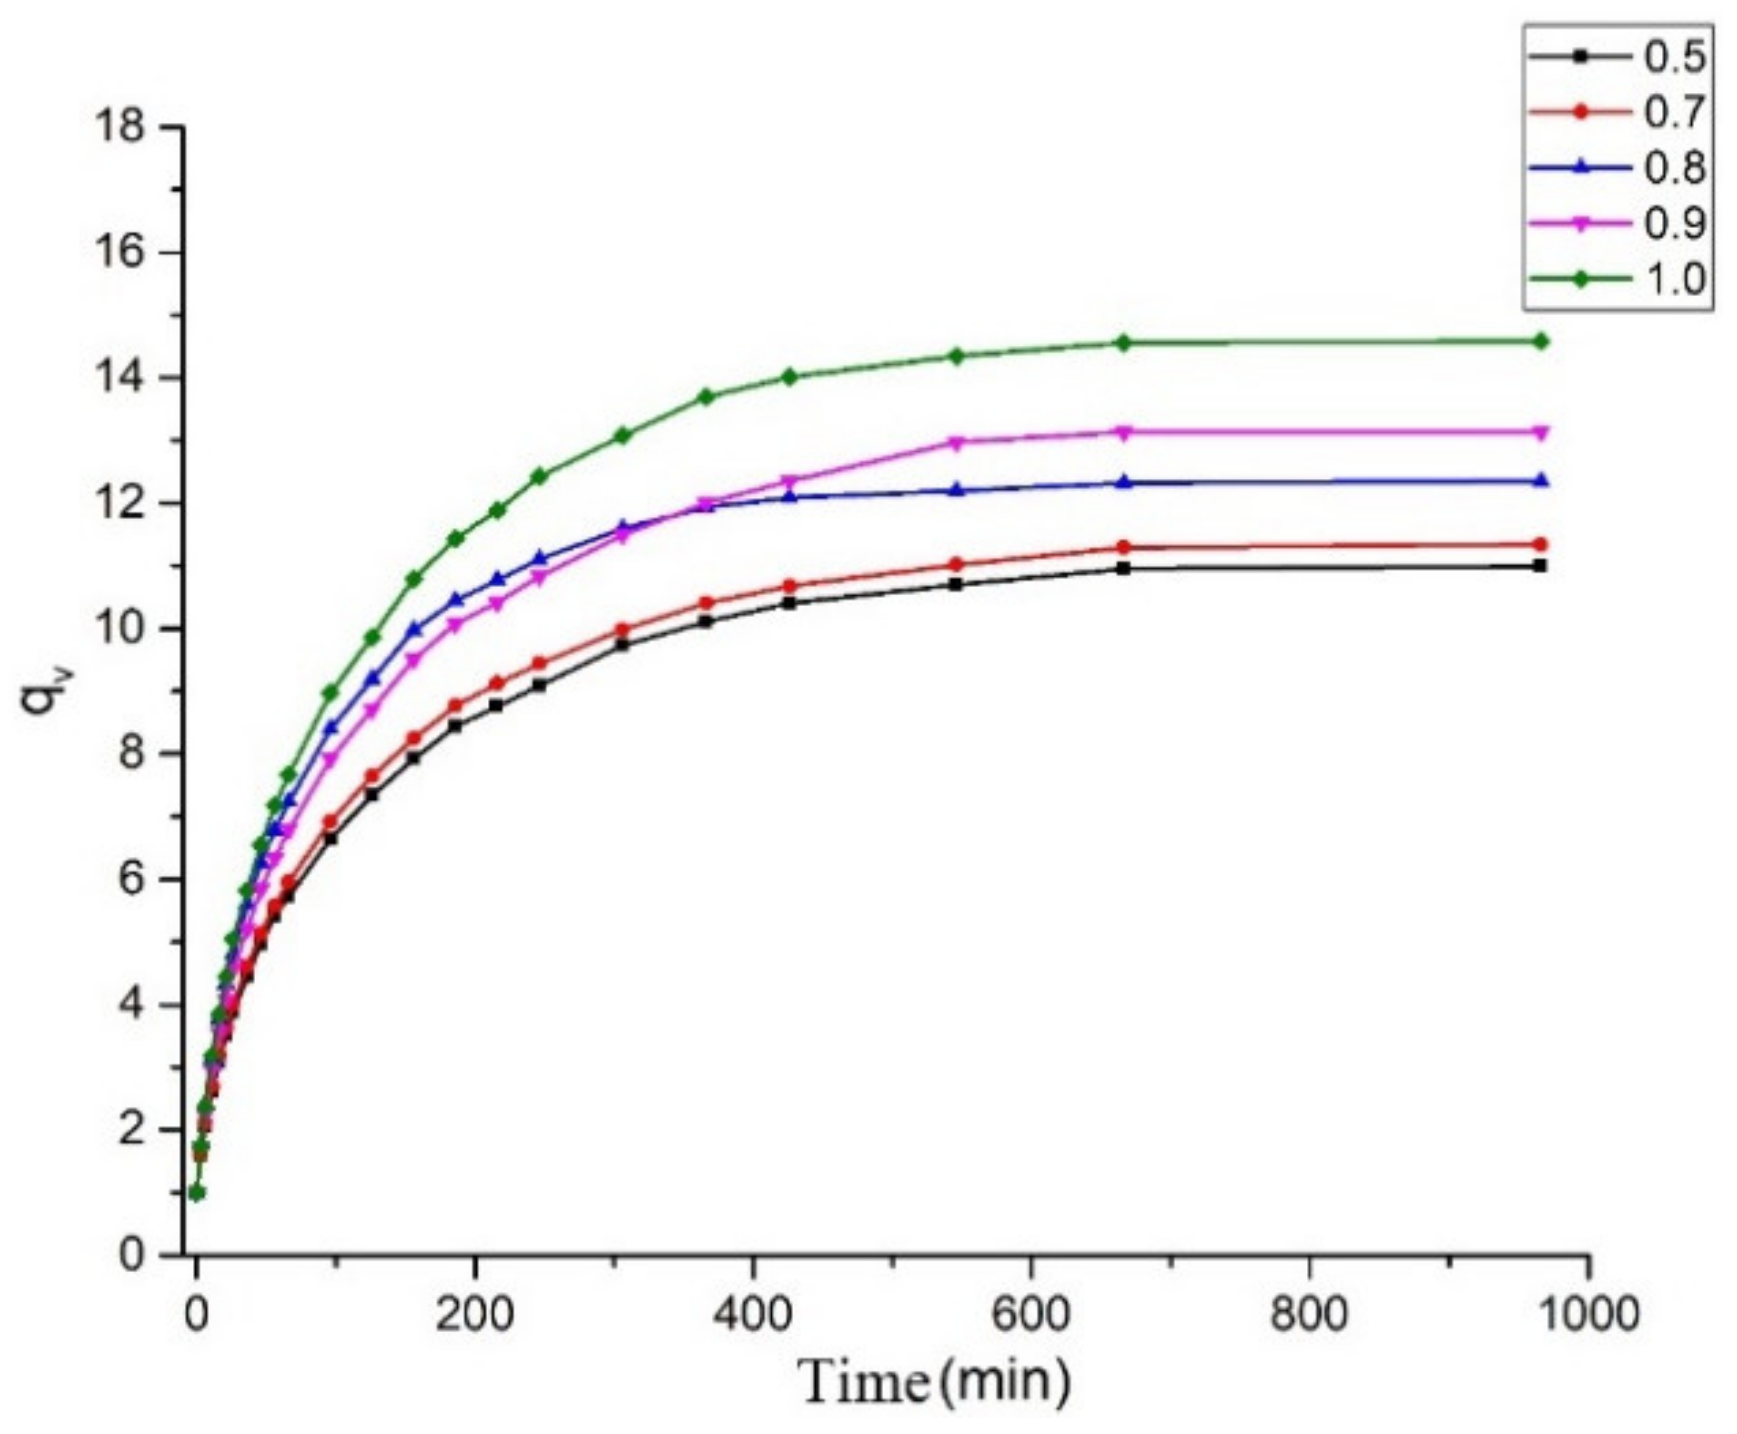
2.3. Network Structure
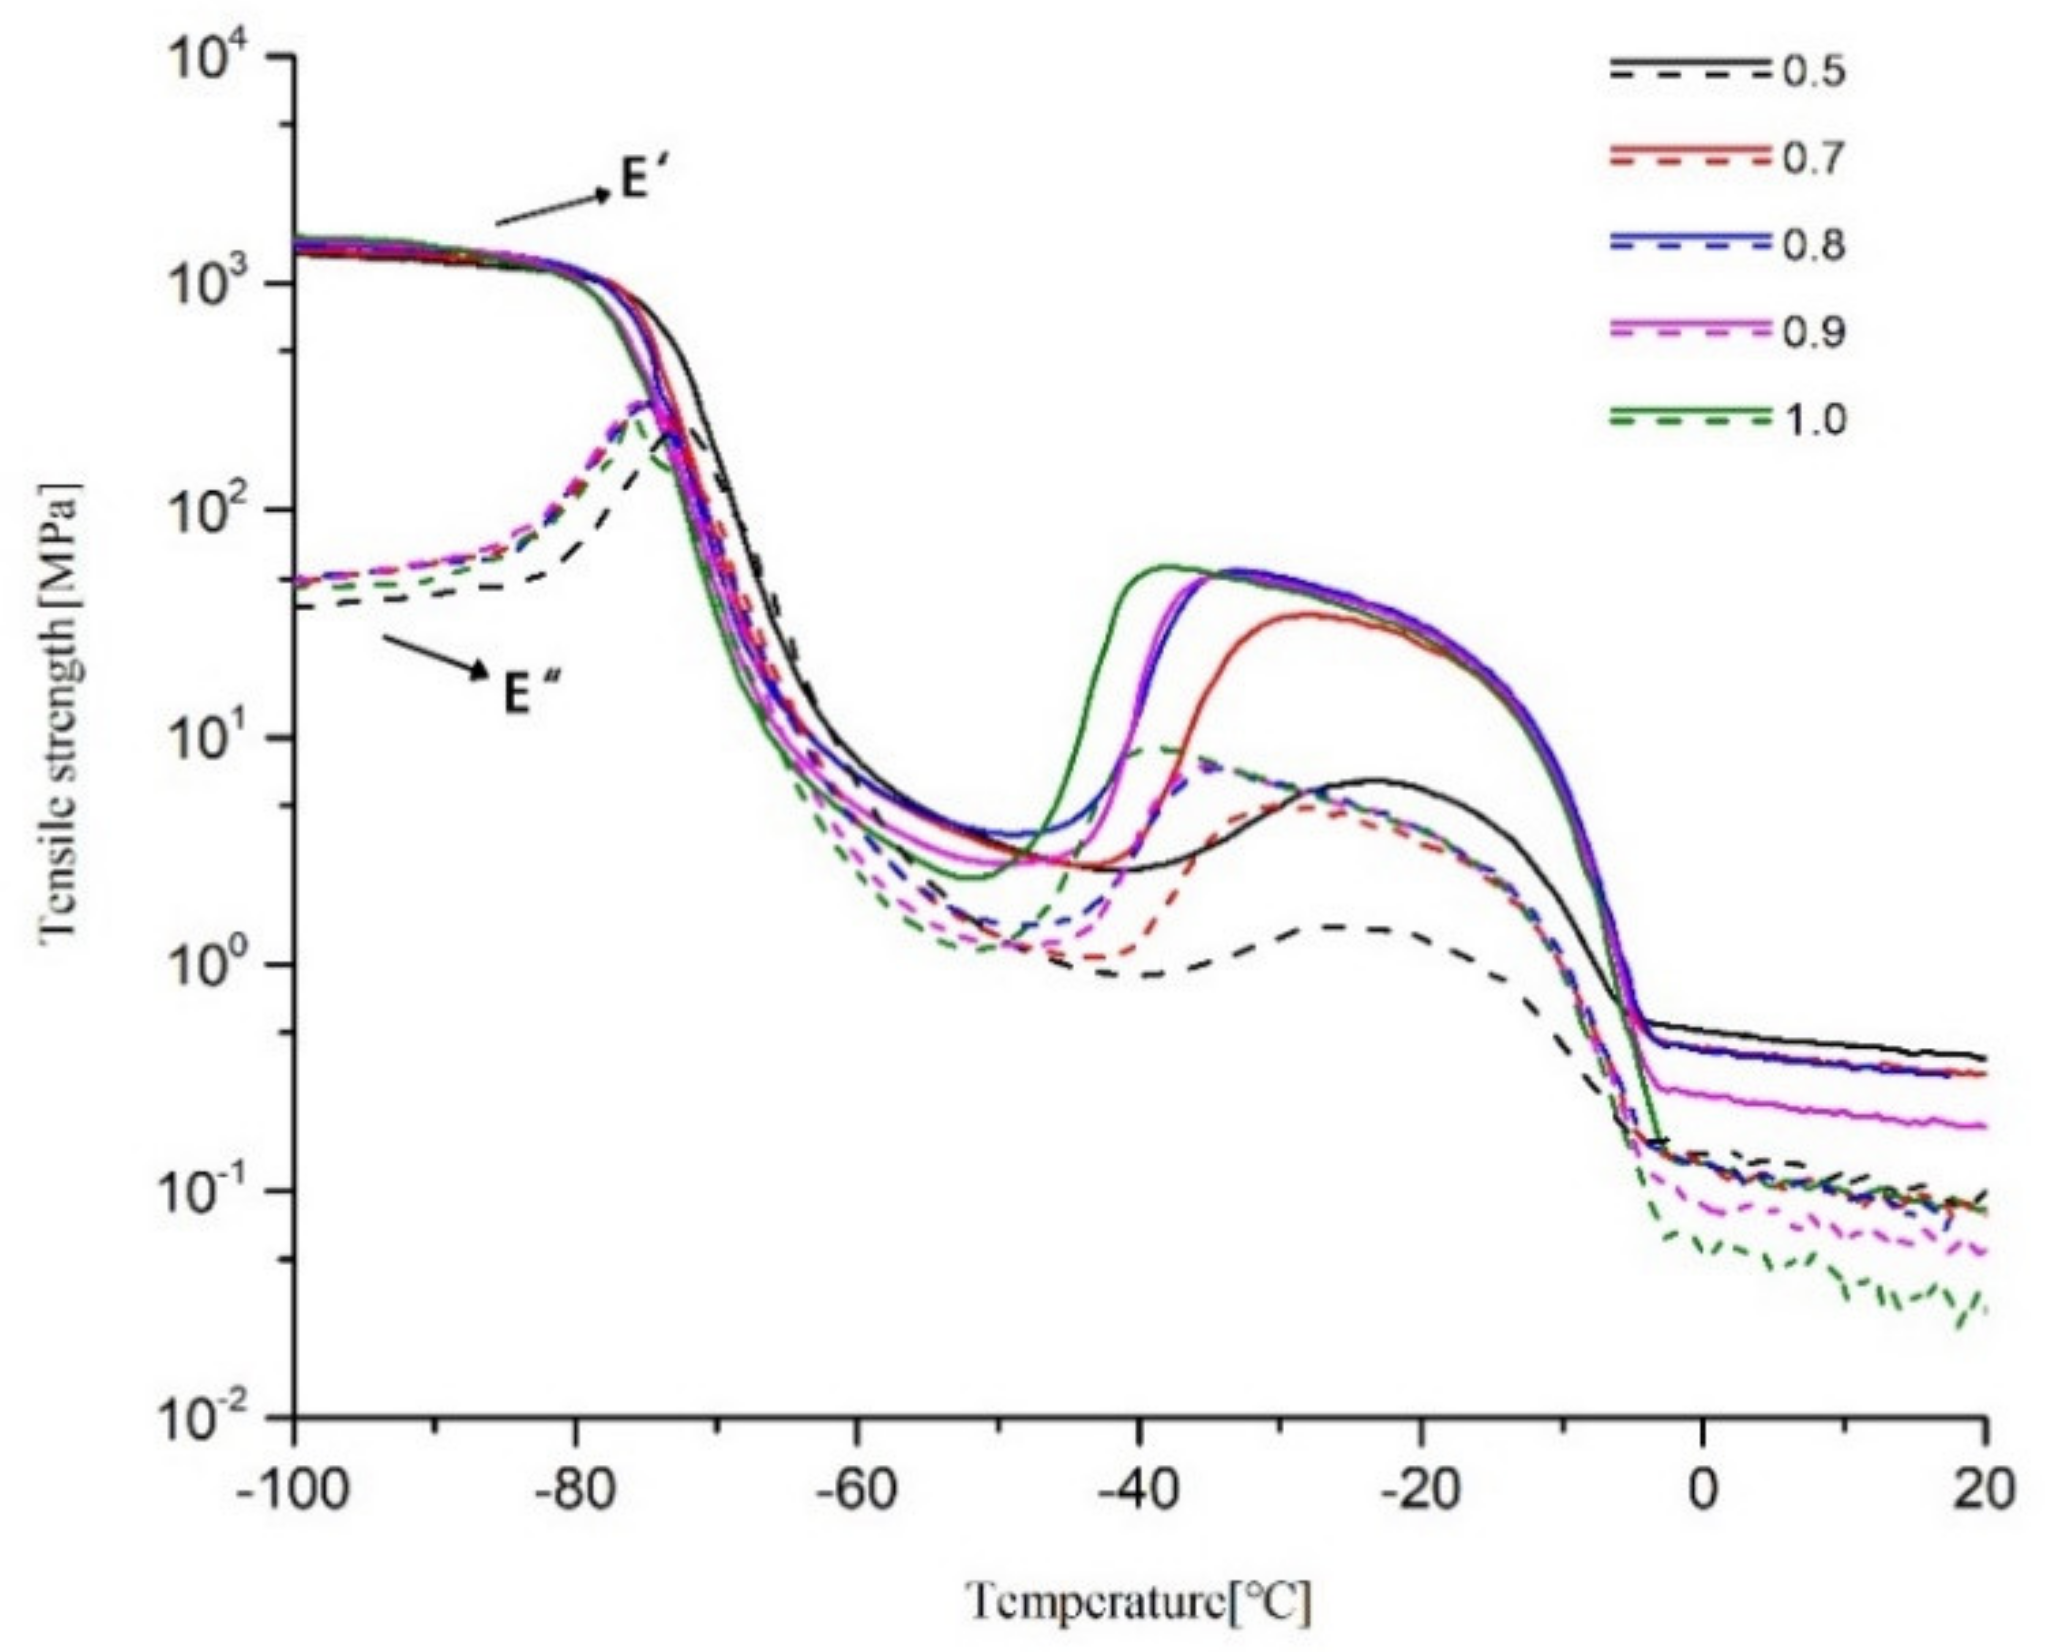
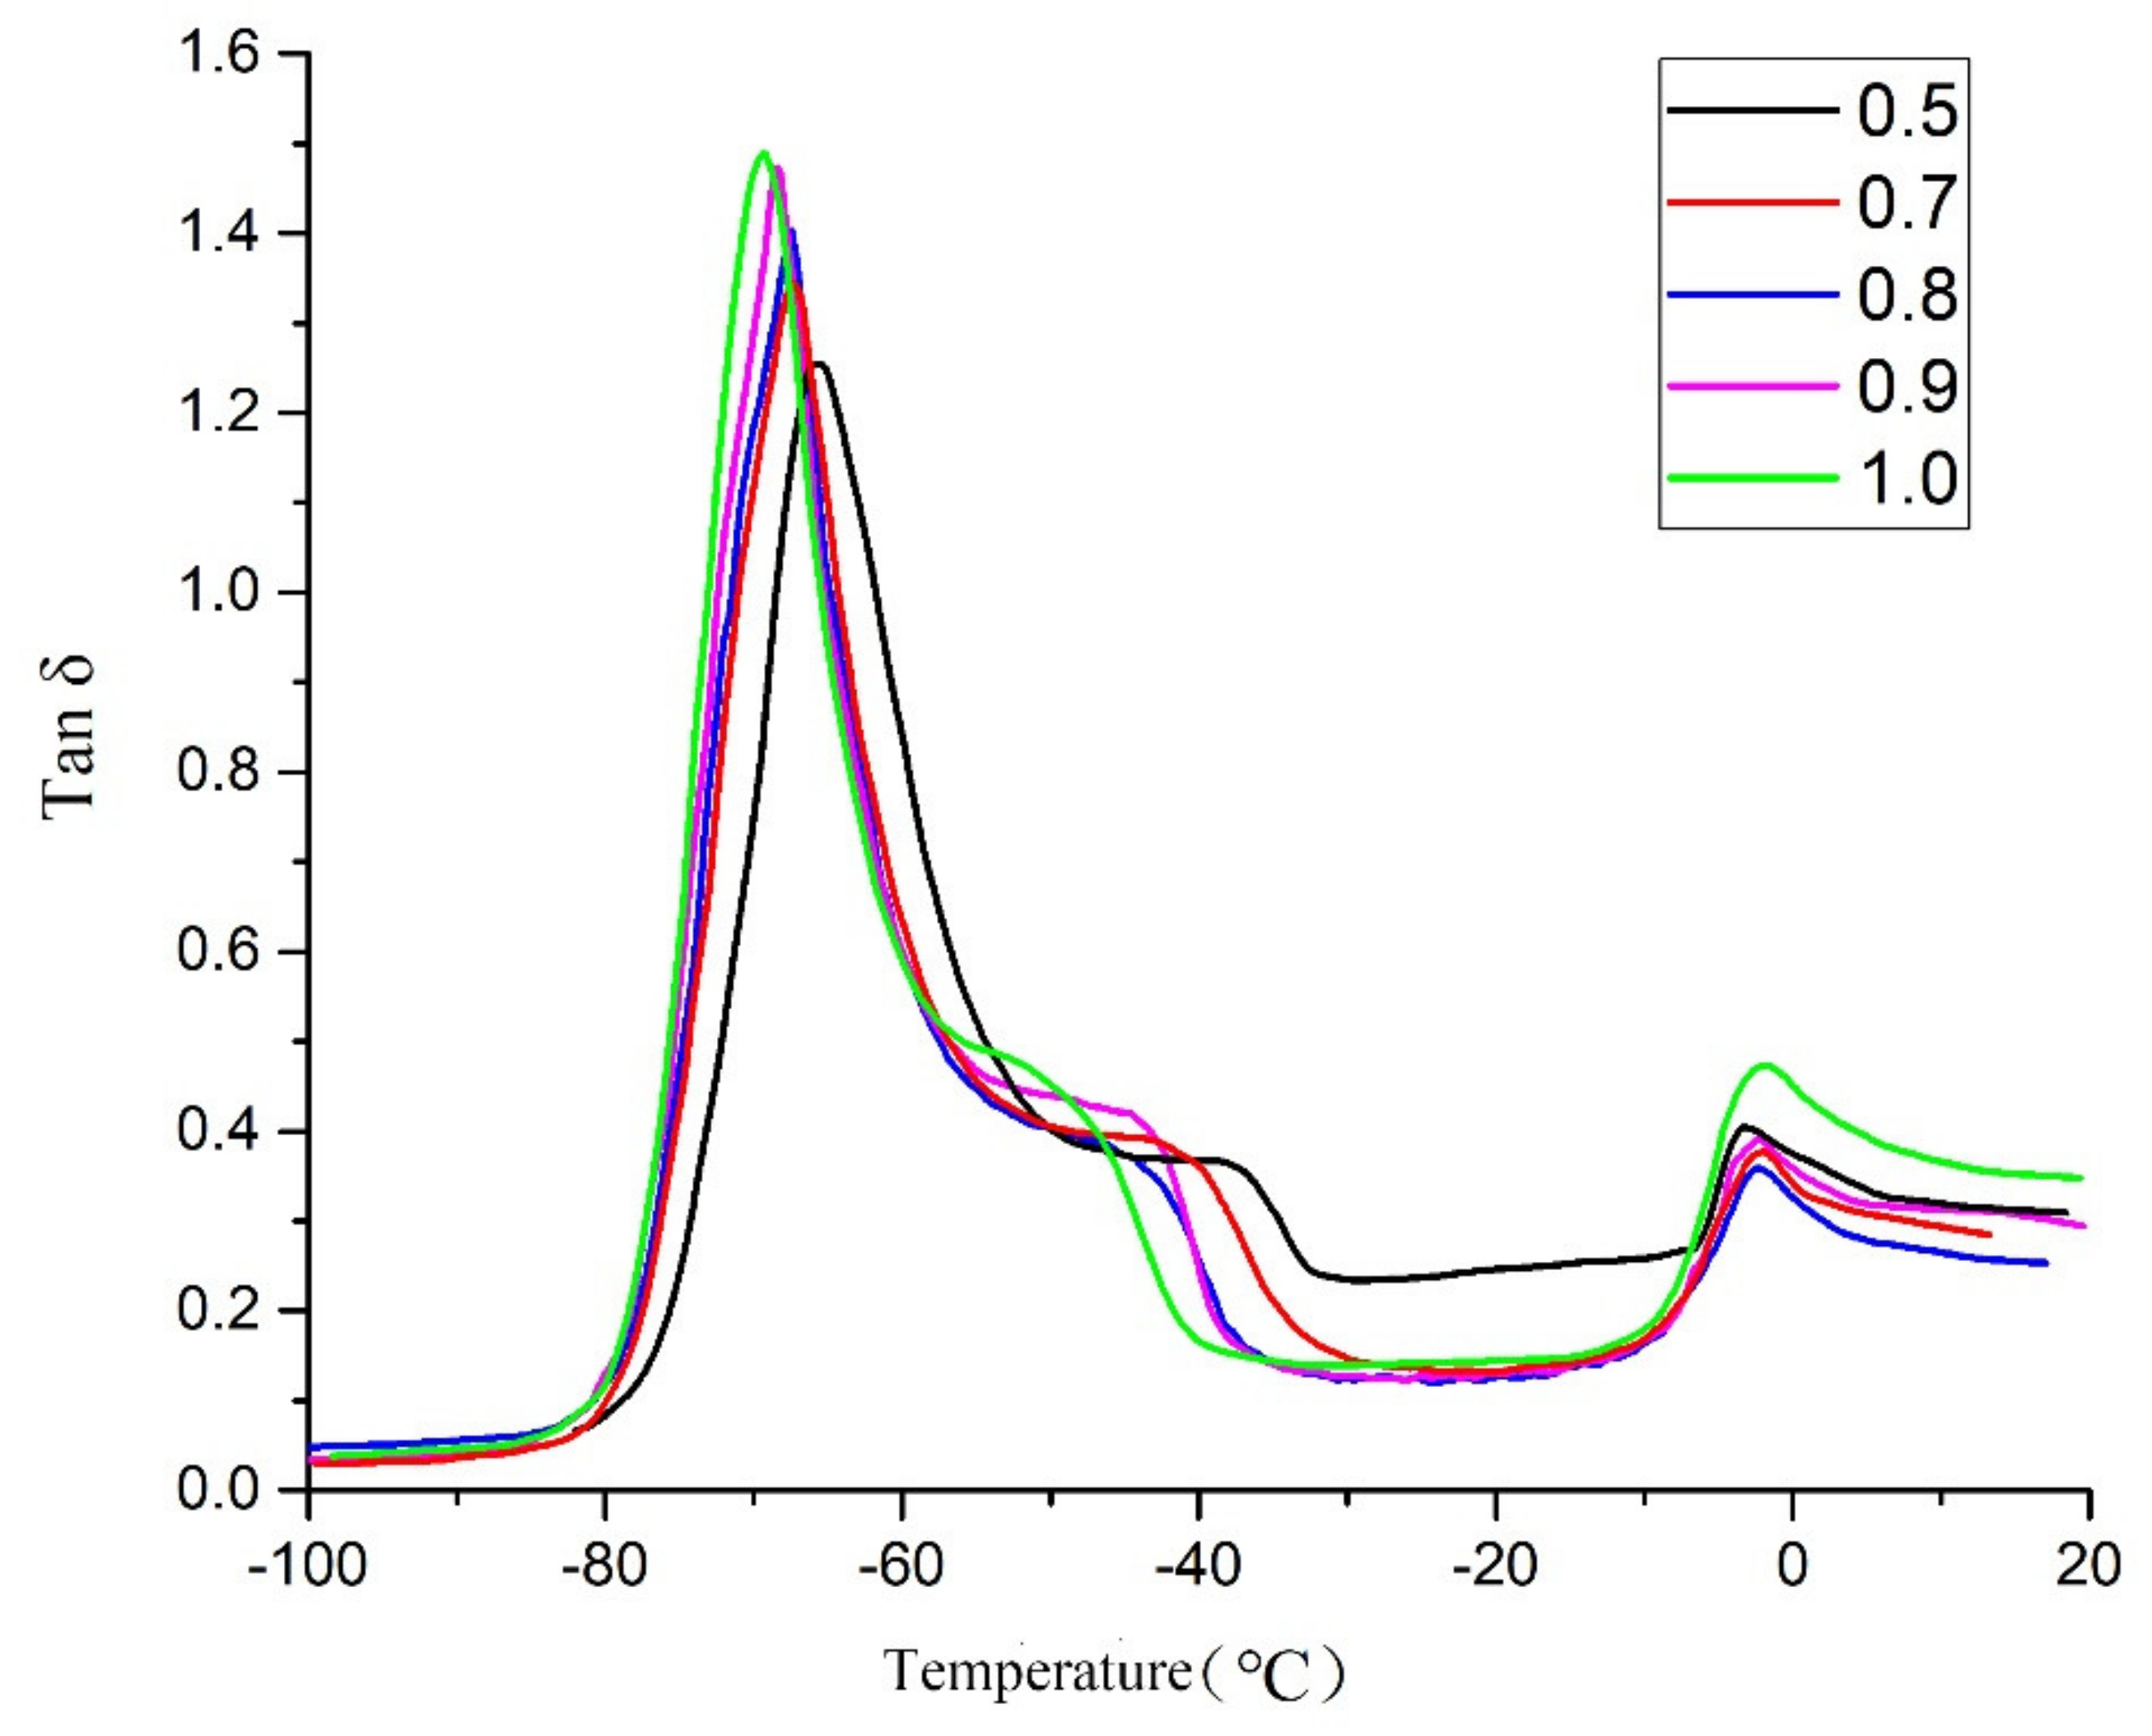
The volume swelling curves of the polytriazole elastomers are shown in Figure 4. The parameters of the network structure are listed in Table 2. Initially, the slopes of the volume expansion curves are steep and the swelling rates are high. In time, the swelling rates gradually decrease, and by 700 min, qv remains substantially unchanged. As can be seen from the curve, as R increases, qv also increases. In Figure 4, there is a crossover between sample S3 and sample S4. The reason is that sample S3 has a little crack, which causes the early swelling rate to be greater than sample S4.
The equilibrium swelling ratios (qv) of the elastomers can be calculated by assuming the additivity of volumes, using Equation (1). Based on the value of qv of polymers, the volume fractions (V2m) in the swollen elastomers can be calculated using Equation (2). The Flory-Huggins interaction parameter between the polymer and solvent (χ1) can also be evaluated by the Bristow-Watson equation, Equation (3). Thus, the apparent number of average molecular weights (Mc) of elastomer strands can be further evaluated according to the Flory-Huggins theory (Equation (4)). Furthermore, the apparent cross-linking densities (N0) also can be determined by using Equation (5).
q v = 1 + ( w w 0 1 ) ρ 2 ρ 1 ,
V 2 m = 1 q v ,
χ 1 = 0.34 + V ( δ s δ p ) 2 / RT ,
M c = V ρ ( V 2 m 1 3 V 2 m 2 ) / [ ln 1 V 2 m + V 2 m + χ 1 V 2 m 2 ,
N 0 = ρ / M c ,
where w0 is the mass of the sample before swelling, w represents the mass of the specimen after swelling, and ρ1 and ρ2 are the densities of the solvent and the polymer, respectively, V is the molar volume of toluene solvent (106.4 cm3 · mol−1), R is the gas constant, T is the absolute temperature, ρ denotes the density of the elastomer, and δS and δP are the solubility parameters of the elastomer and the solvent, respectively, which are found to be 19.2 (J · cm−3)1/2 and 18.2 (J · cm−3)1/2 [20]. The calculated structural parameters of PTPET-based elastomers are also listed in Table 2.
For samples S1–S5, Mc increases from 7201.1 to 10,416.5 g mol−1, and N0 decreases from 0.143 to 0.102 mmol cm−3 with increasing R value. For the cross-linked elastomer, the stress and modulus are proportional to the density of network chains N0, and the rate of migration of the solvent within is inversely proportional to N0 [21]. As for sample S1, Mc is at a minimum, N0 is at a maximum, and the network structure is optimal. In a sense, the cross-linked network structure of sample S1 is the most regular. Correspondingly, the greater apparent average molecular weight Mc benefits the tensile strain [19], and it can be inferred that, for the polytriazole elastomers tested here, when R increases, the elongation tends to increase.

2.4. DMA

The following parameters were obtained: storage and loss modulus (E′ and E′′ respectively) and loss factor (tan δ = E′′/E′). The temperature of the main peak of the loss factor in DMA is taken to represent Tg. Storage and loss modulus values of five samples were compared in Figure 5, and the loss factors in Figure 6. These figures show that Tg is around −70 to −65 °C. As R increases, Tg decreases slightly because the number of branched chains is reduced. If the number of branched chains is reduced, the time taken from formation to full movement is relatively short and the increased density of cross-linking can also increase Tg, which can also be explained as the larger the R value, the poorer the regularity of the cross-linked network (overall, Tg did not change to any significant extent).
In the temperature range from −50 to −30 °C, the storage modulus and loss modulus increase at the same time, and simultaneously, a small plateau region appears in the tan δ curve in the corresponding temperature range and then decreases. One of the reasons for this phenomenon is the presence of hanging chains [13]. Both tetrahydrofuran homopolymer and ethylene oxide homopolymer are easily crystallized. When the two components are randomly copolymerized, there will be a local high concentration of a certain component, thereby forming partial crystals [22]. The presence of hanging chains, and the probability of a high local concentration of a certain component on the hanging chains mean that, when the temperature rises to a certain value, the copolymer will crystallize locally. Therefore, both storage modulus and loss modulus will increase, and a small platform area will appear in the tan δ curve. As the temperature continues to increase, the crystalline region melts, so the storage modulus and loss modulus decrease, and tan δ decreases. In a polymer, the higher crystallinity leads to a higher melting point. Thus, the larger the R value, the lower the temperature at which the energy storage and the loss modulus begin to change, and the lower the initial temperature of the tan δ plateau region.
The main reasons for this phenomenon are: first, because the various R values are different, the numbers of hanging chains in the samples are also different; second, the crystallinity and crystallization temperature are affected by the degree of cross-linking. When R = 1, specimens contain the largest number of dangling chains, and the degree of cross-linking is low, so the temperature at which it starts to crystallize is the lowest, so it starts to crystallize first. As R decreases, the initial crystallization temperature increases. When the temperature continues to increase, the storage modulus and loss modulus gradually decrease, and this process is the crystalline melting process. Eventually, melting ends at around −5 °C and the process can be seen in Figure 5 and Figure 6.

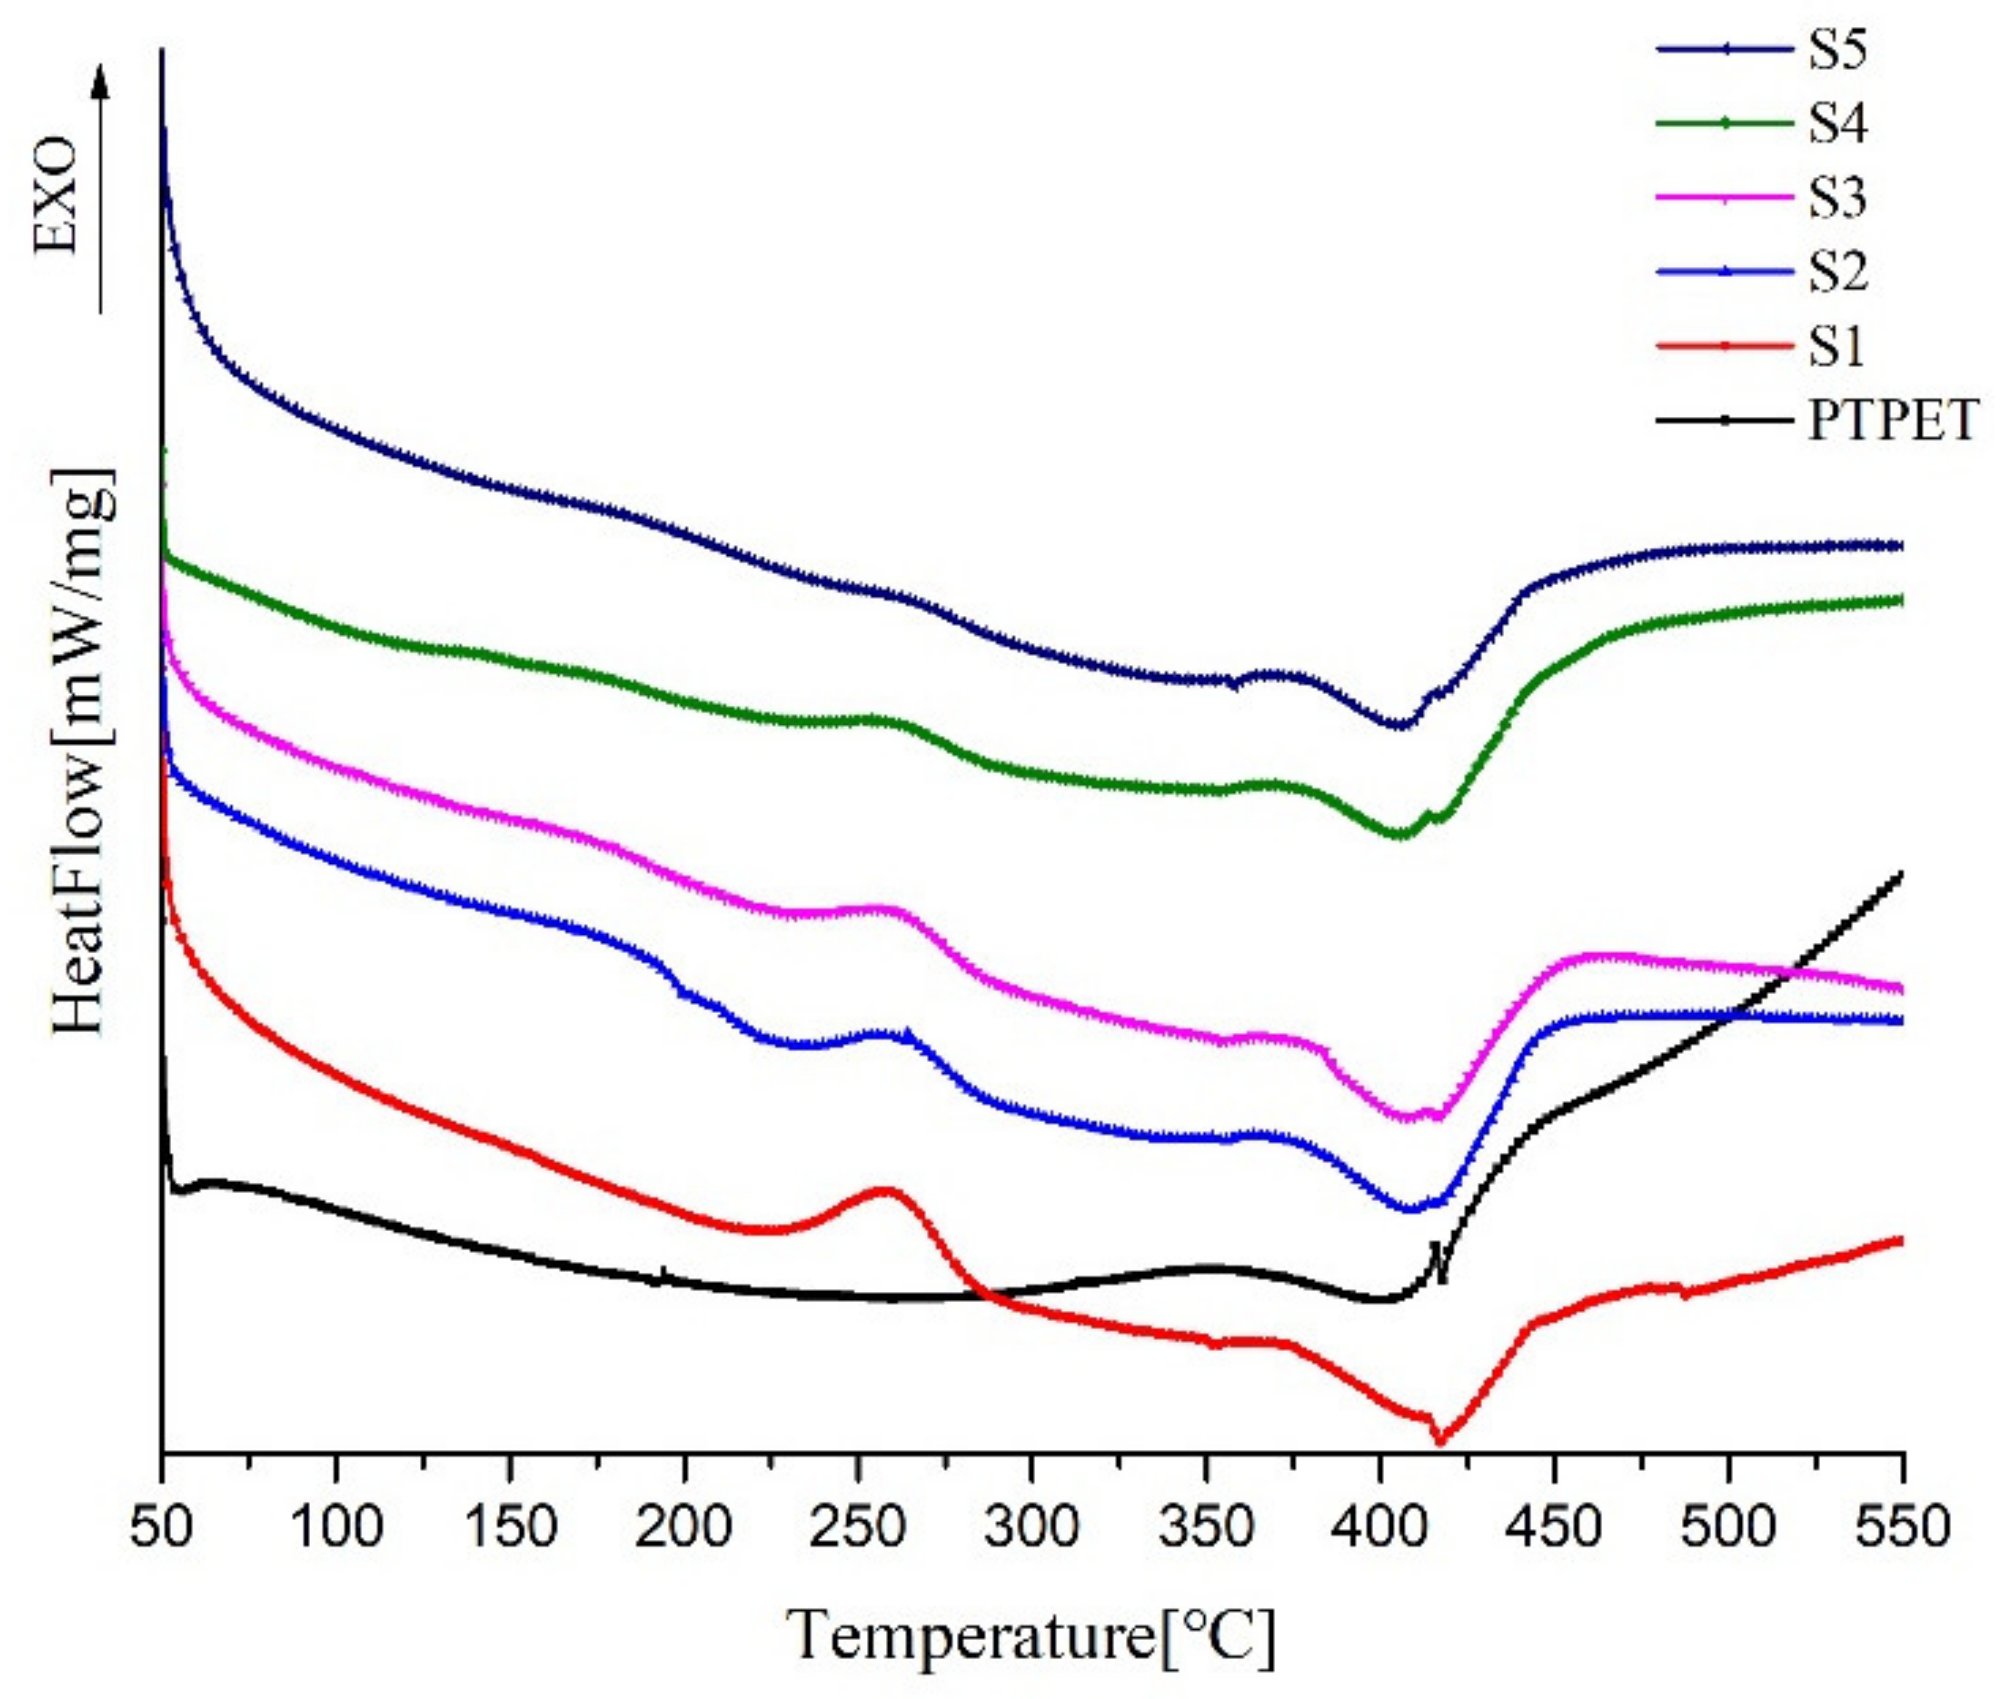
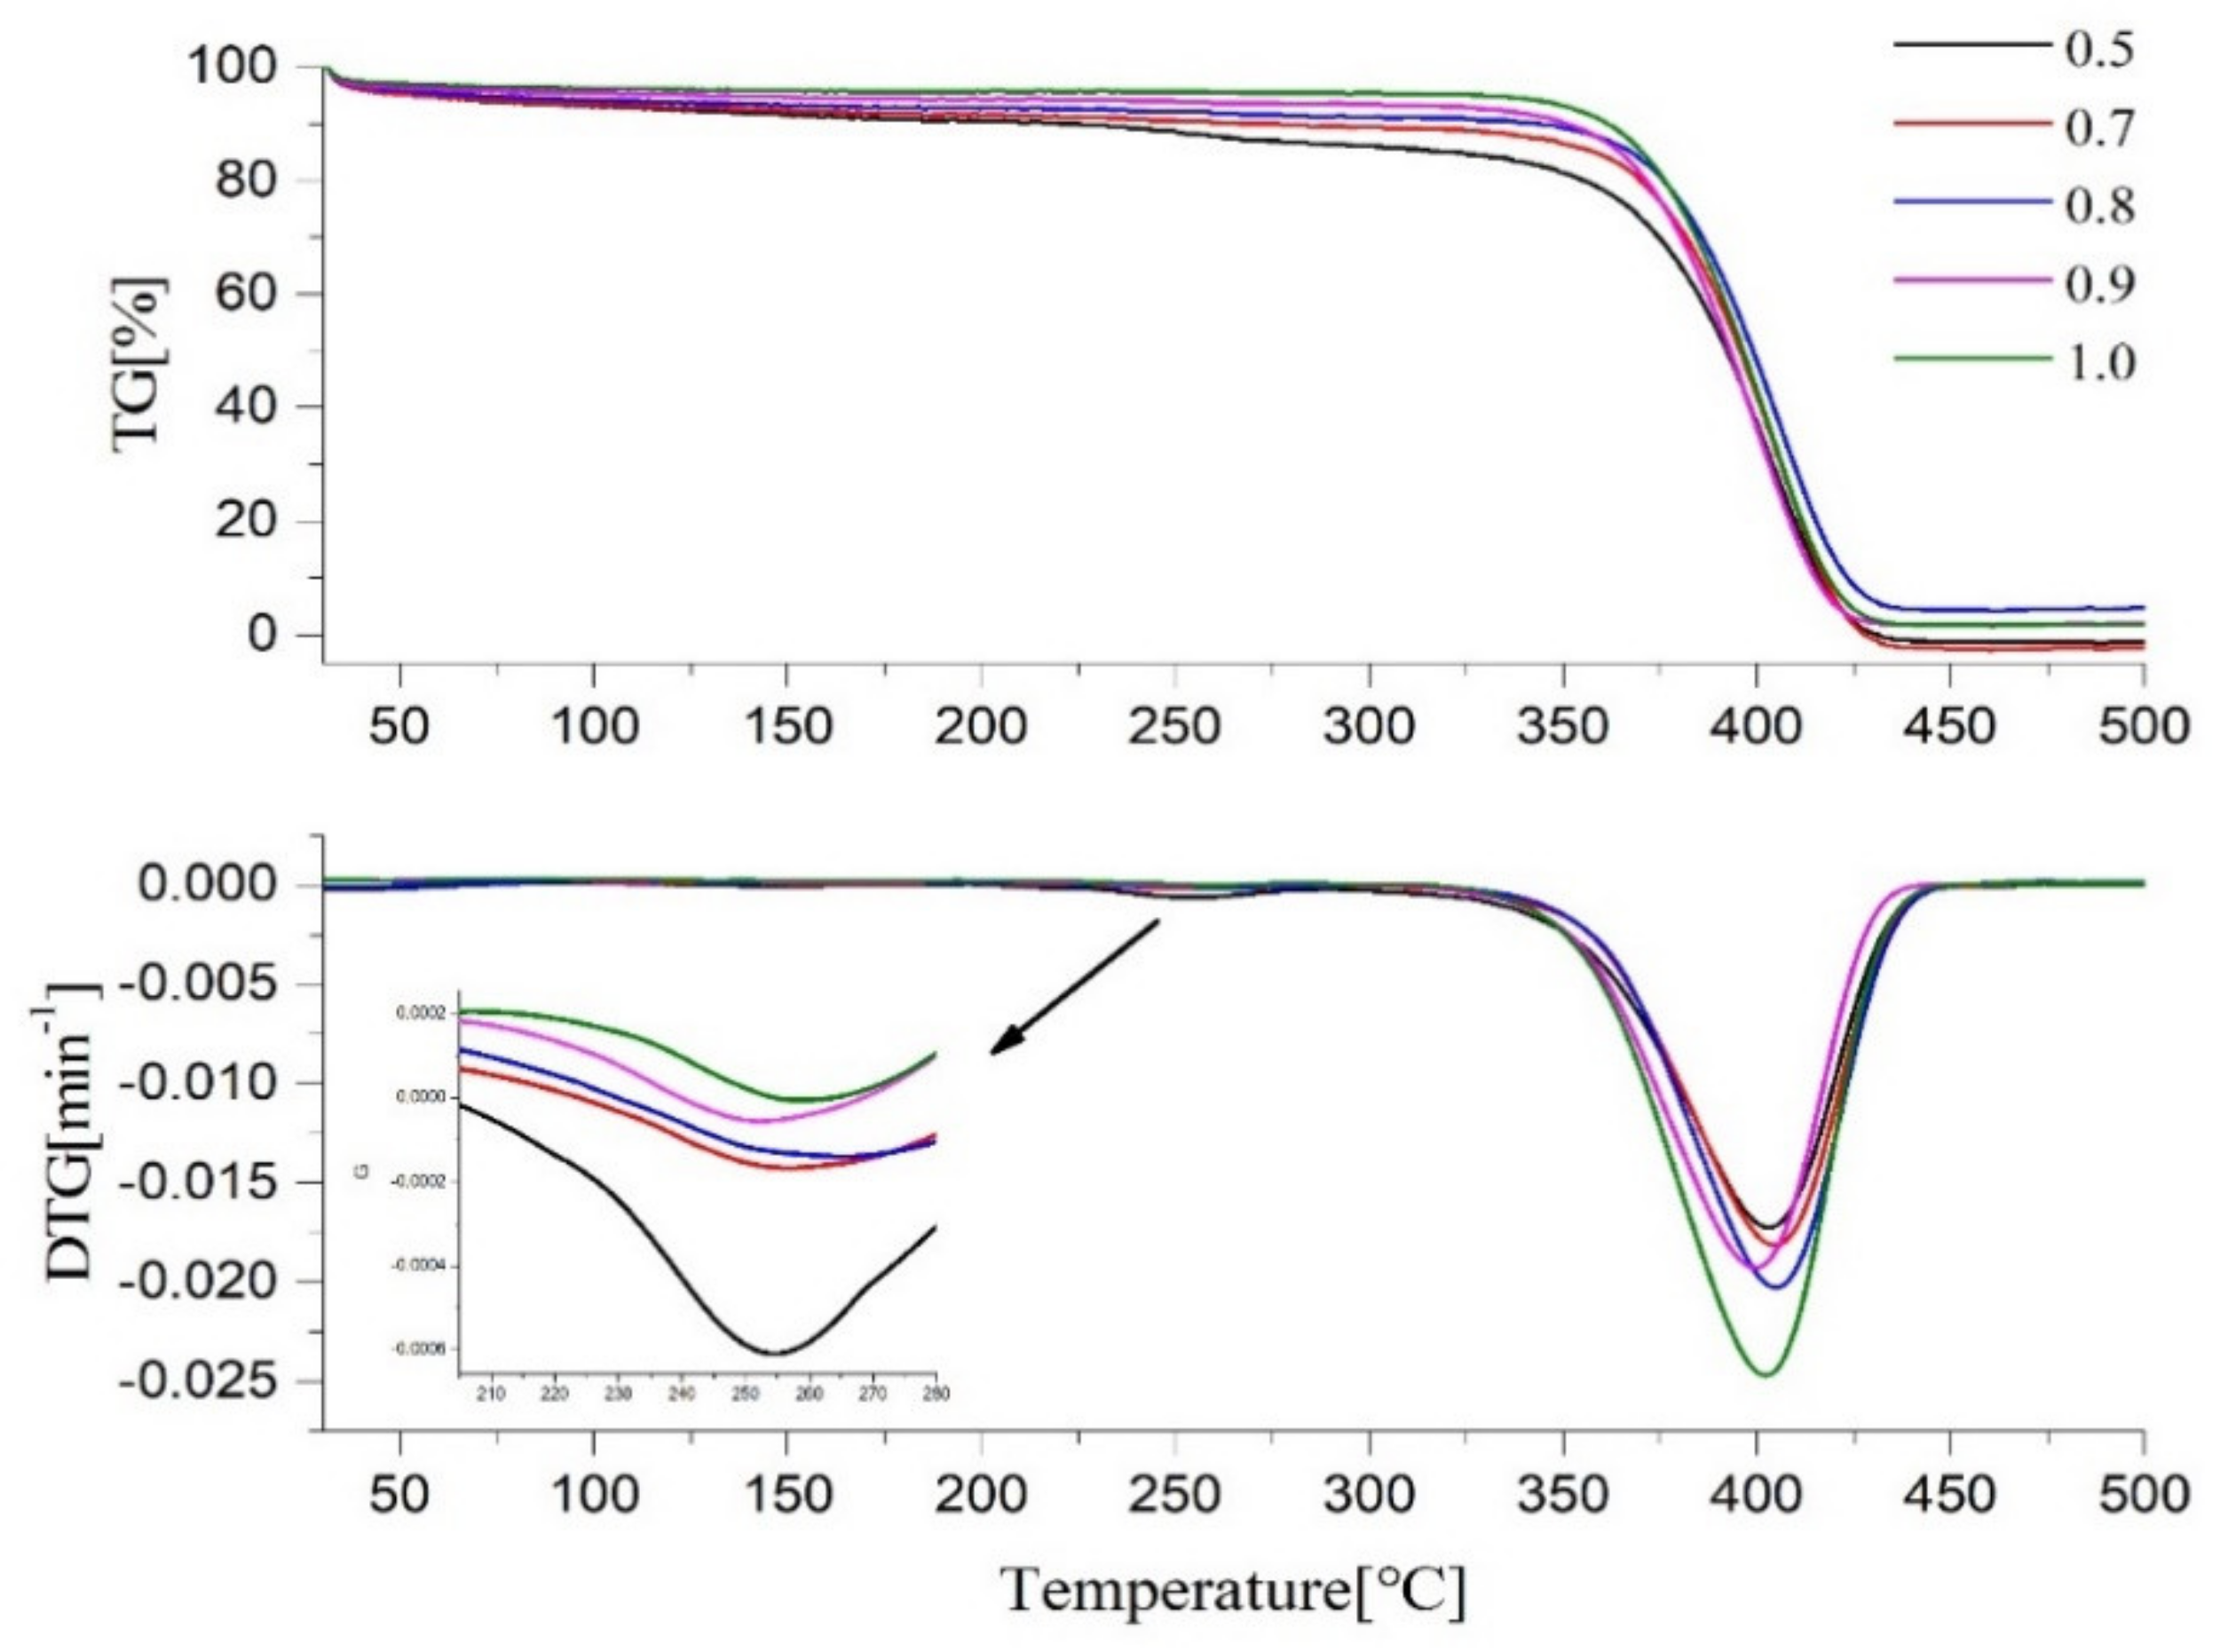
2.5. Thermal Performance

The DSC curves of the five samples are shown in Figure 7. There are several peaks in every curve and temperature of peaks (Table 3). The first typical DSC curve shows the exothermic event with a maximum amplitude at around 258 °C that can be associated with the decomposition of the azide groups to nitrogen molecules. The theoretical calculated values of azide content of the prepared elastomers are listed in Table 4. As R increases, the peak area decreases gradually because the -N3 content decreases therewith. When R = 1.0, the peak does not completely disappear, indicating that -N3 is not fully involved in the click chemical reaction; thus, when R = 1.0, there should be a small amount of hanging chain inside, which is consistent with the result arising from DMA. The change in the R value does not markedly affect the peak temperature change of the azide group.
Compared to the DSC curve of PTPET, all samples have a slight endothermic peak at temperatures of between 352 and 358 ℃, which is the endothermic peak of the ester-bond cleavage at the upper end of the GAP chain [23].
The TG/DTG curves of the five samples are shown in Figure 8. Combined with TG/DTG, it can be seen that, when the R value is small, there are two mass loss peaks. The first is the exothermic decomposition of -N3 at T = 258 °C, resulting in a mass loss; with the increase of the R value, the mass loss value decreases. When R = 1, the mass loss at this region is not zero, and there is still a slight mass loss peak, demonstrating that the click reaction proceeds (albeit incompletely) and a small amount of hanging chains remain. The second mass loss peak starts at around 350 °C and reaches a maximum at 404 ± 1.5 °C, ending at around 450 °C. The mass loss includes the CH2-N bond between the methylene group and the triazole ring being thermally broken; the triazole ring is thermally decomposed to release N2, and the break of the ether bond and aliphatic bond occurs in the polymer backbone [24].
As the temperature increased to 500 °C, there remained 5% to 10% mass residue, which suggested that the decomposition of triazole required a higher temperature to decompose [1,2]. This may be because the main chain is surrounded by a triazole ring, and the strong interaction between the molecules creates a so-called “jacket” effect that protects the main chain from heat, thereby improving stability [25]. Therefore, the decomposition temperature of the triazole ring should be in a higher temperature range, indicating that the triazole polyether has strong thermal stability.

3. Experimental Work

3.1. Materials

The following chemicals were used: low-molecular-weight ester-terminated glycidyl azide polymer (GAP Mn = 800), ethylene oxide-tetrahydrofuran random copolymer (PET, Mn = 4200, functionality = 2) (Luoyang Liming Chemical Research Institute, Luoyang, China); tetrahydrofuran (THF) (AR, Sinopharm Chemical Reagent Co., Ltd., Shanghai, China); potassium tert-butoxide, concentration = 98% (Shanghai Aladdin Biochemical Technology Co., Ltd., Shanghai, China); propargyl bromide, (AR (containing 0.3% MgO), Henan Wanjia Shouhua Biotechnology Co., Ltd., Zhenzhou, China); toluene (AR, Tianjin Shentai Chemical Reagent Co., Ltd., Tianjin, China).

3.2. Instrument and Analysis

We performed FTIR using Bruker Vertex 70 instruments; 1H NMR was performed using a Bruker Minispec MQ; DSC (DSC 1) and TG (TGA 1) were performed using instruments from Mettler Toledo, Greifensee, Switzerland; dynamic mechanical analysis (DMA 1, Mettler Toledo, Switzerland) was carried out at 1 Hz and a programmed heating rate of 5 K · min−1 in tension mode (measurements were taken over a temperature range from −100 °C to 20 °C).

3.3. Swelling Test

Swelling measurements were carried out in toluene at 20 °C, and the volume fraction of the elastomers was determined gravimetrically. Small pieces of elastomer (about 0.15 g, 10 mm × 5 mm × 3 mm) were immersed in toluene, and the swollen gels were removed from the solvent at different times, quickly blotted with dry filter paper, and weighed until the mass change was less than 0.01 g.

3.4. Preparation of PTPET

We dissolved 20 g of PET in 100 mL of THF in a single-port flask, and 1.4 g of potassium t-butoxide was weighed and dissolved in 50 mL of THF. The reaction flask was placed in an ice bath for half an hour, then 1.2 mL of propyne bromide was added dropwise to the flask, while being agitated on a magnetic stirrer, then placed in a water bath at 30 °C, magnetically stirred, condensed, and refluxed for 48 h. Afterwards, we washed the resulting mixture with saturated brine and deionized water: firstly at 75:25, secondly at 50:50, then at 100:0 before dispensing the fluid through a separating funnel. Finally, the organic layer thus obtained was placed in an oven at 50 °C until the THF was completely removed, after which a light golden liquid was obtained.

3.5. Curing of PTPET with GAP

The R value is the equivalent ratio of the prepolymer functional group and the cross-linker functional group (R = [alkyne]/[azide]). According to the requirement of the R value, PTPET and GAP were weighed and mixed by stirring at room temperature until a homogeneous mixture was formed. The schematic diagram of the chemical reaction is shown in Figure 9. The curing process was free of copper. The mixtures were poured into molds, then placed overnight at normal temperature and pressure to discharge bubbles. Finally, we put the molds into an oven for 7 days at 60 °C. The theoretical values of azide content of the polytriazole elastomers and GAP are listed in Table 4.

4. Conclusions

The terminal hydroxyl group PET was modified to a propargyl group by functional group modification and the desired PTPET was obtained. The results of FTIR and 1H NMR proved that the product was PTPET. The PTPET and GAP were cured without the use of a catalyst by using a click reaction for 7 d at 60 °C to obtain the samples. Through tensile testing, when R = 0.5, the tensile strength could reach 0.332 MPa and elongation at break was 897.1%. After that, the tensile strength and elongation of the samples decreased as R increased. The results of DMA show that the Tg of samples were around −70 to −65 °C, and a small amount of crystallization appeared between −50 and −30 °C. Through DSC and TG experiments, when R was small, the decomposition peak of -N3 was found at 258 °C, the main mass loss started at 350 °C and reached its maximum at about 404 °C, mainly as a result of the breaking of the ether bond and aliphatic bond in the polymer backbone. When the temperature reached 500 °C, there remained 5% to 10% mass residue, which suggests that the decomposition of triazole required a higher temperature. Therefore, the thermal properties of the polytriazole elastomer were stable.
In general, the elastomer has good thermal stability, excellent elongation, and low glass transition temperature. It can be considered for use as a rocket composite propellant binder.

Author Contributions

Conceptualization, L.H.; formal analysis, L.H. and Y.W.; methodology, L.H. and J.Z.; investigation, J.Z.; supervision, Z.M. and C.C. All authors have read and agreed to the published version of the manuscript.

Funding

This research was funded by the Damage Technology Key Laboratory Open Foundation (Grant No.DXMBJJ201805).

Conflicts of Interest

The authors declare no conflict of interest.

References

  1. Zhang, Q.; Liu, N.; Mo, H.; Lu, X.; Wang, Y.; Xu, M.; Shu, Y. Facile Preparation and Properties of Crosslinked Copolyether Elastomers with 1,2,3-Triazole and Urethane Subunit via Click Polymerization. ChemistryOpen 2019, 8, 571–579. [Google Scholar] [CrossRef] [PubMed] [Green Version]
  2. Reshmi, S.K.; Vijayalakshmi, K.P.; Thomas, D.; Arunan, E.; Reghunadhan Nair, C.P. Glycidyl Azide Polymer Crosslinked Through Triazoles by Click Chemistry: Curing, Mechanical and Thermal Properties. Propell. Explos. Pyrot. 2013, 38, 525–532. [Google Scholar] [CrossRef]
  3. Liu, E.-C.; Topczewski, J.J. Enantioselective Copper Catalyzed Alkyne-Azide Cycloaddition by Dynamic Kinetic Resolution. J. Am. Chem. Soc. 2019, 141, 5135–5138. [Google Scholar] [CrossRef] [PubMed]
  4. Qu, Z.Y.; Zhai, J.X. Synthesis and curing of terminal alkynyl polyethylene glycol. Chin. J. Explos. Propell. 2016, 33, 61–64. [Google Scholar]
  5. Guan, X.; Li, J.M. Study on the mechanical properties of GAP propellant by azido-alkynyl click chemistry. Chem. Propell. Polym. Mater. 2012, 10, 75–78. [Google Scholar]
  6. Gong, L.; Yang, R.J. Thermal degradation of polyether polytriazole and polyether polyurethane elastomer. Chin. J. Energetic Materia 2018, 26, 565–571. [Google Scholar]
  7. Zhu, L.; Zhang, H.; Wang, C.; Chen, Z. Recent Progress in the Synthesis of N2-Substituted 1, 2, 3-Triazoles. Chin. J. Org. Chem. 2018, 38, 1052–1064. [Google Scholar] [CrossRef]
  8. Qi, Y.X. Research progress in modification of hydroxyl terminated polybutadiene. New Chem. Mater. 2014, 42, 1–9. [Google Scholar]
  9. Fu, X.-L.; Fan, X.-Z. Curing reaction kinetics of HTPE polymer studied by simultaneous rheometry and FTIR measurements. J. Therm. Anal. Calorim. 2016, 125, 977–982. [Google Scholar] [CrossRef]
  10. Lemos, M.F.; Bohn, M.A. DMA of polyester-based polyurethane elastomers for composite rocket propellants containing different energetic plasticizers. J. Therm. Anal. Calorim. 2016, 131, 595–600. [Google Scholar] [CrossRef]
  11. Kolb, H.C.; Finn, M.G.; Sharpless, K.B. Click Chemistry: Diverse Chemical Function from a Few Good Reactions. Angew. Chem. Int. Edit. 2001, 40, 2004–2021. [Google Scholar] [CrossRef]
  12. Hagen, T.H.; Jensen, T.L.; Unneberg, E.; Stenstrøm, Y.H.; Kristensen, T.E. Curing of Glycidyl Azide Polymer (GAP) Diol Using Isocyanate, Isocyanate-Free, Synchronous Dual, and Sequential Dual Curing Systems. Propell. Explos. Pyrot. 2014, 40, 275–284. [Google Scholar] [CrossRef]
  13. Qu, Z.; Zhai, J.; Yang, R. Comparison between properties of polyether polytriazole elastomers and polyether polyurethane elastomers. Polym. Adv. Technol. 2014, 25, 314–321. [Google Scholar] [CrossRef]
  14. Reed, R., Jr. Triazole cross-linked polymers. U.S. Patent 6,103,029, 23 June 1997. [Google Scholar]
  15. Li, X.; Bai, G.; Chen, L. Study on curing reaction kinetics of propargyl triazine with GAP. Chem. Propell. Polym. Mater. 2014, 12, 36–39. [Google Scholar]
  16. Frankel, M.B.; Grant, L.R.; Flanagan, J.E. Historical development of glycidyl azide polymer. J. Propuls. Power 1992, 8, 560–563. [Google Scholar] [CrossRef]
  17. Keicher, T.; Kuglstatter, W.; Eisele, S.; Wetzel, T.; Krause, H. Isocyanate-Free Curing of Glycidyl Azide Polymer (GAP) with Bis-Propargyl-Succinate (II). Propell. Explos. Pyrot. 2009, 34, 210–217. [Google Scholar] [CrossRef]
  18. Xu, Z.; Du, L.; Wan, L.; Huang, F. Novel Functional Polytriazole Elastomer with Thermal Stability and Adjustable Mechanical Properties. Soft Mater. 2013, 11, 353–362. [Google Scholar] [CrossRef]
  19. Lee, D.-H.; Kim, K.T.; Jang, Y.; Lee, S.; Jeon, H.B.; Paik, H.; Kim, W. 1,2,3-triazole crosslinked polymers as binders for solid rocket propellants. J. Appl. Polym. Sci. 2004, 131, 40594. [Google Scholar] [CrossRef]
  20. Urayama, K.; Kawamura, T.; Kohjiya, S. Structure–mechanical property correlations of model siloxane elastomers with controlled network topology. Polymer 2009, 50, 347–356. [Google Scholar] [CrossRef] [Green Version]
  21. Van Krevelen, D.W.; Te Nijenhuis, K. Properties of Polymers: Their Correlation with Chemical Structure; Their Numerical Estimation and Prediction from Additive Group Contributions; Elsevier: Amsterdam, The Netherlands, 2009. [Google Scholar]
  22. Wunderlich, B. Theory of Cold Crystallization of High Polymers. J. Chem. Phys. 1958, 29, 1395–1404. [Google Scholar] [CrossRef]
  23. Stephen, R.; Joseph, K.; Oommen, Z.; Thomas, S. Molecular transport of aromatic solvents through microcomposites of natural rubber (NR), carboxylated styrene butadiene rubber (XSBR) and their blends. Compos. Sci. Technol. 2007, 67, 1187–1194. [Google Scholar] [CrossRef]
  24. Zhang, L.; Wang, L.Q. Epoxy resin modified polytriazole adhesive. J. Mater. Sci. Eng. 2018, 36, 0788–0794. [Google Scholar]
  25. Kweon, J.-O.; Lee, Y.-K.; Noh, S.-T. Synthesis and thermal behavior of poly (ethylene oxide) poly (N-substituted urethane). J. Polym. Sci. Pol. Chem. 2001, 39, 4129–4138. [Google Scholar] [CrossRef]
Sample Availability: Samples of all tested compounds are available from the authors.
Figure 1. FTIR spectra of PET and PTPET. PET, ethylene oxide-tetrahydrofuran copolymer; PTPET, propargyl-terminated ethylene oxide-tetrahydrofuran copolymer.
Molecules 25 01988 g001
Figure 2. 1H NMR spectra of PET and PTPET.
Molecules 25 01988 g002
Figure 3. Mechanical properties: effect of R value for polytriazole elastomers S0–S5.
Molecules 25 01988 g003
Figure 4. Volume swelling curves of S1–S5.
Molecules 25 01988 g004
Figure 5. Storage and loss modulus of S1–S5.
Molecules 25 01988 g005
Figure 6. The tan δ curves of S1–S5.
Molecules 25 01988 g006
Figure 7. DSC curves of PTPET and S1–S5.
Molecules 25 01988 g007
Figure 8. TG curves of PTPET and S1–S5.
Molecules 25 01988 g008
Figure 9. The reaction mechanism of azide and alkynyl.
Molecules 25 01988 g009
Table 1. Mechanical properties of polytriazole elastomers.
SampleR ValueTensile Strength,
σb/MPa
Elongation, εb/%
S00.30.262808.9
S10.50.332897.1
S20.70.312258.7
S30.80.3085250.3
S40.90.305327.1
S51.00.277410.2
Table 2. Structural parameters of PTPET-based elastomers.
Sample.R Valueχ1QvV2mρ
g · cm−3
Mc
g · mol−1
N0
mmol · cm−3
S10.50.38310.9960.0911.0297201.10.143
S20.711.3400.0881.0917925.10.138
S30.812.3480.0811.0488449.70.124
S40.913.1360.0761.1099630.40.115
S51.014.5810.0691.05910416.50.102
Table 3. Peak temperature of DSC curves.
Samples1st Peak/℃2nd Peak/℃3rd Peak/℃
PTPET----416.0
S1258.4352.7414.0
S2258.8355.4413.7
S3259.2354.0414.0
S4259.4353.1414.0
S5260.5358.0414.8
Table 4. The theoretical values of azide content of the polytriazole elastomers.
SampleElastomersGAP
R = 0.3R = 0.5R = 0.7R = 0.8R = 1.0
Azide content
(by weight)
4.0%1.9%0.9%0.5%037.0%

