
Carbon and Nitrogen Isotope Ratios of Food and Beverage in Brazil

 , , ,
, , ,  , , ,
, , ,
Abstract
:1. Introduction
2. Results
2.1. Plants Used as Food
2.2. Meats
2.3. Processed Food
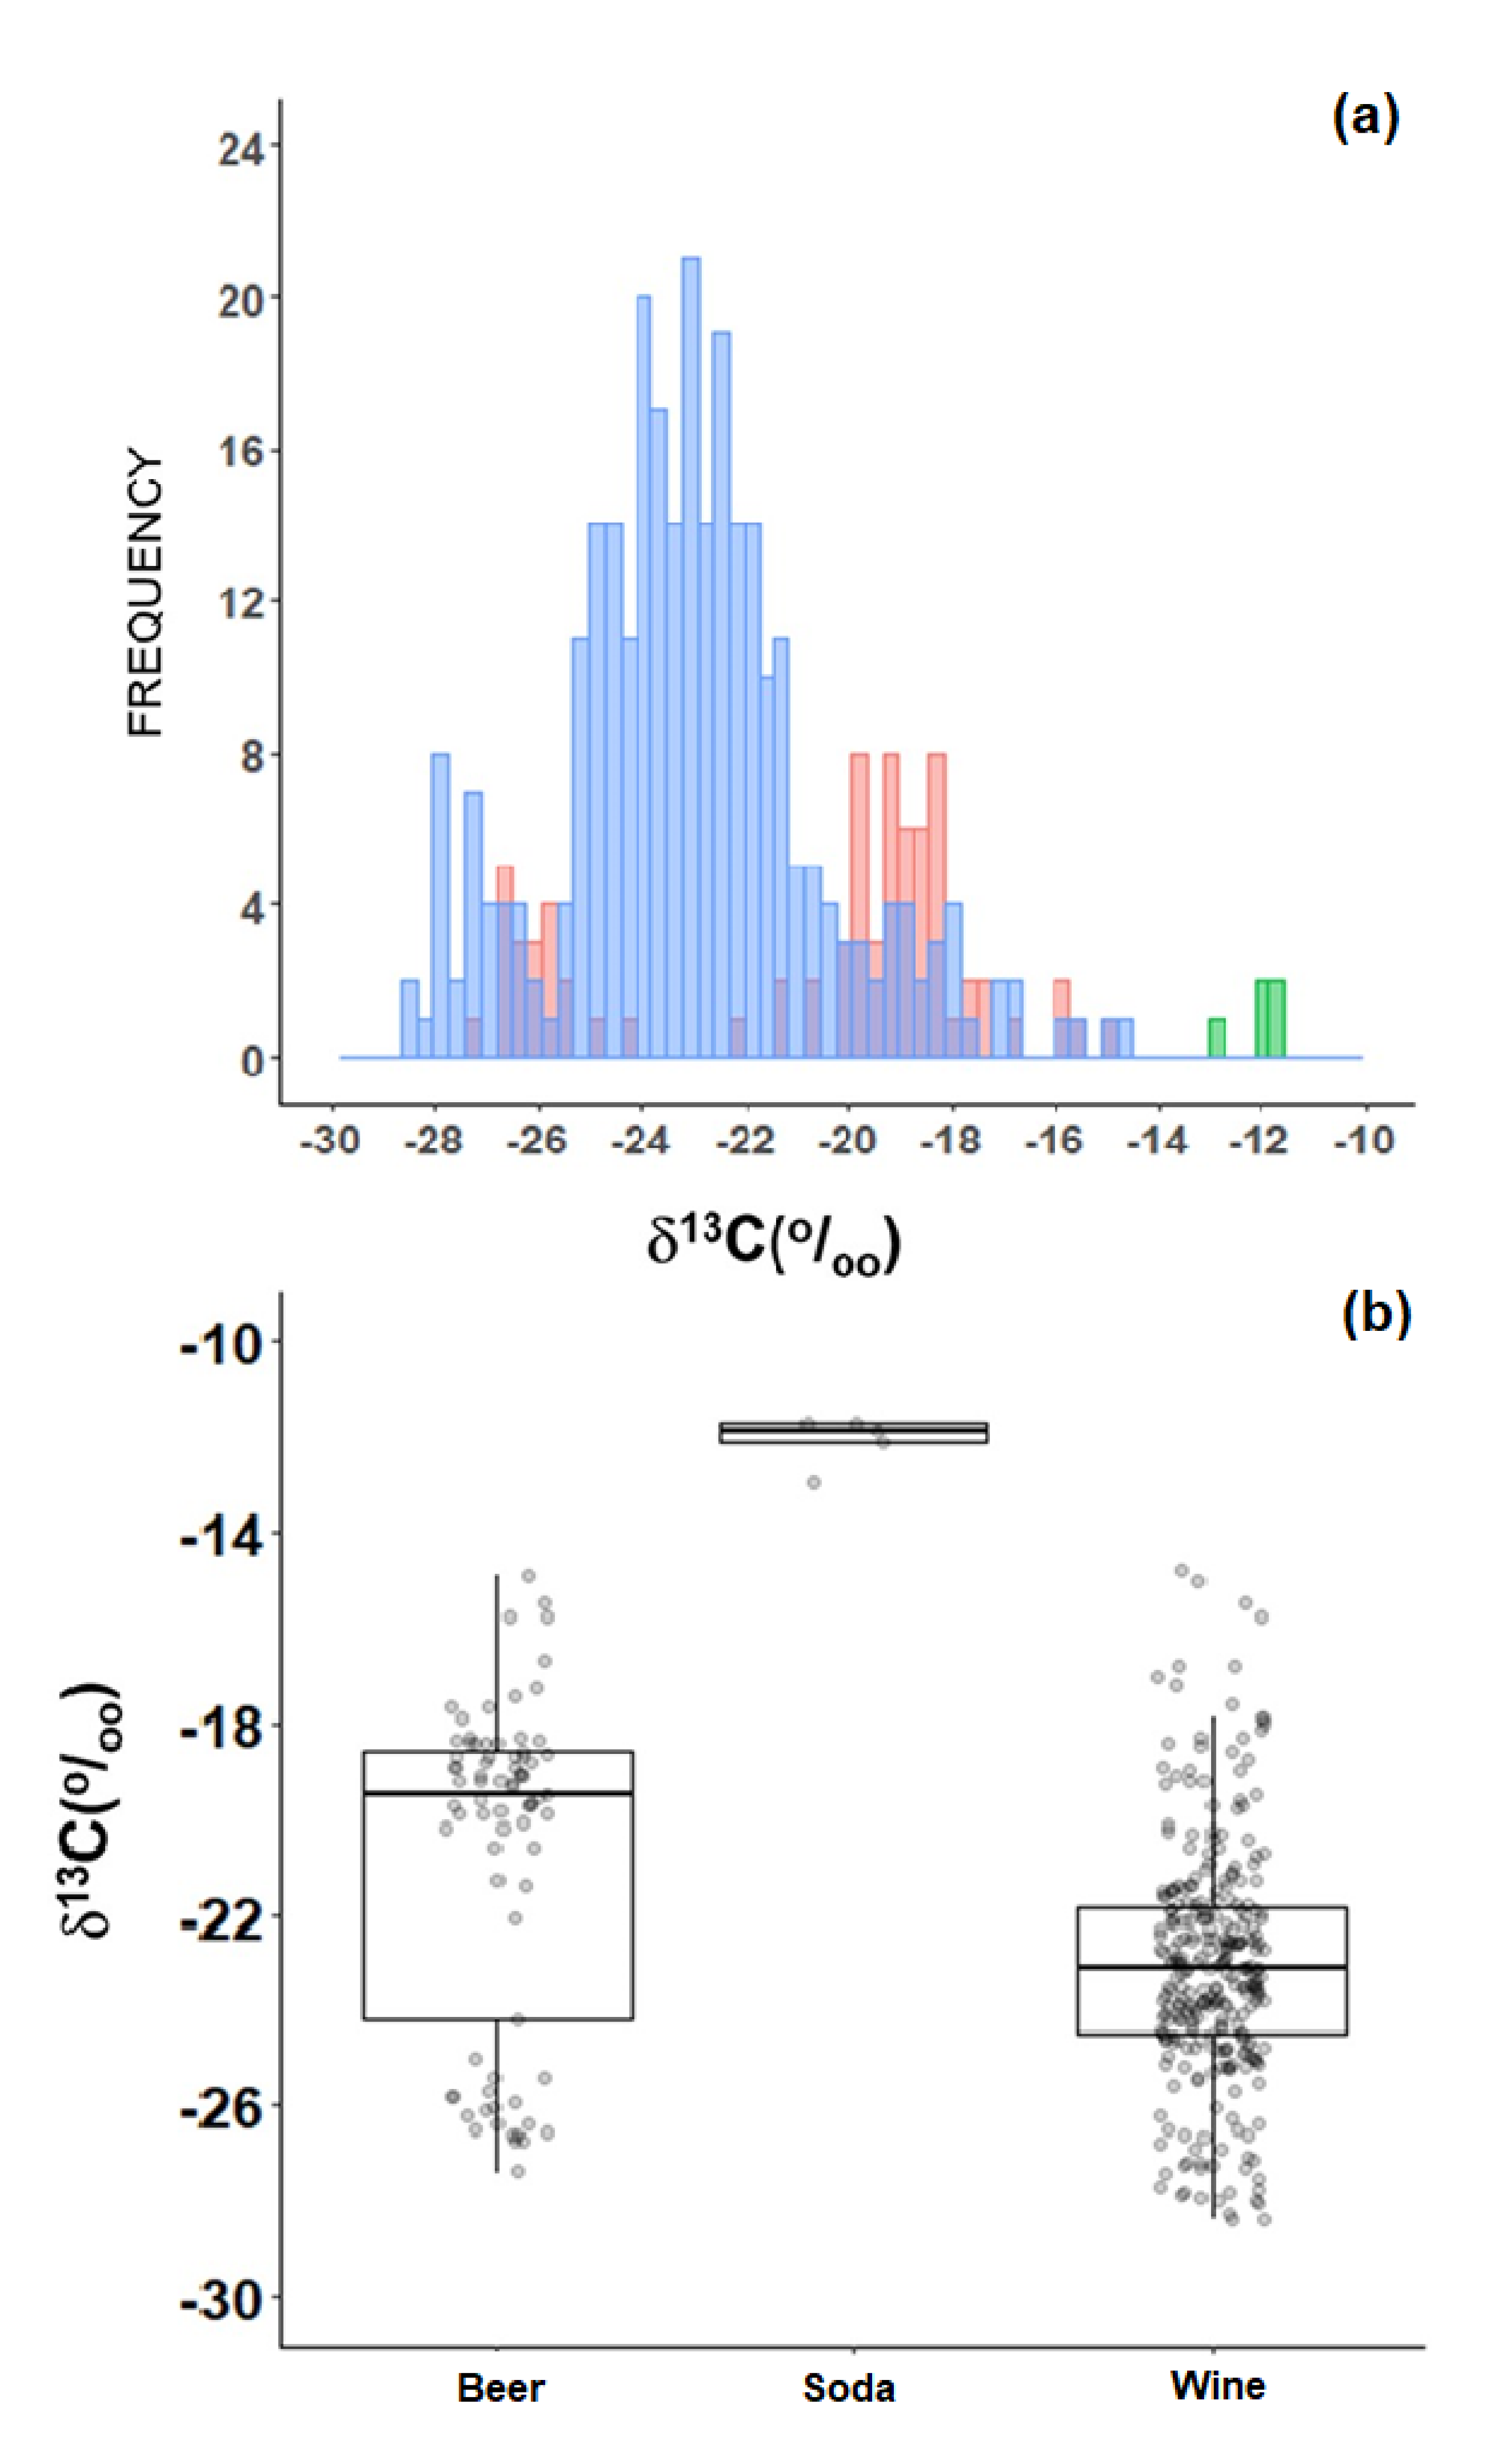
2.4. Beverages
3. Discussion
4. Methods
4.1. Sampling Protocol
4.2. Isotopic Analysis
4.3. Statistical Analysis
Supplementary Materials
Author Contributions
Funding
Acknowledgments
Conflicts of Interest
References
- Monteiro, C.A.; Moura, E.C.; Conde, W.L.; Popkin, B.M. Public health reviews socioeconomic status and obesity in adult populations of developing countries: A review. Bull. World Health Organ. 2004, 82, 940–946. [Google Scholar] [PubMed]
- Popkin, B.M.; Gordon-Larsen, P. The nutrition transition: Worldwide obesity dynamics and their determinants. Int. J. Obes. Relat. Metab. Disord. 2004, 28, S2–S9. [Google Scholar] [CrossRef] [PubMed] [Green Version]
- Carter, J.; Chesson, L.A. Food Forensics: Stable Isotopes as a Guide to Authenticity and Origin, 1st ed.; CRC Press: Boca Raton, FL, USA, 2017. [Google Scholar]
- Tibola, C.S.; da Silva, S.A.; Dossa, A.A.; Patrício, D.I. Economically motivated food fraud and adulteration in Brazil: Incidents and alternatives to minimize occurrence. J. Food Sci. 2018, 83, 2028–2038. [Google Scholar] [CrossRef] [Green Version]
- Mardegan, S.F.; Andrade, T.M.B.; de Sousa Neto, E.R.; de Castro Vasconcellos, E.B.; Martins, L.F.B.; Mendonça, T.G.; Martinelli, L.A. Stable carbon isotopic composition of Brazilian beers-A comparison between large- and small-scale breweries. J. Food Compos. Anal. 2013, 29, 52–57. [Google Scholar] [CrossRef]
- Martinelli, L.A.; Moreira, M.Z.; Ometto, J.P.H.B.; Alcarde, A.R.; Rizzon, L.A.; Stange, E.; Ehleringer, J.R. Stable carbon isotopic composition of the wine and CO2-bubbles of sparkling wines: Detecting C4 sugar additions. J. Agric. Food Chem. 2003, 51, 2625–2631. [Google Scholar] [CrossRef]
- Morais, M.C.; Pellegrinetti, T.A.; Sturion, L.C.; Sattolo, T.M.S.; Martinelli, L.A. Stable carbon isotopic composition indicates large presence of maize in Brazilian soy sauces (shoyu). J. Food Compos. Anal. 2018, 70, 18–21. [Google Scholar] [CrossRef]
- Ducatti, R.; Pinto, J.P.D.A.N.; Sartori, M.M.P.; Ducatti, C. Quantification of soy protein using the isotope method (δ13C and δ15N) for commercial brands of beef hamburger. Meat Sci. 2016, 122, 97–100. [Google Scholar] [CrossRef]
- Coletta, L.D.; Pereira, A.L.; Coelho, A.A.D.; Savino, V.J.M.; Menten, J.F.M.; Correr, E.; Frana, L.C.; Martinelli, L.A. Barn vs. free-range chickens: Differences in their diets determined by stable isotopes. Food Chem. 2012, 131. [Google Scholar] [CrossRef] [Green Version]
- Sage, R.F. The evolution of C4 photosynthesis. New Phytol. 2004, 341–370. [Google Scholar] [CrossRef]
- Still, C.J.; Berry, J.A.; Collatz, G.J.; Defries, R.S. Global distribution of C3 and C4 vegetation: Carbon cycle implications. Global Biogeochem. Cycles 2003, 17, 1006. [Google Scholar] [CrossRef]
- Sage, R.F.; Stata, M. Photosynthetic diversity meets biodiversity: The C4 plant example. J. Plant Physiol. 2015, 172, 104–119. [Google Scholar] [CrossRef]
- Perry, L.; Sandweiss, D.H.; Piperno, D.R.; Rademaker, K.; Malpass, M.A.; Vera, P.D. Early maize agriculture and interzonal interaction in. Nature 2006, 440, 76–79. [Google Scholar] [CrossRef]
- van der Merwe, N.J.; Tschauner, H. C4 Plants and the development of human societies. In C4 Plant Biology; Sage, R.F., Monson, K.M., Eds.; CRC Press: San Diego, CA, USA, 1999; pp. 509–549. [Google Scholar]
- Andrews, J. Diffusion of Mesoamerican food complex to southeastern Europe. Geogr. Rev. 1993, 83, 194–204. [Google Scholar] [CrossRef]
- Zerjal, C.M.T.; Dumas, V.C.F.; Bedoya, D.M.C. Out of America: Tracing the genetic footprints of the global diffusion of maize. Theor. Appl. Genet. 2013, 126, 2671–2682. [Google Scholar]
- Cherniwchan, J.; Moreno-cruz, J. Maize and precolonial Africa. J. Dev. Econ. 2019, 136, 137–150. [Google Scholar] [CrossRef]
- Martinelli, L.A.; Nardoto, G.B.; Chesson, L.A.; Rinaldi, F.D.; Ometto, J.P.H.B.; Cerling, T.E.; Ehleringer, J.R. Worldwide stable carbon and nitrogen isotopes of Big Mac® patties: An example of a truly “glocal” food. Food Chem. 2011, 127, 1712–1718. [Google Scholar] [CrossRef]
- Högberg, P. 15N natural abundance in soil-plant systems. New Phytol. 1997, 137, 179–203. [Google Scholar] [CrossRef]
- Robinson, D. δ15N as an integrator of the nitrogen cycle. Trends Ecol. Evol. 2001, 16, 153–162. [Google Scholar] [CrossRef]
- Yoneyama, T.; Kouno, K.; Yazaki, J. Variation of natural N abundance of crops and soils in Japan with special reference to the effect of soil conditions and fertilizer application. Soil Sci. Plant Nutr. 1990, 36, 667–675. [Google Scholar] [CrossRef]
- Bateman, A.S.; Kelly, S.D. Fertilizer nitrogen isotope signatures. Isot. Environ. Health Stud. 2007, 43, 237–247. [Google Scholar] [CrossRef]
- Nishida, M. Natural 15N abundance can aid the discrimination of organic and conventional rice. JARQ 2018, 52, 173–180. [Google Scholar] [CrossRef]
- Minagawa, M.; Wada, E. Stepwise enrichment of N along food chains; Further evidence and the relation between delta 15N and animal age. Geochim. Cosmochim. Acta 1984, 48, 1135–1140. [Google Scholar] [CrossRef]
- Nardoto, G.B.; Silva, S.; Kendall, C.; Ehleringer, J.R.; Chesson, L.A.; Ferraz, E.S.B.; Moreira, M.Z.; Ometto, J.P.H.B.; Martinelli, L.A. Geographical patterns of human diet derived from stable-isotope analysis of fingernails. Am. J. Phys. Anthropol. 2006, 131, 137–146. [Google Scholar] [CrossRef] [PubMed]
- DeNiro, M.J.; Epstein, S. Influence of diet on the distribution of carbon isotopes in animals. Geochim. Cosmochim. Acta 1978, 42, 495–506. [Google Scholar] [CrossRef]
- DeNiro, M.J.; Epstein, S. Influence of diet on the distribution of nitrogen isotopes in animals. Geochim. Cosmochim. Acta 1981, 45, 341–351. [Google Scholar] [CrossRef]
- Sponheimer, M.; Alemseged, Z.; Cerling, T.E.; Grine, F.E.; Kimbel, W.H.; Leakey, M.G.; Lee-Thorp, J.A.; Manthi, F.K.; Reed, K.E.; Wood, B.A.; et al. Isotopic evidence of early hominin diets. Proc. Natl. Acad. Sci. USA 2013, 110, 10513–10518. [Google Scholar] [CrossRef] [Green Version]
- Minagawa, M. Reconstruction of human diet from σ13C and σ15N in contemporary Japanese hair: A stochastic method for estimating multi-source contribution by double isotopic tracers. Appl. Geochem. 1992, 7, 145–158. [Google Scholar] [CrossRef]
- Thompson, A.H.; Chesson, L.A.; Podlesak, D.W.; Bowen, G.J.; Cerling, T.E.; Ehleringer, J.R. Stable isotope analysis of modern human hair collected from Asia (China, India, Mongolia, and Pakistan). Am. J. Phys. Anthropol. 2010, 141, 440–451. [Google Scholar] [CrossRef]
- Nardoto, G.B.; Murrieta, R.S.S.; Prates, L.E.G.; Adams, C.; Garavello, M.E.P.E.; Schor, T.; Moraes, A.; Rinaldi, F.D.; Gragnani, J.G.; Moura, E.A.F.; et al. Frozen chicken for wild fish: Nutritional transition in the Brazilian Amazon region determined by carbon and nitrogen stable isotope ratios in fingernails. Am. J. Hum. Biol. 2011, 23, 642–650. [Google Scholar] [CrossRef]
- Newsome, S.D.; Maartinez del Rio, C.; Bearhop, S.; Phillips, D.L. A niche for isotopic ecology. Front. Ecol. Environ. 2007, 5, 429–436. [Google Scholar] [CrossRef]
- Brescia, M.A.; Di Martino, G.; Guillou, C.; Reniero, F.; Sacco, A.; Serra, F.; Orabona, V. Differentiation of the geographical origin of durum wheat semolina samples on the basis of isotopic composition. Rapid Commun. Mass Spectrom. 2002, 16, 2286–2290. [Google Scholar] [CrossRef] [PubMed]
- Kelly, S.; Baxter, M.; Chapman, S.; Rhodes, C.; Dennis, J.; Brereton, P. The application of isotopic and elemental analysis to determine the geographical origin of premium long grain rice. Eur. Food Res. Technol. 2002, 214, 72–78. [Google Scholar] [CrossRef]
- Suzuki, Y.; Chikaraishi, Y.; Ogawa, N.O. Geographical origin of polished rice based on multiple element and stable isotope analyses. Food Chem. 2008, 109, 470–475. [Google Scholar] [CrossRef] [PubMed]
- Luo, D.; Dong, H.; Luo, H.; Xian, Y.; Wan, J.; Guo, X.; Wu, Y. The application of stable isotope ratio analysis to determine the geographical origin of wheat. Food Chem. 2015, 174, 197–201. [Google Scholar] [CrossRef] [PubMed]
- Chung, I.; Kim, J.; Lee, K.; Park, S.; Lee, J.; Son, N.; Jin, Y.; Kim, S. Geographic authentication of Asian rice (Oryza sativa L.) using multi- elemental and stable isotopic data combined with multivariate analysis. Food Chem. 2018, 240, 840–849. [Google Scholar] [CrossRef] [PubMed]
- Araus, L.; Ferrio, J.P.; Voltas, J. Agronomic conditions and crop evolution in ancient Near East Agriculture. Nat. Commun. 2014, 5, 3953. [Google Scholar] [CrossRef] [Green Version]
- Shearer, G.; Kohl, D.H.; Virginia, R.A.; Bryan, B.A.; Skeeters, J.L.; Nilsen, E.T.; Sharifi, M.R.; Rundel, P.W. Estimates of N2-fixation from variation in the natural abundance of 15N in Sonoran desert ecosystems. Oecologia 1983, 56, 365–373. [Google Scholar] [CrossRef]
- Szpak, P.; Longstaffe, F.J.; Millaire, J.; White, C.D. Large variation in nitrogen isotopic composition of a fertilized legume. J. Archaeol. Sci. 2014, 45, 72–79. [Google Scholar] [CrossRef]
- Huelsemann, F.; Koehler, K.; Braun, H.; Schaenzer, W.; Flenker, U. Human dietary δ15N intake: Representative data for principle food items. Am. J. Phys. Anthropol. 2013, 152, 58–66. [Google Scholar] [CrossRef]
- Martinelli, L.A.; Piccolo, M.C.; Townsend, A.R.; Vitousek, P.M.; Cuevas, E.; McDowell, W.; Robertson, G.P.; Santos, O.C.; Treseder, K. Nitrogen stable isotopic composition of leaves and soil: Tropical versus temperate forests. Biogeochemistry 1999, 46, 45–65. [Google Scholar] [CrossRef]
- da Costa Louzada, M.L.; Ricardo, C.Z.; Steele, E.M.; Levy, R.B.; Cannon, G.; Monteiro, C.A. The share of ultra-processed foods determines the overall nutritional quality of diets in Brazil. Public Health 2017, 21, 94–102. [Google Scholar]
- Osorio, M.T.; Moloney, A.P.; Schmidt, O.; Monahan, F.J. Multielement Isotope Analysis of bovine muscle for determination of international geographical origin of meat. J. Agric. Food Chem. 2011, 59, 3285–3294. [Google Scholar] [CrossRef] [PubMed]
- Zhao, Y.; Zhang, B.; Chen, G.; Chen, A.; Yang, S.; Ye, Z. Recent developments in application of stable isotope analysis on agro-product authenticity and traceability. Food Chem. 2014, 145, 300–305. [Google Scholar] [CrossRef] [PubMed]
- Camin, F.; Perini, M.; Colombari, G.; Bontempo, L.; Versini, G.; Wiley, J. Influence of dietary composition on the carbon, nitrogen, oxygen and hydrogen stable isotope ratios of milk. Rapid Commun. Mass Spectrom. 2008, 22, 1690–1696. [Google Scholar] [CrossRef] [PubMed]
- Camin, F.; Bontempo, L.; Perini, M.; Piasentier, E. Stable isotope ratio analysis for assessing the authenticity of food of animal origin. Compr. Rev. Food Sci. Food Saf. 2016, 15, 868–877. [Google Scholar] [CrossRef] [Green Version]
- Gribo, J.; Baroni, M. V; Horacek, M.; Wunderlin, D.A.; Monferran, M.V. Multielemental + isotopic fingerprint enables linking soil, water, forage and milk composition, assessing the geographical origin of Argentinean milk. Food Chem. 2019, 283, 549–558. [Google Scholar] [CrossRef] [PubMed]
- González-Martin, I. Use of isotope analysis to characterize meat fromIberian-breed swine. Meat Sci. 1999, 52, 437–441. [Google Scholar] [CrossRef]
- Perini, M.; Camin, F.; Sánchez, J.; Piasentier, E. Effect of origin, breeding and processing conditions on the isotope ratios of bioelements in dry-cured ham. Food Chem. 2013, 136, 1543–1550. [Google Scholar] [CrossRef]
- Camin, F.; Bontempo, L.; Heinrich, K.; Horacek, M.; Kelly, S.D.; Schlicht, C.; Thomas, F.; Monahan, F.J.; Hoogewerff, J.; Rossmann, A. Multi-element (H, C, N, S) stable isotope characteristics of lamb meat from different European regions. Anal. Bioanal. Chem. 2007, 389, 309–320. [Google Scholar] [CrossRef] [Green Version]
- Erasmus, S.W.; Muller, M.; Butler, M.; Hoffman, L.C. The truth is in the isotopes: Authenticating regionally unique South African lamb. Food Chem. 2018, 239, 926–934. [Google Scholar] [CrossRef]
- Castilho-Barros, L.; Owatari, M.S.; Mouriño, J.L.P.; Silva, B.C.; Sei, W.Q. Economic feasibility of tilapia culture in southern Brazil: A small-scale farm model. Aquaculture 2020, 515. [Google Scholar] [CrossRef]
- Hardt, F.A.S.; Cremer, M.J.; Tonello Junior, A.J.; Bellante, A.; Buffa, G.; Buscaino, G.; Mazzola, S.; Barreto, A.S.; Martinelli, L.A.; Zuppi, G.M. Use of carbon and nitrogen stable isotopes to study the feeding ecology of small coastal cetacean populations in southern Brazil. Biota Neotrop. 2013, 13, 90–98. [Google Scholar] [CrossRef] [Green Version]
- Benedito-Cecilio, E.; Araujo-lima, C.M.; Forsberg, B.R.; Bittencourt, M.M.; Martinelli, L.C. Carbon sources of Amazonian fisheries. Fish. Manag. Ecol. 2000, 7, 305–315. [Google Scholar] [CrossRef] [Green Version]
- Newsome, S.D.; Clementz, M.T.; Koch, P.L. Using stable isotope biogeochemistry to study marine mammal ecology. Mar. Mammal Sci. 2010, 26, 509–572. [Google Scholar] [CrossRef]
- Phalan, B.; Balmford, A.; Green, R.E.; Scharlemann, J.P.W. Minimising the harm to biodiversity of producing more food globally. Food Policy 2011, 36, S62–S71. [Google Scholar] [CrossRef]
- Garrett, R.D.; Lambin, E.F.; Naylor, R.L. Land Use Policy Land institutions and supply chain configurations as determinants of soybean planted area and yields in Brazil. Land Use Policy 2013, 31, 385–396. [Google Scholar] [CrossRef]
- Collatz, G.J.; Berry, J.A.; Clark, J.S. Effects of climate and atmospheric CO2 partial pressure on the global distribution of C4 grasses: Present, past, and future. Oecologia 1998, 114, 441–454. [Google Scholar] [CrossRef]
- FAOSTAT. Crops Processed. Available online: http://www.fao.org/faostat/en/#data/QD (accessed on 26 February 2020).
- FAOSTAT. Crops. Available online: http://www.fao.org/faostat/en/#data/QC (accessed on 26 February 2020).
- Murrieta, R. O dilema do papa-chibé: Consumo alimentar, nutrição e práticas de intervenção na Ilha de Ituqui, baixo Amazonas, Pará. Rev. Antropol. 1998, 42, 1–33. [Google Scholar] [CrossRef]
- Schor, T.; Azenha, G.S. Ribeirinho Food Regimes, Socioeconomic inclusion and unsustainable development of the Amazonian floodplain. EchoGéo 2017, 41, 1–14. [Google Scholar] [CrossRef] [Green Version]
- Monteiro, C.A.; Levy, R.B. A new classification of foods based on the extent and purpose of their processing. Cad. Saude Publica 2010, 26, 2039–2049. [Google Scholar] [CrossRef] [PubMed] [Green Version]
- Hothorn, T.; Bretz, F.; Westfall, P. Simultaneous inference in general parametric models. Biom. J. 2008, 50, 346–363. [Google Scholar] [CrossRef] [PubMed] [Green Version]
Sample Availability: Samples of the compounds are available from the authors. |


| δ13C (‰). | Mean | SD | Median | IQR | Min | Max | n |
| Cake | −20.4 | 1.6 | −20.2 | 2.4 | −22.8 | −18.2 | 11 |
| Chocolate-bitter | −26.5 | 2.2 | −26.1 | 2.0 | −31.0 | −24.3 | 19 |
| Chocolate-drink | −14.4 | 1.1 | −14.0 | 0.9 | −17.2 | −13.0 | 18 |
| Chocolate-milk | −22.0 | 0.9 | −22.2 | 1.3 | −23.4 | −20.1 | 28 |
| Chocolate-powder | −18.8 | 2.3 | −19.8 | 2.1 | −20.8 | −14.8 | 6 |
| Chocolate-white | −21.9 | 0.8 | −21.7 | 0.8 | −23.8 | −20.9 | 10 |
| Cocoa powder | −27.8 | 2.3 | −28.3 | 0.7 | −29.1 | −20.5 | 12 |
| Cookie | −23.0 | 0.7 | −23.1 | 0.8 | −23.7 | −21.4 | 12 |
| Fat | −28.9 | 2.0 | −30.1 | 2.6 | −30.5 | −25.4 | 8 |
| Flour | −26.1 | 0.8 | −26.0 | 0.9 | −27.5 | −23.9 | 20 |
| Jam | −15.5 | 4.7 | −13.5 | 2.8 | −26.5 | −11.6 | 33 |
| Juice-powder | −13.0 | 1.1 | −12.7 | 1.5 | −14.7 | −11.8 | 10 |
| Noodles | −26.9 | 0.4 | −27.1 | 0.8 | −27.3 | −26.2 | 9 |
| Oil | −29.5 | 1.3 | −30.0 | 1.5 | −30.8 | −27.4 | 7 |
| Others | −17.7 | 4.5 | −17.9 | 7.6 | −24.2 | −10.9 | 19 |
| Pasta | −25.7 | 0.8 | −26.2 | 1.3 | −26.4 | −24.6 | 5 |
| Pudding | −12.8 | 2.3 | −11.4 | 3.2 | −16.1 | −11.3 | 6 |
| Sauce | −20.3 | 5.6 | −20.0 | 9.9 | −29.8 | −12.3 | 27 |
| Seasoning | −18.0 | 2.8 | −19.5 | 3.3 | −20.3 | −13.7 | 5 |
| Snack | −22.5 | 4.8 | −21.0 | 8.8 | −27.9 | −17.0 | 9 |
| Soda | −12.1 | 0.5 | −11.9 | 0.4 | −13.0 | −11.7 | 5 |
| Soup powder | −21.8 | 2.1 | −22.6 | 1.0 | −23.3 | −17.7 | 6 |
| Stock | −23.8 | 2.5 | −24.6 | 2.4 | −25.7 | −21.0 | 3 |
| Sugar | −12.2 | 0.3 | −12.2 | 0.4 | −13.2 | −11.8 | 15 |
| δ15N (‰) | Mean | SD | Median | IQR | Min | Max | n |
| Cake | 3.7 | 0.3 | 3.6 | 0.1 | 3.3 | 4.3 | 11 |
| Chocolate-bitter | 5.9 | 0.7 | 5.8 | 0.7 | 4.4 | 7.3 | 19 |
| Chocolate-drink | 5.2 | 0.6 | 5.4 | 0.9 | 3.6 | 6.0 | 18 |
| Chocolate-milk | 5.8 | 0.4 | 5.8 | 0.5 | 5.1 | 6.8 | 28 |
| Chocolate-powder | 5.8 | 0.8 | 5.9 | 0.3 | 4.3 | 6.7 | 6 |
| Chocolate-white | 6.0 | 0.6 | 5.9 | 0.4 | 4.9 | 6.8 | 10 |
| Cocoa powder | 5.9 | 0.9 | 6.1 | 1.2 | 3.8 | 6.9 | 12 |
| Cookie | 3.7 | 0.9 | 3.8 | 1.1 | 2.4 | 5.1 | 12 |
| Fat | 2.5 | 2.4 | 3.8 | 2.1 | −0.2 | 4.0 | 8 |
| Flour | 5.2 | 3.4 | 3.6 | 5.5 | 0.9 | 10.7 | 20 |
| Jam | 4.5 | 2.0 | 4.8 | 2.8 | 0.3 | 8.4 | 33 |
| Juice-powder | −0.4 | 2.5 | 0.5 | 1.1 | −5.8 | 1.8 | 10 |
| Noodles | 3.2 | 0.2 | 3.2 | 0.2 | 2.9 | 3.5 | 9 |
| Oil | 2.9 | 5.1 | 2.9 | 3.6 | −0.7 | 6.5 | 7 |
| Others | 2.7 | 2.3 | 2.5 | 2.6 | −0.8 | 7.7 | 19 |
| Pasta | 3.3 | 0.6 | 3.4 | 0.7 | 2.4 | 4.0 | 5 |
| Pudding | 5.9 | 0.1 | 5.9 | 0.1 | 5.8 | 5.9 | 6 |
| Sauce | 2.2 | 2.1 | 1.5 | 3.6 | −1.4 | 5.8 | 27 |
| Seasoning | −2.7 | 2.4 | −3.1 | 3.2 | −5.1 | 0.7 | 5 |
| Snack | 2.9 | 0.5 | 2.9 | 0.4 | 2.1 | 3.7 | 9 |
| Soda | -a | - | - | - | - | - | - |
| Soup powder | 2.0 | 1.3 | 2.0 | 0.8 | 0.0 | 4.0 | 6 |
| Stock | −3.1 | 3.7 | −3.7 | 3.7 | −6.4 | 0.9 | 3 |
| Sugar | - | - | - | - | - | - | - |
| δ13C (‰) | Mean | SD | Median | IQR | Min | Max | n |
| Cheese | −16.0 | 2.0 | −15.7 | 0.9 | −22.4 | −14.1 | 14 |
| Cream cheese | −18.6 | 1.2 | −18.6 | 1.5 | −20.3 | −17.4 | 5 |
| Dehydrated stock cube | −19.5 | 5.2 | −21.4 | 9.0 | −25.8 | −12.3 | 10 |
| Ice cream | −21.0 | 1.1 | −21.4 | 1.1 | −21.8 | −19.1 | 6 |
| Jello | −12.0 | 0.4 | −12.0 | 0.5 | −12.5 | −11.5 | 6 |
| Lard | −19.9 | 2.8 | −19.8 | 4.7 | −23.4 | −16.6 | 8 |
| Processed meat | −16.8 | 0.9 | −16.9 | 1.0 | −18.5 | −14.6 | 25 |
| Sauce | −19.0 | 5.2 | −19.6 | 8.1 | −27.3 | −13.5 | 11 |
| Seasoning | −18.2 | 3.7 | −17.1 | 5.8 | −23.5 | −14.8 | 6 |
| Soup powder | −20.1 | 2.0 | −20.5 | 3.2 | −22.6 | −16.6 | 12 |
| Yogurt | −17.5 | 2.0 | −17.3 | 1.7 | −21.4 | −14.3 | 13 |
| δ15N (‰) | Mean | SD | Median | IQR | Min | Max | n |
| Cheese | 5.9 | 1.2 | 5.9 | 1.8 | 4.2 | 7.9 | 14 |
| Cream cheese | 5.4 | 0.4 | 5.5 | 0.3 | 4.8 | 5.7 | 5 |
| Dehydrated stock cube | −4.3 | 1.2 | −4.5 | 0.9 | −6.0 | −2.0 | 10 |
| Ice cream | 5.9 | 0.2 | 6.0 | 0.2 | 5.5 | 6.1 | 6 |
| Jello | 7.8 | 0.9 | 8.3 | 1.4 | 6.5 | 8.6 | 6 |
| Lard | 4.3 | 1.1 | 4.0 | 1.0 | 3.3 | 5.9 | 8 |
| Processed meat | 4.2 | 1.7 | 3.8 | 2.8 | 1.8 | 6.7 | 25 |
| Sauce | 2.5 | 2.7 | 2.3 | 3.0 | −1.8 | 6.9 | 11 |
| Seasoning | −2.3 | 2.2 | −3.1 | 3.4 | −4.5 | 0.6 | 6 |
| Soup powder | 1.5 | 1.8 | 1.6 | 2.6 | −2.3 | 4.4 | 12 |
| Yogurt | 5.1 | 0.7 | 5.1 | 1.2 | 4.1 | 6.5 | 13 |
| FAO Group | This Study | Huelsemann et al. (2015) [41] | ||
|---|---|---|---|---|
| δ15N (‰) | n | δ15N (‰) | n | |
| Cereal C3 | 3.7 ± 2.8 | 67 | 3.2 ± 1.3 | >128 |
| Cereal C4 | 4.5 ± 2.6 | 47 | 3.3 ± 1.9 | 57 |
| Fruit | 4.3 ± 3.0 | 81 | 4.6 ± 2.4 | >891 |
| Nuts | 17.3 ± 0.8 | 10 | 2.7 ± 2.1 | 310 |
| Pulse | 2.4 ± 1.7 | 38 | 1.1 ± 1.8 | 109 |
| Tuber | 4.6 ± 2.8 | 45 | 3.1 ± 3.4 | 134 |
| Vegetable * | 4.2 ± 3.5 | 150 | 3.1 ± 3.0 | >990 |
© 2020 by the authors. Licensee MDPI, Basel, Switzerland. This article is an open access article distributed under the terms and conditions of the Creative Commons Attribution (CC BY) license (http://creativecommons.org/licenses/by/4.0/).
Share and Cite
Martinelli, L.A.; Nardoto, G.B.; Perez, M.A.Z.; Junior, G.A.; Fracassi, F.C.; Oliveira, J.G.G.; Ottani, I.S.; Lima, S.H.; Mazzi, E.A.; Gomes, T.F.; et al. Carbon and Nitrogen Isotope Ratios of Food and Beverage in Brazil. Molecules 2020, 25, 1457. https://doi.org/10.3390/molecules25061457
Martinelli LA, Nardoto GB, Perez MAZ, Junior GA, Fracassi FC, Oliveira JGG, Ottani IS, Lima SH, Mazzi EA, Gomes TF, et al. Carbon and Nitrogen Isotope Ratios of Food and Beverage in Brazil. Molecules. 2020; 25(6):1457. https://doi.org/10.3390/molecules25061457
Chicago/Turabian StyleMartinelli, Luiz A., Gabriela B. Nardoto, Maria A. Z. Perez, Geraldo Arruda Junior, Fabiana C. Fracassi, Juliana G. G. Oliveira, Isadora S. Ottani, Sarah H. Lima, Edmar A. Mazzi, Taciana F. Gomes, and et al. 2020. "Carbon and Nitrogen Isotope Ratios of Food and Beverage in Brazil" Molecules 25, no. 6: 1457. https://doi.org/10.3390/molecules25061457