
Ultra-Micro-Scale-Fractionation (UMSF) as a Powerful Tool for Bioactive Molecules Discovery


Abstract
:
1. Introduction
2. Results and Discussion
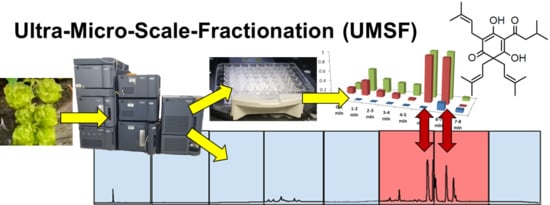
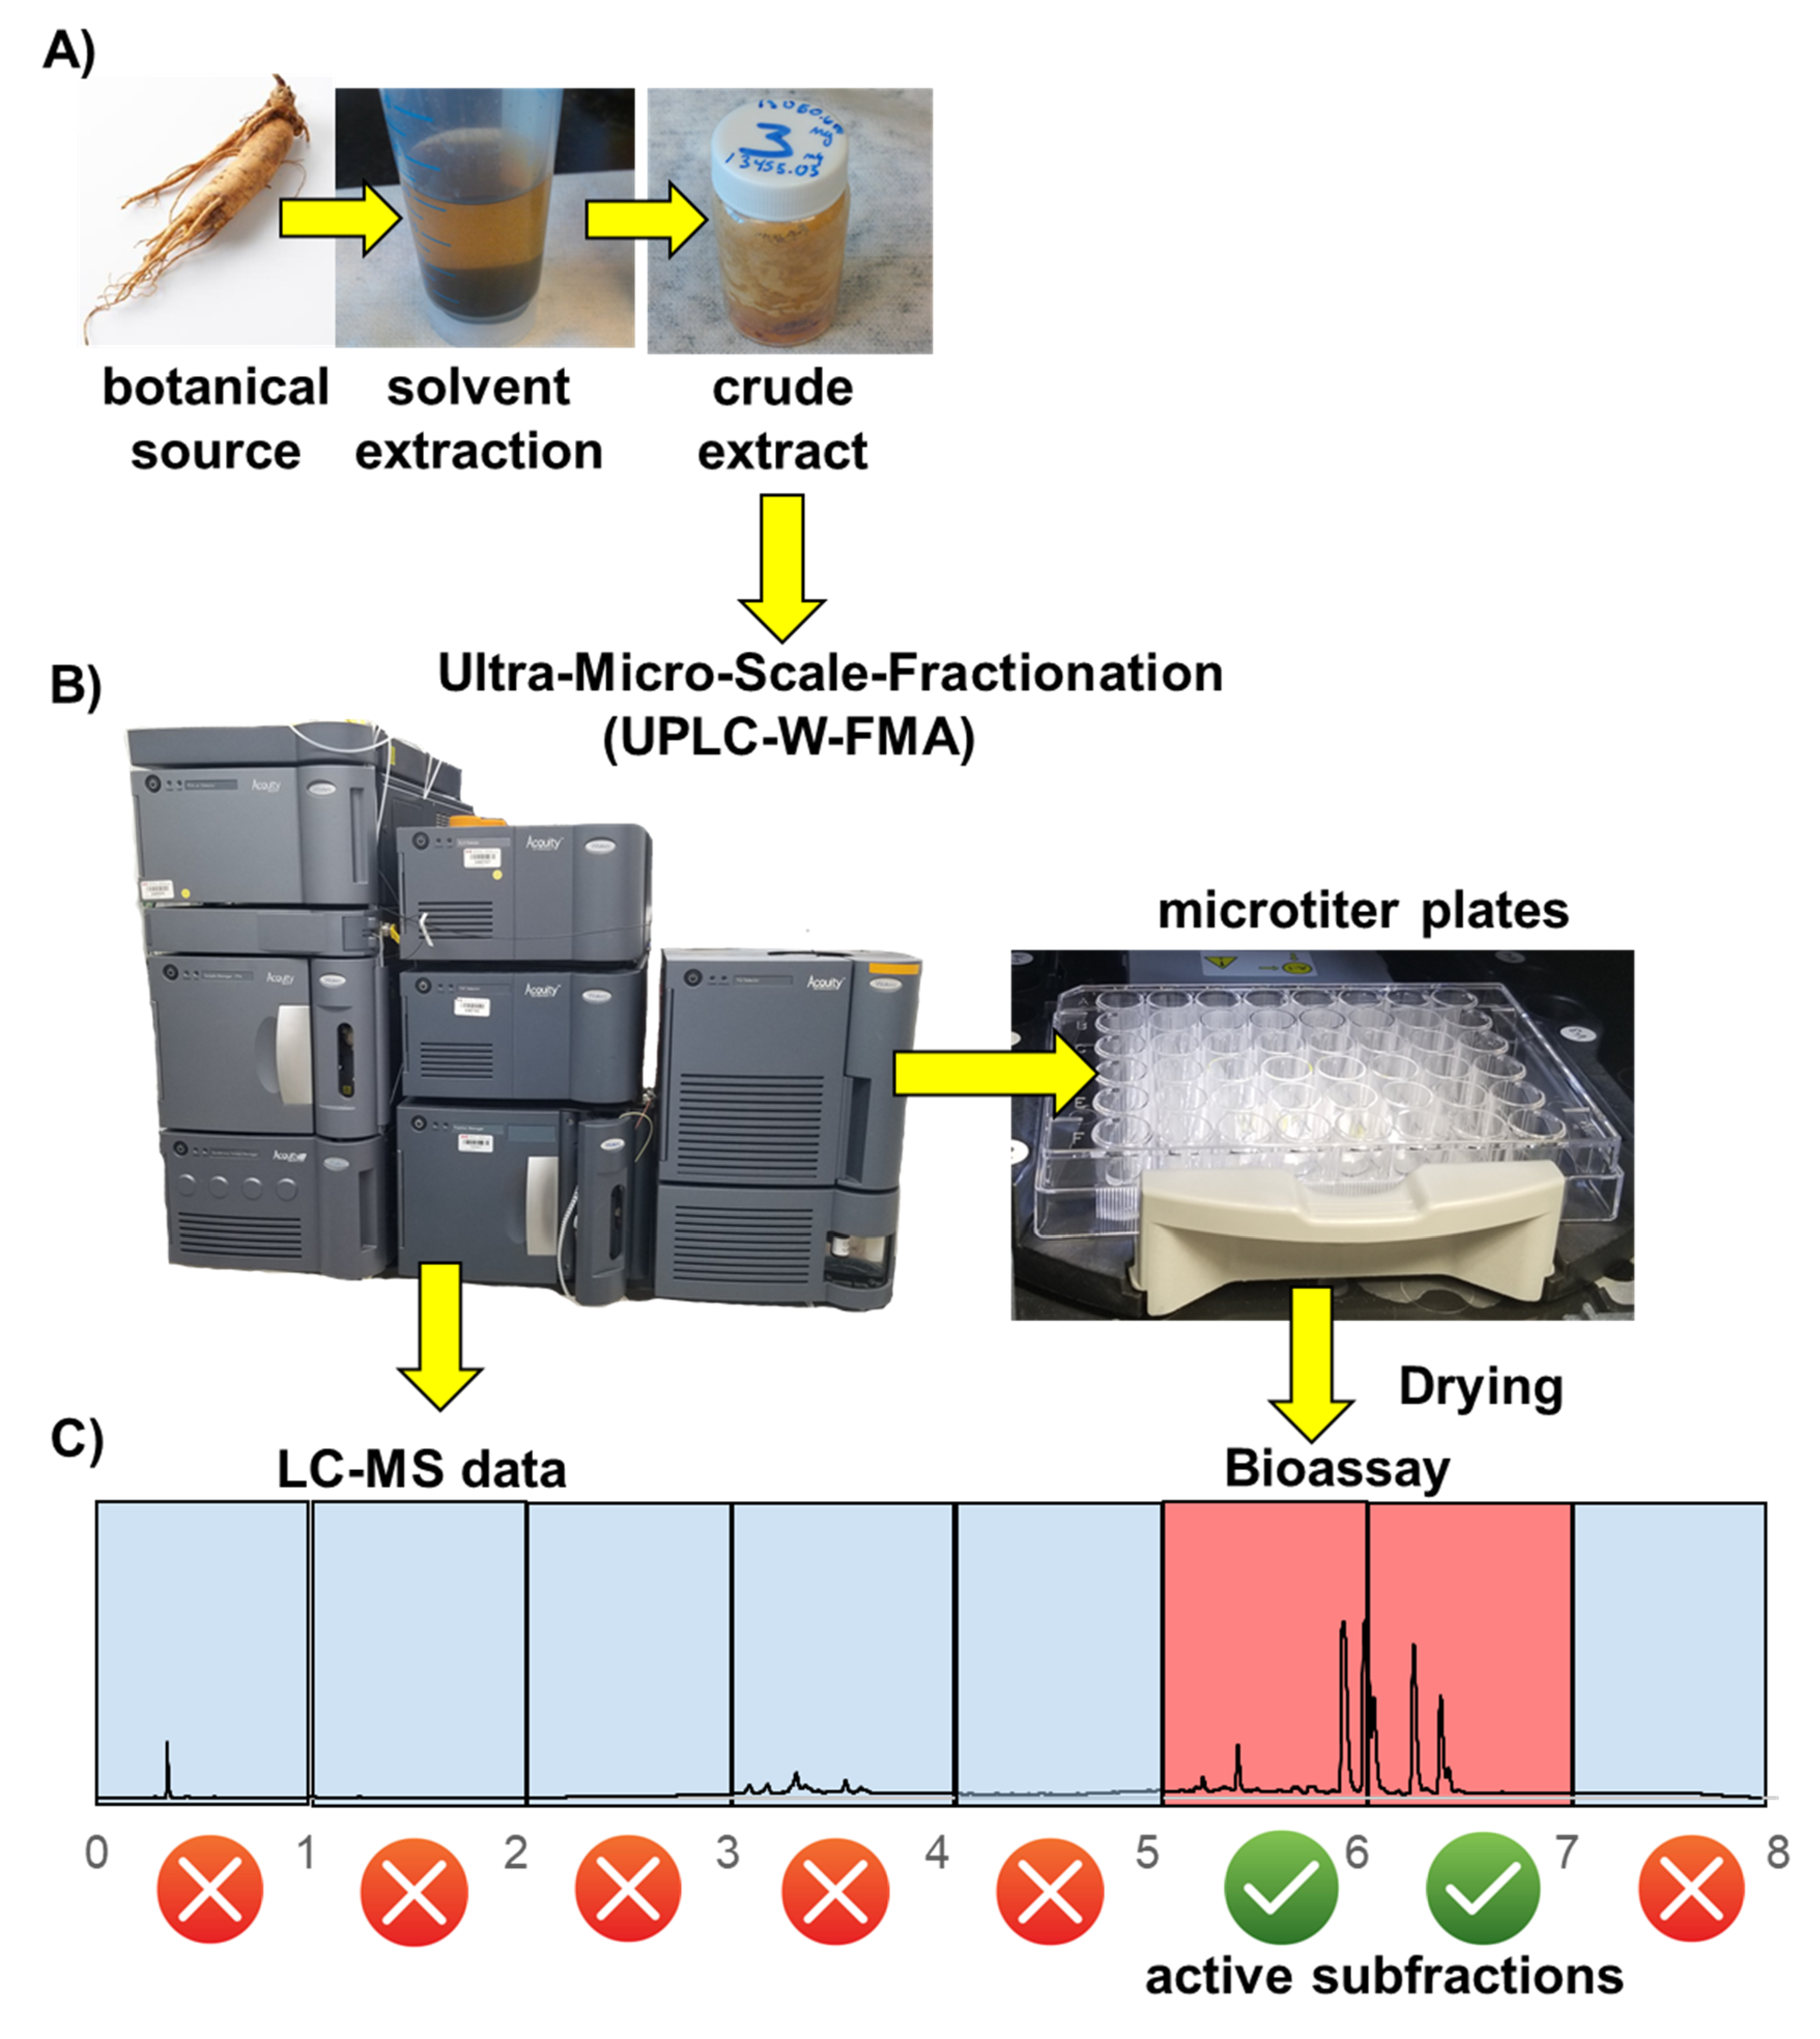
2.1. The UMSF Approach
2.2. Theoretical Considerations Underlying the UMSF Technique
2.3. Cost Analysis—UMSF Is Friendly on Your Budget and the Environment
2.3.1. Capital Investment
2.3.2. Consumables
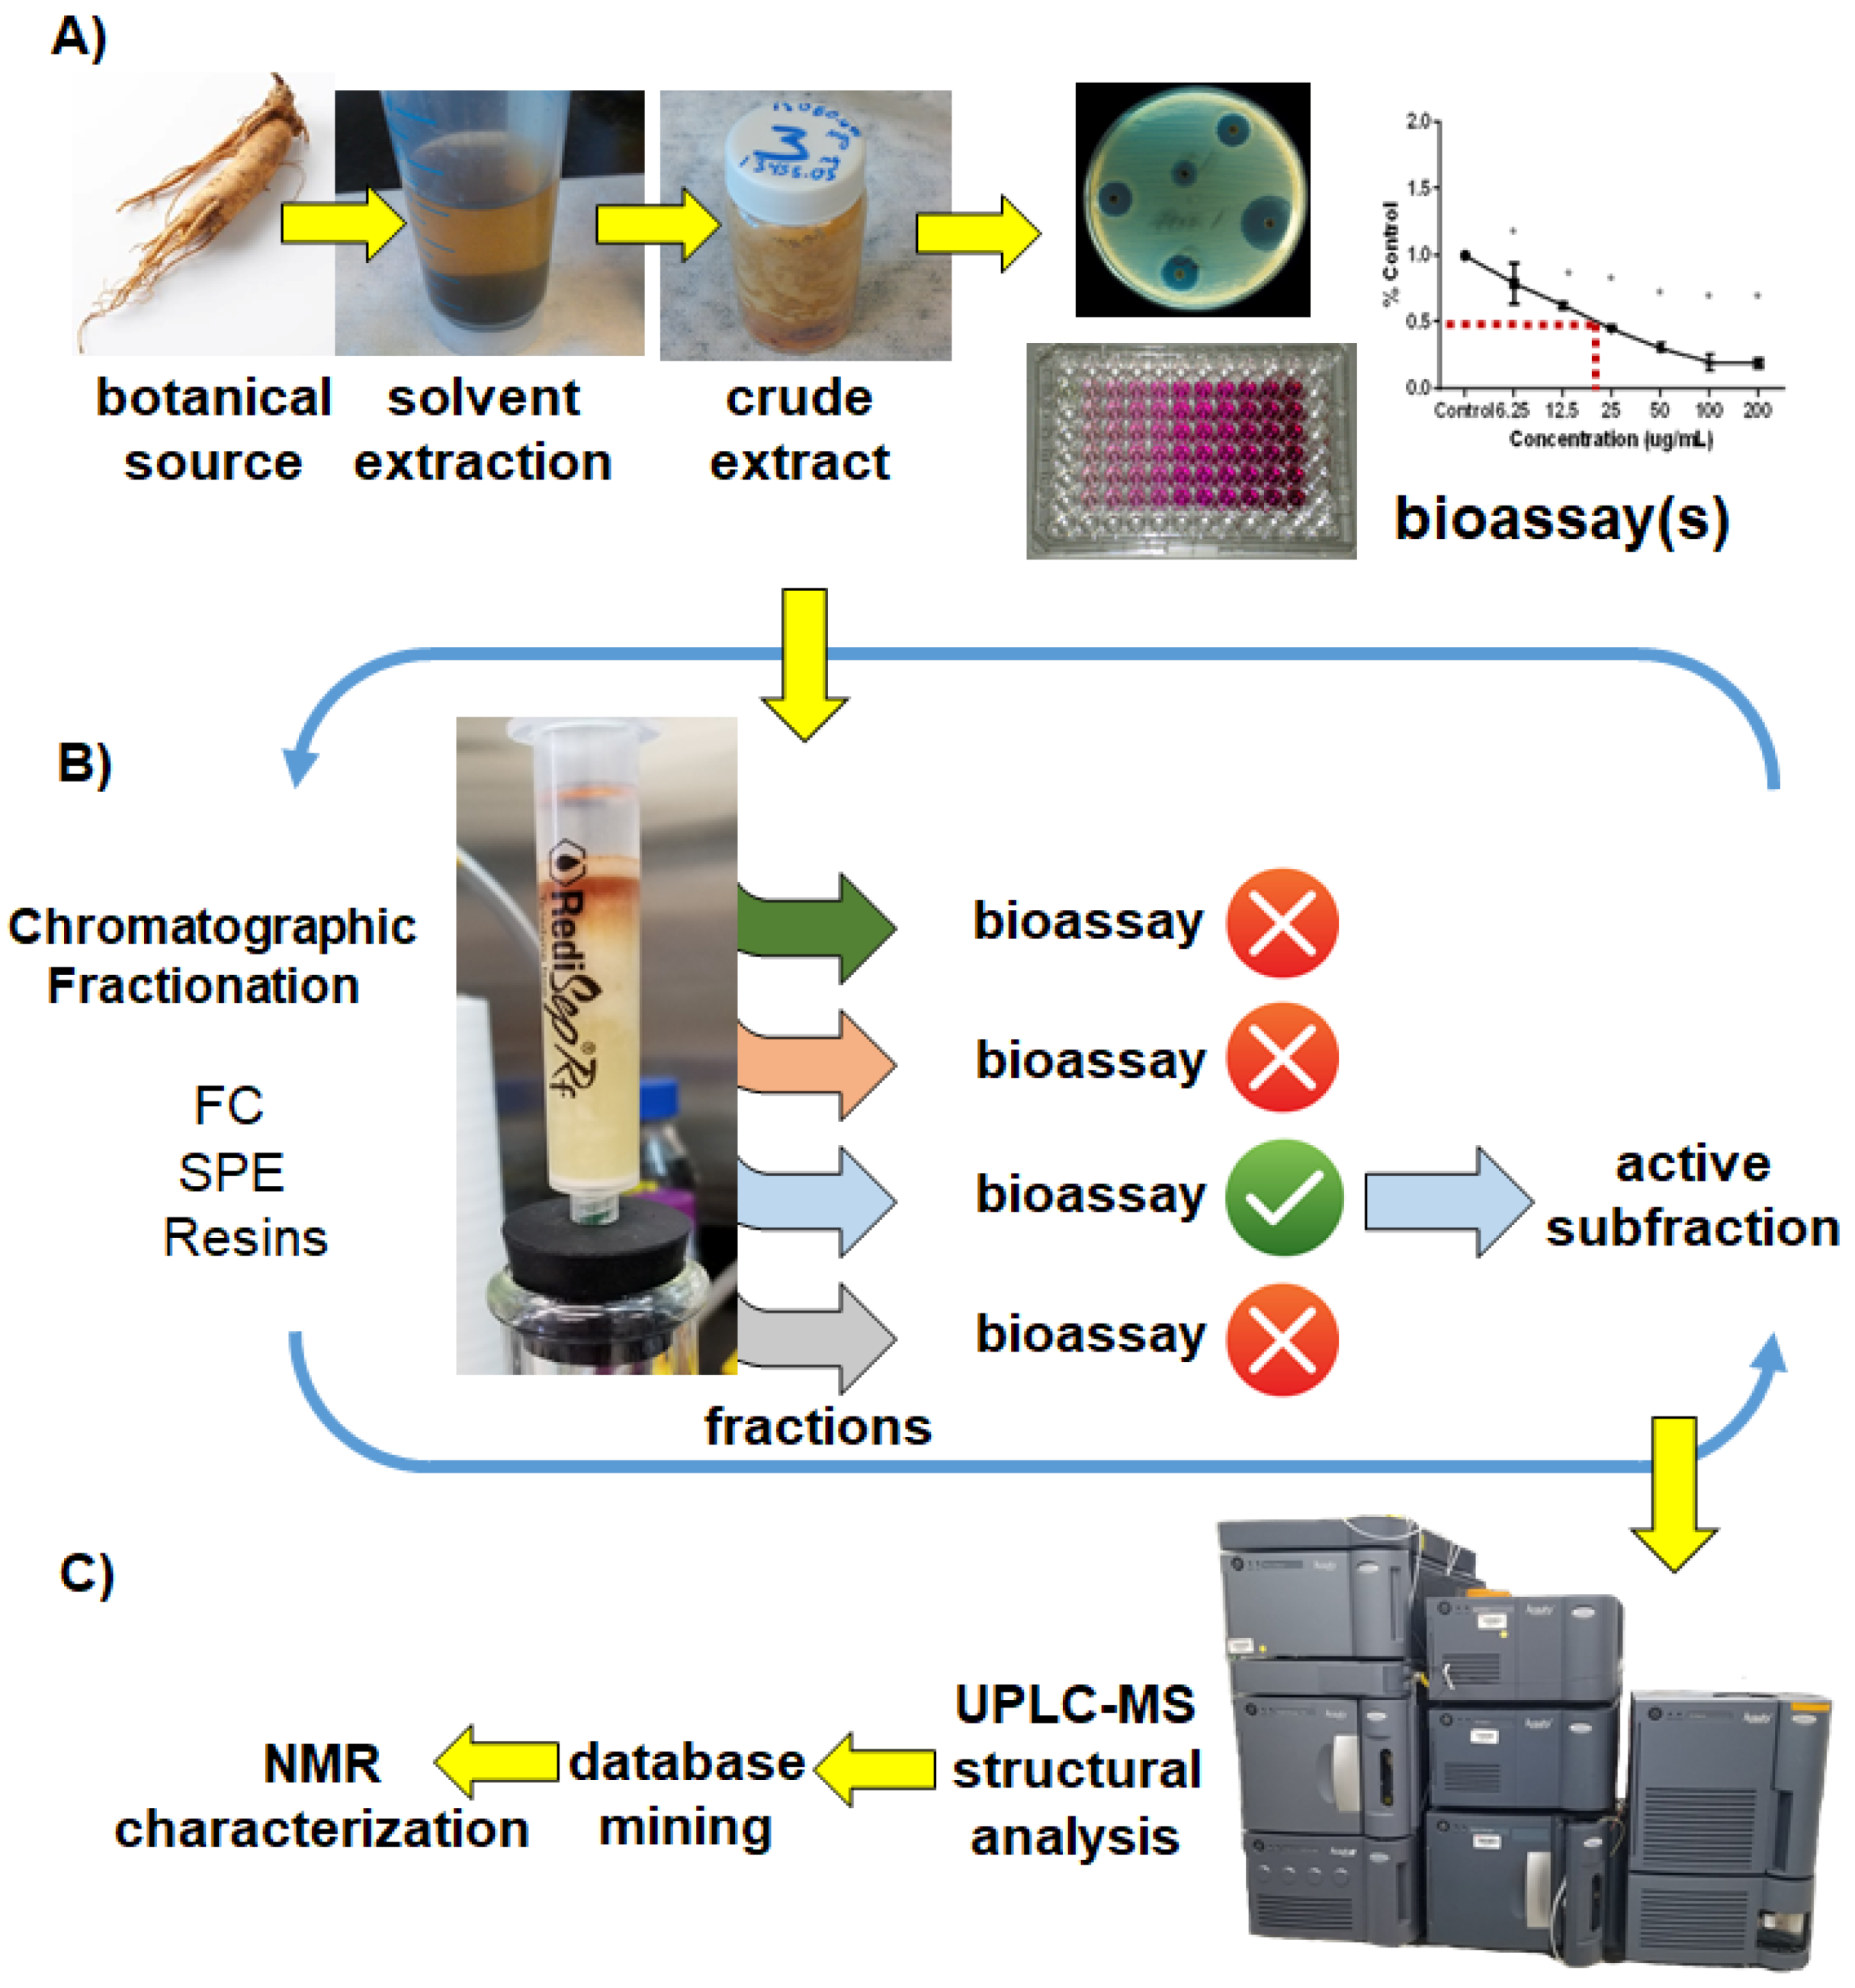
3. Illustrative Case Study—Lupulone Beta Acids from Hops Are Bioactive against Brine Shrimp
4. Materials and Methods
4.1. Chemicals and Consumables
4.2. Plant Materials
4.3. Extraction
4.4. Chromatographic Separation and Fractionation via UPLC-PDA-FMA-TQD
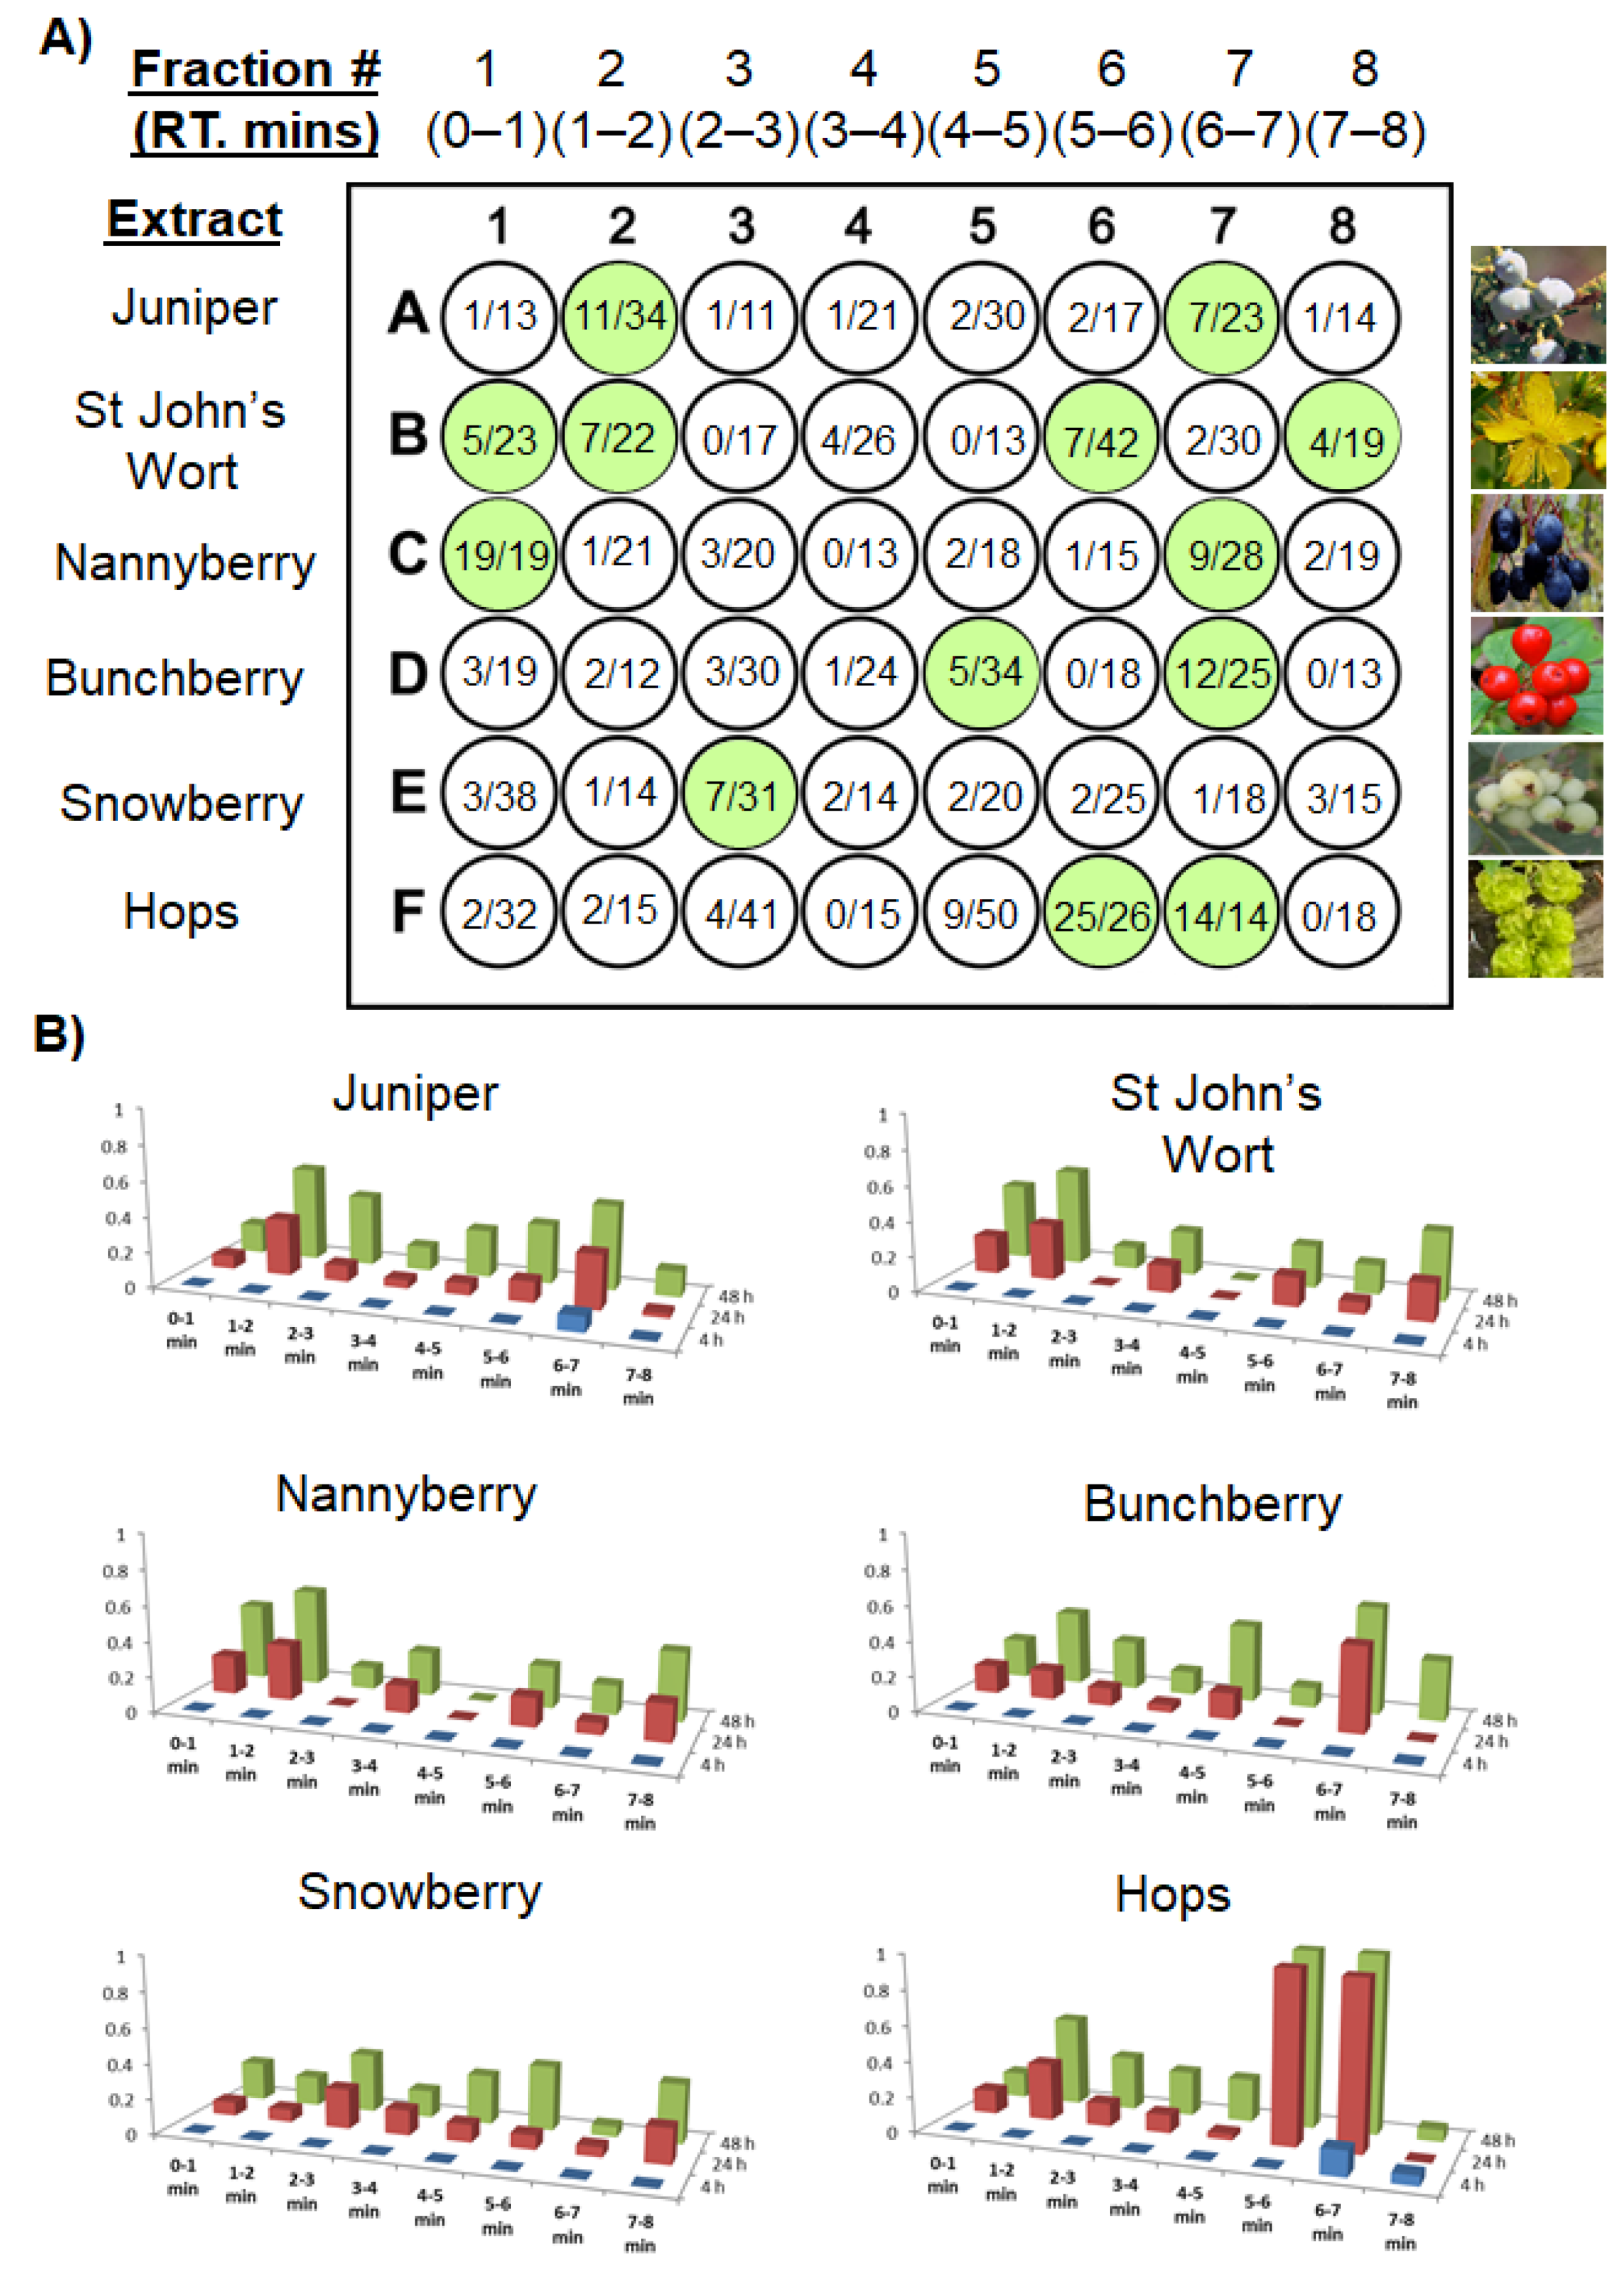
4.5. Initial Screening: (1 min Retention Time Windows—Figures 3 and 4A; Table 1A)
4.6. Hops-Specific Chromatography: (10 s Retention Time Windows—Figure 4B; Table 1B)
4.7. High-Resolution Screening: (5 s Retention Time Windows—Figure 4C,D; Table 1C,D)
4.8. Biological Assays
Supplementary Materials
Author Contributions
Funding
Acknowledgments
Conflicts of Interest
References
- Wani, M.; Taylor, H.; Wall, M.; Coggon, P.; McPhail, A. Plant antitumor agents. VI. The isolation and structure of taxol, a novel antileukemic and antitumor agent from Taxus brevifolia. J. Am. Chem. Soc. 1971, 93, 2325–2327. [Google Scholar] [CrossRef] [PubMed]
- Noble, R.L.; Beer, C.T.; Cutts, J.H. Role of chance observation in chemotherapy: Vinca rosea. Ann. NY Acad. Sci. 1958, 76, 882–894. [Google Scholar] [CrossRef] [PubMed]
- Wall, M.E.; Wani, M.C.; Cook, C.E.; Palmer, K.H.; McPhail, A.I.; Sim, G.A. Plant antitumor agents I. The isolation and structure of camptothecin, a novel alkaloidal leukemia and tumor inhibitor from Camptotheca acuminata. J. Am. Chem. Soc. 1966, 88, 3888–3890. [Google Scholar] [CrossRef]
- Kodadek, T. The rise, fall and reinvention of combinatorial chemistry. Chem. Commun. 2011, 47, 9757–9763. [Google Scholar] [CrossRef] [PubMed]
- Ortholand, J.Y.; Ganesan, A. Natural products and combinatorial chemistry: Back to the future. Curr. Opin. Chem. Biol. 2004, 8, 271–280. [Google Scholar] [CrossRef] [PubMed]
- Hamburger, M. HPLC-based activity profiling for pharmacologically and toxicologically relevant natural products – principles and recent examples. Pharm. Biol. 2019, 57, 328–334. [Google Scholar] [CrossRef] [PubMed] [Green Version]
- Dias, D.A.; Urban, S.; Roessner, U. A historical overview of natural products in drug discovery. Metabolites 2012, 2, 303–336. [Google Scholar] [CrossRef] [PubMed] [Green Version]
- Nielsen, K.F.; Månsson, M.; Rank, C.; Frisvad, J.C.; Larsen, T.O. Dereplication of microbial natural products by LC-DAD-TOFMS. J. Nat. Prod. 2011, 74, 2338–2348. [Google Scholar] [CrossRef]
- Yang, J.F.; Sanchez, L.M.; Rath, C.M.; Liu, X.; Boudreau, P.D.; Bruns, N.; Glukhov, E.; Wodtke, A.; De Felicito, R.; Fenner, A.; et al. Molecular networking as a dereplication strategy. J. Nat. Prod. 2013, 76, 1686–1699. [Google Scholar] [CrossRef] [Green Version]
- Wolfender, J.L.; Marti, G.; Thomas, A.; Bertrand, S. Review: Current approaches and challenges for the metabolite profiling of complex natural extracts. J. Chrom. A. 2015, 1382, 136–164. [Google Scholar] [CrossRef]
- Williamson, E.M. Synergy and other interactions in phytomedicines. Phytomedicine 2001, 8, 401–409. [Google Scholar] [CrossRef] [PubMed]
- Hemaiswarya, S.; Kruthiventi, A.N.; Doble, M. Review: Synergism between natural products and antibiotics against infectious diseases. Phytomedicine 2008, 15, 639–652. [Google Scholar] [CrossRef] [PubMed]
- Caesar, L.K.; Cech, N.B. Synergy and antagonism in natural product extracts: When 1+ 1 does not equal 2. Nat. Prod. Rev. 2019, 36, 845–936. [Google Scholar] [CrossRef] [PubMed] [Green Version]
- Lipinski, C.A. Lead- and drug-like compounds: The rule-of-five revolution. Drug Discov. Today Technol. 2004, 1, 337–341. [Google Scholar] [CrossRef] [PubMed]
- Schenck, F.J.; Hobbs, J.E. Evaluation of the Quick, Easy, Cheap, Effective, Rugged, and Safe (QuEChERS) approach to pesticide residue analysis. Bull. Environ. Contam. Toxicol. 2004, 73, 24–30. [Google Scholar] [CrossRef] [Green Version]
- Stevens, J.F.; Ivancic, M.; Hsu, V.L.; Deinzer, M.L. Prenylflavonoids from Humulus lupulus. Phytochemistry 1997, 44, 1575–1585. [Google Scholar] [CrossRef]
- Wang, W.S.; Ye, Y.H.; Zhou, Y.W. New prenylchalcones from the hops of Humulus lupulus. J. Asian Nat. Prod. Res. 2008, 10, 485–490. [Google Scholar] [CrossRef]
- Haseleu, G.; Intelmann, D.; Hofmann, T. Identification and RP-HPLC-ESI-MS/MS quantification of bitter-tasting β-acid transformation products in beer. J. Agric. Food Chem. 2009, 57, 7480–7489. [Google Scholar] [CrossRef] [PubMed]
- Haseleu, G.; Intelmann, D.; Hofmann, T. Structure determination and sensory evaluation of novel bitter compounds formed from β-acids of hop (Humulus lupulus L) upon wort boiling. Food Chem. 2009, 116, 71–81. [Google Scholar] [CrossRef]
- Taniguchi, Y.; Matsukura, Y.; Ozaki, H.; Nishimura, K.; Shindo, K. Identification and quantification of the oxidation products derived from α-acids and β-acids during storage of hops (Humulus lupulus L.). J. Agric. Food Chem. 2013, 61, 3121–3130. [Google Scholar] [CrossRef]
- Dušek, M.; Olšovska, J.; Krofta, K.; Jurková, M.; Mikyška, A. Qualitative determination of β-acids and their transformation products in beer and hop using HR/AM-LC-MS/MS. J. Agric. Food Chem. 2014, 62, 7690–7697. [Google Scholar] [CrossRef]
- Karabin, M.; Hudcová, T.; Jelínek, L.; Dostálek, P. Biologically active compounds from hops and prospects for their use. Comp. Rev. Food Sci. Food Saf. 2016, 15, 542–567. [Google Scholar] [CrossRef] [Green Version]
- McCallum, J.L.; Nabuurs, M.H.; Gallant, S.T.; Kirby, C.W.; Mills, A.A.S. Phytochemical characterization of wild hops (Humulus lupulus ssp. lupuloides) germplasm resources from the Maritimes region of Canada. Front. Plant Sci. 2019, 10, 1438. [Google Scholar] [CrossRef] [PubMed]
- Hao, J.; Speers, R.A.; Fan, H.; Deng, Y.; Dai, Z. A review of cyclic and oxidative bitter derivatives of alpha, iso-alpha, and beta-hop acids. J. Am. Soc. Brew. Chem. 2020, 78, 89–102. [Google Scholar] [CrossRef]
- Clark, S.M.; Vaitheeswaran, V.; Ambrose, S.J.; Purves, R.W.; Page, J.E. Transcriptome analysis of bitter acid biosynthesis and precursor pathways in hop (Humulus lupulus). BMC Plant Biol. 2013, 13, 12. [Google Scholar] [CrossRef] [PubMed] [Green Version]
- Compton, D.R.; Rice, K.C.; De Costa, B.R.; Razdan, R.K.; Melvin, L.S.; Johnson, M.R.; Martin, B.R. Cannabinoid structure-activity relationships: Correlation of receptor binding and in vivo activities. J. Pharmacol. Exp. Ther. 1993, 265, 218–226. [Google Scholar] [PubMed]
- Bow, E.W.; Rimoldi, J.M. The structure-function relationships of classical cannabinoids: CB1/CB2 modulation. Perspect. Medicin. Chem. 2016, 8, 17–39. [Google Scholar] [CrossRef] [Green Version]
- Tyrrell, E.; Archer, R.; Skinner, G.A.; Singh, K.; Colston, K.; Driver, C. Structure elucidation and investigation into the in vitro effects of hop acids on human cancer cells. Phytochem. Lett. 2010, 3, 17–29. [Google Scholar] [CrossRef]
- Tyrrell, E.; Archer, R.; Tucknott, M.; Colston, K.; Pirianov, G.; Ramanthan, D.; Dhillon, R.; Sinclair, A.; Skinner, G.A. The synthesis and anticancer effects of a range of natural and unnatural hop β-acids on breast cancer cells. Phytochem. Lett. 2012, 5, 144–149. [Google Scholar] [CrossRef]
- Lamy, V.; Roussi, S.; Chaabi, M.; Gossé, F.; Schall, N.; Lobstein, A.; Raul, F. Chemopreventative effects of lupulone, a hop β-acid, on human colon cancer-derived metastatic SW620 cells and in a rat model of colon carcinogenesis. Carcinogenesis 2007, 28, 1575–1581. [Google Scholar] [CrossRef] [Green Version]
- Farag, M.A.; Wessjohann, L.A. Cytotoxic effect of commercial Humulus lupulus L. (hop) preparations – In comparison to its metabolomic fingerprint. J. Adv. Res. 2013, 4, 417–421. [Google Scholar] [CrossRef] [PubMed] [Green Version]
- Meyer, B.N.; Ferrigni, N.R.; Putnam, J.E.; Jacobsen, L.B.; Nichols, D.E.; McLaughlin, J.L. Brine shrimp: A convenient general bioassay for active plant constituents. Planta Med. 1982, 45, 31–34. [Google Scholar] [CrossRef] [PubMed]
- Solis, P.N.; Wright, C.W.; Anderson, M.M.; Gupta, M.P.; Phillipson, J.D. A microwell cytotoxicity assay using Artemia salina (Brine Shrimp). Planta Med. 1993, 59, 250–252. [Google Scholar] [CrossRef] [PubMed]
- Carballo, J.L.; Hernández-Inda, Z.; Pérez, P.; García-Grávalos, M.D. A comparison between two brine shrimp assays to detect in vitro cytotoxicity in marine natural products. BMC Biotechnol. 2002, 2, 17. [Google Scholar] [CrossRef] [PubMed]
Sample Availability: Samples of the compounds are available from the authors. |


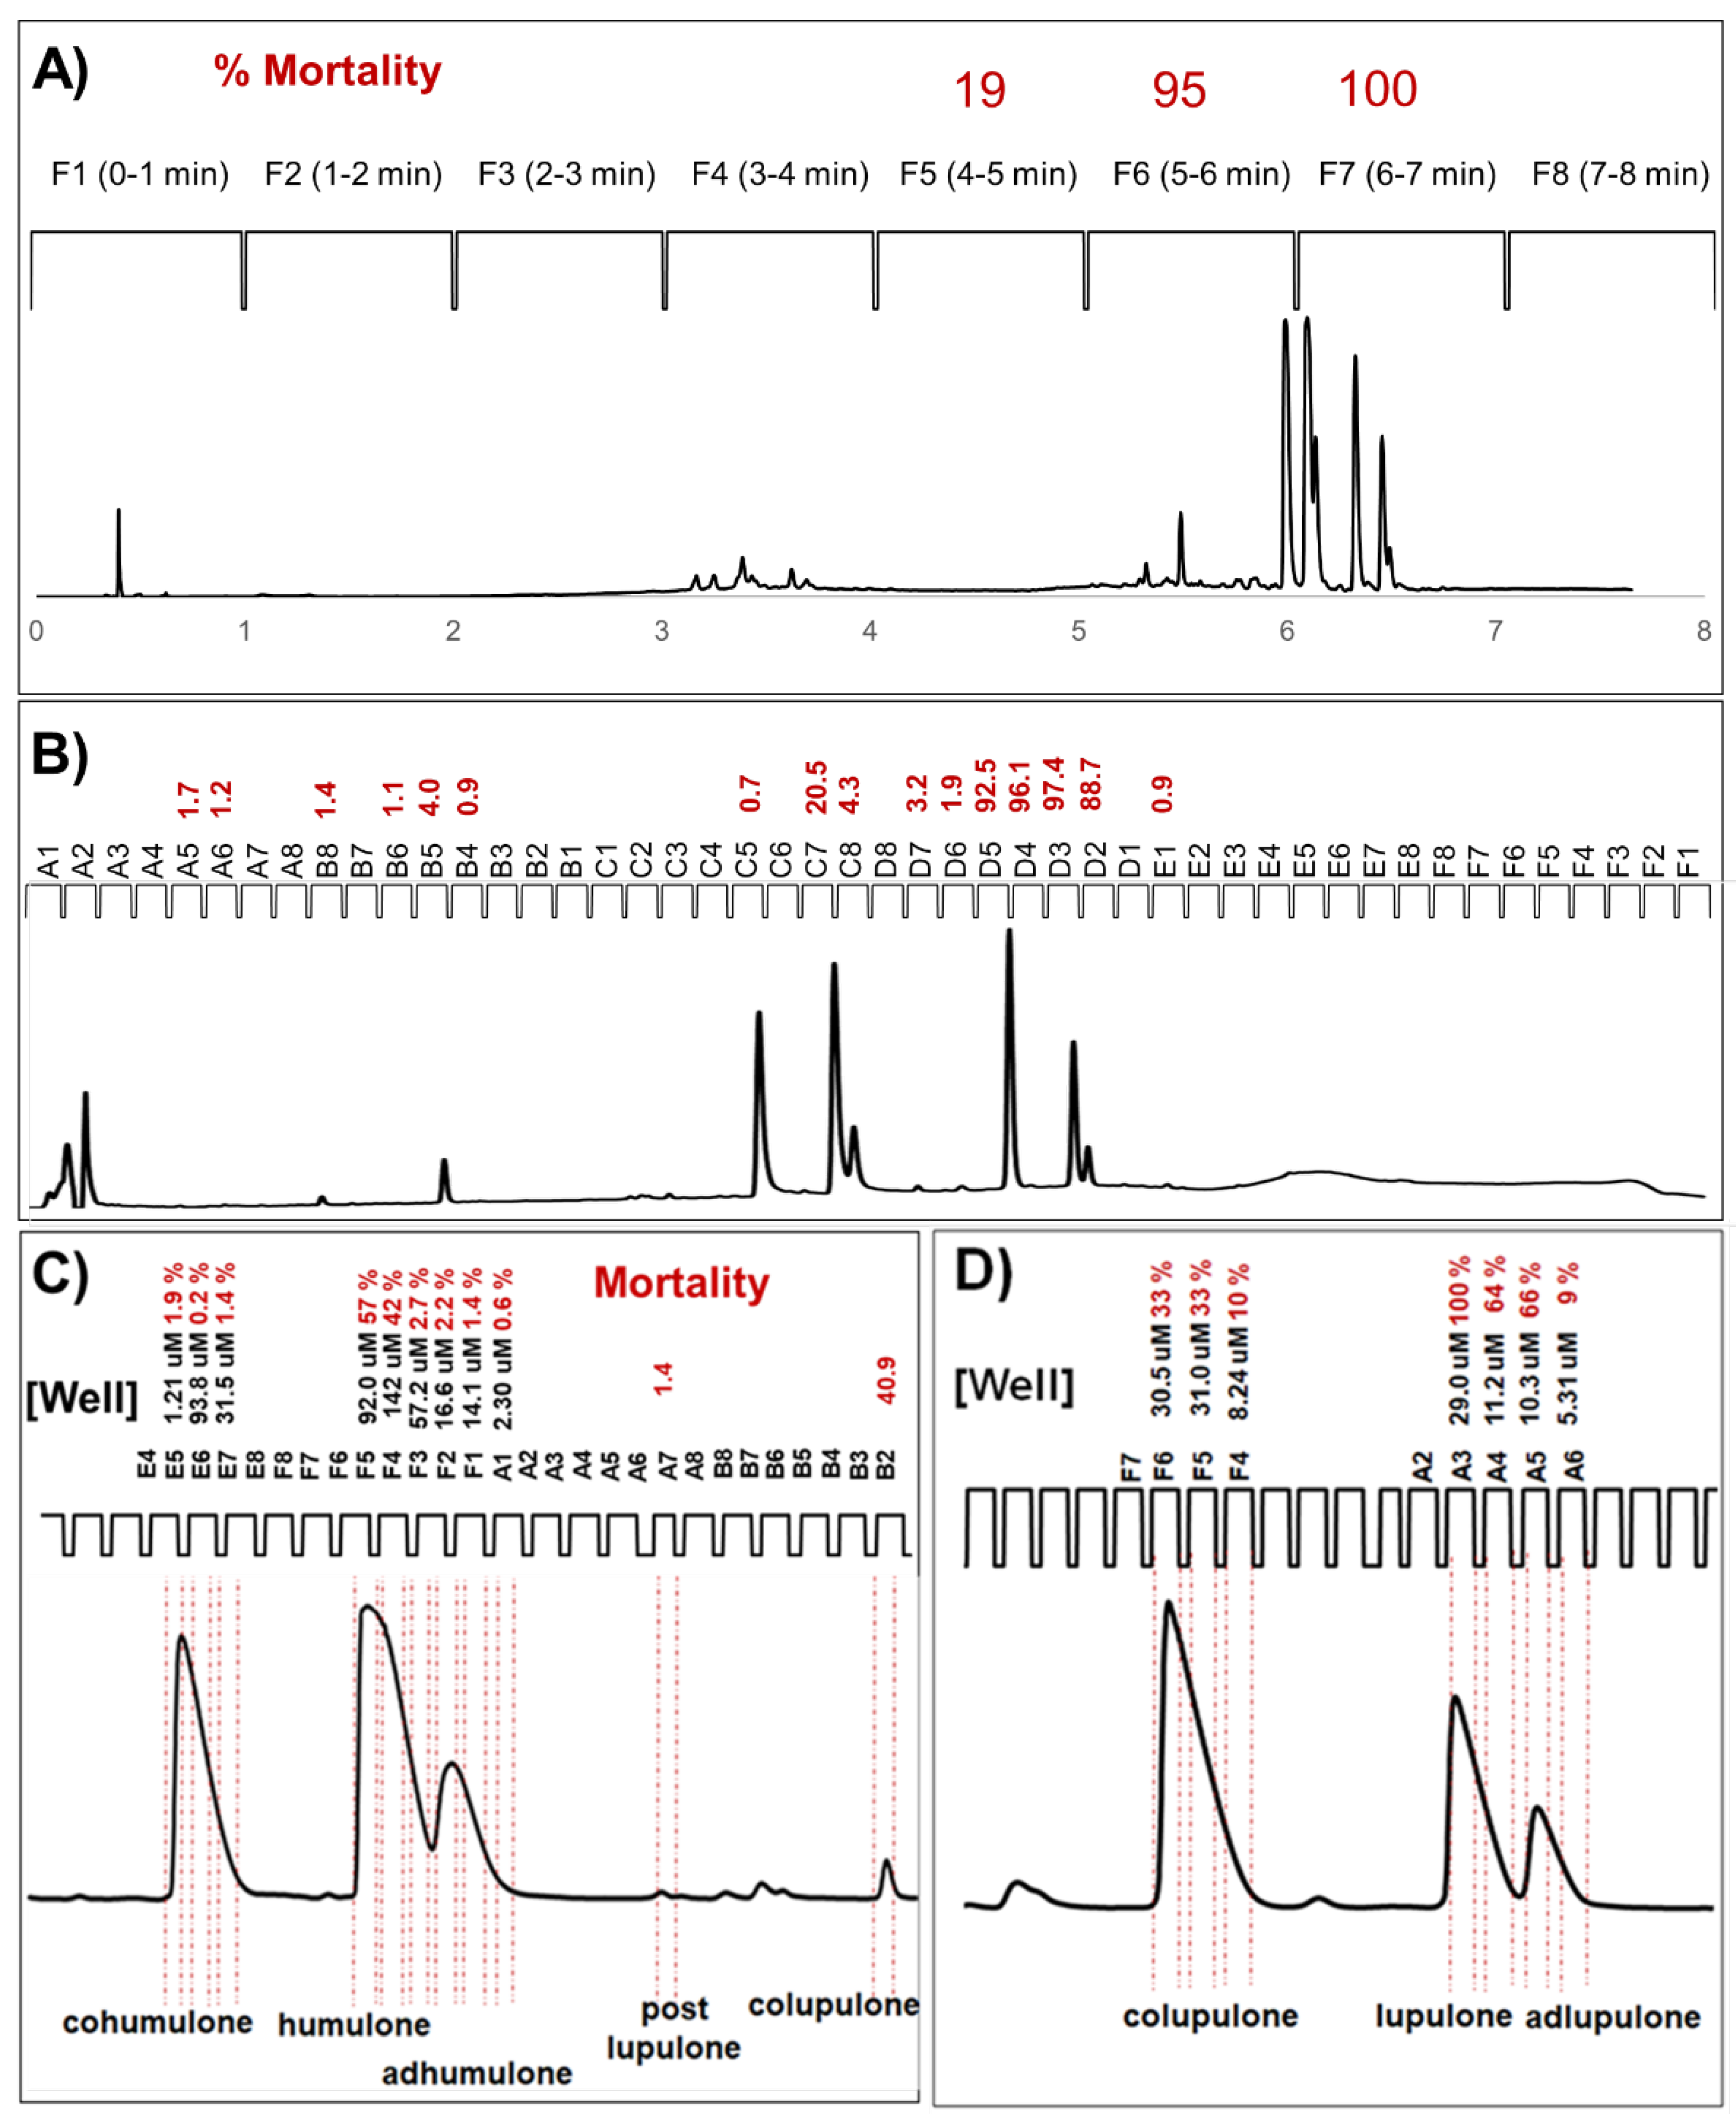
| (A) Low-resolution 1 min retention time windows | |||||||
| Fraction | % Mortality | Principal Components | Minor Components | Trace Components * | |||
| F6 (5–6 min) | 95 | cohumulone, xanthohumol | desmethylxanthohumol, posthumulone | oxidized alpha acids, oxidized iso-alpha acids | |||
| F7 (6–7 min) | 100 | cohumulone, humulone, adhumulone, colupulone, lupulone, adlupulone | prehumulone, adprehumulone, postlupulone, prelupulone, adprelupulone | hydroxytricyclolupones | |||
| (B) Medium-resolution 10 s retention time windows | |||||||
| Fraction | % Mortality | Principal Components | Obs. MW (Da) | ESI-NIM (Intensity) | Deprotonated Ion | UV-Vis λmax (nm) | |
| B8 | 1.4 | desmethylxanthohumol | 340 | 339(100) | [M − H]− | 366 | |
| B6 | 1.1 | xanthohumol | 354 | 353(100) | [M − H]− | 369 | |
| B5 | 4.0 | xanthohumol | 354 | 353(100) | [M − H]− | 369 | |
| B4 | 0.9 | xanthohumol | 354 | 353(100) | [M − H]− | 369 | |
| C5 | 0.7 | cohumulone | 348 | 347(100)/278(40) | [M − H]−/[M-C5H9 − H]− | 285/330(sh)/360(sh) | |
| C7 | 20.5 | humulone | 362 | 361(100)/292(40) | [M − H]−/[M-C5H9 − H]− | 285/330(sh)/360(sh) | |
| C8 | 4.3 | humulone & adhumulone | 362 362 | 361(100)/292(40) 361(100)/292(40) | [M − H]−/[M-C5H9 − H]− [M − H]−/[M-C5H9 − H]− | 285/330(sh)/360(sh) 285/330(sh)/360(sh) | |
| D7 | 3.2 | postlupulone | 386 | 385(100) | [M − H]− | 331/271(sh) | |
| D6 | 1.9 | prehumulone & adprehumulone | 376 376 | 375(100)/306(20) 375(100)/306(20) | [M − H]−/[M-C5H9 − H]− [M − H]−/[M-C5H9 − H]− | 285/330(sh)/360(sh) 285/330(sh)/360(sh) | |
| D5 | 92.5 | colupulone | 400 | 399(100) | [M − H]− | 332/275 | |
| D4 | 8696.1 | colupulone | 400 | 399(100) | [M − H]− | 332/275 | |
| D3 | 97.4 | lupulone | 414 | 413(100) | [M − H]− | 331/275 | |
| D2 | 88.7 | adlupulone | 414 | 413(100) | [M − H]− | 331/275 | |
| E1 | 0.9 | prelupulone & adprelupulone | 428 428 | 427(100) 427(100) | [M − H]− [M − H]− | 330/275 330/275 | |
| (C) Humulone-enriched extract | |||||||
| Fraction | % Mortality | In-Well Molar Concentration (μM) | Principal Component | Obs. MW (Da) | ESI-NIM (Intensity) | Deprotonated Ion and Fragments | UV-Visλmax (nm) |
| P1-E5 | 1.9 | 1.21 | cohumulone | 348 | 347(100)/278(40) | [M − H]−/[M-C5H9 − H]− | 285/330(sh)/360(sh) |
| P1-E6 | 0.2 | 93.8 | cohumulone | 348 | 347(100)/278(40) | [M − H]−/[M-C5H9 − H]− | 285/330(sh)/360(sh) |
| P1-E7 | 1.4 | 31.5 | cohumulone | 348 | 347(100)/278(40) | [M − H]−/[M-C5H9 − H]− | 285/330(sh)/360(sh) |
| P1-F5 | 57 | 92.0 | humulone | 362 | 361(100)/292(40) | [M − H]−/[M-C5H9 − H]− | 285/330(sh)/360(sh) |
| P1-F4 | 42 | 142.0 | humulone | 362 | 361(100)/292(40) | [M − H]−/[M-C5H9 − H]− | 285/330(sh)/360(sh) |
| P1-F3 | 2.7 | 57.2 | humulone | 362 | 361(100)/292(40) | [M − H]−/[M-C5H9 − H]− | 285/330(sh)/360(sh) |
| P1-F2 | 2.2 | 16.6 | adhumulone | 362 | 361(100)/292(40) | [M − H]−/[M-C5H9 − H]− | 285/330(sh)/360(sh) |
| P1-F1 | 1.4 | 14.1 | adhumulone | 362 | 361(100)/292(40) | [M − H]−/[M-C5H9 − H]− | 285/330(sh)/360(sh) |
| P2-A1 | 0.6 | 2.3 | adhumulone | 362 | 361(100)/292(40) | [M − H]−/[M-C5H9 − H]− | 285/330(sh)/360(sh) |
| P2-A7 | 1.4 | n/c | postlupulone | 386 | 385(100) | [M − H]− | 331/271 |
| P2-B2 | 40.9 | n/c | colupulone | 400 | 399(100) | [M − H]− | 332/275 |
| (D) Lupulone-enriched extract | |||||||
| Fraction | % Mortality | In-Well Molar Concentration (μM) | Principal Component | Obs. MW (Da) | ESI-NIM (Intensity) | Deprotonated Ion and Fragments | UV-Visλmax (nm) |
| P1-F6 | 33 | 30.5 | colupulone | 400 | 399(100) | [M − H]− | 332/275 |
| P1-F5 | 33 | 31.0 | colupulone | 400 | 399(100) | [M − H]− | 332/275 |
| P1-F4 | 10 | 8.24 | colupulone | 400 | 399(100) | [M − H]− | 332/275 |
| P2-A3 | 100 | 29.0 | lupulone | 414 | 413(100) | [M − H]− | 331/275 |
| P2-A4 | 64 | 11.2 | lupulone | 414 | 413(100) | [M − H]− | 331/275 |
| P2-A5 | 66 | 10.3 | adlupulone | 414 | 413(100) | [M − H]− | 331/275 |
| P2-A6 | 9.1 | 5.31 | adlupulone | 414 | 413(100) | [M − H]− | 331/275 |
© 2020 by the authors. Licensee MDPI, Basel, Switzerland. This article is an open access article distributed under the terms and conditions of the Creative Commons Attribution (CC BY) license (http://creativecommons.org/licenses/by/4.0/).
Share and Cite
McCallum, J.L.; Vacon, J.N.D.; Kirby, C.W. Ultra-Micro-Scale-Fractionation (UMSF) as a Powerful Tool for Bioactive Molecules Discovery. Molecules 2020, 25, 3677. https://doi.org/10.3390/molecules25163677
McCallum JL, Vacon JND, Kirby CW. Ultra-Micro-Scale-Fractionation (UMSF) as a Powerful Tool for Bioactive Molecules Discovery. Molecules. 2020; 25(16):3677. https://doi.org/10.3390/molecules25163677
Chicago/Turabian StyleMcCallum, Jason L., Jennifer N. D. Vacon, and Christopher W. Kirby. 2020. "Ultra-Micro-Scale-Fractionation (UMSF) as a Powerful Tool for Bioactive Molecules Discovery" Molecules 25, no. 16: 3677. https://doi.org/10.3390/molecules25163677