
l-Malate (−2) Protonation State is Required for Efficient Decarboxylation to l-Lactate by the Malolactic Enzyme of Oenococcus oeni

 ,
, 

Abstract
: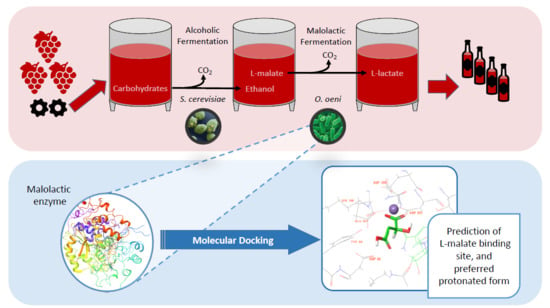
1. Introduction
2. Results
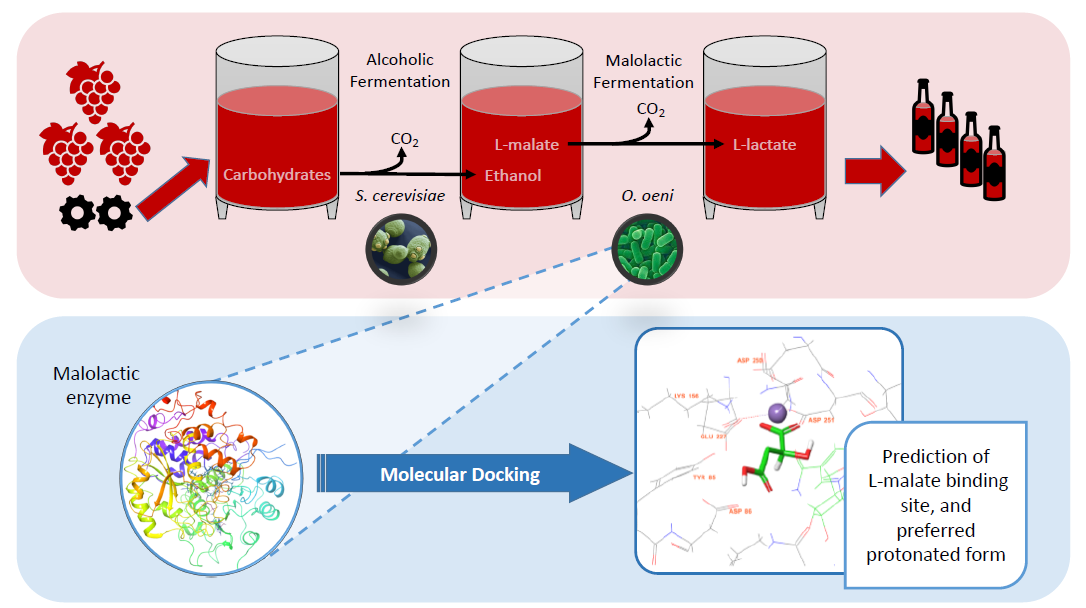
2.1. Calorimetric Determination of Malic acid Binding Energies to Malolactic Enzyme
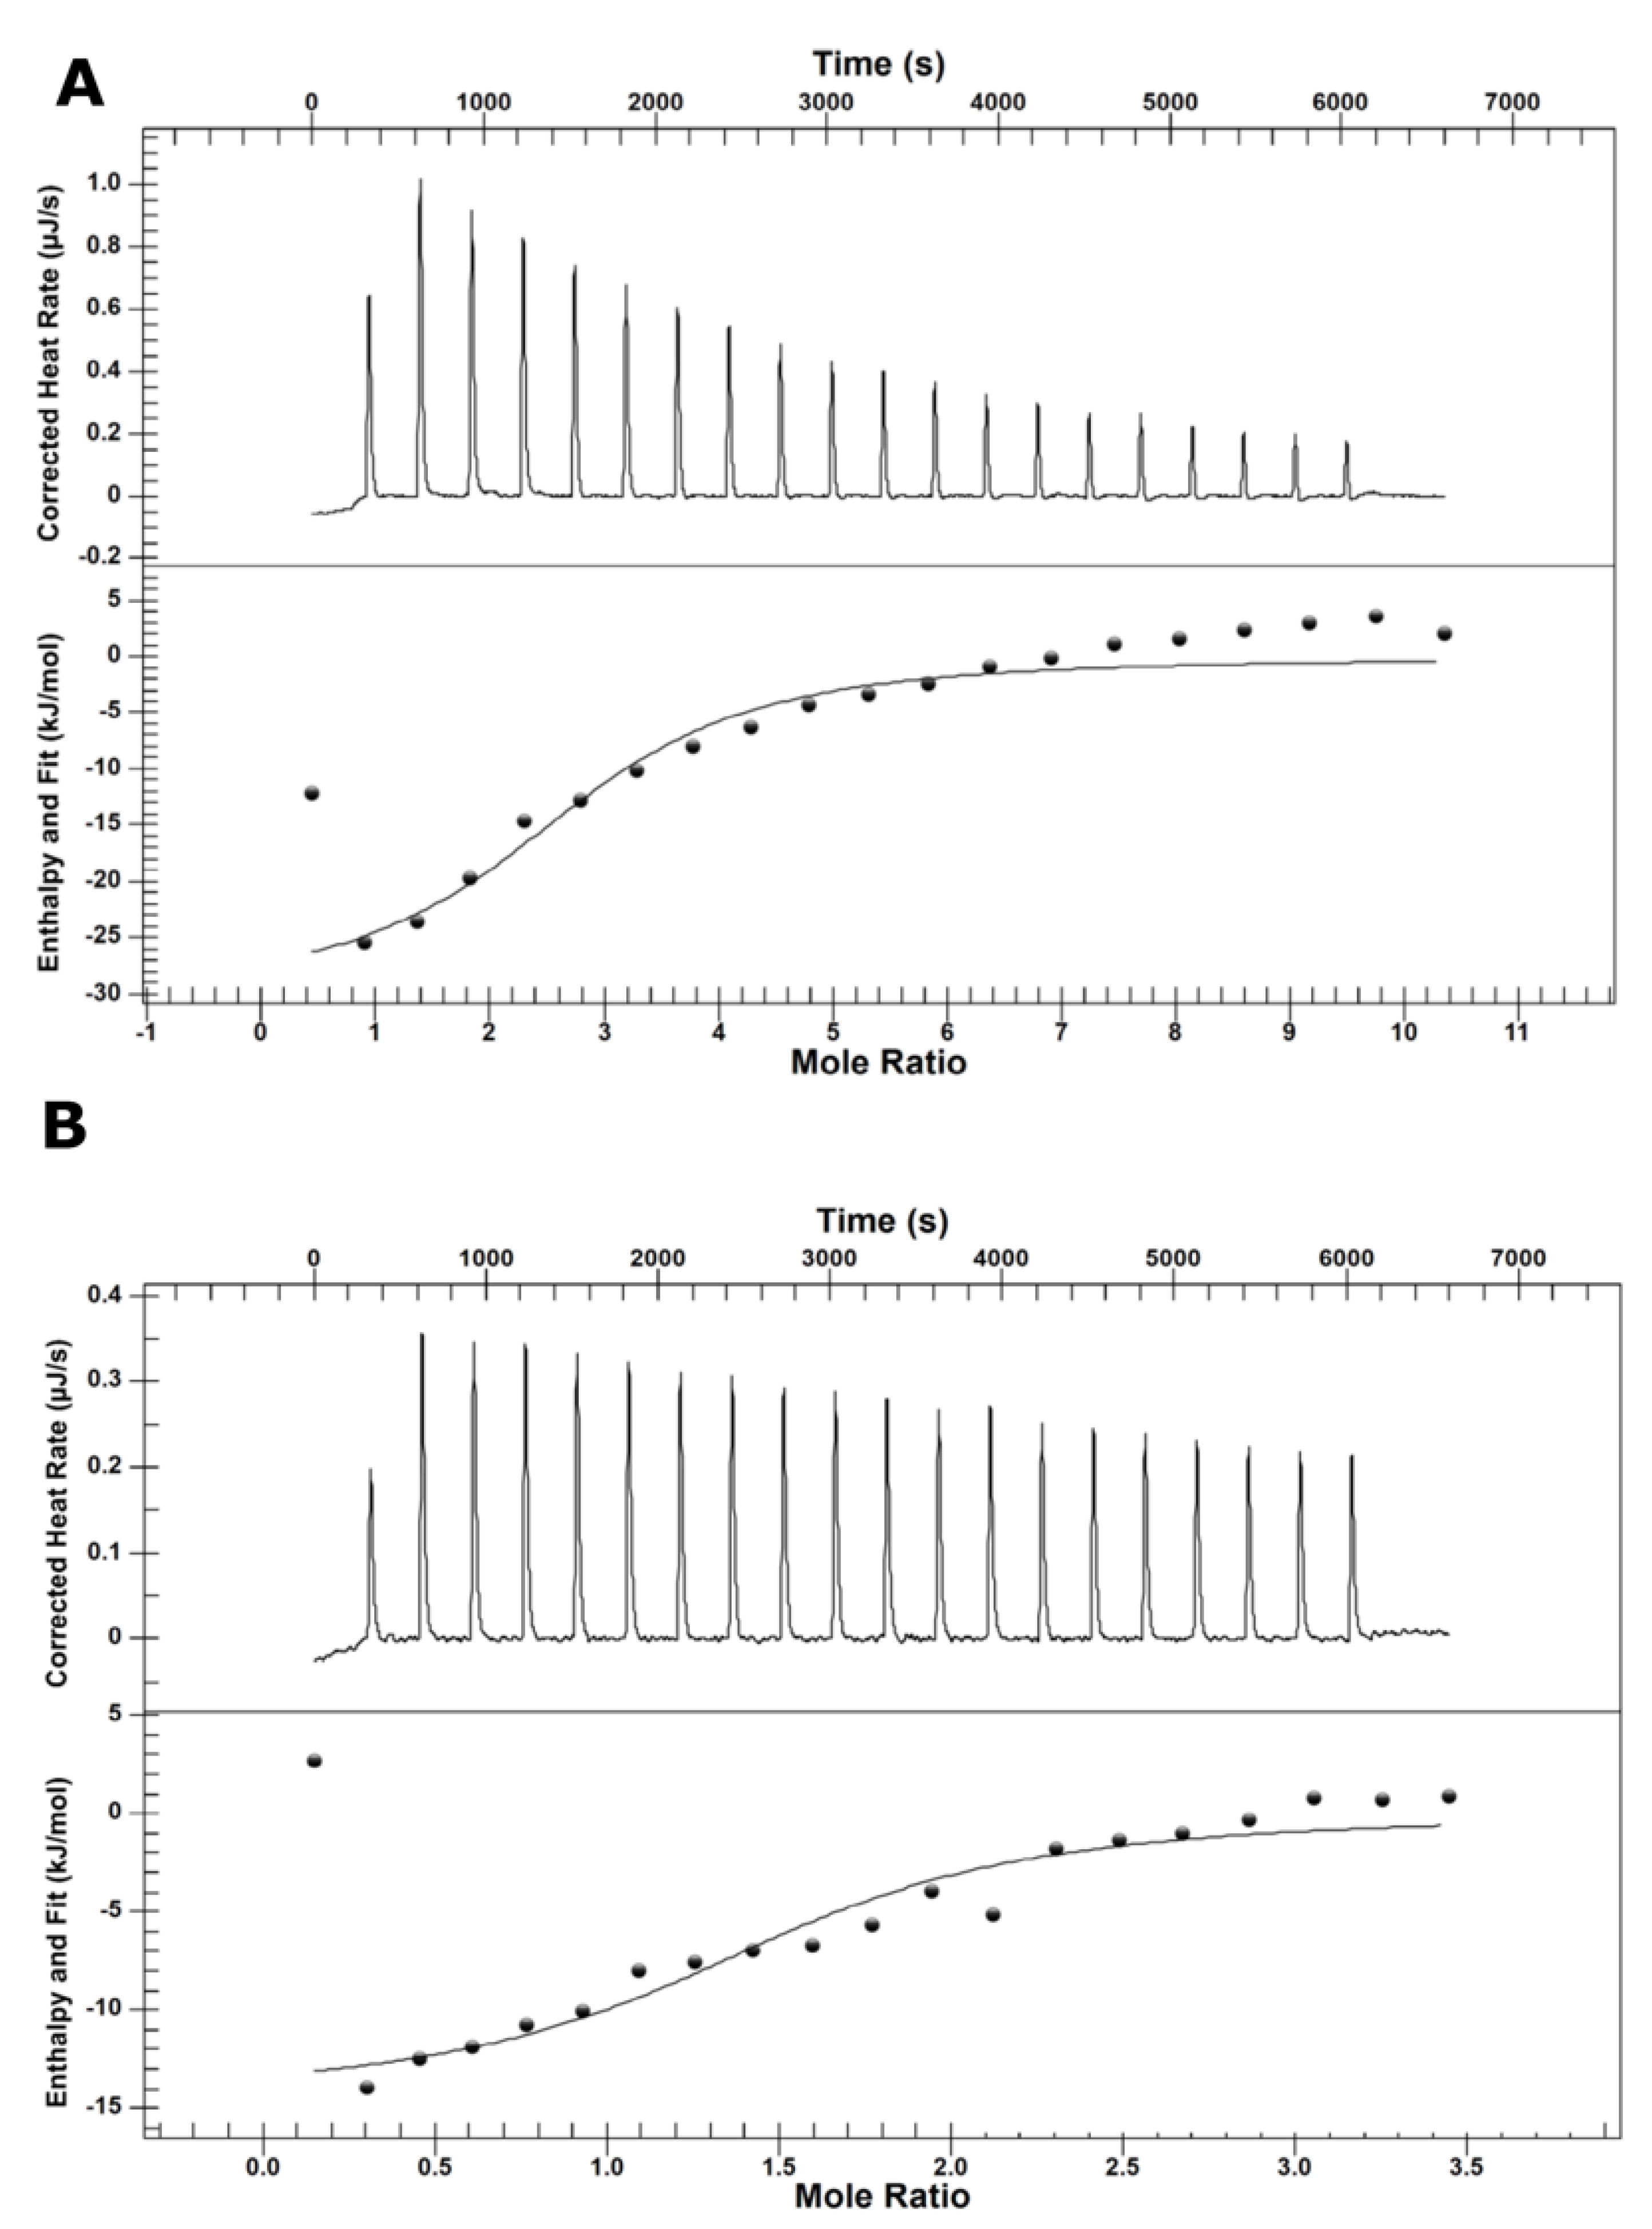
2.2. Sequence Similarity Networks of Malolactic Enzyme Family
2.3. Phylogenetics of Malolactic Enzyme Family
2.4. Structural Modeling of the Malolactic Enzyme
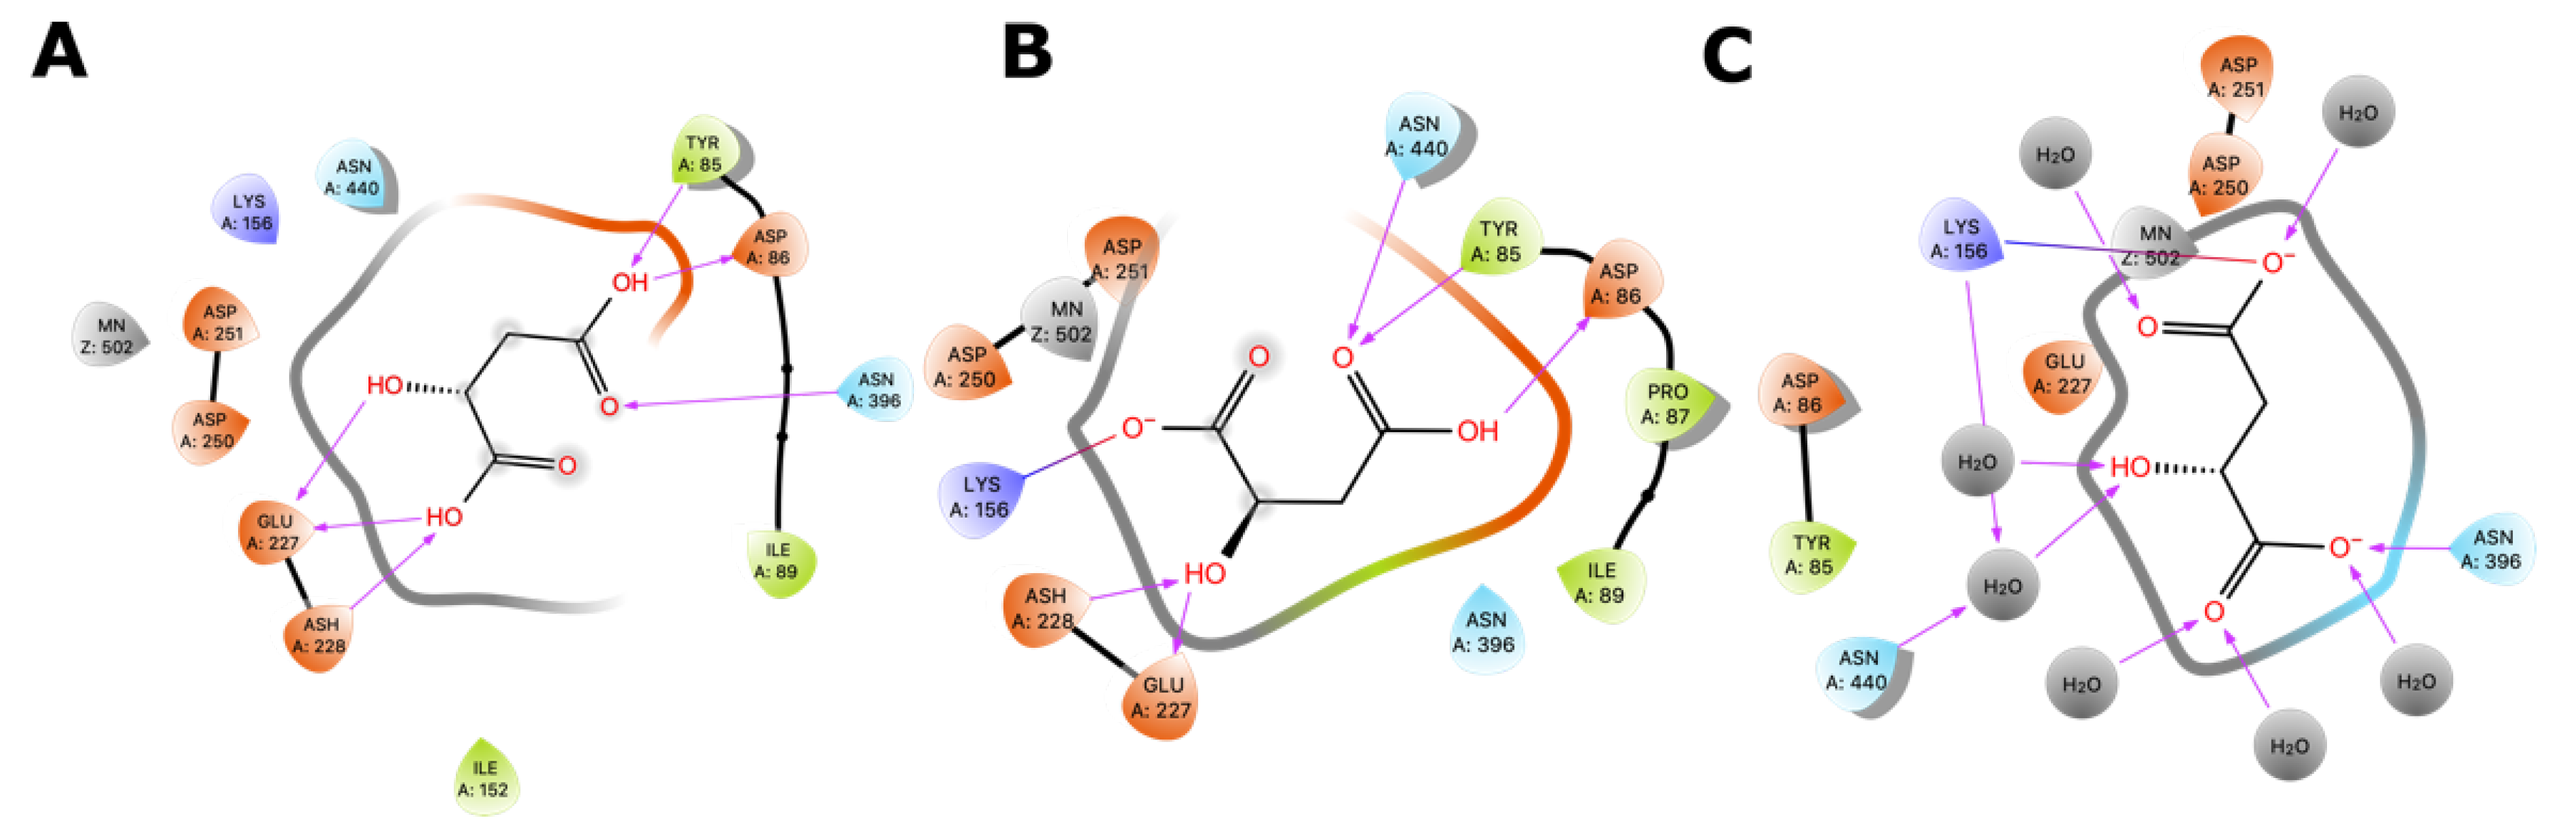
2.5. Molecular Docking of Substrates of Malolactic Enzyme
3. Discussion
4. Materials and Methods
4.1. Analysis of Sequences and Construction of Phylogenetic Tree
4.2. Protein Modeling
4.2.1. Template Selection
4.2.2. Modeling of Malolactic Enzyme
4.2.3. Ligand Preparation
4.2.4. Quantum Polarized Ligand Docking (QPLD)
4.2.5. Molecular Dynamics Simulation (MD)
4.3. Cloning and Expression of Recombinant Malolactic Enzyme
4.3.1. Microorganisms, Plasmids, and Media
4.3.2. Construction of the MLE Expression Vector
4.3.3. Expression and Purification of Recombinant Malolactic Enzyme of O. oeni
4.4. Calorimetric Characterization
5. Conclusions
Supplementary Materials
Author Contributions
Funding
Acknowledgments
Conflicts of Interest
References
- Kunkee, R.E. Malo-Lactic Fermentation and Winemaking. In Chemistry of Winemaking; Webb, A.D., Ed.; American Chemical Society: Washington, DC, USA, 1974; pp. 151–170. ISBN 320. [Google Scholar]
- Williams, S.A.; Hodges, R.A.; Strike, T.L. Cloning the gene for the malolactic fermentation of wine from Lactobacillus delbrueckii in Escherichia coli and yeasts. Appl. Environ. Microbiol. 1984, 47, 288–293. [Google Scholar] [CrossRef] [Green Version]
- Liu, S.-Q. A review: malolactic fermentation in wine—beyond deacidification. J. Appl. Microbiol. 2002, 92, 589–601. [Google Scholar] [CrossRef] [PubMed]
- Henick-Kling, T.; Laurent, M.-H.; Acree, T.E. Changes in the aroma and odor of Chardonnay wine due to malolactic fermentation. Wein-Wissenschaft 1994, 49, 3–10. [Google Scholar]
- Zoecklein, B.W.; Fugelsang, K.C.; Gump, B.H.; Nury, F.S. Microbiology of Winemaking. In Wine Analysis and Production; Springer Science + Business Media: New York, NY, USA, 1999; pp. 280–302. ISBN 978-0-12-384733-1. [Google Scholar]
- Bauer, R.; Dicks, L. Control of malolactic fermentation in wine. A review. South afr. J. Enol. Vitic. 2004, 25, 74–88. [Google Scholar] [CrossRef] [Green Version]
- Bartowsky, E.J. Oenococcus oeni and malolactic fermentation–moving into the molecular arena. Aust. J. Grape Wine Res. 2005, 11, 174–187. [Google Scholar] [CrossRef]
- Zapparoli, G.; Tosi, E.; Azzolini, M.; Vagnoli, P.; Krieger-Weber, S. Bacterial inoculation strategies for the achievement of Malolactic fermentation in high-alcohol wines. South Afr. J. Enol. Vitic. 2009, 30, 49–55. [Google Scholar] [CrossRef]
- Li, H.; Zhang, C.; Liu, Y. Species attribution and distinguishing strains of Oenococcus oeni isolated from Chinese wines. World J. Microbiol. Biotechnol. 2006, 22, 515–518. [Google Scholar] [CrossRef] [Green Version]
- Zhang, G. The essential amino acids requirements for Oenococcus Oeni growth and organic acids metabolism. Afr. J. Microbiol. Res. 2013, 7, 1591–1597. [Google Scholar] [CrossRef] [Green Version]
- Grandvalet, C.; Coucheney, F.; Guzzo, J. CtsR Is the Master Regulator of Stress Response Gene Expression in Oenococcus oeni. J. Bacteriol. 2005, 187, 5614–5623. [Google Scholar] [CrossRef] [Green Version]
- Grandvalet, C.; Assad-García, J.S.; Chu-Ky, S.; Tollot, M.; Guzzo, J.; Gresti, J.; Tourdot-Maréchal, R. Changes in membrane lipid composition in ethanol- and acid-adapted Oenococcus oeni cells: characterization of the cfa gene by heterologous complementation. Microbiology 2008, 154, 2611–2619. [Google Scholar] [CrossRef] [Green Version]
- Olguin, N.T.; Bordons, A.; Reguant, C. Influence of ethanol and pH on the gene expression of the citrate pathway in Oenococcus oeni. Food Microbiol. 2009, 26, 197–203. [Google Scholar] [CrossRef]
- Schümann, C.; Michlmayr, H.; del Hierro, A.M.; Kulbe, K.D.; Jiranek, V.; Eder, R.; Nguyen, T.H. Malolactic enzyme from Oenococcus oeni: Heterologous expression in Escherichia coli and biochemical characterization. Bioengineered 2013, 4, 147–152. [Google Scholar] [CrossRef] [PubMed] [Green Version]
- Korkes, S.; Ochoa, S. Adaptive conversion of malate to lactate and carbon dioxide by Lactobacillus arabinosus. J. Biol. Chem. 1948, 176, 463. [Google Scholar] [PubMed]
- Flesch, P. Über die Malat-Dehydrogenase-und Lactat-Dehydrogenase-Aktivität L-Äpfelsäure-abbauender Bakterien. Arch. Mikrobiol. 1969, 68, 259–277. [Google Scholar] [CrossRef]
- Caspritz, G.; Radlert, F. Malolactic Enzyme of Lactobacillus plantarum. J. Biol. Chem. 1983, 258, 4907–4910. [Google Scholar] [PubMed]
- Groisillier, A.; Lonvaud-Funel, A. Comparison of partial malolactic enzyme gene sequences for phylogenetic analysis of some lactic acid bacteria species and relationships with the malic enzyme. Int. J. Syst. Bacteriol. 1999, 49, 1417–1428. [Google Scholar] [CrossRef] [PubMed] [Green Version]
- Ochoa, S.; Mehler, A.H.; Kornberg, A. Biosynthesis of dicarboxylic acids by carbon dioxide fixation. J. Biol. Chem. 1948, 174, 979–1000. [Google Scholar]
- Lonvaud-Funel, A.; Strasser de Saad, A.M. Purification and Properties of a Malolactic Enzyme from a Strain of Leuconostoc mesenteroides Isolated from Grapes. Appl. Environ. Microbiol. 1982, 43, 357–361. [Google Scholar] [CrossRef] [Green Version]
- Spettoli, P.; Nuti, M.P.; Zamorani, A. Properties of Malolactic Activity Purified from Leuconostoc oenos ML34 by Affinity Chromatography. Appl. Environ. Microbiol. 1984, 48, 900–901. [Google Scholar] [CrossRef] [Green Version]
- Labarre, C.; Guzzo, J.; Cavin, J.F.; Diviès, C. Cloning and characterization of the genes encoding the malolactic enzyme and the malate permease of Leuconostoc oenos. Appl. Environ. Microbiol. 1996, 62, 1274–1282. [Google Scholar] [CrossRef] [Green Version]
- Ansanay, V.; Dequin, S.; Blondin, B.; Barre, P. Cloning, sequence and expression of the gene encoding the malolactic enzyme from Lactococcus lactis. FEBS Lett. 1993, 332, 74–80. [Google Scholar] [CrossRef] [Green Version]
- Wang, P.; Li, A.; Dong, M.; Fan, M. Induction, purification and characterization of malolactic enzyme from Oenococcus oeni SD-2a. Eur. Food Res. Technol. 2014, 239, 827–835. [Google Scholar] [CrossRef]
- Battermann, G.; Radler, F. A comparative study of malolactic enzyme and malic enzyme of different lactic acid bacteria. Can. J. Microbiol. 1991, 37, 211–217. [Google Scholar] [CrossRef]
- Koonin, E.V. Orthologs, Paralogs, and Evolutionary Genomics. Annu. Rev. Genet. 2005, 39, 309–338. [Google Scholar] [CrossRef] [PubMed] [Green Version]
- Sievers, F.; Wilm, A.; Dineen, D.; Gibson, T.J.; Karplus, K.; Li, W.; Lopez, R.; McWilliam, H.; Remmert, M.; Söding, J.; et al. Fast, scalable generation of high-quality protein multiple sequence alignments using Clustal Omega. Mol. Syst. Biol. 2011, 7, 539. [Google Scholar] [CrossRef] [PubMed]
- Ochoa, S.; Mehler, A.H.; Kornberg, A. Reversible oxidative decarboxylation of malic acid. J. Biol. Chem. 1947, 167, 871. [Google Scholar]
- Soffritti, M.; Belpoggi, F.; Degli Esposti, D.; Lambertini, L.; Tibaldi, E.; Rigano, A. First experimental demonstration of the multipotential carcinogenic effects of aspartame administered in the feed to Sprague-Dawley rats. Environ. Health Perspect. 2006, 114, 379–385. [Google Scholar] [CrossRef] [Green Version]
- Makarova, K.S.; Koonin, E.V. Evolutionary genomics of lactic acid bacteria. J. Bacteriol. 2007, 189, 1199–1208. [Google Scholar] [CrossRef] [Green Version]
- Hutkins, R.W.; Nannen, N.L. pH Homeostasis in Lactic Acid Bacteria. J. Dairy Sci. 1993, 76, 2354–2365. [Google Scholar] [CrossRef]
- Salema, M.; Poolman, B. Uniport of Monoanionic l-malate in Membrane Vesicles from Leuconostoc Oenos. Eur. J. Biochem. 1994, 225, 289–295. [Google Scholar] [CrossRef] [Green Version]
- Salema, M.; Lolkema, J.S.; San Romão, M.V.; Loureiro-Dias, M.C. The proton motive force generated in Leuconostoc oenos by l-malate fermentation. J. Bacteriol. 1996, 178, 3127–3132. [Google Scholar] [CrossRef] [PubMed] [Green Version]
- Augagneur, Y.; Ritt, J.-F.; Linares, D.M.; Remize, F.; Tourdot-Marechal, R.; Garmyn, D.; Guzzo, J. Dual effect of organic acids as a function of external pH in Oenococcus oeni. Arch. Microbiol. 2007, 188, 147–157. [Google Scholar] [CrossRef] [PubMed]
- Schumann, C.; Michlmayr, H.; Eder, R.; del Hierro, A.M.; Kulbe, K.D.; Mathiesen, G.; Nguyen, T.-H. Heterologous expression of Oenococcus oeni malolactic enzyme in Lactobacillus plantarum for improved malolactic fermentation. AMB Express 2012, 2, 19. [Google Scholar] [CrossRef] [Green Version]
- Mcginnis, S.; Madden, T.L. BLAST: At the core of a powerful and diverse set of sequence analysis tools. Nucleic Acids Res. 2004, 32, 20–25. [Google Scholar] [CrossRef]
- Letunic, I.; Bork, P. Interactive Tree Of Life (iTOL): an online tool for phylogenetic tree display and annotation. Bioinformatics 2006, 23, 127–128. [Google Scholar] [CrossRef] [Green Version]
- Gerlt, J.A.; Bouvier, J.T.; Davidson, D.B.; Imker, H.J.; Sadkhin, B.; Slater, D.R.; Whalen, K.L. Enzyme Function Initiative-Enzyme Similarity Tool (EFI-EST): A web tool for generating protein sequence similarity networks. Biochim. Biophys. Acta 2015, 1854, 1019–1037. [Google Scholar] [CrossRef] [Green Version]
- Zallot, R.; Oberg, N.; Gerlt, J.A. The EFI Web Resource for Genomic Enzymology Tools: Leveraging Protein, Genome, and Metagenome Databases to Discover Novel Enzymes and Metabolic Pathways. Biochemistry 2019, 58, 4169–4182. [Google Scholar] [CrossRef]
- Shelley, J.C.; Cholleti, A.; Frye, L.L.; Greenwood, J.R.; Timlin, M.R.; Uchimaya, M. Epik: A software program for pK a prediction and protonation state generation for drug-like molecules. J. Comput. Aided Mol. Des. 2007, 681–691. [Google Scholar] [CrossRef]
- Cho, A.R.T.E.; Guallar, V.; Berne, B.J.; Friesner, R. Importance of Accurate Charges in Molecular Docking: Quantum Mechanical/Molecular Mechanical (QM/MM) Approach. J. Comput. Chem. 2014, 26, 915–931. [Google Scholar] [CrossRef] [Green Version]
- Friesner, R.; Banks, J.; Murphy, R.; Halgren, T.; Klicic, J.; Mainz, D.; Repasky, M.; Knoll, E.; Shelley, M.; Perry, J.; et al. Glide: A New Approach for Rapid, Accurate Docking and Scoring. 1. Method and Assessment of Docking Accuracy. J. Med. Chem. 2004, 47, 1739–1749. [Google Scholar] [CrossRef]
- Bochevarov, A.D.; Harder, E.; Hughes, T.F.; Greenwood, J.R.; Braden, D.A.; Philipp, D.M.; Rinaldo, D.; Halls, M.D.; Zhang, J.; Friesner, R.A. Jaguar: A High-Performance Quantum Chemistry Software Program with Strengths in Life and Materials Sciences. Quantum Chem. 2013, 113, 2110–2142. [Google Scholar] [CrossRef]
- Banks, J.L.; Beard, H.S.; Cao, Y.; Cho, A.E.; Damm, W.; Farid, R.; Felts, A.K.; Halgren, T.A.; Mainz, D.T.; Maple, J.R.; et al. Integrated Modeling Program, Applied Chemical Theory (IMPACT). J. Comput. Chem. 2005, 26, 1752–1780. [Google Scholar] [CrossRef] [Green Version]
- Garvie, E.I. Leuconostoc oenos sp.nov. J. Gen. Microbiol. 1967, 48, 431–438. [Google Scholar] [CrossRef] [Green Version]
- Dicks, L.; Dellaglio, F.; Collins, M.D. Proposal To Reclassify Leuconostoc oenos as Oenococcus oeni [corrig.] gen. nov., comb. nov. Int. J. Syst. Bacteriol. 1995, 45, 395–397. [Google Scholar] [CrossRef] [Green Version]
- De Man, J.C.; Rogosa, M.; Sharpe, M.E. A Medium for the Cultivation of Lactobacilli. J. Appl. Bacteriol. 1960, 23, 130–135. [Google Scholar] [CrossRef]
- Gibson, D.G.; Young, L.; Chuang, R.-Y.; Venter, J.C.; Hutchison, C.A.; Smith, H.O.; Iii, C.A.H.; America, N. Enzymatic assembly of DNA molecules up to several hundred kilobases. Nat. Methods 2009, 6, 343–345. [Google Scholar] [CrossRef]
Sample Availability: Samples of Oenococcus oeni (PSU-1, ATCC®BAA-331™) and Escherichia coli BL21 strain transformed with plasmid pET28a are available from the authors. |


| Ligand | Kd (M) | n | ∆G (kJ/mol) | ∆H (kJ/mol) | T∆S (kJ/mol) |
|---|---|---|---|---|---|
| MAL− | 3.19 × 10⁻⁶ | 2.7 | −31.3 | −30.0 | 1.3 |
| MAL2− | 1.29 × 10⁻⁶ | 1.5 | −33.7 | −14.5 | 19.2 |
| MAL− | MAL2− |
|---|---|
| QPLD ∆G binding −19.6 kJ/mol | QPLD ∆Gbinding −23.8 kJ/mol |
| MM/GBSA ∆G binding −154.8 kJ/mol | MM/GBSA ∆G binding −175.7 kJ/mol |
 |  |
 |  |
 |  |
© 2020 by the authors. Licensee MDPI, Basel, Switzerland. This article is an open access article distributed under the terms and conditions of the Creative Commons Attribution (CC BY) license (http://creativecommons.org/licenses/by/4.0/).
Share and Cite
Acevedo, W.; Cañón, P.; Gómez-Alvear, F.; Huerta, J.; Aguayo, D.; Agosin, E. l-Malate (−2) Protonation State is Required for Efficient Decarboxylation to l-Lactate by the Malolactic Enzyme of Oenococcus oeni. Molecules 2020, 25, 3431. https://doi.org/10.3390/molecules25153431
Acevedo W, Cañón P, Gómez-Alvear F, Huerta J, Aguayo D, Agosin E. l-Malate (−2) Protonation State is Required for Efficient Decarboxylation to l-Lactate by the Malolactic Enzyme of Oenococcus oeni. Molecules. 2020; 25(15):3431. https://doi.org/10.3390/molecules25153431
Chicago/Turabian StyleAcevedo, Waldo, Pablo Cañón, Felipe Gómez-Alvear, Jaime Huerta, Daniel Aguayo, and Eduardo Agosin. 2020. "l-Malate (−2) Protonation State is Required for Efficient Decarboxylation to l-Lactate by the Malolactic Enzyme of Oenococcus oeni" Molecules 25, no. 15: 3431. https://doi.org/10.3390/molecules25153431