
Potentilla alba Extracts Affect the Viability and Proliferation of Non-Cancerous and Cancerous Colon Human Epithelial Cells

 ,
,  ,
,  , , , , and
Abstract
:1. Introduction
2. Results
2.1. Chemical Characterization
2.2. Cytotoxicity
2.2.1. Neutral Red (NR) Uptake Assay
2.2.2. MTT Assay
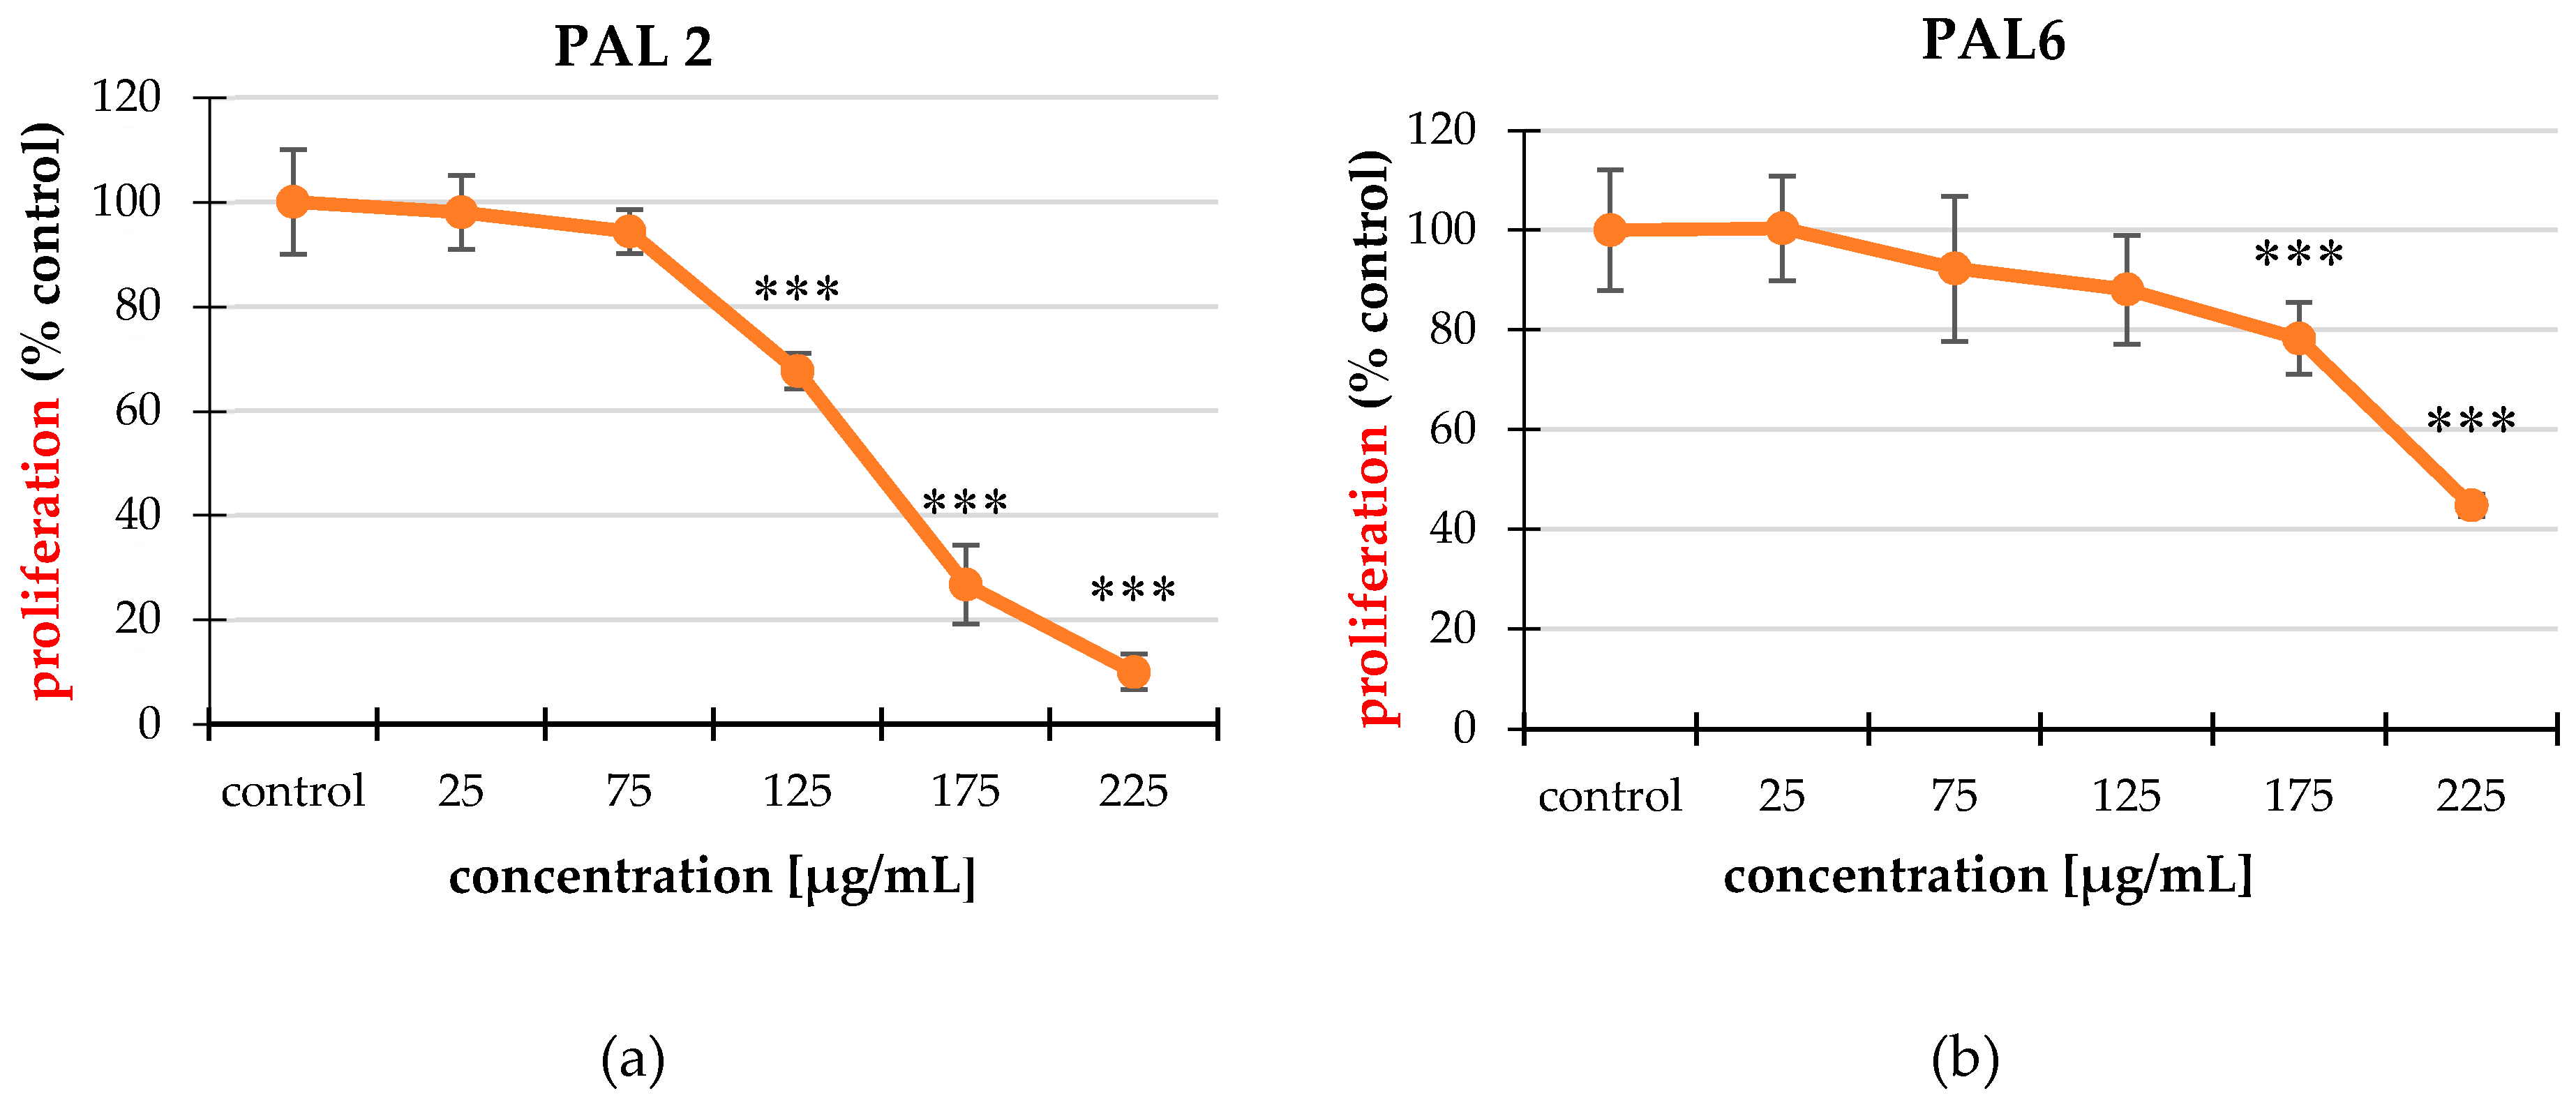
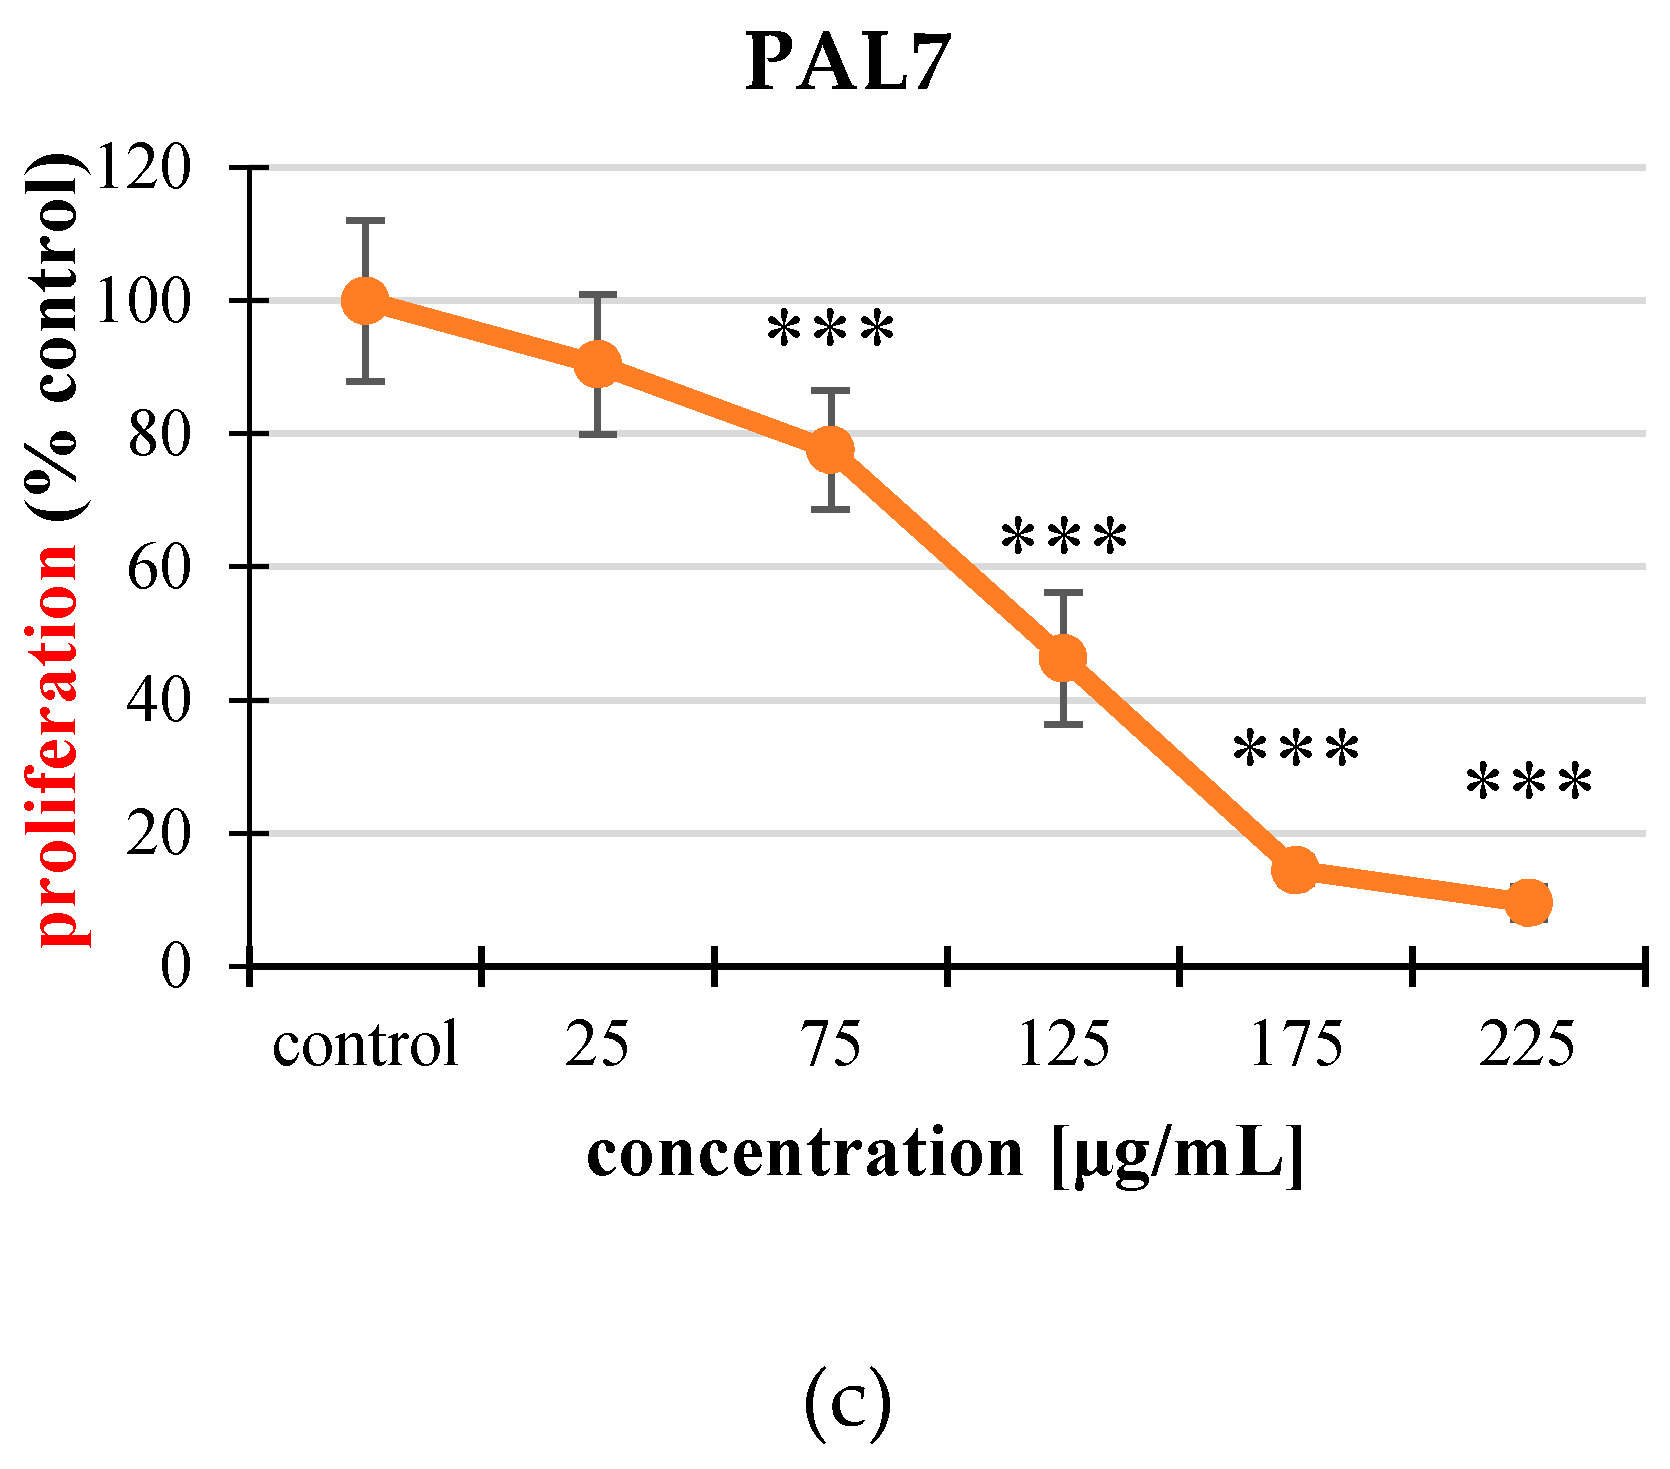
2.3. Cell Proliferation
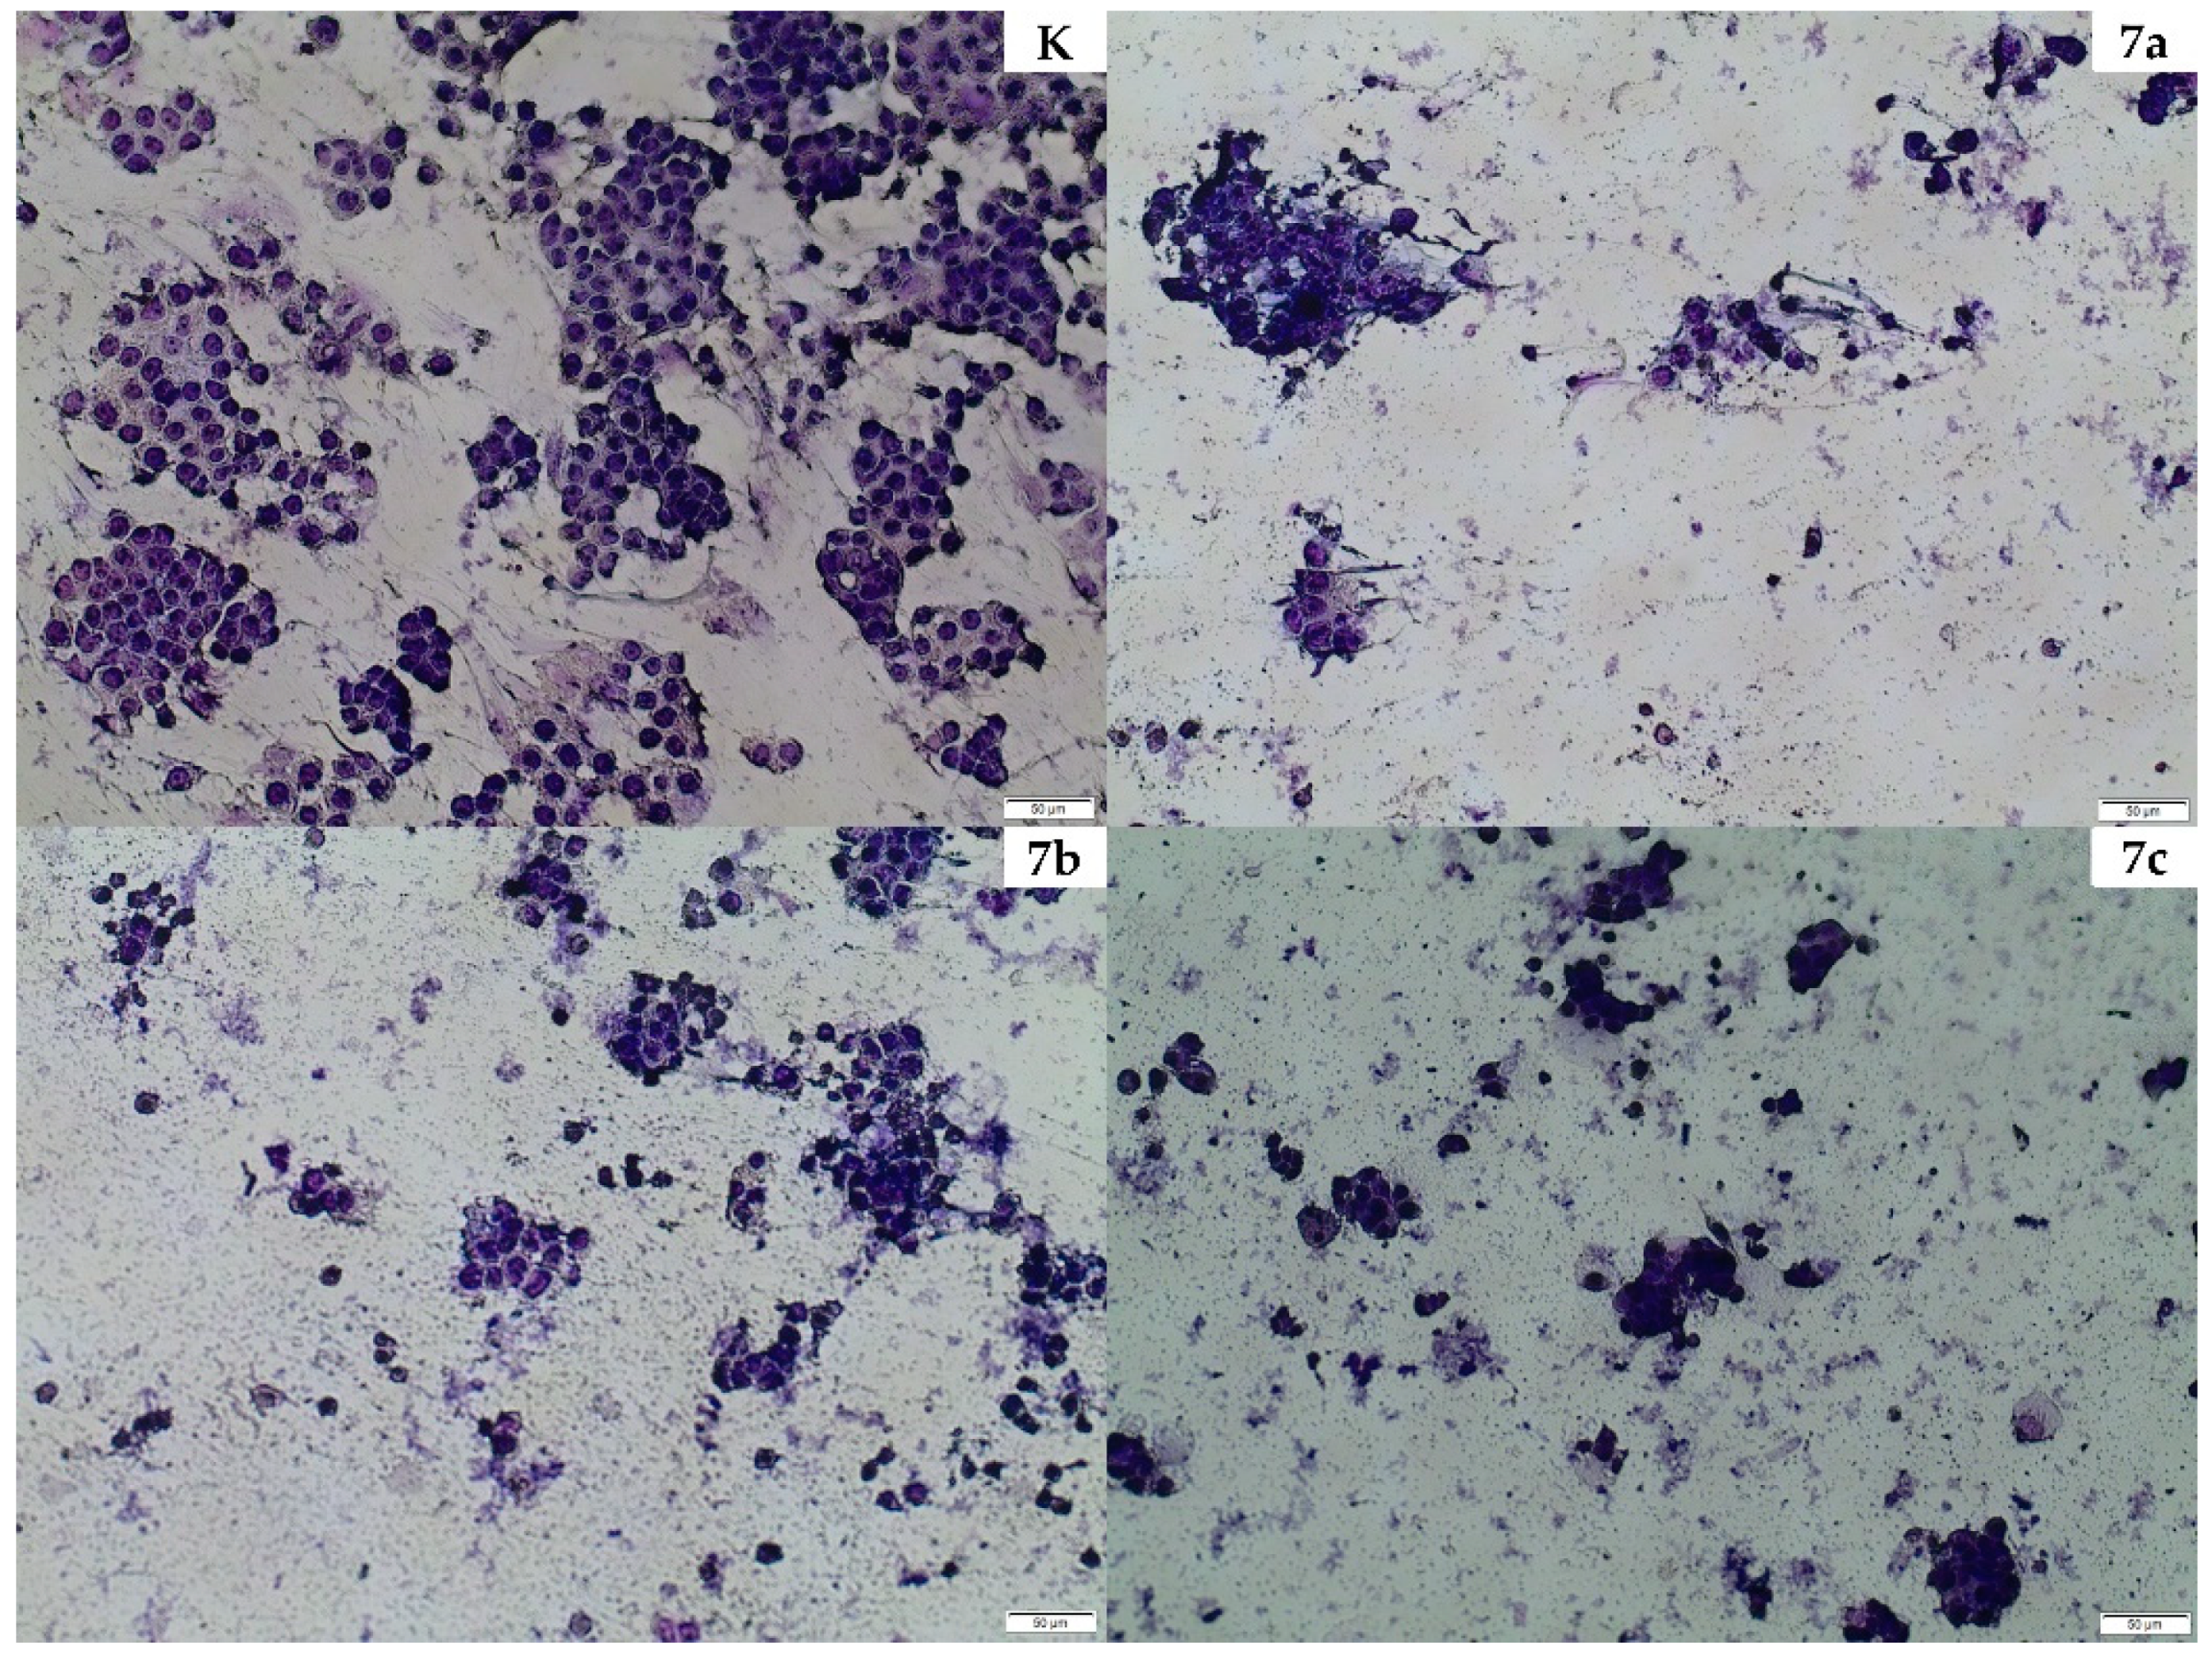
2.4. Cellular Morphology
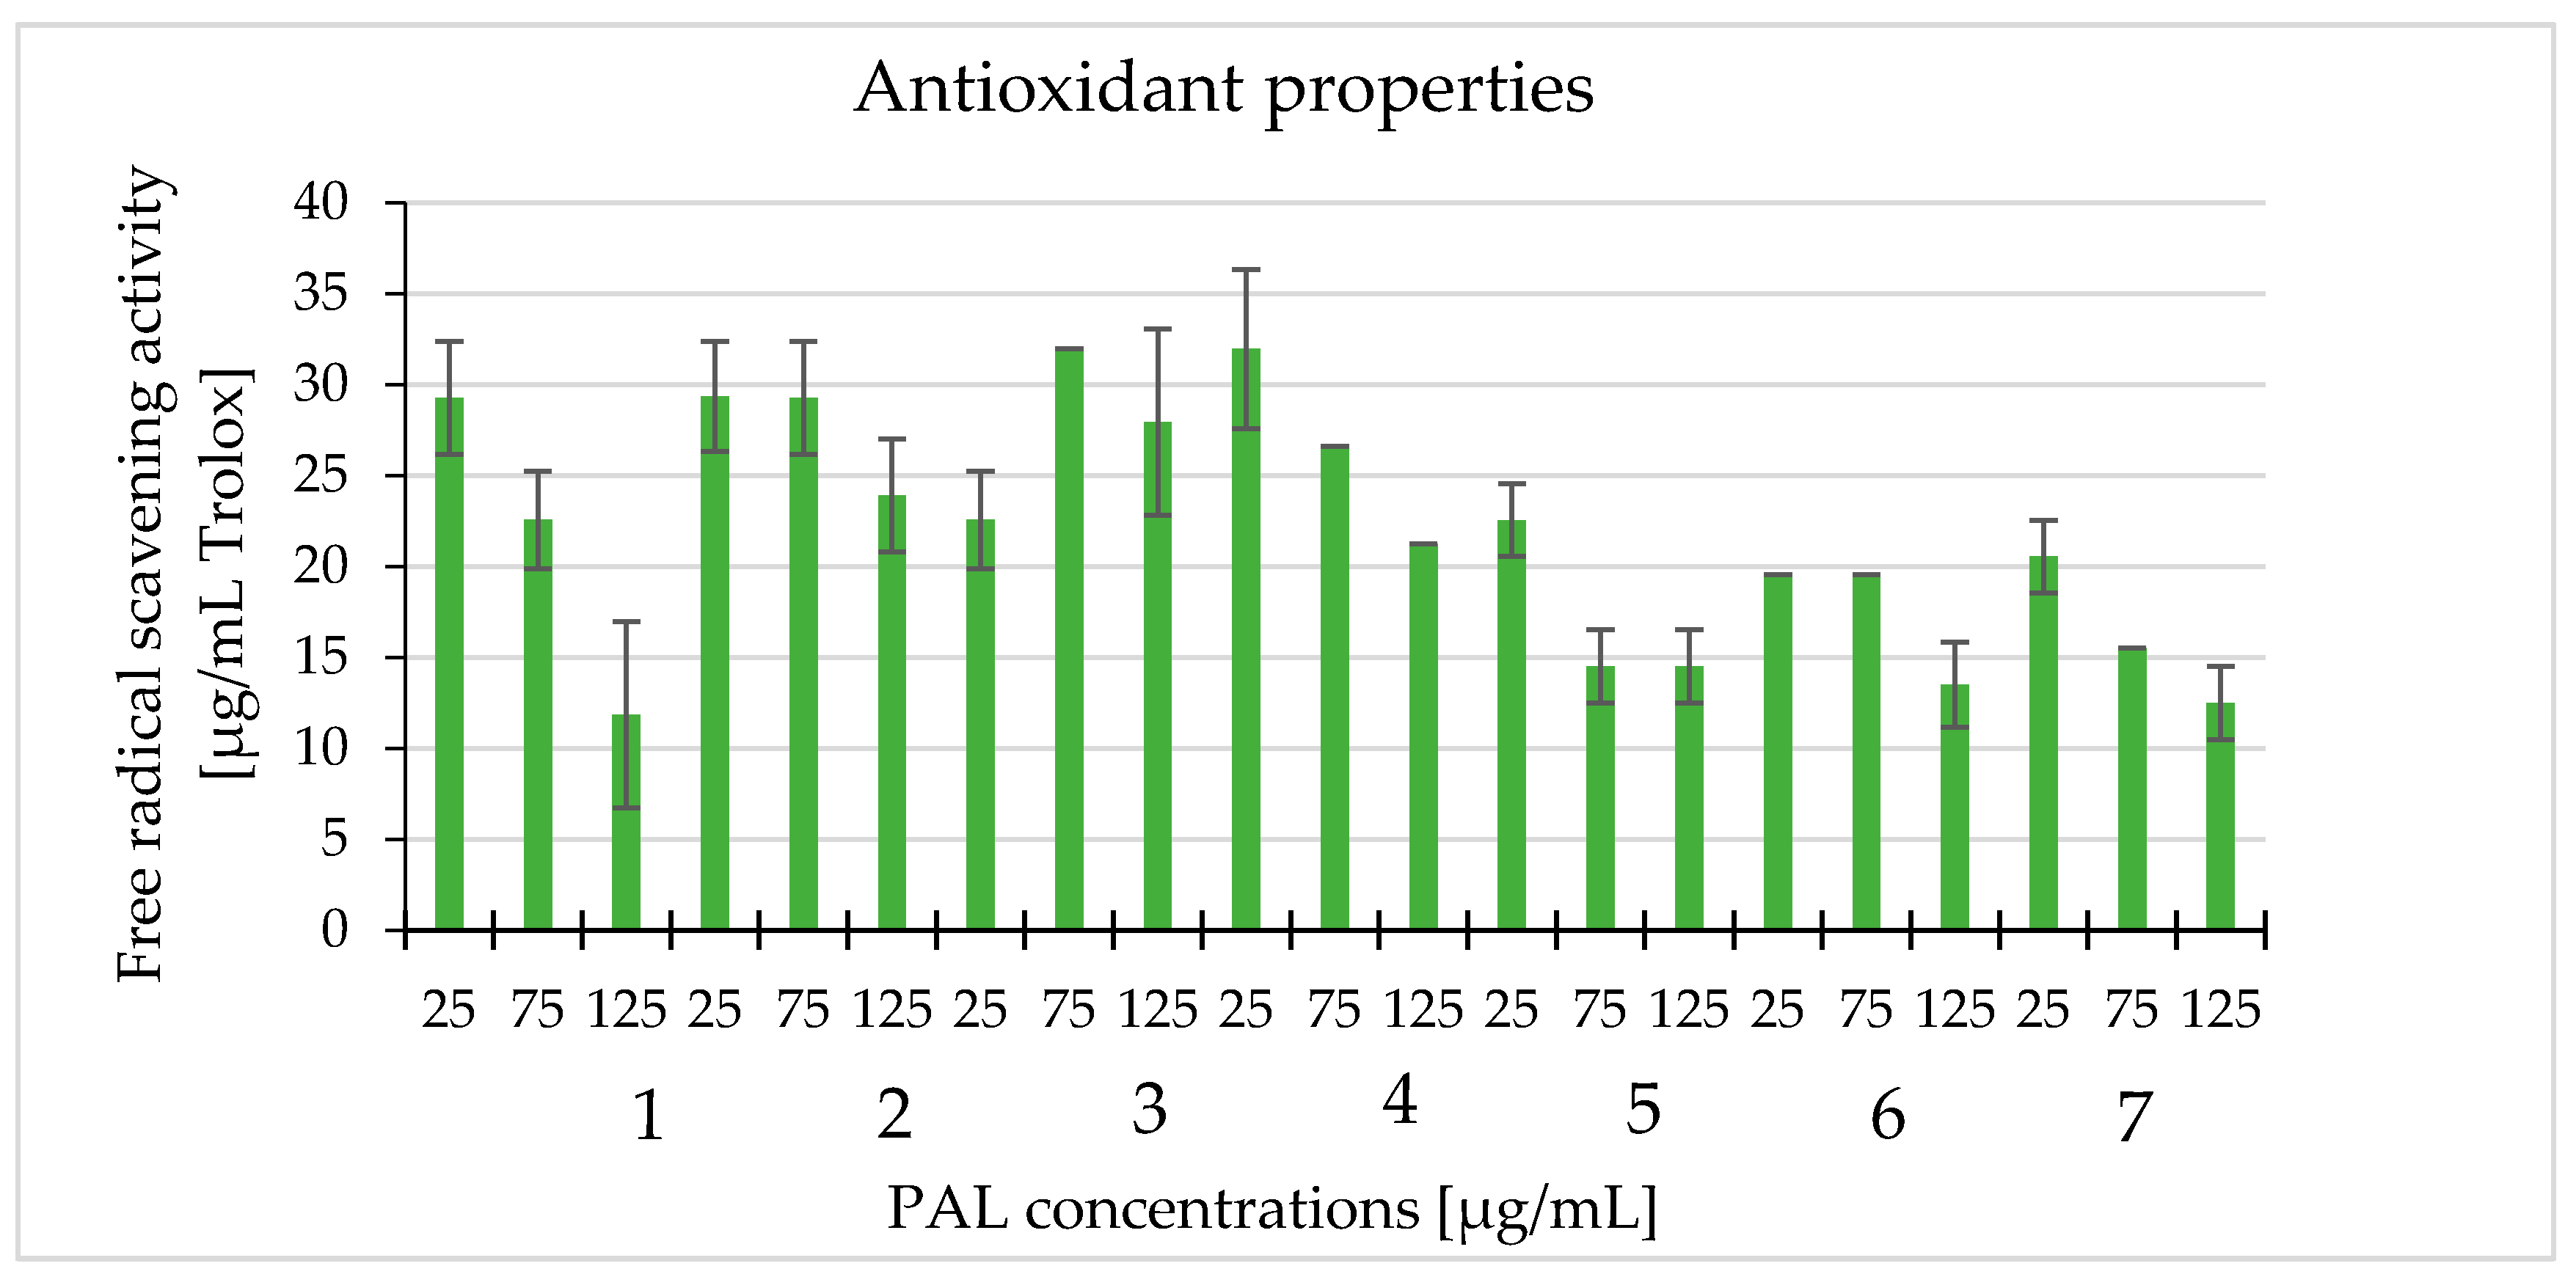
2.5. Antioxidant Properties
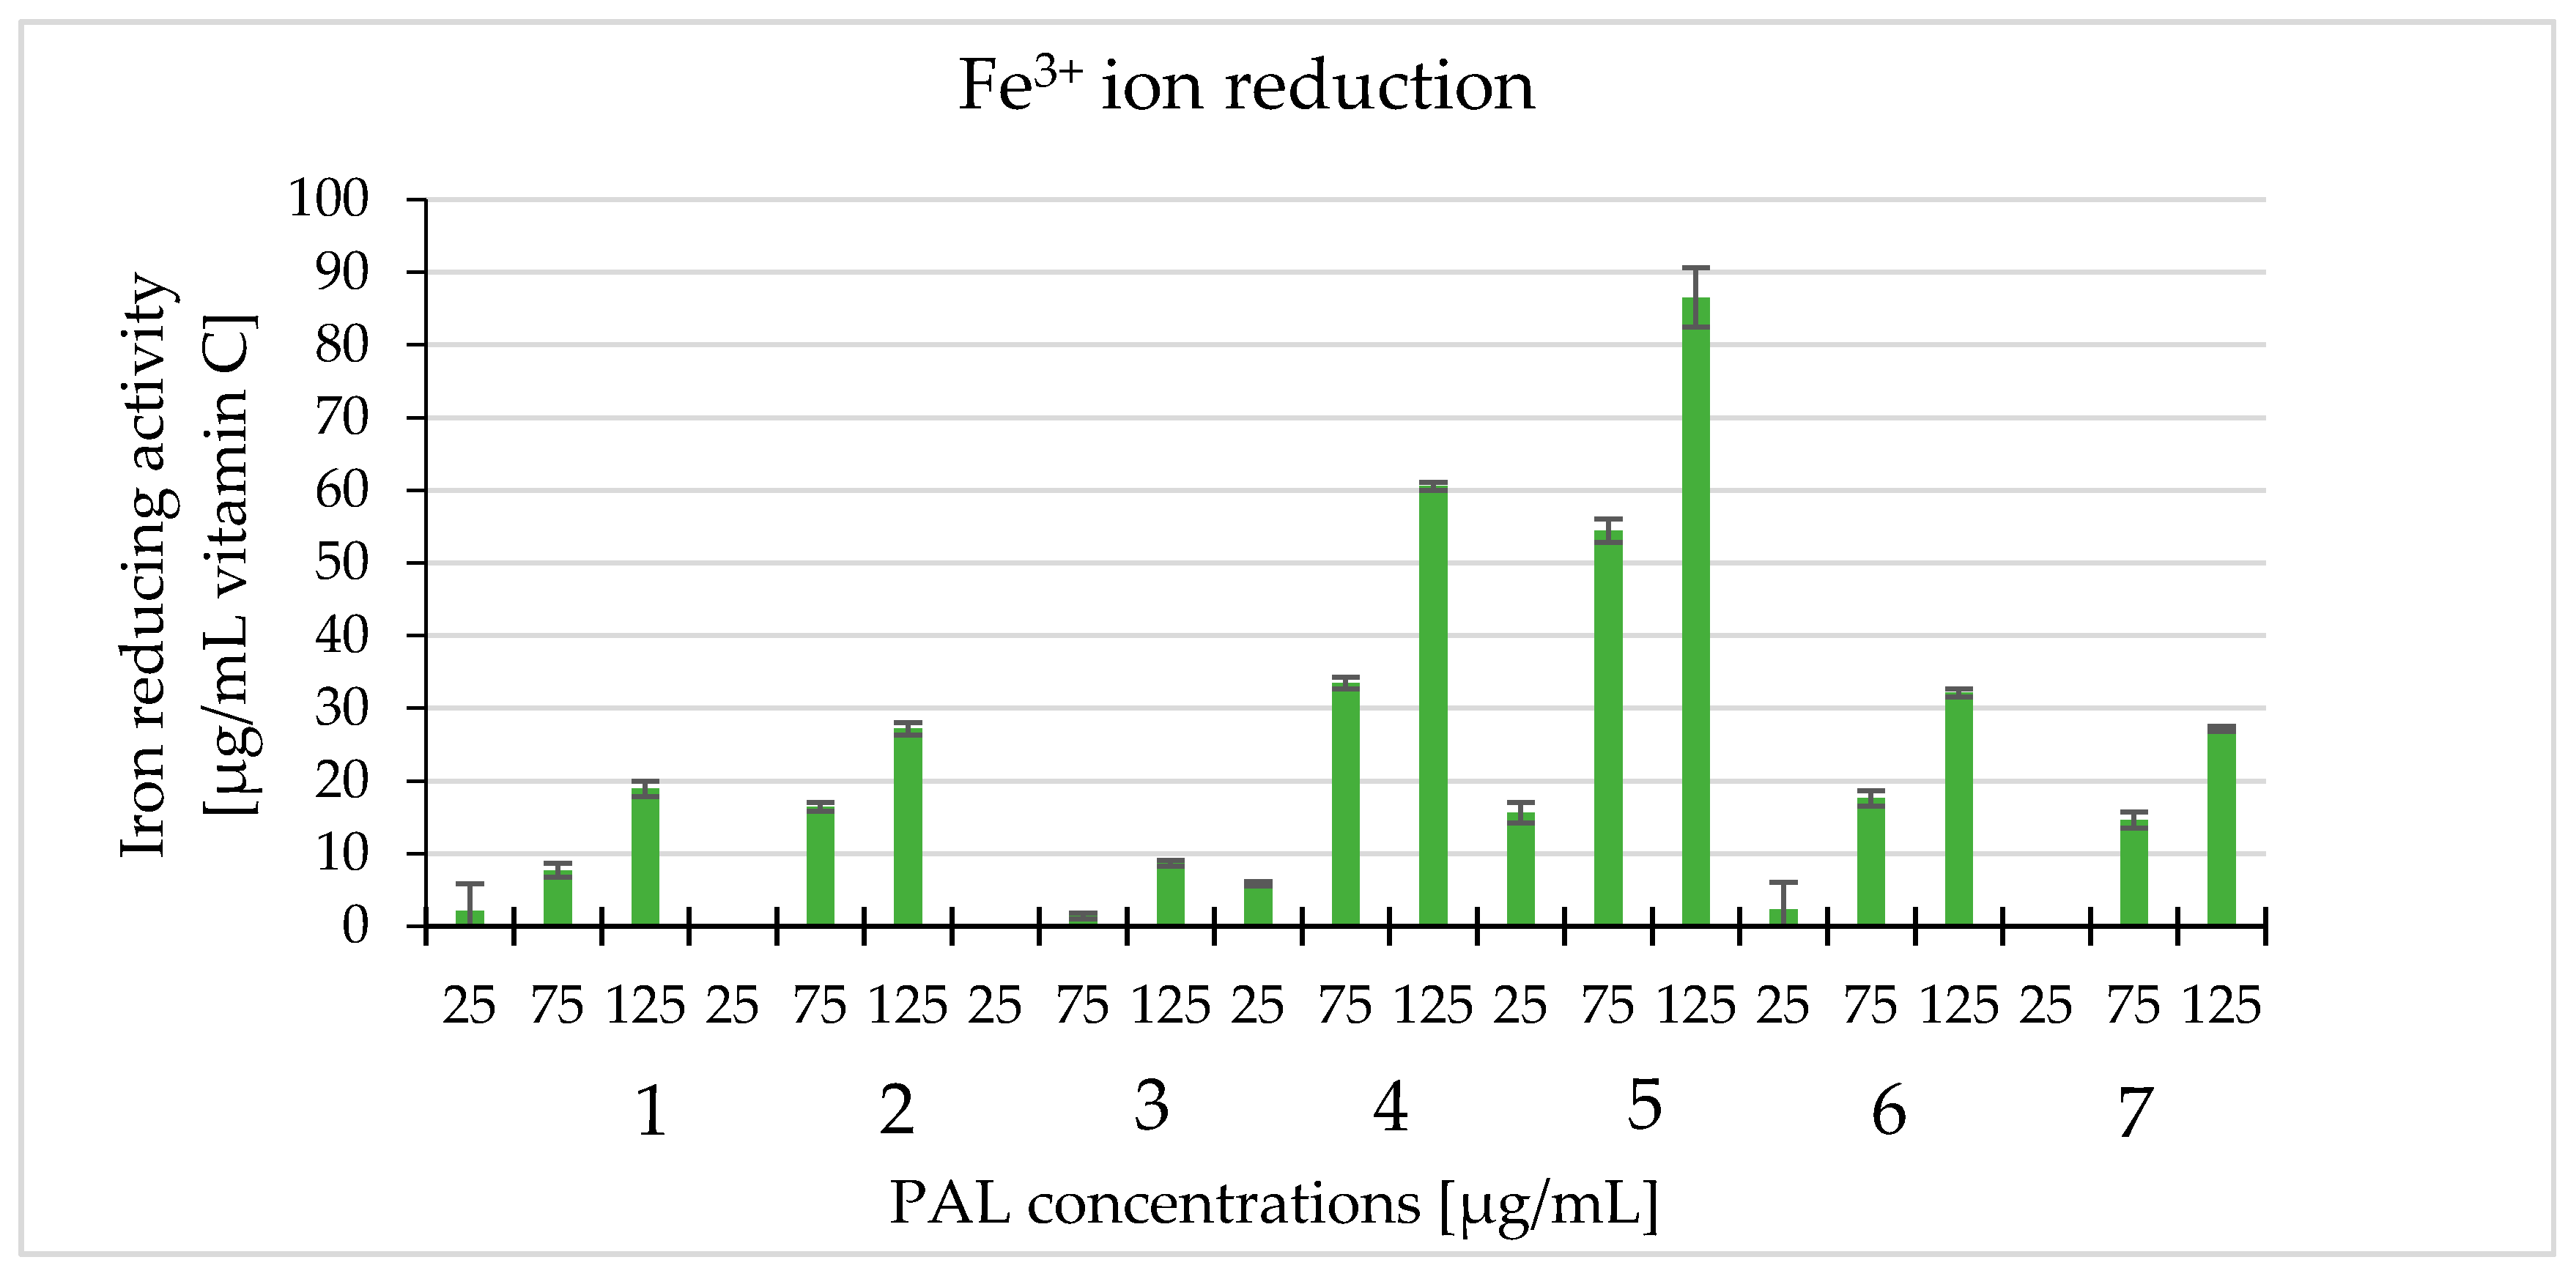
2.6. Ferric Reducing of Antioxidant Power Assay—FRAP Method (Fe3+ Ion Reduction)
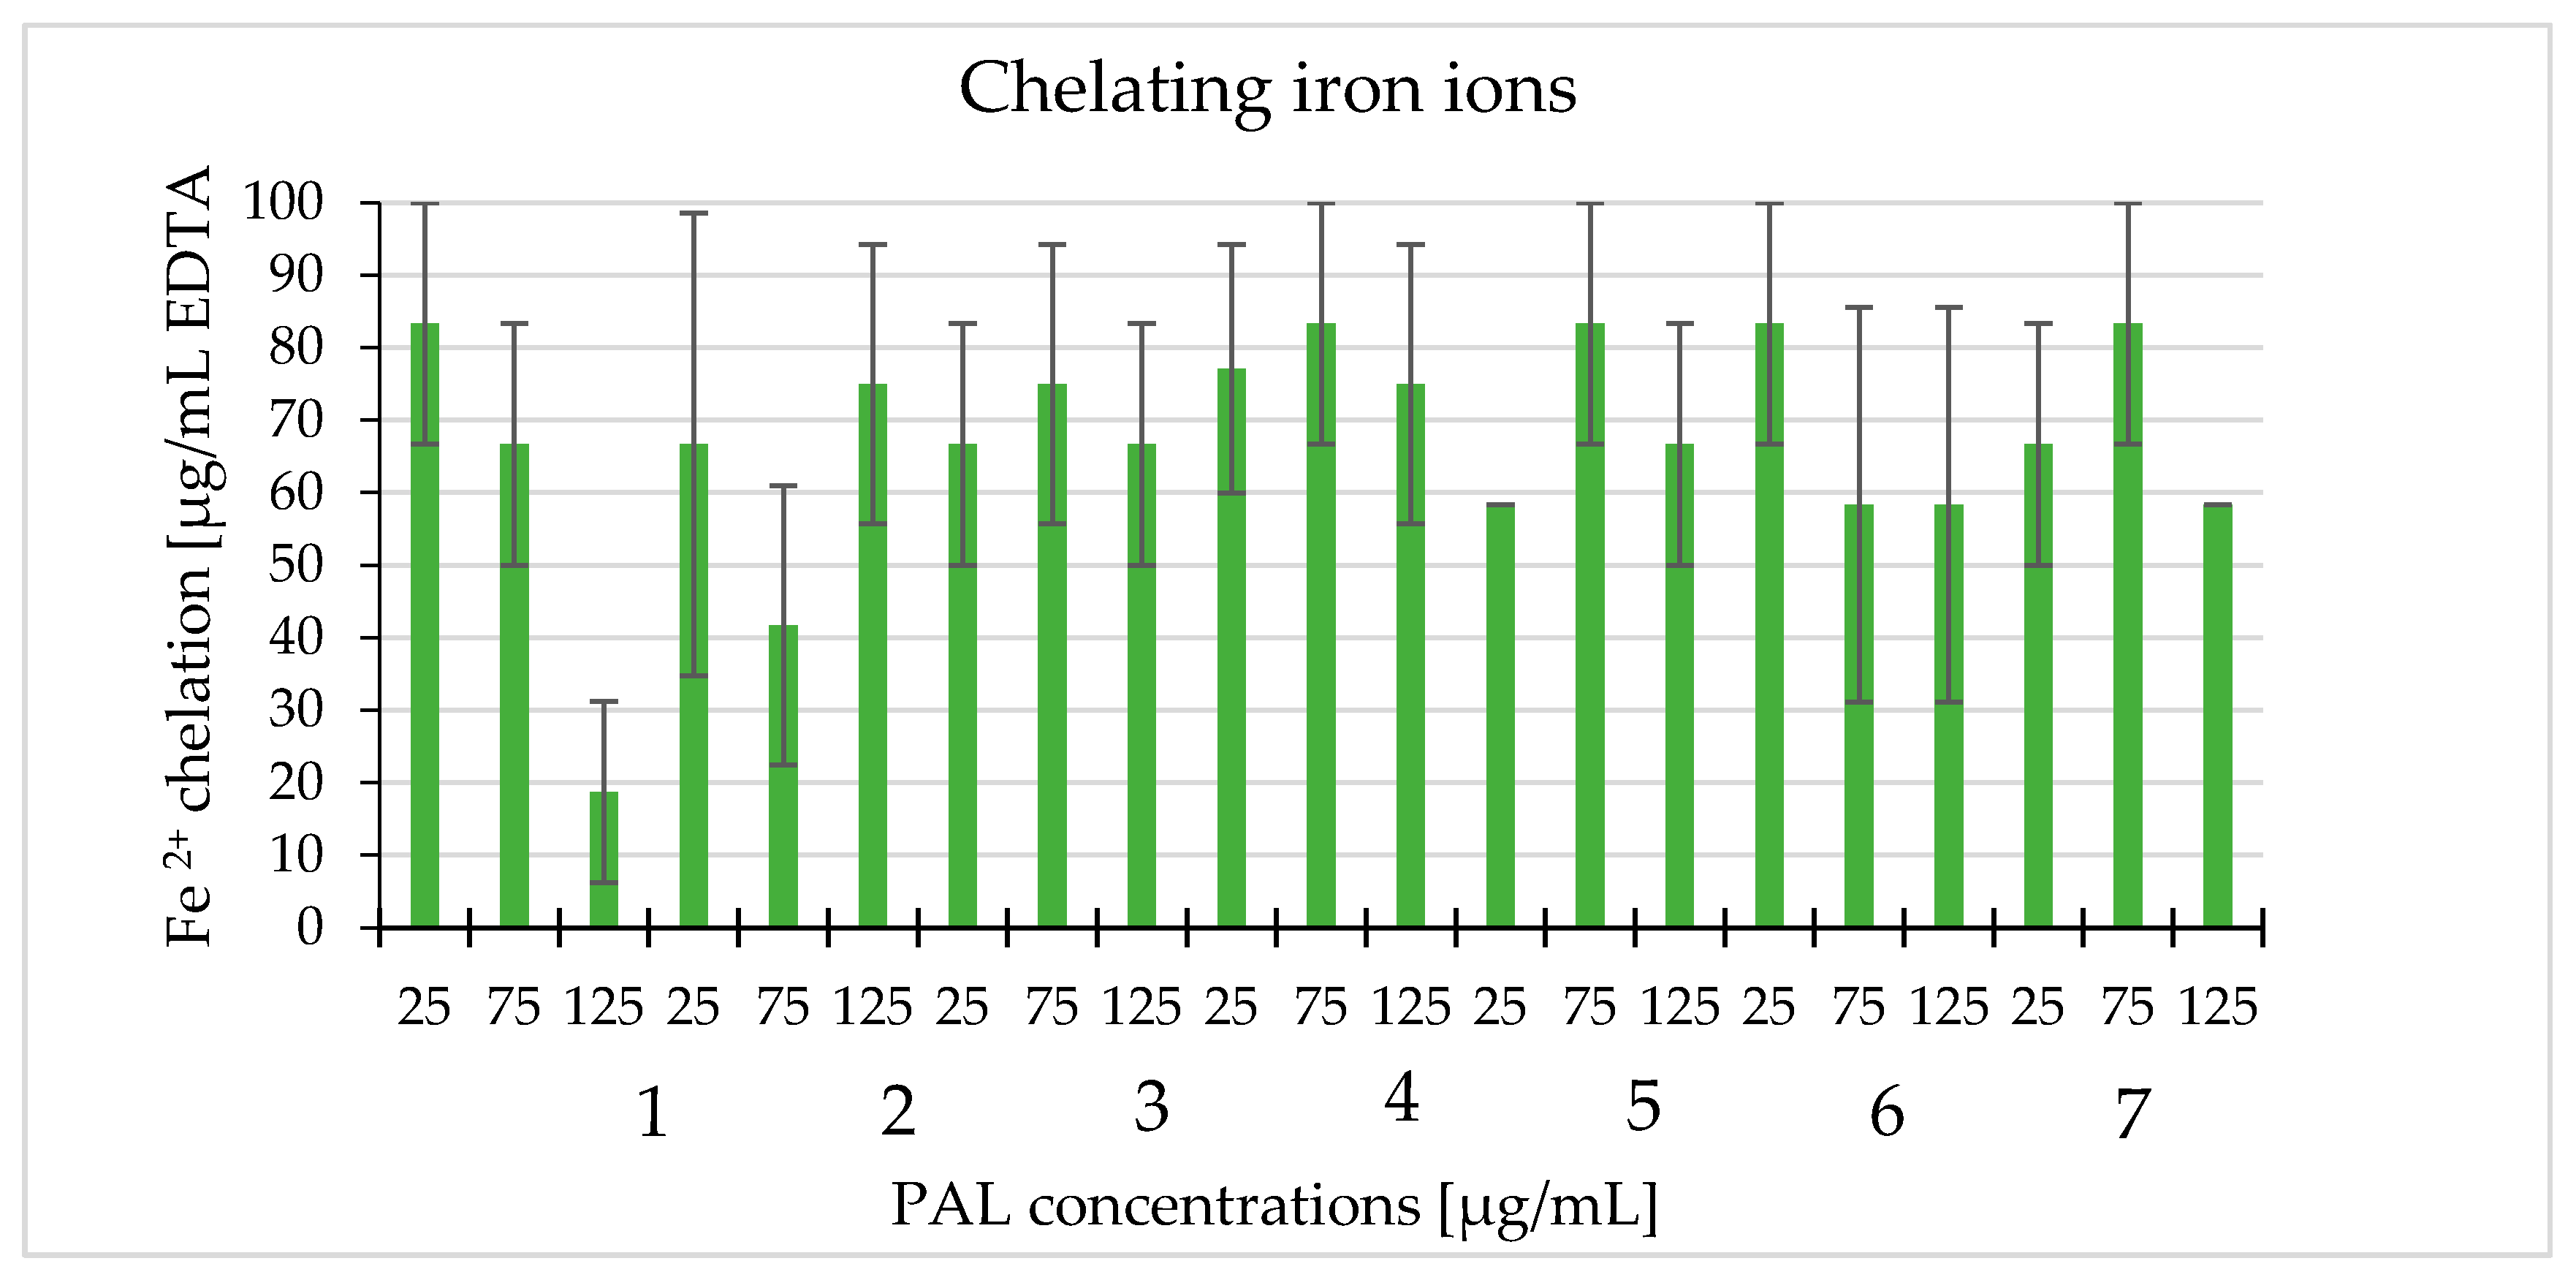
2.7. Chelating Iron Ions
2.8. Nitric Oxide (NOx) Production
3. Discussion
4. Materials and Methods
4.1. Materials
4.1.1. Chemicals and Reagents
4.1.2. Plant Materials
4.2. Methods
4.2.1. Cell Cultures
4.2.2. Preparation of the Extracts
4.2.3. LC-ESI-MS Analysis
4.2.4. Samples Preparation
4.2.5. Cytotoxicity
Neutral Red (NR) Uptake Assay
MTT Assay
4.2.6. Cell Proliferation Analysis
4.2.7. Cellular Morphology Analysis
May–Grünwald–Giemsa Staining
4.2.8. Antioxidant Properties
DPPH Method
4.2.9. Ability to Reduce Iron Ions
FRAP Method
4.2.10. The Ability to Chelate Fe2+ Ions
4.2.11. Determination of Nitric Oxide Level
Griess Test
4.3. Statistical Analysis
Supplementary Materials
Author Contributions
Funding
Conflicts of Interest
References
- Bray, F.; Ferlay, J.; Soerjomataram, I.; Siegel, R.L.; Torre, L.A.; Jemal, A. Global cancer statistics 2018: GLOBOCAN estimates of incidence and mortality worldwide for 36 cancers in 185 countries. CA Cancer J. Clin. 2018, 68, 394–424. [Google Scholar] [CrossRef] [PubMed] [Green Version]
- Matuszewska, A.; Stefaniuk, D.; Jaszek, M.; Pięt, M.; Zając, A.; Matuszewski, Ł.; Cios, I.; Grąz, M.; Paduch, R.; Bancerz, R. Antitumor potential of new low molecular weight antioxidative preparations from the white rot fungus Cerrena unicolor against human colon cancer cells. Sci. Rep. 2019, 9, 1–10. [Google Scholar] [CrossRef] [Green Version]
- Kessler, J.H.; Mullauer, F.B.; de Roo, G.M.; Medema, J.P. Broad in vitro efficacy of plant-derived betulinic acid against cell lines derived from the most prevalent human cancer types. Cancer Lett. 2007, 251, 132–145. [Google Scholar] [CrossRef] [PubMed]
- Encalada, M.A.; Hoyos, K.M.; Rehecho, S.; Berasategi, I.; de Ciriano, M.G.-Í.; Ansorena, D.; Astiasarán, I.; Navarro-Blasco, Í.; Cavero, R.Y.; Calvo, M.I. Anti-proliferative effect of Melissa officinalis on human colon cancer cell line. Plant Foods Hum. Nutr. 2011, 66, 328–334. [Google Scholar] [CrossRef] [PubMed]
- Uysal, S.; Zengin, G.; Locatelli, M.; Bahadori, M.; Mocan, A.; Bellagamba, G.; De Luca, E.; Mollica, A.; Aktumsek, A. Cytotoxic and enzyme inhibitory potential of two Potentilla species (P. speciosa L. and P. reptans Willd.) and their chemical composition. Front. Pharmacol. 2017, 8, 290. [Google Scholar] [CrossRef]
- Cilović, E.; Bosnić, T.; Pilipović, S.; Kundalić, B.; Sljivic Husejnović, M. TLC analysis of rhizomes Potentilla alba, Potentilla erecta, Potentilla reptans and their application in therapeutic purposes. Pharmacia 2015, 18, 36–42. [Google Scholar]
- Grujić-Vasić, J.; Pilipović, S.; Bosnić, T.; Redžić, S. Antimicrobial activity of different extracts from rhizome and root of Potentilla erecta L. Raeuschel and Potentilla alba L. Rosaceae. Acta Med. Acad. 2006, 35, 9–14. [Google Scholar]
- Kovalenko, P.G.; Antonjuk, V.P.; Maliuta, S.S. Secondary metabolites synthesis in transformed cells of Glycyrrhiza glabra L. and Potentilla alba L. as producents of radioprotective compounds. Ukr. Bioorg. Acta 2004, 1–2, 13–22. [Google Scholar]
- Tomczyk, M.; Latté, K.P. Potentilla—A review of its phytochemical and pharmacological profile. J. Ethnopharmacol. 2009, 122, 184–204. [Google Scholar] [CrossRef]
- Panfil, P.; Chiru, T. Therapeutic and pharmacological potential of Potentilla alba L. species. In “Conservation of Plant Diversity”, International Scientific Symposium, 5th ed.; Academy of Sciences of Moldova: Chișinău, Republic of Moldova, 2017; p. 98. [Google Scholar]
- Nya, E.J.; Austin, B. Use of bacterial lipopolysaccharide (LPS) as an immunostimulant for the control of Aeromonas hydrophila infections in rainbow trout Oncorhynchus mykiss (Walbaum). J. Appl. Microbiol. 2010, 108, 686–694. [Google Scholar] [CrossRef]
- Sung, J.-Y.; Na, K.; Kim, H.-S. Down-regulation of inositol polyphosphate 4-phosphatase type II expression in colorectal carcinoma. Anticancer Res. 2017, 37, 5525–5531. [Google Scholar] [CrossRef] [Green Version]
- Raup-Konsavage, W.M.; Johnson, M.; Legare, C.A.; Yochum, G.S.; Morgan, D.J.; Vrana, K.E. Synthetic cannabinoid activity against colorectal cancer cells. Cannabis Cannabinoid Res. 2018, 3, 272–281. [Google Scholar] [CrossRef] [PubMed]
- Albrecht, M.; Jiang, W.; Kumi-Diaka, J.; Lansky, E.P.; Gommersall, L.M.; Patel, A.; Mansel, R.E.; Neeman, I.; Geldof, A.A.; Campbell, M.J. Pomegranate extracts potently suppress proliferation, xenograft growth, and invasion of human prostate cancer cells. J. Med. Food 2004, 7, 274–283. [Google Scholar] [CrossRef]
- Juan, M.E.; Wenzel, U.; Ruiz-Gutierrez, V.; Daniel, H.; Planas, J.M. Olive fruit extracts inhibit proliferation and induce apoptosis in HT-29 human colon cancer cells. J. Nutr. 2006, 136, 2553–2557. [Google Scholar] [CrossRef] [PubMed] [Green Version]
- Alam, M.N.; Almoyad, M.; Huq, F. Polyphenols in colorectal cancer: Current state of knowledge including clinical trials and molecular mechanism of action. Biomed Res. Int. 2018, 2018, 1–29. [Google Scholar] [CrossRef] [PubMed] [Green Version]
- Kashyap, D.; Sharma, A.; Tuli, H.S.; Sak, K.; Punia, S.; Mukherjee, T.K. Kaempferol—A dietary anticancer molecule with multiple mechanisms of action: Recent trends and advancements. J. Funct. Foods 2017, 30, 203–219. [Google Scholar] [CrossRef] [PubMed]
- Rasouli, H.; Farzaei, M.H.; Khodarahmi, R. Polyphenols and their benefits: A review. Int. J. Food Prop. 2017, 20, 1–42. [Google Scholar] [CrossRef] [Green Version]
- Cho, H.J.; Park, J.H.Y. Kaempferol induces cell cycle arrest in HT-29 human colon cancer cells. J. Cancer Prev. 2013, 18, 257–263. [Google Scholar] [CrossRef] [Green Version]
- Neumark-Sztainer, D.; Wall, M.; Perry, C.; Story, M. Correlates of fruit and vegetable intake among adolescents: Findings from Project EAT. Prev. Med. (Baltim) 2003, 37, 198–208. [Google Scholar] [CrossRef]
- Lesjak, M.; Beara, I.; Simin, N.; Pintać, D.; Majkić, T.; Bekvalac, K.; Orčić, D.; Mimica-Dukić, N. Antioxidant and anti-inflammatory activities of quercetin and its derivatives. J. Funct. Foods 2018, 40, 68–75. [Google Scholar] [CrossRef]
- Li, Y.; Yao, J.; Han, C.; Yang, J.; Chaudhry, M.; Wang, S.; Liu, H.; Yin, Y. Quercetin, inflammation and immunity. Nutrients 2016, 8, 167. [Google Scholar] [CrossRef] [PubMed]
- Lee, Y. Cancer chemopreventive potential of procyanidin. Toxicol. Res. 2017, 33, 273–282. [Google Scholar] [CrossRef] [PubMed]
- Murad, L.D.; Soares, N.d.C.P.; Brand, C.; Monteiro, M.C.; Teodoro, A.J. Effects of caffeic and 5-caffeoylquinic acids on cell viability and cellular uptake in human colon adenocarcinoma cells. Nutr. Cancer 2015, 67, 532–542. [Google Scholar] [CrossRef] [PubMed]
- Abbas, M.; Saeed, F.; Anjum, F.M.; Afzaal, M.; Tufail, T.; Bashir, M.S.; Ishtiaq, A.; Hussain, S.; Suleria, H.A.R. Natural polyphenols: An overview. Int. J. Food Prop. 2017, 20, 1689–1699. [Google Scholar] [CrossRef] [Green Version]
- Andriamadio, J.H.; Rasoanaivo, L.H.; Benedec, D.; Vlase, L.; Gheldiu, A.-M.; Duma, M.; Toiu, A.; Raharisololalao, A.; Oniga, I. HPLC/MS analysis of polyphenols, antioxidant and antimicrobial activities of Artabotrys hildebrandtii O. Hffm. extracts. Nat. Prod. Res. 2015, 29, 2188–2196. [Google Scholar] [CrossRef]
- Damien Dorman, H.J.; Shikov, A.N.; Pozharitskaya, O.N.; Hiltunen, R. Antioxidant and pro-oxidant evaluation of a Potentilla alba L. rhizome extract. Chem. Biodivers. 2011, 8, 1344–1356. [Google Scholar] [CrossRef]
- Matkowski, A.; Świąder, K.; Ślusarczyk, S.; Jezierska-Domaradzka, A.; Oszmiański, J. Free radical scavenging activity of extracts obtained from cultivated plants of Potentilla alba L. and Waldsteinia geoides L. Herba Pol. 2006, 52, 91–97. [Google Scholar]
- Chen, J.-R.; Yang, Z.-Q.; Hu, T.-J.; Yan, Z.-T.; Niu, T.-X.; Wang, L.; Cui, D.-A.; Wang, M. Immunomodulatory activity in vitro and in vivo of polysaccharide from Potentilla anserina. Fitoterapia 2010, 81, 1117–1124. [Google Scholar] [CrossRef]
- Paduch, R.; Wiater, A.; Locatelli, M.; Pleszczyńska, M.; Tomczyk, M. Aqueous extracts of selected Potentilla species modulate biological activity of human normal colon cells. Curr. Drug Targets 2015, 16, 1495–1502. [Google Scholar] [CrossRef]
- Yu, H.-J.; Ahn, C.-H.; Yang, I.-H.; Won, D.-H.; Jin, B.; Cho, N.-P.; Hong, S.; Shin, J.-A.; Cho, S.-D. Apoptosis induced by methanol extract of Potentilla discolor in human mucoepidermoid carcinoma cells through STAT3/PUMA signaling axis. Mol. Med. Rep. 2018, 17, 5258–5264. [Google Scholar] [CrossRef]
- Wan, G.; Tao, J.-G.; Wang, G.-D.; Liu, S.-P.; Zhao, H.-X.; Liang, Q.-D. In vitro antitumor activity of the ethyl acetate extract of Potentilla chinensis in osteosarcoma cancer cells. Mol. Med. Rep. 2016, 14, 3634–3640. [Google Scholar] [CrossRef] [PubMed] [Green Version]
- Anal, J.M.H.; Majeed, R.; Bez, G.; Syiem, D.; Hamid, A.; Saxena, A.K. In vitro cytotoxicity of the polar extracts of Potentilla fulgens L. against human cancer cell lines: Detection and isolation of bioactive phenolics. J. Chem. Pharm. Res. 2014, 6, 89–95. [Google Scholar]
- Tripathy, D.; Choudhary, A.; Banerjee, U.C.; Singh, I.P.; Chatterjee, A. Induction of apoptosis and reduction of endogenous glutathione level by the ethyl-acetate soluble fraction of the methanol extract of the roots of Potentilla fulgens in cancer cells. PLoS ONE 2015, 10, 1–16. [Google Scholar] [CrossRef]
- Radovanovic, A.M.; Cupara, S.M.; Popovic, S.L.; Tomovic, M.T.; Slavkovska, V.N.; Jankovic, S.M. Cytotoxic effect of Potentilla reptans L. rhizome and aerial part extracts. Acta Pol. Pharm. 2013, 70, 851–854. [Google Scholar]
- Zu, X.L.; Guppy, M. Cancer metabolism: Facts, fantasy, and fiction. Biochem. Biophys. Res. Commun. 2004, 313, 459–465. [Google Scholar] [CrossRef] [PubMed]
- Sreedhar, A.; Zhao, Y. Dysregulated metabolic enzymes and metabolic reprogramming in cancer cells. Biomed. Rep. 2017, 8, 3–10. [Google Scholar] [CrossRef] [PubMed]
- Dröge, W. Free radicals in the physiological control of cell function. Physiol. Rev. 2002, 82, 47–95. [Google Scholar] [CrossRef]
- Vannini, F.; Kashfi, K.; Nath, N. The dual role of iNOS in cancer. Redox Biol. 2015, 6, 334–343. [Google Scholar] [CrossRef] [Green Version]
- Gudej, J.; Tomczyk, M. Polyphenolic compounds from flowers of Ficaria verna Huds. Acta Pol. Pharm. 1999, 56, 475–476. [Google Scholar]
- Nazaruk, J.; Jakoniuk, P. Flavonoid composition and antimicrobial activity of Cirsium rivulare (Jacq.) All. flowers. J. Ethnopharmacol. 2005, 102, 208–212. [Google Scholar] [CrossRef]
- Tomczyk, M. Secondary metabolites from Potentilla recta L. and Drymocallis rupestris (L.) Soják (syn. Potentilla rupestris L.) (Rosaceae). Biochem. Syst. Ecol. 2011, 39, 893–896. [Google Scholar] [CrossRef]
- Zhang, S.-Z.; Lipsky, M.; Trump, B.; Hsu, I.-C. Neutral red (NR) assay for cell viability and xenobiotic-induced cytotoxicity in primary cultures of human and rat hepatocytes. Cell Biol. Toxicol. 1990, 6, 219–234. [Google Scholar] [CrossRef] [PubMed]
- van Meerloo, J.; Kaspers, G.J.L.; Cloos, J. Cell sensitivity assays: The MTT assay. In Cancer Cell Culture. Methods in Molecular Biology (Methods and Protocols); Humana Press: Totowa, NJ, USA, 2011; Volume 731, pp. 237–245. [Google Scholar]
- Sharma, O.P.; Bhat, T.K. DPPH antioxidant assay revisited. Food Chem. 2009, 113, 1202–1205. [Google Scholar] [CrossRef]
Sample Availability: Samples of the compounds PAL1-PAL7 are available from the authors. |


| No. | tr (min) | Tentatively Identified Compounds | UV Maximum (nm) | [M + H]+/[M − H]− (m/z) |
|---|---|---|---|---|
| 1 | 7.64 | 3-O-caffeoylquinic acid | 240(sh), 323 | 377/353, 191 |
| 2 | 9.60 | 3-O-p-coumaroylquinic acid | 312 | 361, 303, 217, 144/337, 163 |
| 3 | 9.91 | 5-O-p-coumaroylquinic acid | 312 | 361, 303, 217, 144/337, 190 |
| 4 | 10.46 | 5-O-caffeoylquinic acid * | 295(sh), 325 | 377/707, 353, 191 |
| 5 | 10.60 | catechin * | 280 | 291/289 |
| 6 | 11.16 | 3-O-feruloylquinic acid | 295(sh), 325 | -/367, 193 |
| 7 | 11.47 | 4-O-caffeoylquinic acid | 245, 295(sh), 325 | 377, 355/707, 353 |
| 8 | 12.22 | (epi)catechin dimer isomer | 278 | 579/577, 287 |
| 9 | 13.40 | epicatechin * | 280 | 291/289 |
| 10 | 14.40 | (epi)catechin trimer isomer | 285, 330 | 865/863, 287 |
| 11 | 14.70 | (epi)catechin trimer isomer | 280 | 865/863 |
| 12 | 15.17 | quercetin derivatives | 260, 350 | 565, 303/563, 741 |
| 13 | 15.94 | quercetin-O-pentoso-hexoside isomer | 255, 355 | 303, 465, 597/595 |
| 14 | 16.30 | quercetin-O-pentoso-hexoside isomer | 255, 355 | 303, 465, 597/595 |
| 15 | 17.45 | quercetin 3-O-glucoside * | 255, 355 | 303, 465/463 |
| 16 | 17.55 | kaempferol-O-hexoso-hexoside | 265, 350 | 278, 449, 603/- |
| 17 | 17.64 | kaempferol-O-pentoso-hexoside | 265, 350 | 287, 449, 581/579 |
| 18 | 17.77 | quercetin-O-hexoside | 255, 355 | 303, 465/300, 463 |
| 19 | 17.84 | isorhamnetin-O-pentoso-hexoside | 255, 350 | 317, 479, 611, 633/- |
| 20 | 18.10 | quercetin 3-O-rutinoside * | 255, 350 | -/300, 463, 609 |
| 21 | 18.88 | kaempferol 3-O-galactoside * | 265, 350 | 287, 449/447 |
| 22 | 19.53 | kaempferol 3-O-glucoside * | 265, 350 | 287, 449/447 |
| 23 | 19.98 | isorhamnetin O-hexoside | 265, 355 | 317, 479/- |
| 24 | 25.25 | quercetin * | 255, 370 | 301/303 |
| 25 | 25.51 | tiliroside * | 265, 310 | 595/593 |
| 26 | 25.67 | procyanidin derivatives | 267, 330 | 625/623 |
| 27 | 26.15 | procyanidin derivatives | 265, 315 | 595/593 |
| 28 | 27.05 | procyanidin derivatives | 223, 295 | 584/582 |
| 29 | 27.94 | kaempferol * | 265, 365 | 287/285 |
| 30 | 28.23 | isorhamnetin * | 260, 375 | 317/315 |
| 31 | 43.98 | (epi)catechin dimer | 275, 325, 410 | 609/- |
| 32 | 44.71 | procyanidin derivatives | 275, 325, 410 | 593/- |
| 33 | 45.39 | procyanidin derivatives | 330, 410 | 593/- |
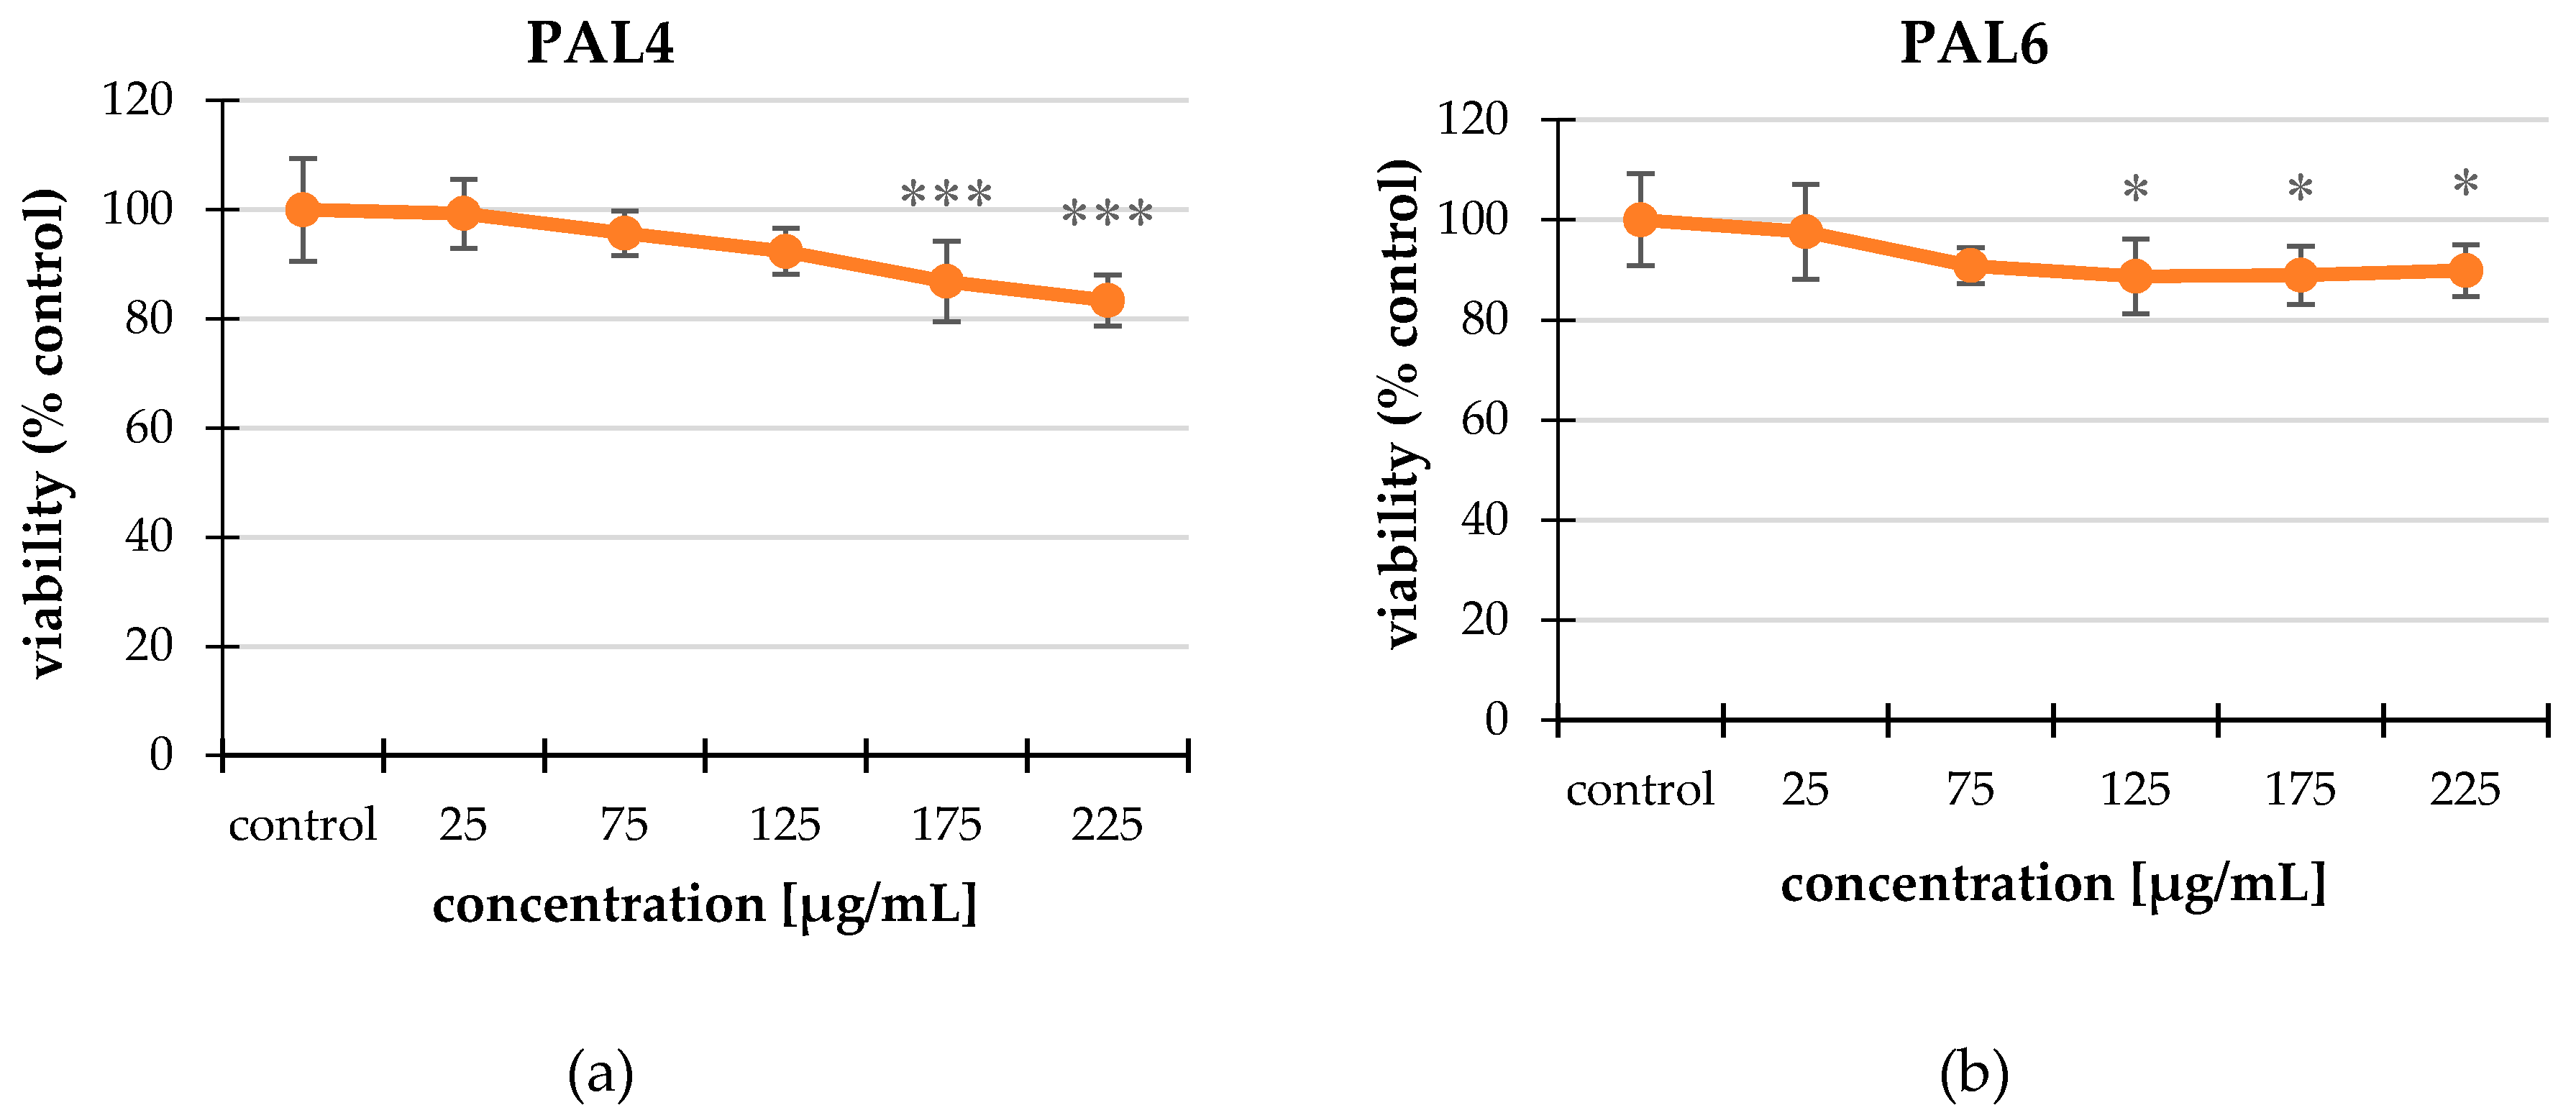
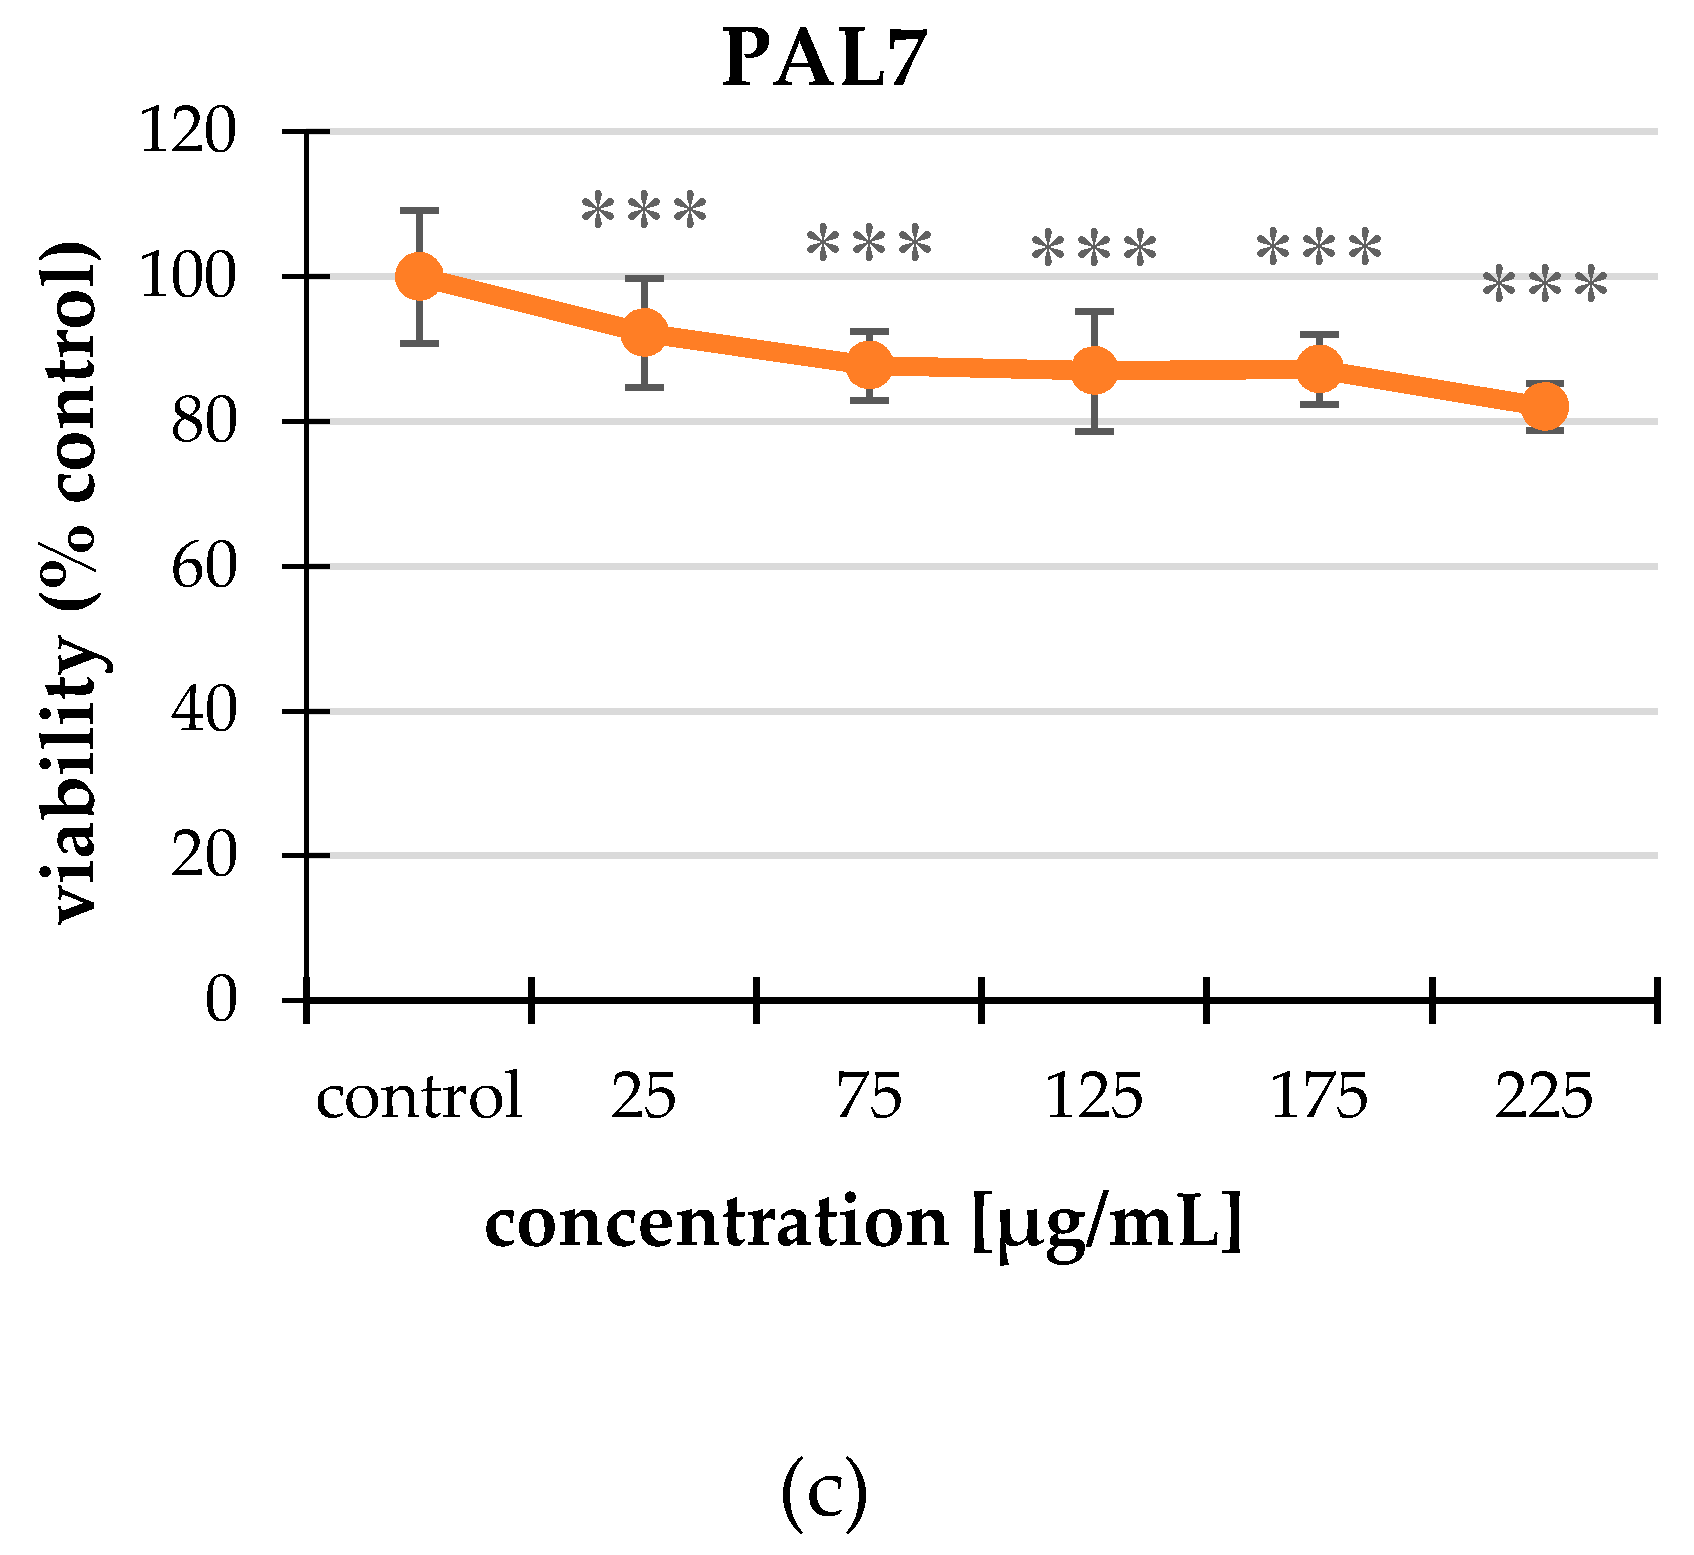
| Extract | Concentration [μg/mL] | Viability (% Control) |
|---|---|---|
| PAL4 | 25 | 99.28 ± 6.31 |
| 75 | 95.70 ± 4.10 | |
| 125 | 92.35 ± 4.21 | |
| 175 | 86.86 ± 7.43 *** | |
| 225 | 83.39 ± 4.68 *** | |
| PAL6 | 25 | 97.63 ± 9.51 |
| 75 | 90.85 ± 3.62 | |
| 125 | 88.70 ± 7.42 * | |
| 175 | 88.91 ± 5.80 * | |
| 225 | 89.88 ± 5.17 * | |
| PAL7 | 25 | 92.25 ± 7.47 *** |
| 75 | 87.73 ± 4.75 *** | |
| 125 | 86.98 ± 8.29 *** | |
| 175 | 87.19 ± 4.89 *** | |
| 225 | 82.02 ± 3.18 *** |
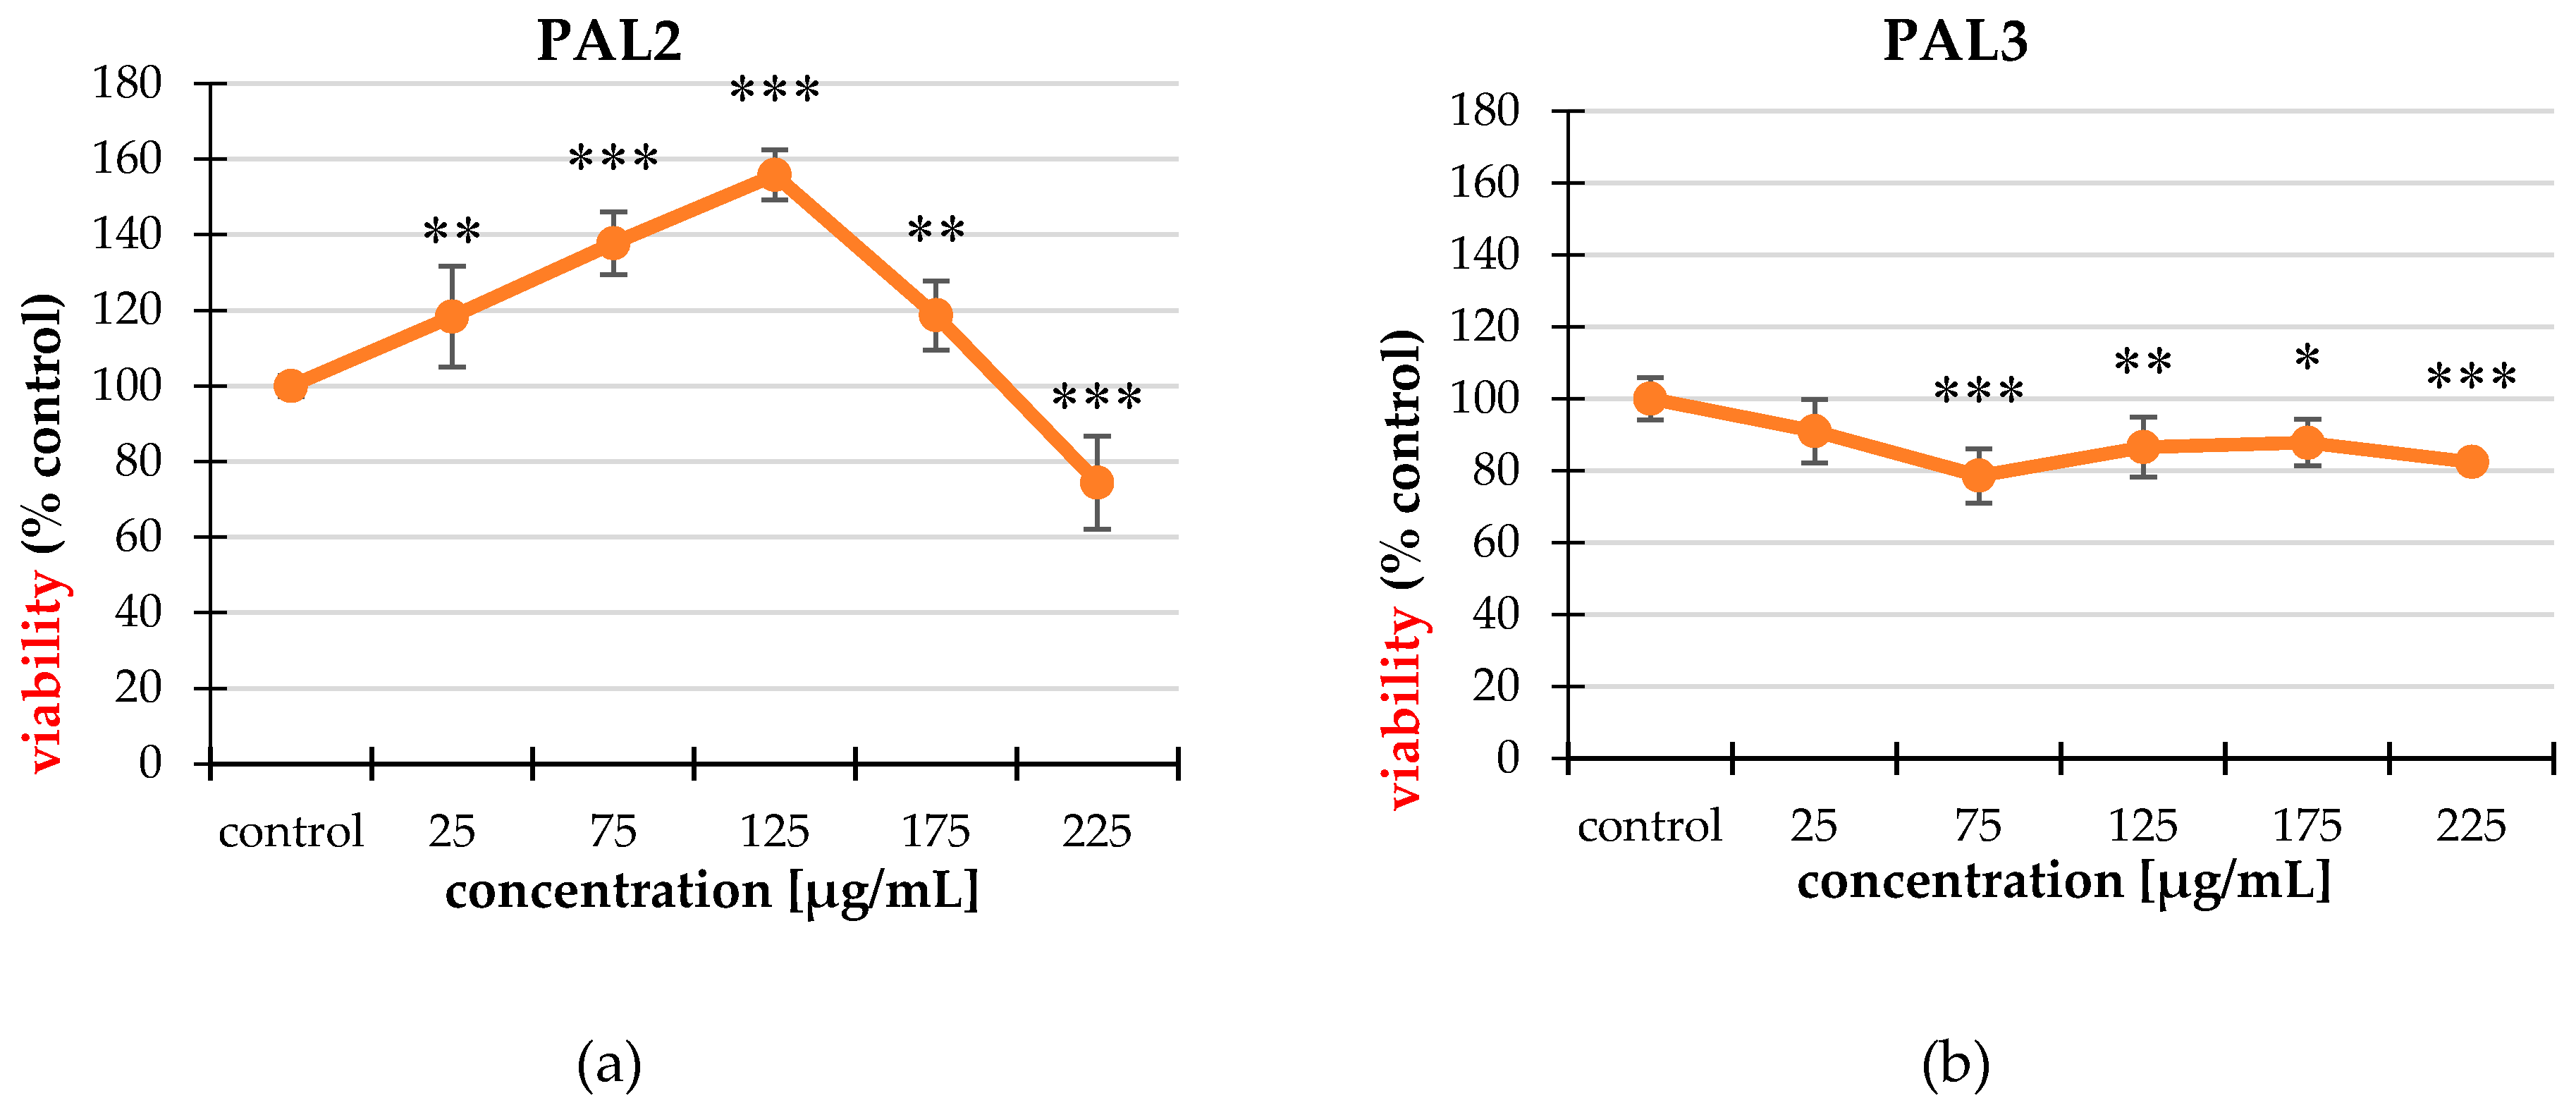
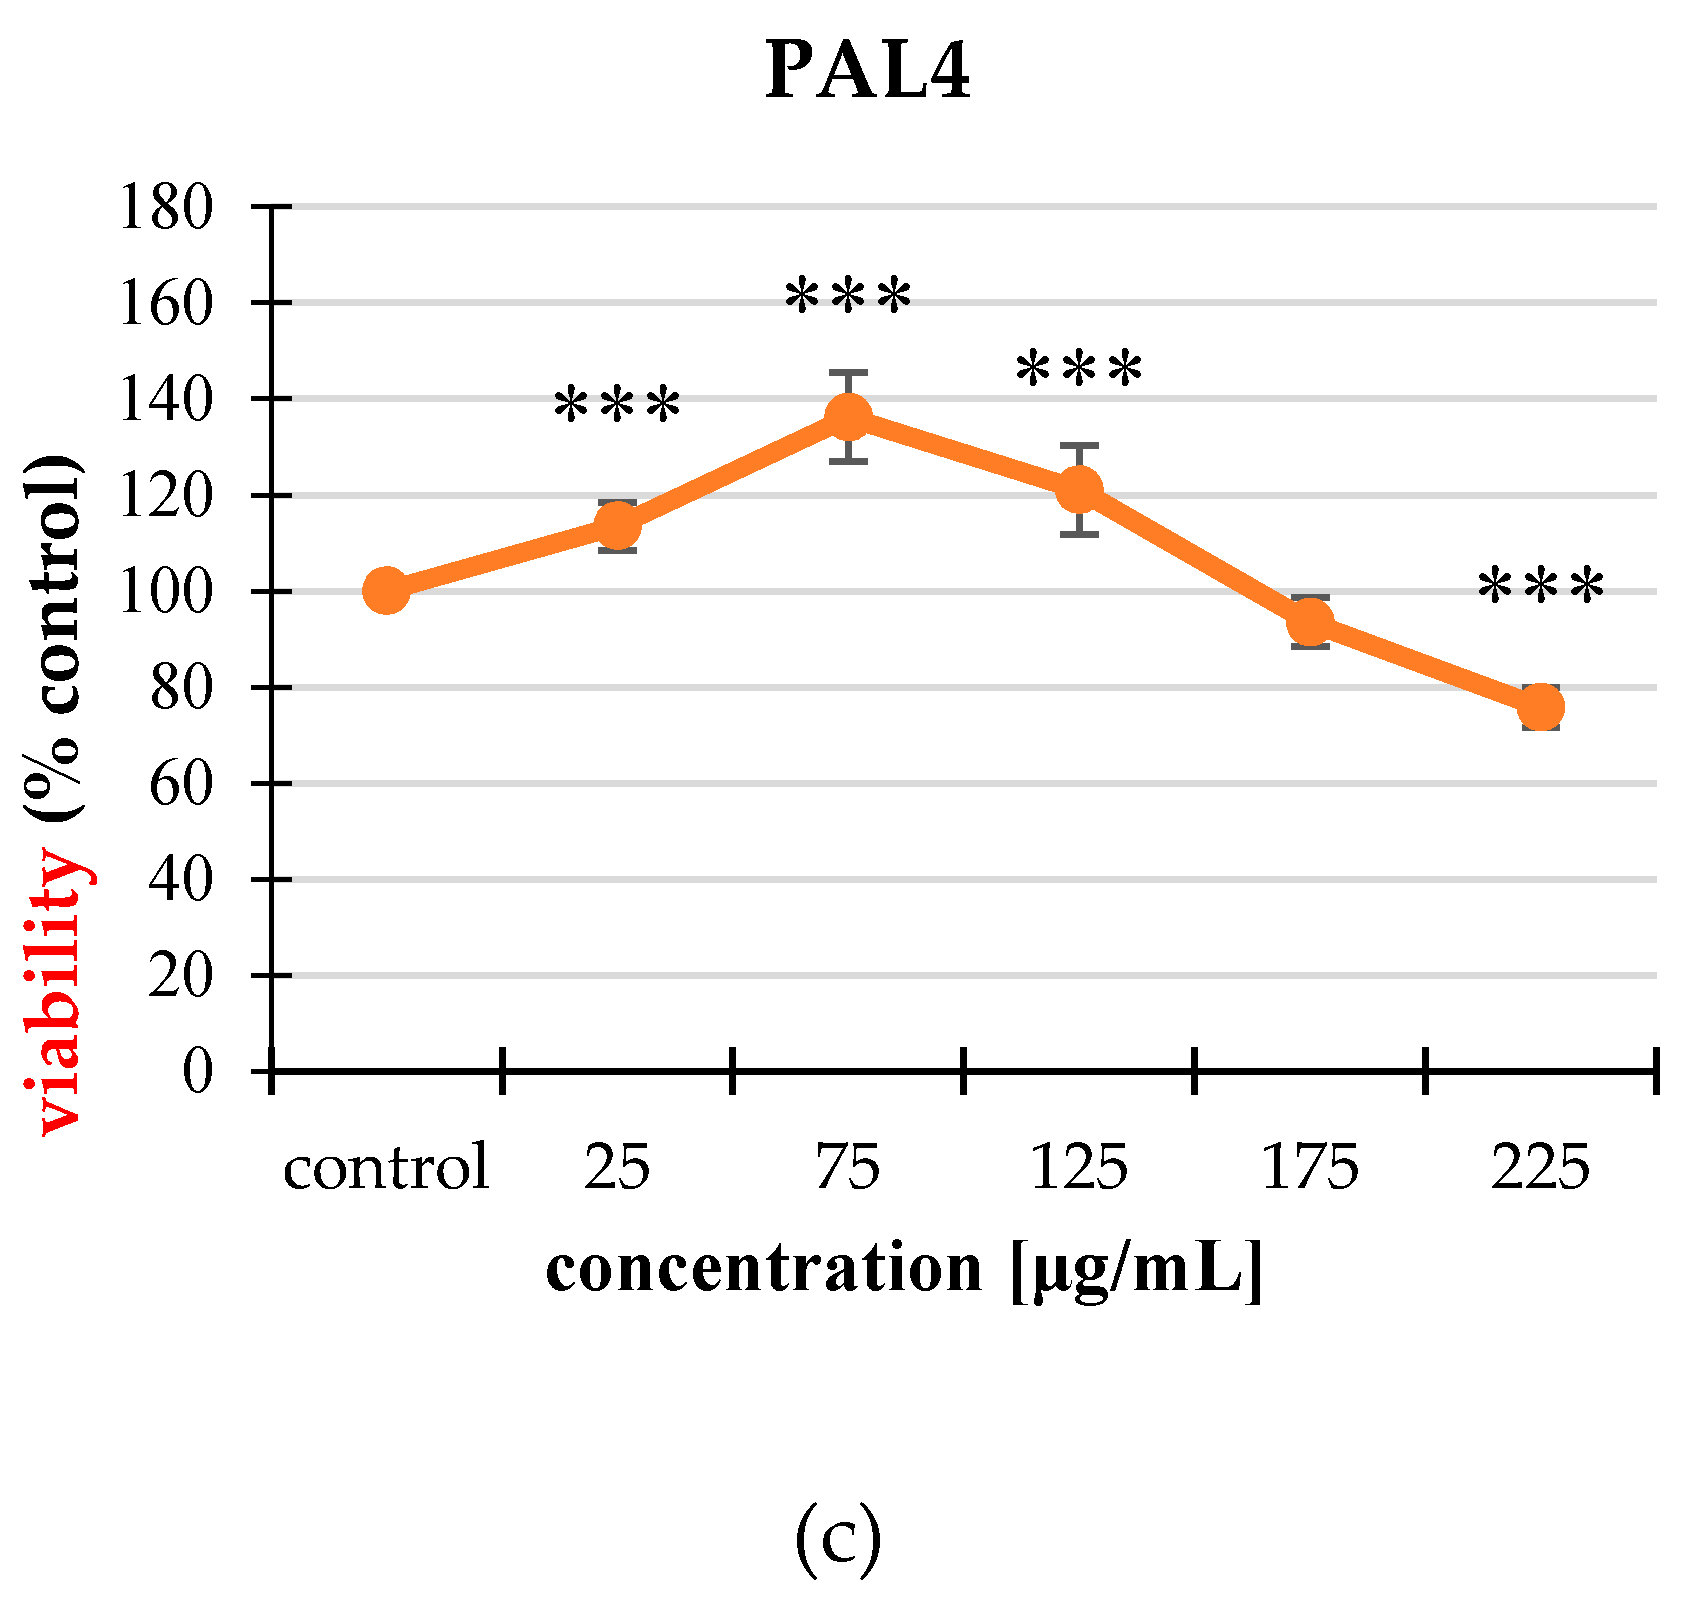
| Extract | Concentration [μg/mL] | Viability (% Control) |
|---|---|---|
| PAL3 | 25 | 95.35 ± 4.58 |
| 75 | 89.67 ± 5.25 *** | |
| 125 | 89.82 ± 6.12 *** | |
| 175 | 84.58 ± 6.69 *** | |
| 225 | 84.21 ± 4.21 *** | |
| PAL4 | 25 | 85.39 ± 3.84 *** |
| 75 | 79.26 ± 7.23 *** | |
| 125 | 77.34 ± 7.18 *** | |
| 175 | 80.89 ± 5.90 *** | |
| 225 | 88.49 ± 7.87 *** | |
| PAL7 | 25 | 96.25 ± 5.29 |
| 75 | 90.25 ± 7.31 * | |
| 125 | 87.11 ± 9.11 * | |
| 175 | 85.74 ± 5.32 *** | |
| 225 | 84.79 ± 3.60 *** |
© 2020 by the authors. Licensee MDPI, Basel, Switzerland. This article is an open access article distributed under the terms and conditions of the Creative Commons Attribution (CC BY) license (http://creativecommons.org/licenses/by/4.0/).
Share and Cite
Kowalik, K.; Paduch, R.; Strawa, J.W.; Wiater, A.; Wlizło, K.; Waśko, A.; Wertel, I.; Pawłowska, A.; Tomczykowa, M.; Tomczyk, M. Potentilla alba Extracts Affect the Viability and Proliferation of Non-Cancerous and Cancerous Colon Human Epithelial Cells. Molecules 2020, 25, 3080. https://doi.org/10.3390/molecules25133080
Kowalik K, Paduch R, Strawa JW, Wiater A, Wlizło K, Waśko A, Wertel I, Pawłowska A, Tomczykowa M, Tomczyk M. Potentilla alba Extracts Affect the Viability and Proliferation of Non-Cancerous and Cancerous Colon Human Epithelial Cells. Molecules. 2020; 25(13):3080. https://doi.org/10.3390/molecules25133080
Chicago/Turabian StyleKowalik, Klaudia, Roman Paduch, Jakub W. Strawa, Adrian Wiater, Kamila Wlizło, Adam Waśko, Iwona Wertel, Anna Pawłowska, Monika Tomczykowa, and Michał Tomczyk. 2020. "Potentilla alba Extracts Affect the Viability and Proliferation of Non-Cancerous and Cancerous Colon Human Epithelial Cells" Molecules 25, no. 13: 3080. https://doi.org/10.3390/molecules25133080