
HS-SPME-MS-Enose Coupled with Chemometrics as an Analytical Decision Maker to Predict In-Cup Coffee Sensory Quality in Routine Controls: Possibilities and Limits

 , , and
Abstract
:1. Introduction
2. Results and Discussion
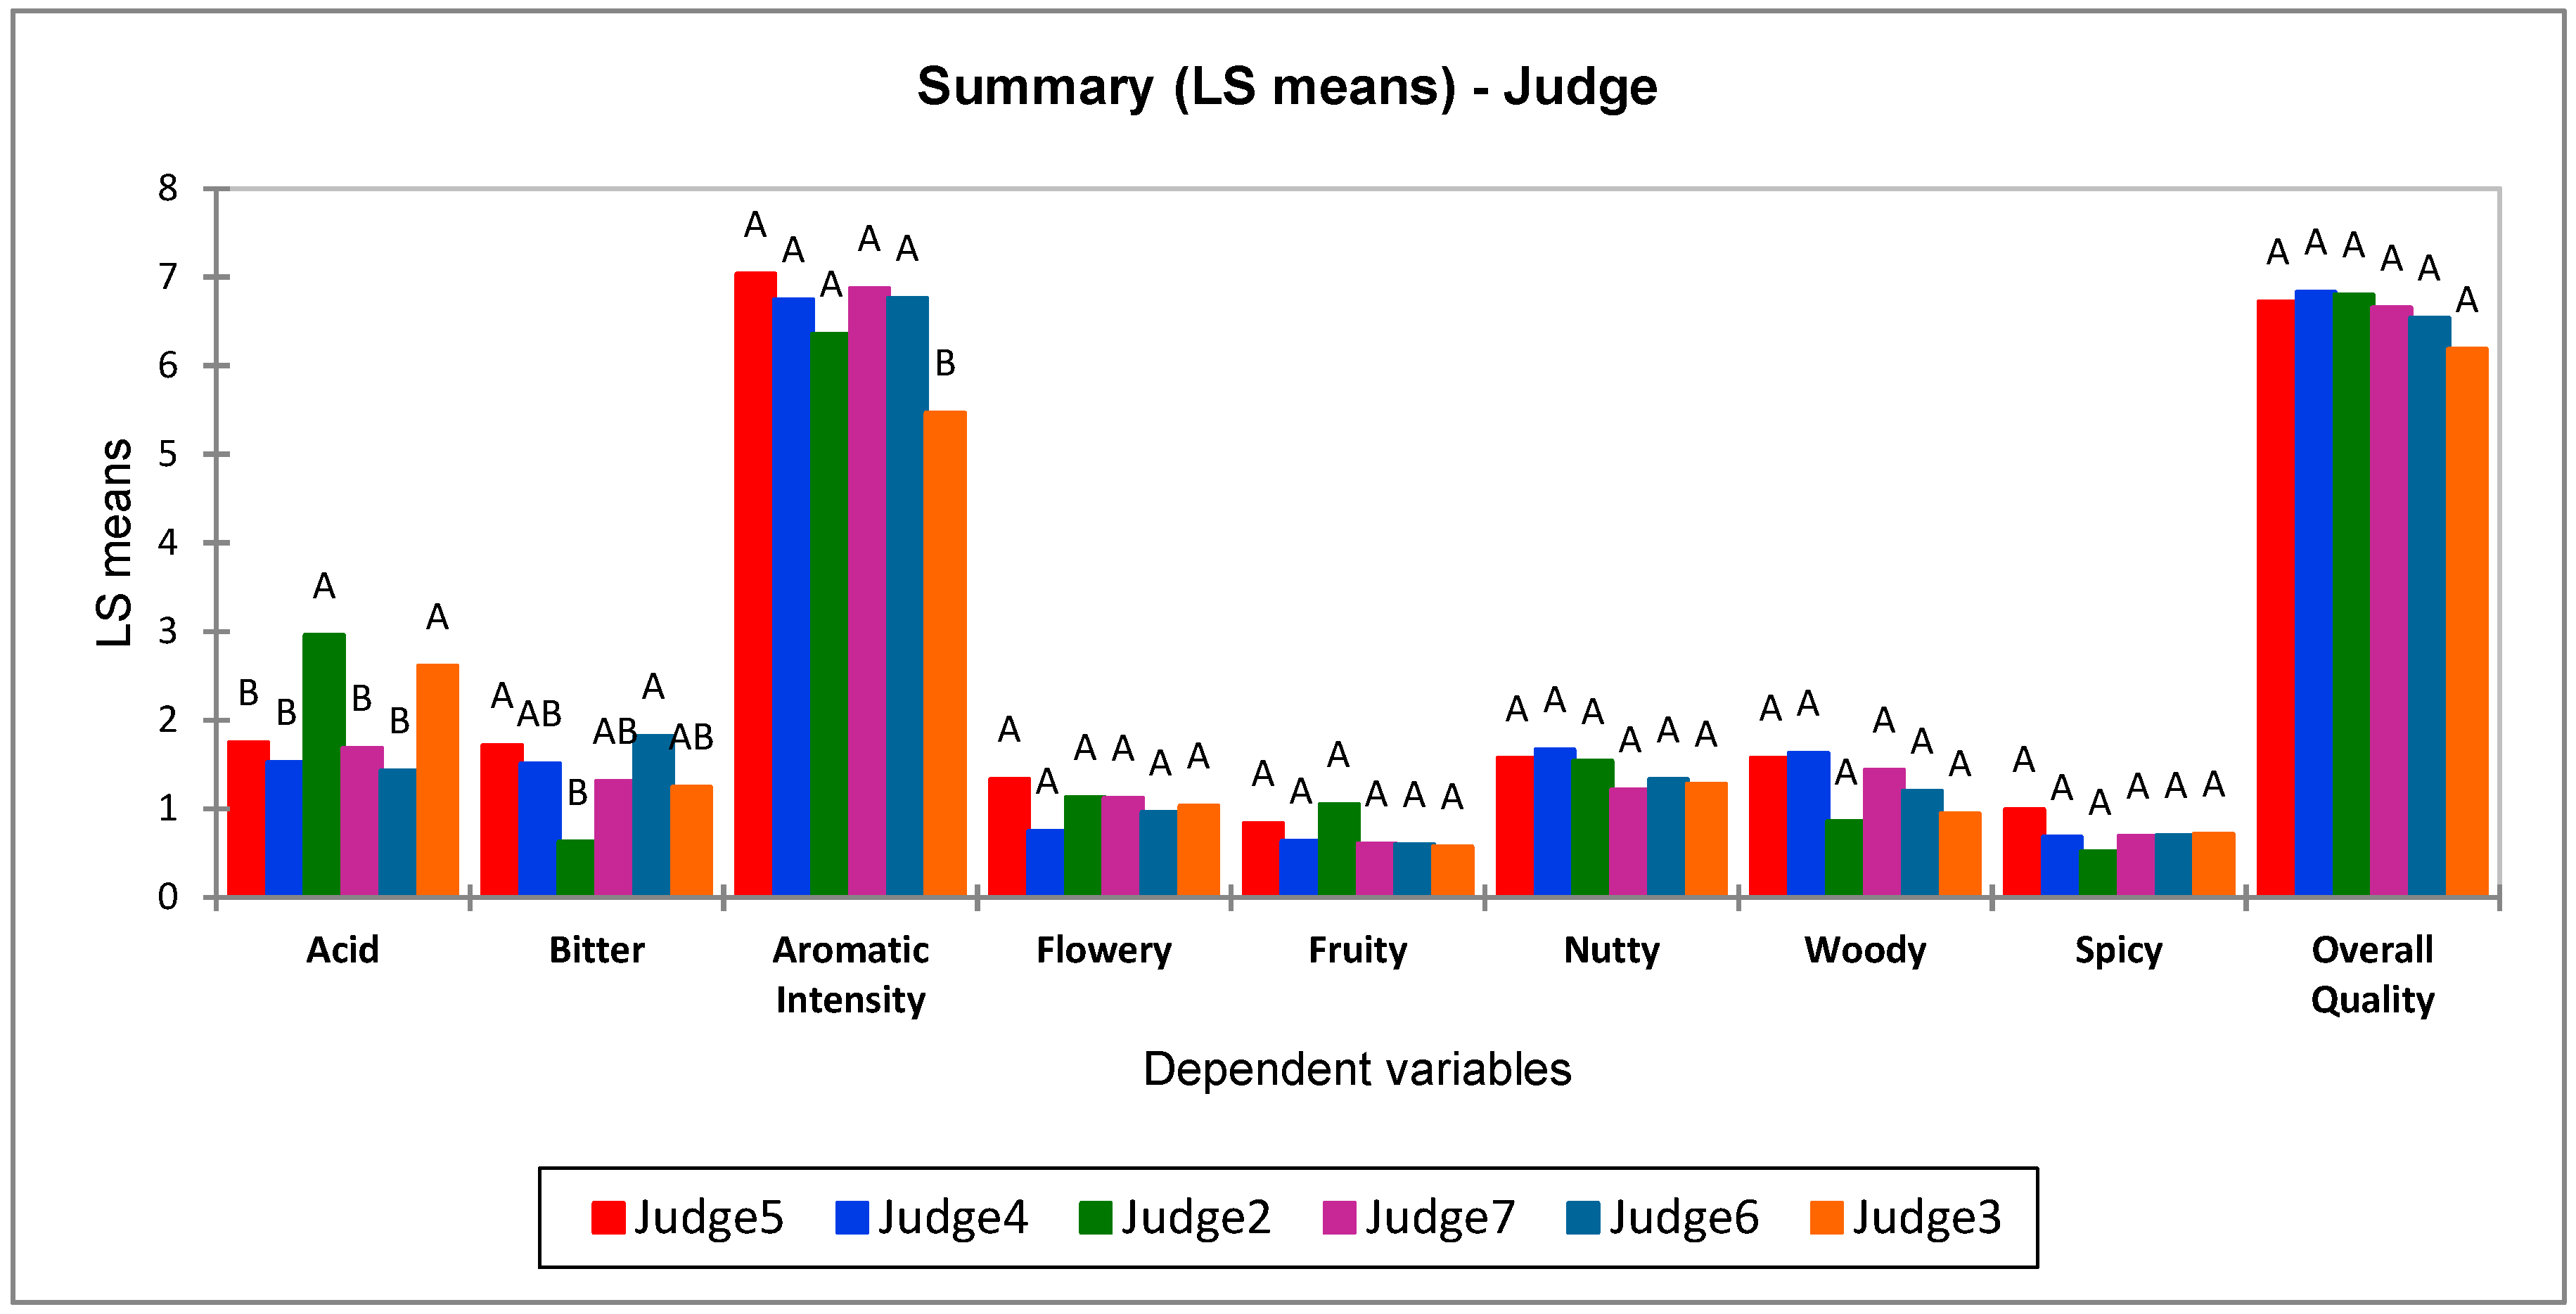
2.1. Sensory Analysis
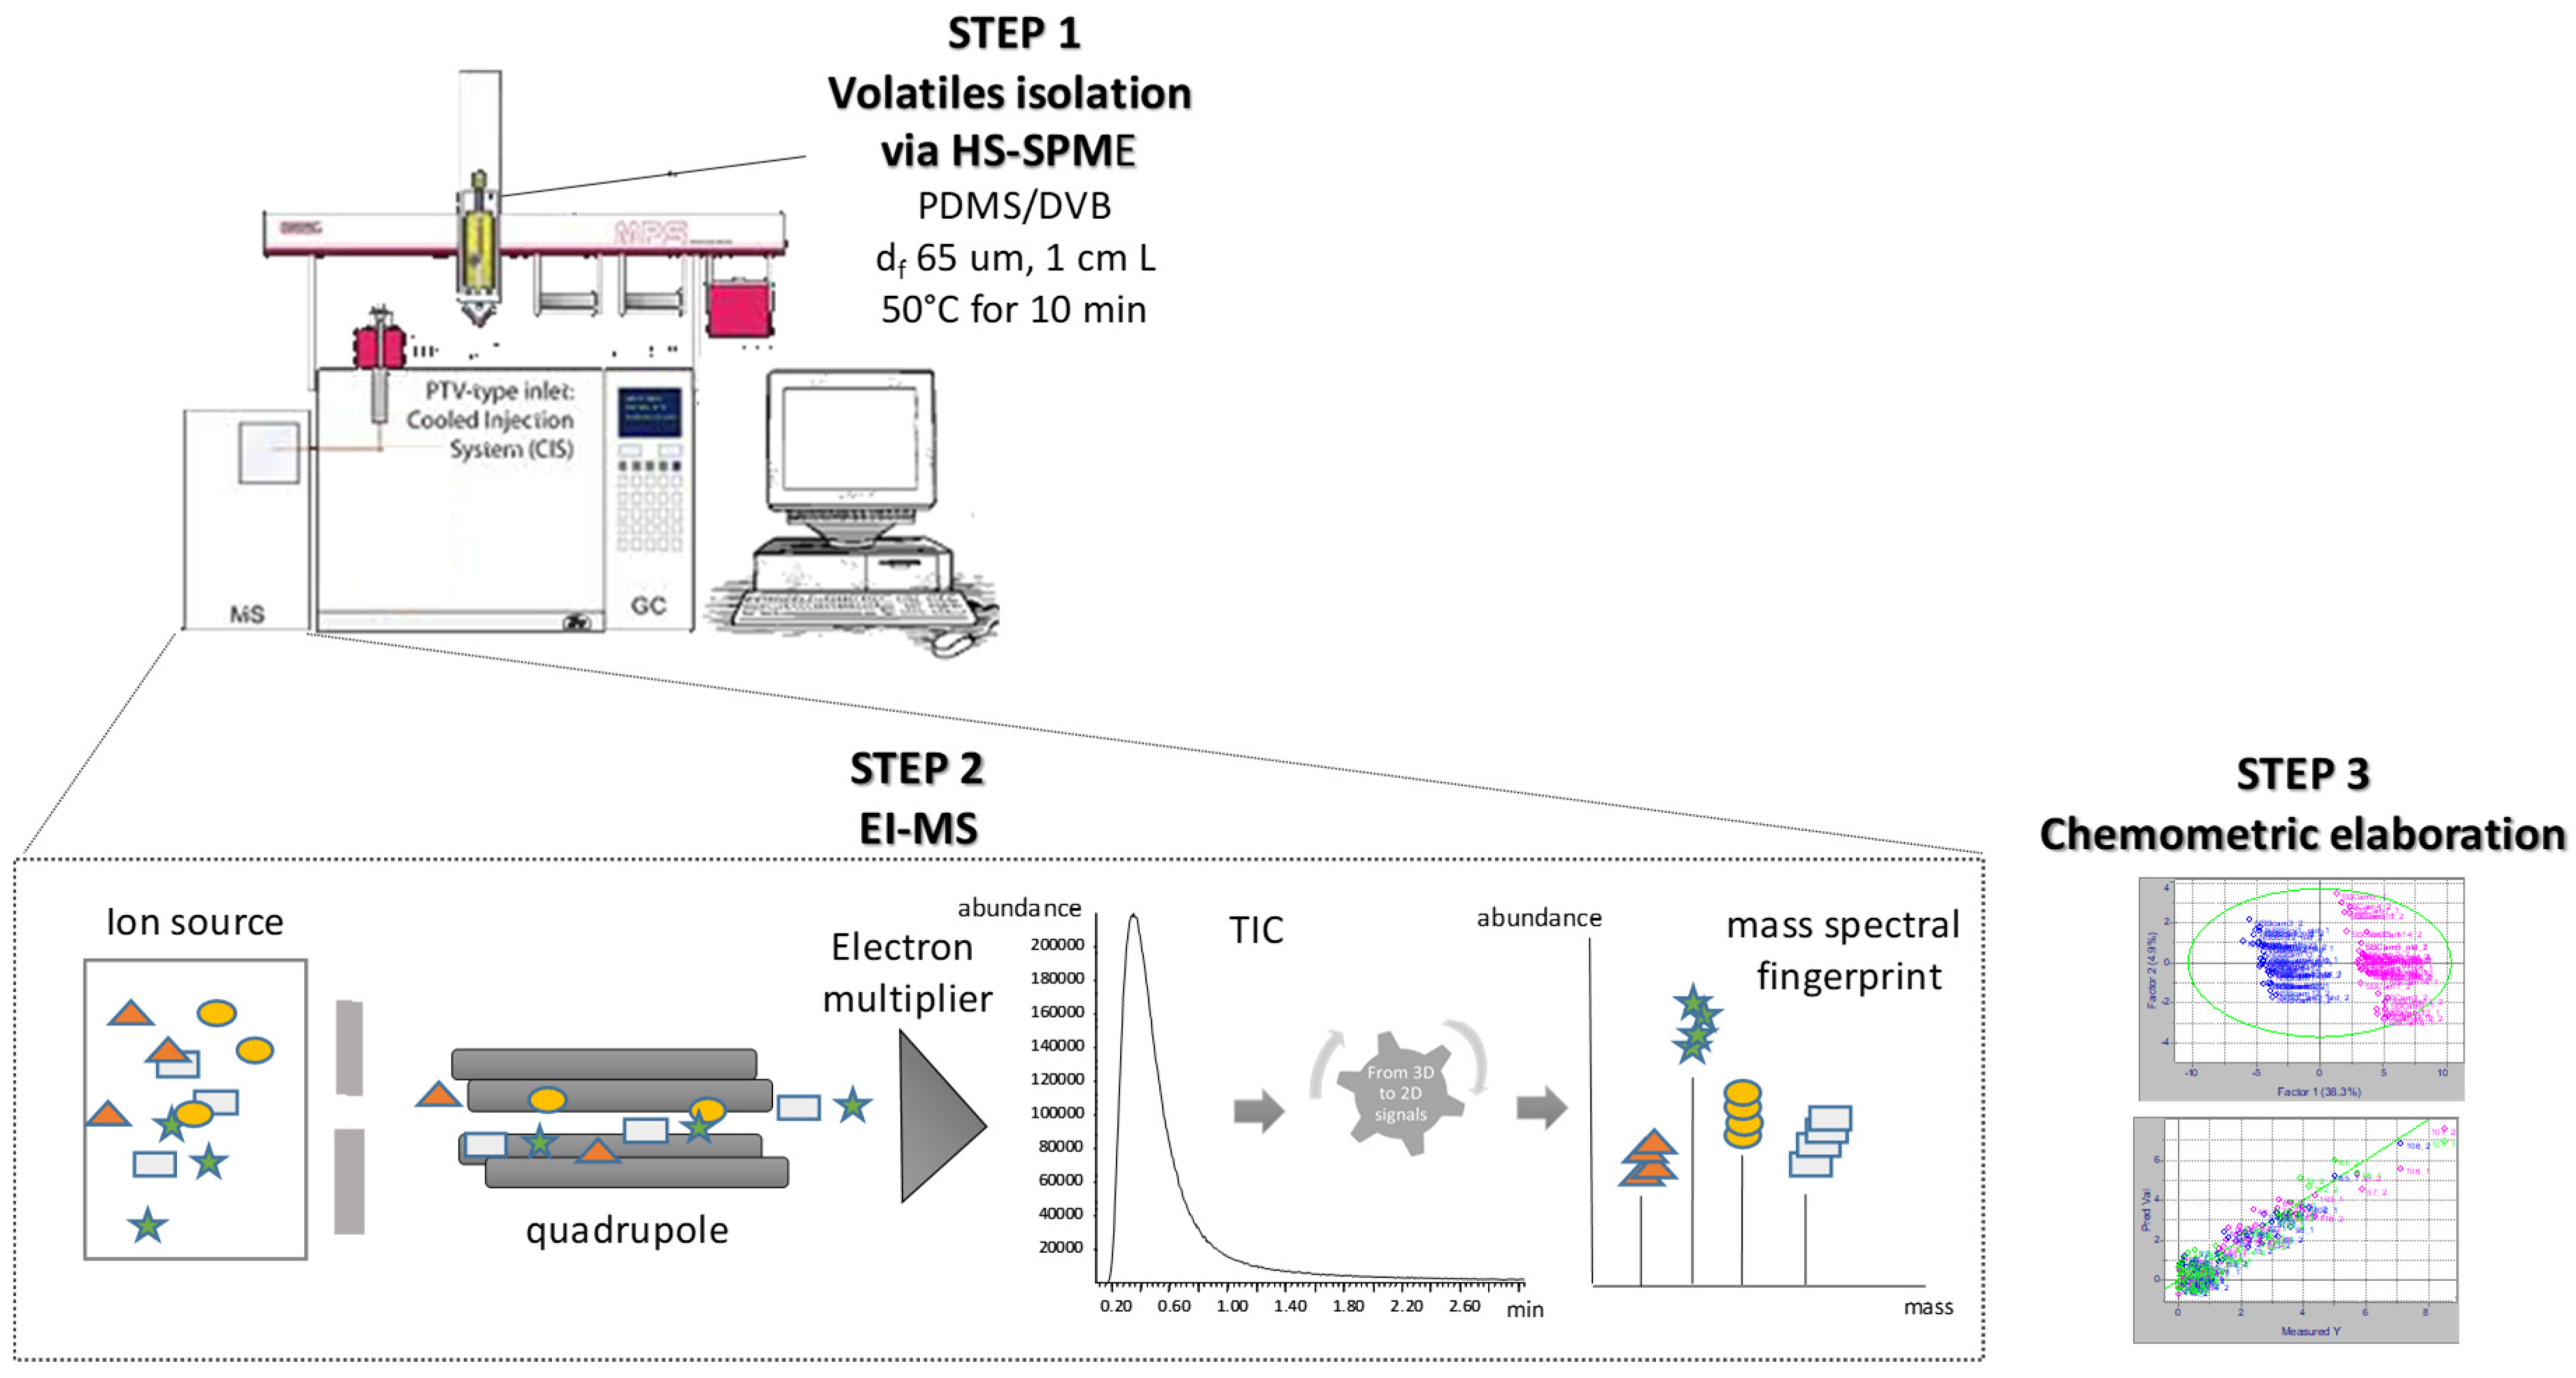
2.2. How a TAS System Based on the MS-Enose Works
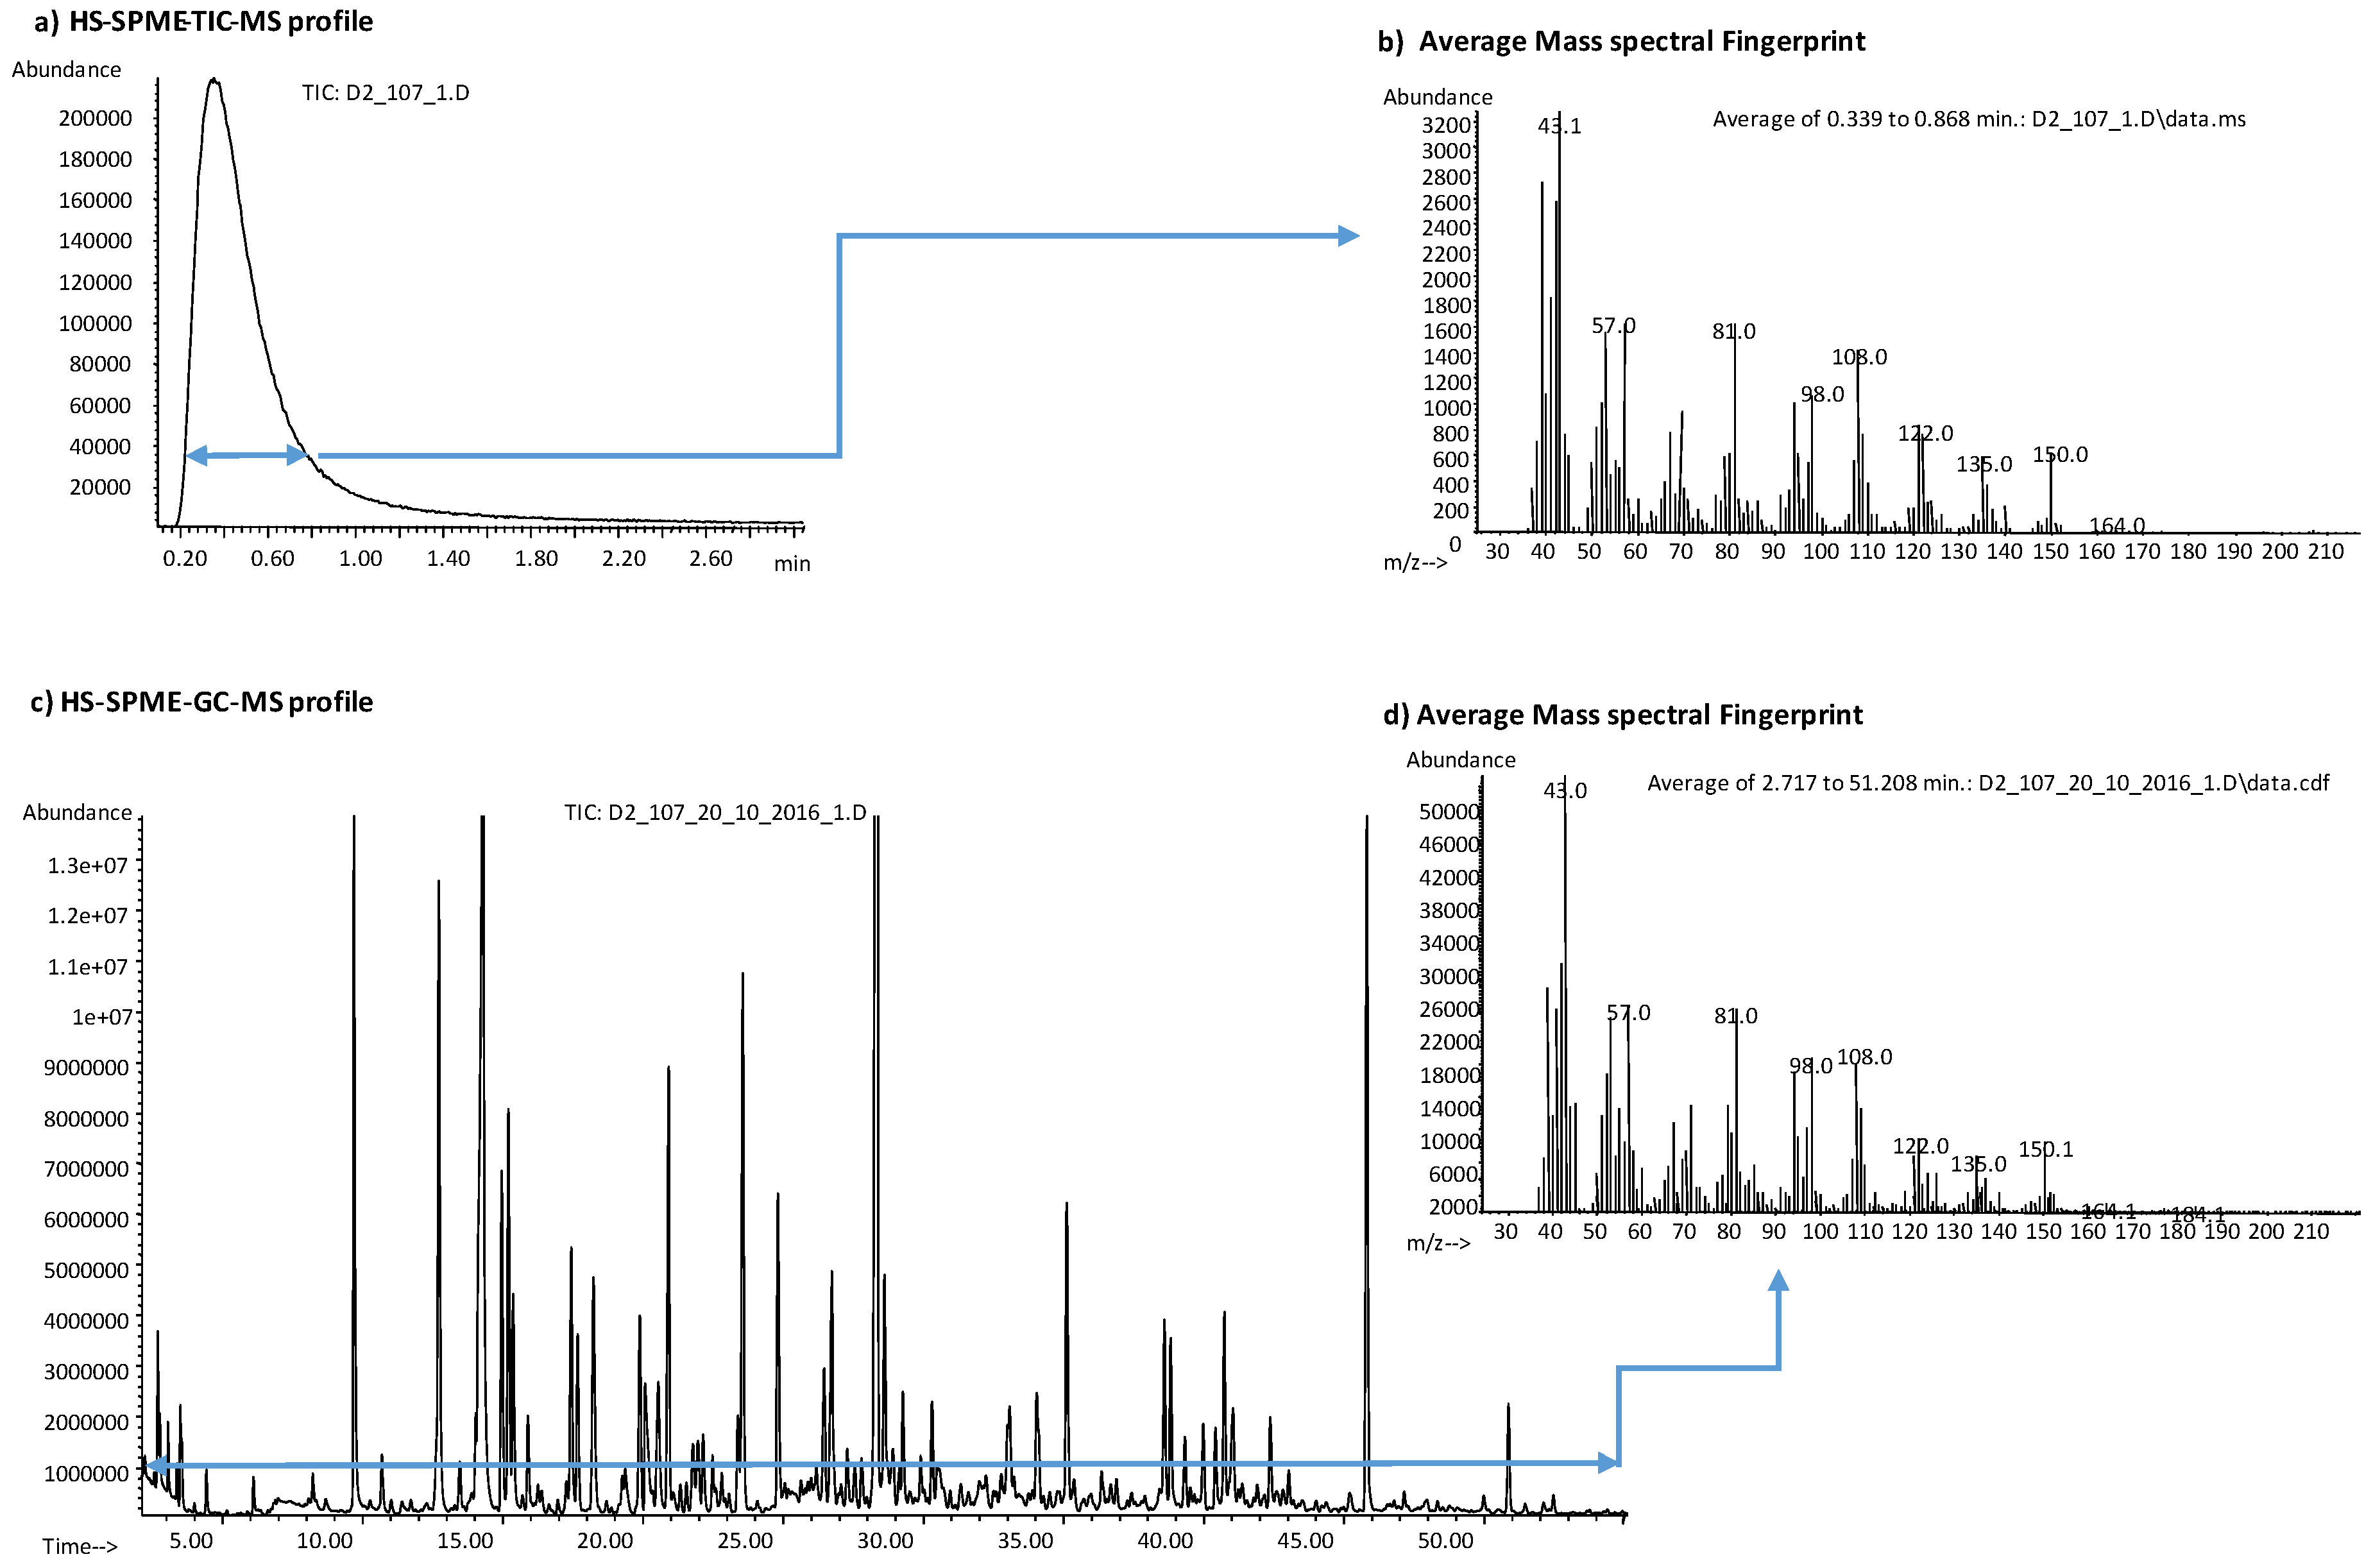
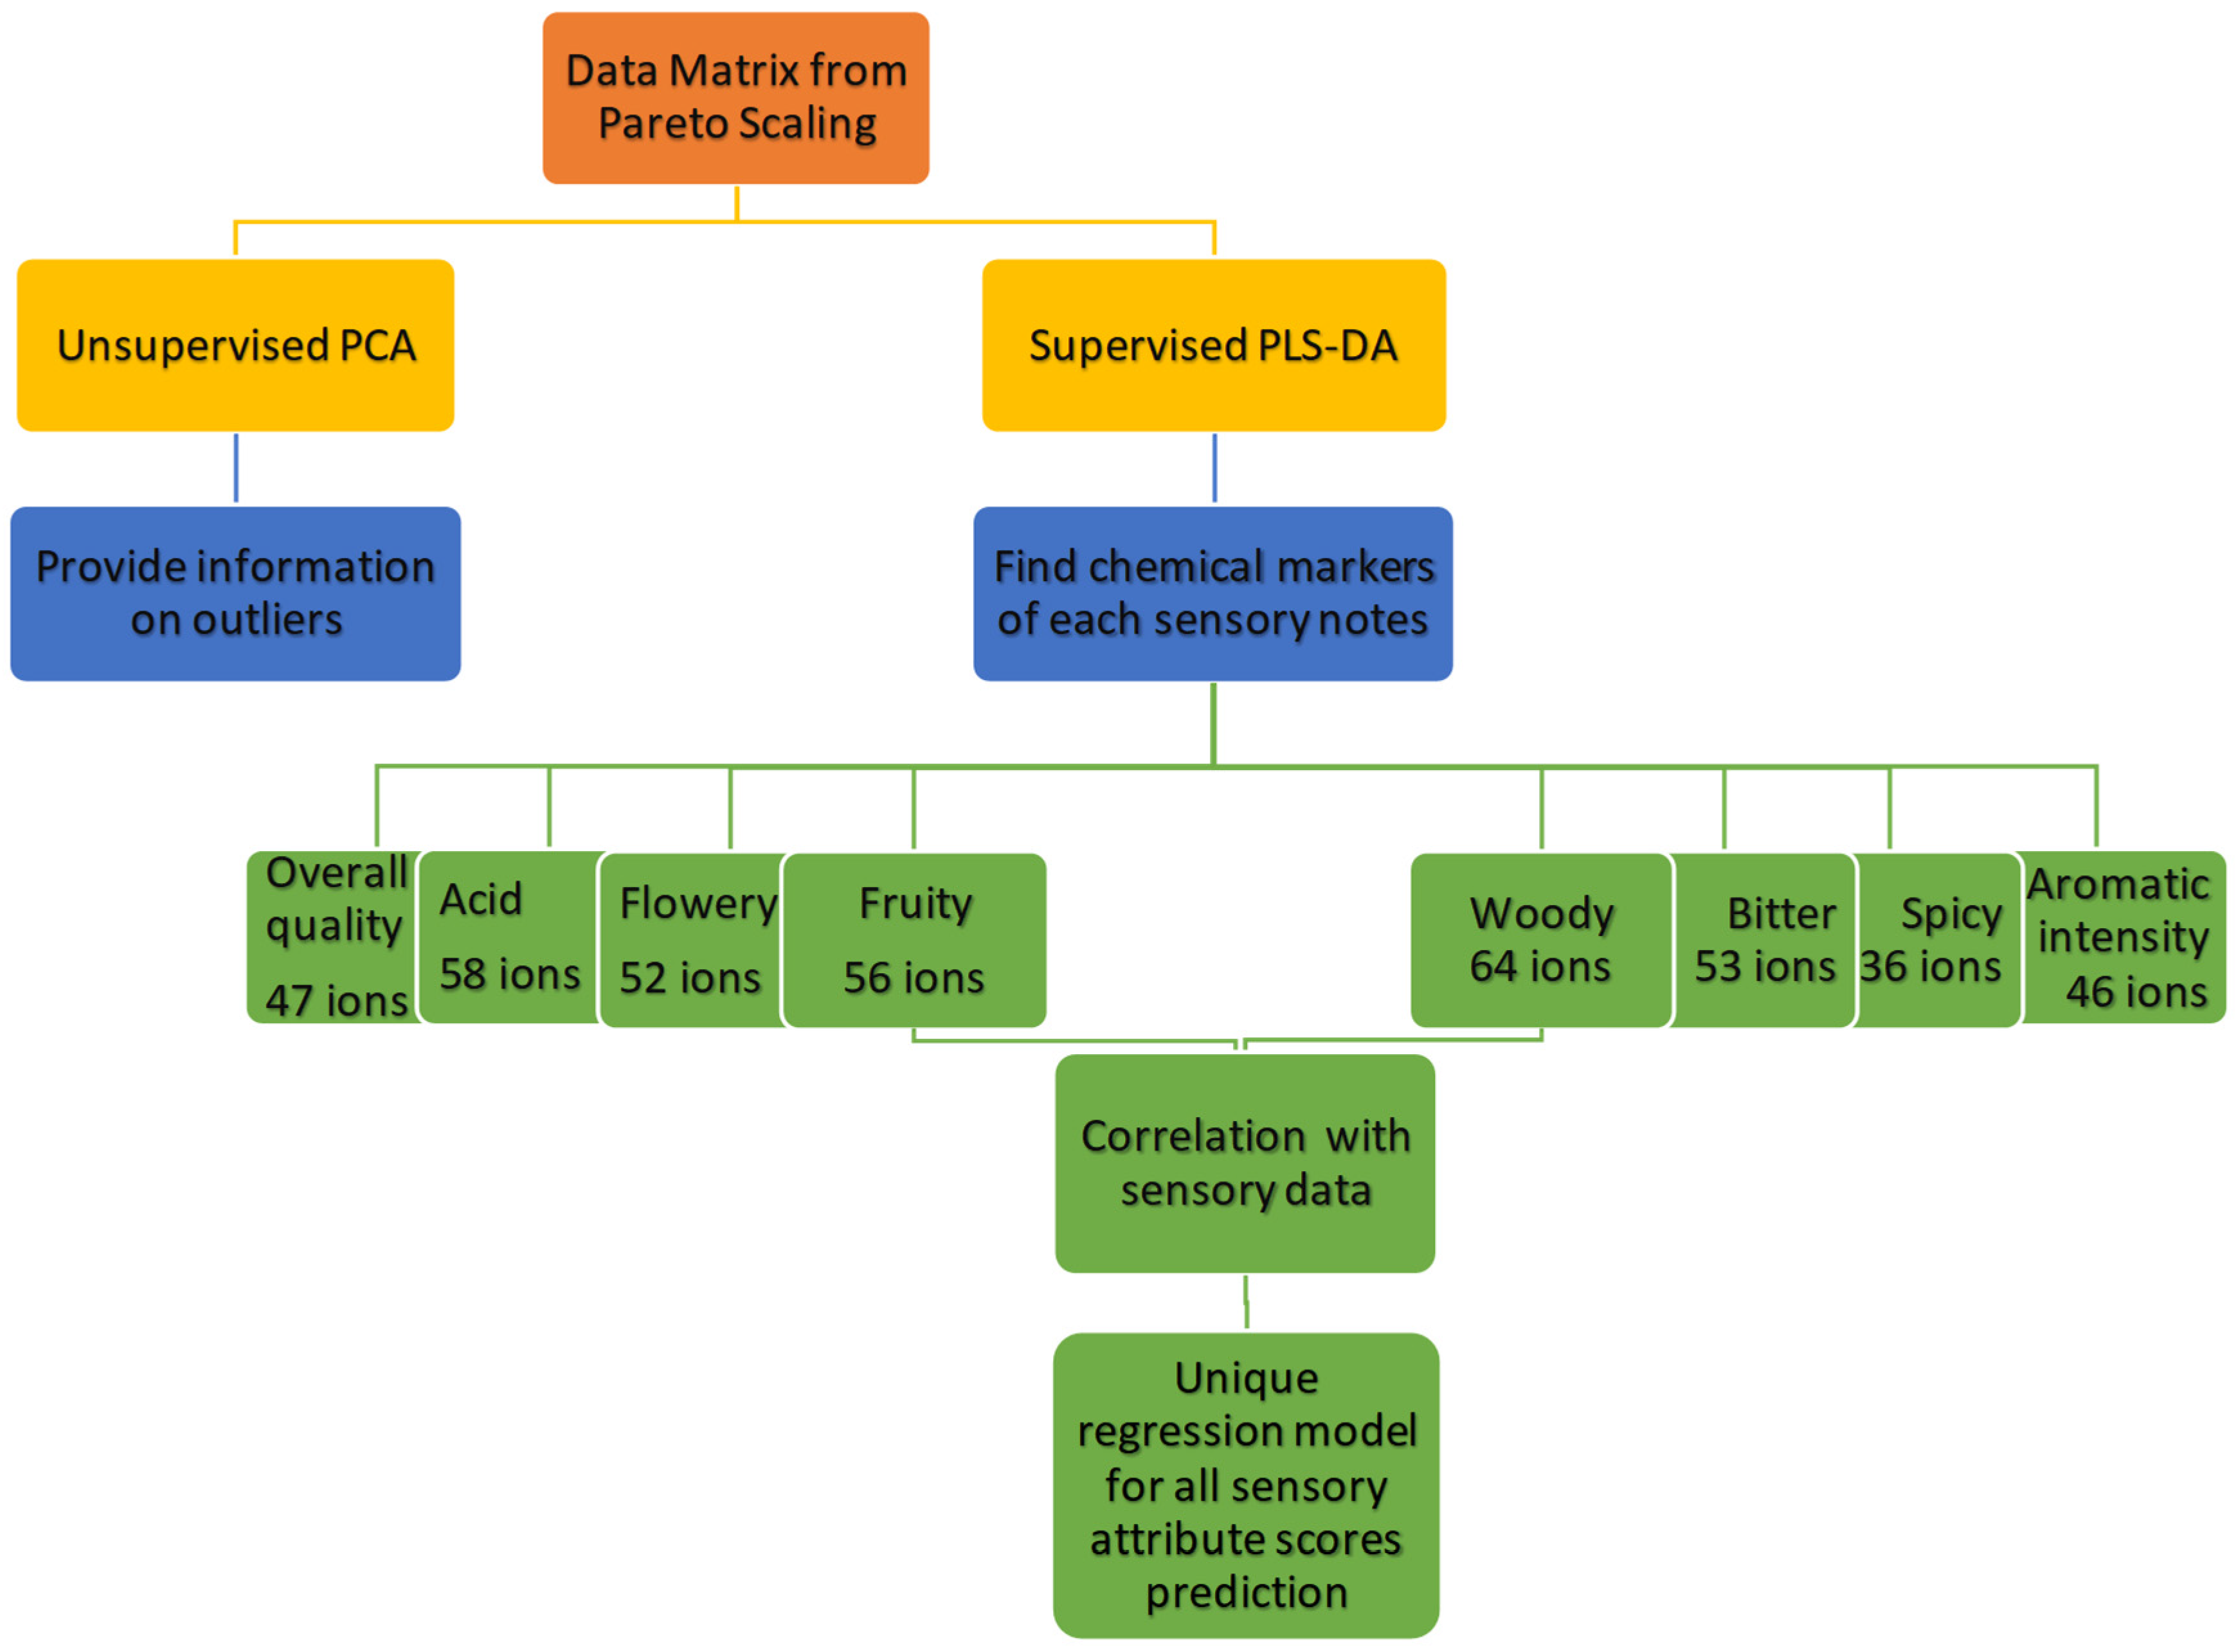
2.3. Signal Processing and Chemometric Workflow
3. Materials and Methods
3.1. Samples
3.2. Descriptive Sensory Analysis of Coffee Aroma
3.3. Head Space Solid Phase Micro Extraction Sampling
3.4. MS-eNose Instrument Set-Up
3.5. Data Acquisition and Elaboration
4. Conclusions
Supplementary Materials
Author Contributions
Funding
Conflicts of Interest
References
- Flament, I. Coffee Flavor Chemistry; Wiley: Chichester, UK, 2002. [Google Scholar]
- Folmer, B. The Craft and Science of Coffee; Academic Press: London, UK, 2017. [Google Scholar]
- Folmer, B. How Can Science Help to Create New Value in Coffee? Food Res. Int. 2014, 63, 477–482. [Google Scholar] [CrossRef]
- Lingle, T.R.; Menon, S.N. Cupping and grading—Discovering character and quality. In The Craft and Science of Coffee; Folmer, B., Ed.; Academic Press: London, UK, 2017; pp. 181–203. [Google Scholar]
- Sunarharum, W.B.; Williams, D.J.; Smyth, H.E. Complexity of Coffee Flavor: A Compositional and Sensory Perspective. Food Res. Int. 2014, 62, 315–325. [Google Scholar] [CrossRef]
- Ruosi, M.R.; Cordero, C.; Cagliero, C.; Rubiolo, P.; Bicchi, C.; Sgorbini, B.; Liberto, E. A Further Tool to Monitor the Coffee Roasting Process: Aroma Composition and Chemical Indices. J. Agric. Food Chem. 2012, 11283–11291. [Google Scholar] [CrossRef] [PubMed]
- Liberto, E.; Ruosi, M.R.; Cordero, C.; Rubiolo, P.; Bicchi, C.; Sgorbini, B. Non-Separative Headspace Solid Phase Microextraction-Mass Spectrometry Profile as a Marker to Monitor Coffee Roasting Degree. J. Agric. Food Chem. 2013, 1652–1660. [Google Scholar] [CrossRef] [PubMed]
- Bressanello, D.; Liberto, E.; Cordero, C.; Sgorbini, B.; Rubiolo, P.; Pellegrino, G.; Ruosi, M.R.; Bicchi, C. Chemometric Modelling of Coffee Sensory Notes through Their Chemical Signatures: Potential and Limits in Defining an Analytical Tool for Quality Control. J. Agric. Food Chem. 2018, 7096–7109. [Google Scholar] [CrossRef] [PubMed]
- Dirinck, I.; Van Leuven, I.; Dirinck, P. ChemSensor Classification of Red Wines; Elsevier: Amsterdam, The Netherlands, 2006; Volume 43. [Google Scholar] [CrossRef]
- Dirinck, I.; Van Leuven, I.; Dirinck, P. Hyphenated Electronic Nose Technique for Aroma Analysis of Foods and Beverages. LC GC Eur. 2009, 22, 525–531. [Google Scholar]
- Liang, Y.-Z.; Xie, P.; Chan, K. Quality Control of Herbal Medicines. J. Chromatogr. B Anal. Technol. Biomed. Life Sci. 2004, 812, 53–70. [Google Scholar] [CrossRef]
- Pérès, C.; Begnaud, F.; Eveleigh, L.; Berdagué, J.-L. Fast Characterization of Foodstuff by Headspace Mass Spectrometry (HS-MS). TrAC - Trends Anal. Chem. 2003, 22, 858–866. [Google Scholar] [CrossRef]
- Lesiak, A.D.; Musah, R.A. Rapid High-Throughput Species Identification of Botanical Material Using Direct Analysis in Real Time High Resolution Mass Spectrometry. J. Vis. Exp. 2016, 116, 1–11. [Google Scholar] [CrossRef] [Green Version]
- Goodner, K.; Rouseff, R. Practical Analysis of Flavor and Fragrance Materials; Wiley: Chirchester, UK, 2011. [Google Scholar] [CrossRef]
- Pizarro, C.; Esteban-Díez, I.; González-Sáiz, J.M. Mixture Resolution According to the Percentage of Robusta Variety in Order to Detect Adulteration in Roasted Coffee by near Infrared Spectroscopy. Anal. Chim. Acta 2007, 585, 266–276. [Google Scholar] [CrossRef]
- Ribeiro, J.S.; Ferreira, M.M.C.; Salva, T.J.G. Chemometric Models for the Quantitative Descriptive Sensory Analysis of Arabica Coffee Beverages Using near Infrared Spectroscopy. Talanta 2011, 83, 1352–1358. [Google Scholar] [CrossRef] [PubMed] [Green Version]
- Barbin, D.F.; Felicio, A.L.d.S.M.; Sun, D.W.; Nixdorf, S.L.; Hirooka, E.Y. Application of Infrared Spectral Techniques on Quality and Compositional Attributes of Coffee: An Overview. Food Res. Int. 2014, 61, 23–32. [Google Scholar] [CrossRef] [Green Version]
- Sánchez-López, J.A.; Zimmermann, R.; Yeretzian, C. Insight into the Time-Resolved Extraction of Aroma Compounds during Espresso Coffee Preparation: Online Monitoring by PTR-ToF-MS. Anal. Chem. 2014, 86, 11696–11704. [Google Scholar] [CrossRef] [PubMed]
- Wieland, F.; Gloess, A.N.; Keller, M.; Wetzel, A.; Schenker, S.; Yeretzian, C. Online Monitoring of Coffee Roasting by Proton Transfer Reaction Time-of-Flight Mass Spectrometry (PTR-ToF-MS): Towards a Real-Time Process Control for a Consistent Roast Profile. Anal. Bioanal. Chem. 2012, 402, 2531–2543. [Google Scholar] [CrossRef] [Green Version]
- Romano, A.; Gaysinsky, S.; Czepa, A.; Del Pulgar, J.S.; Cappellin, L.; Biasioli, F. Static and Dynamic Headspace Analysis of Instant Coffee Blends by Proton-Transfer-Reaction Mass Spectrometry. J. Mass Spectrom. 2015, 50, 1057–1062. [Google Scholar] [CrossRef]
- Charles, M.; Romano, A.; Yener, S.; Barnabà, M.; Navarini, L.; Märk, T.D.; Biasoli, F.; Gasperi, F. Understanding Flavour Perception of Espresso Coffee by the Combination of a Dynamic Sensory Method and In-Vivo Nosespace Analysis. Food Res. Int. 2015, 69, 9–20. [Google Scholar] [CrossRef]
- Zimmermann, R.; Heger, H.J.; Yeretzian, C.; Nagel, H.; Boesl, U. Application of Laser Ionization Mass Spectrometry for On-Line Monitoring of Volatiles in the Headspace of Food Products: Roasting and Brewing of Coffee. Rapid Commun. Mass Spectrom. 1996, 10, 1975–1979. [Google Scholar] [CrossRef]
- Lindinger, C.; Labbe, D.; Pollien, P.; Rytz, A.; Juillerat, M.A.; Yeretzian, C.; Blank, I. When Machine Tastes Coffee: Instrumental Approach To Predict the Sensory Profile of Espresso Coffee. Anal. Chem. 2008, 80, 1574–1581. [Google Scholar] [CrossRef]
- Wang, G.; He, X.; Zhou, F.; Li, Z.; Fang, B.; Zhang, X.; Wang, L. Application of Gold Nanoparticles/TiO2 modified Electrode for the Electrooxidative Determination of Catechol in Tea Samples. Food Chem. 2012, 135, 446–451. [Google Scholar] [CrossRef]
- Loutfi, A.; Coradeschi, S.; Mani, G.K.; Shankar, P.; Rayappan, J.B.B. Electronic Noses for Food Quality: A Review. J. Food Eng. 2015, 144, 103–111. [Google Scholar] [CrossRef]
- Roberts, J.; Power, A.; Chapman, J.; Chandra, S.; Cozzolino, D. A Short Update on the Advantages, Applications and Limitations of Hyperspectral and Chemical Imaging in Food Authentication. Appl. Sci. 2018, 8, 505. [Google Scholar] [CrossRef] [Green Version]
- Grassi, S.; Alamprese, C. Advances in NIR Spectroscopy Applied to Process Analytical Technology in Food Industries. Curr. Opin. Food Sci. 2018, 22, 17–21. [Google Scholar] [CrossRef]
- Marsili, R.T. SPME−MS−MVA as an Electronic Nose for the Study of Off-Flavors in Milk. J. Agric. Food Chem. 1999, 47, 648–665. [Google Scholar] [CrossRef] [PubMed]
- Cozzolino, D.; Smyth, H.E.; Cynkar, W.; Janik, L.; Dambergs, R.G.; Gishen, M. Use of Direct Headspace-Mass Spectrometry Coupled with Chemometrics to Predict Aroma Properties in Australian Riesling Wine. Anal. Chim. Acta 2008, 621, 2–7. [Google Scholar] [CrossRef] [PubMed]
- Majchrzak, T.; Wojnowski, W.; Dymerski, T.; Gębicki, J.; Namieśnik, J. Electronic Noses in Classification and Quality Control of Edible Oils: A Review. Food Chem. 2018, 246, 192–201. [Google Scholar] [CrossRef] [PubMed]
- Majcher, M.A.; Kaczmarek, A.; Klensporf-Pawlik, D.; Pikul, J.; Jeleń, H.H. SPME-MS-Based Electronic Nose as a Tool for Determination of Authenticity of PDO Cheese, Oscypek. Food Anal. Methods 2015, 8, 2211–2217. [Google Scholar] [CrossRef] [Green Version]
- Gliszczyńska-Świgło, A.; Chmielewski, J. Electronic Nose as a Tool for Monitoring the Authenticity of Food. A Review. Food Anal. Methods 2017, 10, 1800–1816. [Google Scholar] [CrossRef] [Green Version]
- Sgorbini, B.; Bicchi, C.; Cagliero, C.; Cordero, C.; Liberto, E.; Rubiolo, P. Herbs and Spices: Characterization and Quantitation of Biologically-Active Markers for Routine Quality Control by Multiple Headspace Solid-Phase Microextraction Combined with Separative or Non-Separative Analysis. J. Chromatogr. A 2015, 1376, 9–17. [Google Scholar] [CrossRef]
- Sandra, P.; David, F.; Tienpont, B. From CGC-MS to MS-Based Analytical Decision Makers. Chromatographia 2004, 60. [Google Scholar] [CrossRef]
- SCAA. SCAA Protocols Cupping Specialty Coffee. Available online: https://www.scaa.org/PDF/resources/cupping-protocols.pdf (accessed on 26 July 2017).
- Dittrich, P.S.; Tachikawa, K.; Manz, A. Micro Total Analysis Systems. Latest Advancements and Trends. Anal. Chem. 2006, 78, 3887–3908. [Google Scholar] [CrossRef]
- Heiden, A.C.; Gil, C.; Ramos, L.S. Comparison of Different Approaches to Rapid Screening of Headspace Samples: Pros and Cons of Using MS-Based Electronic Noses versus Fast Chromatography. Available online: https://www.gerstel.com/pdf/p-cs-an-2002-08.pdf (accessed on 26 April 2018).
- Kinton, V.; Pfannkoch, E.; Whitecavage, J. Discrimination of Soft Drinks Using a Chemical Sensor and Principal Component Analysis. Available online: https://www.scaa.org/PDF/resources/cupping-protocols.pdf (accessed on 26 April 2018).
- Pérez Pavón, J.L.; del Nogal Sánchez, M.; Pinto, C.G.; Fernández Laespada, M.E.; Cordero, B.M.; Peña, A.G. Strategies for Qualitative and Quantitative Analyses with Mass Spectrometry-Based Electronic Noses. TrAC Trends Anal. Chem. 2006, 25, 257–266. [Google Scholar] [CrossRef]
- Hou, W.; Tian, Y.; Liao, T.; Huang, Y.; Tang, Z.; Wu, Y.; Duan, Y. Development of the Mass Spectral Fingerprint by Headspace-Solid-Phase Microextraction-Mass Spectrometry and Chemometric Methods for Rapid Quality Control of Flavoring Essence. Microchem. J. 2016, 128, 75–83. [Google Scholar] [CrossRef]
- Ribeiro, J.S.; Augusto, F.; Salva, T.J.G.; Ferreira, M.M.C. Prediction Models for Arabica Coffee Beverage Quality Based on Aroma Analyses and Chemometrics. Talanta 2012, 101, 253–260. [Google Scholar] [CrossRef] [PubMed] [Green Version]
- Bressanello, D.; Liberto, E.; Cordero, C.; Rubiolo, P.; Pellegrino, G.; Ruosi, M.R.; Bicchi, C. Coffee Aroma: Chemometric Comparison of the Chemical Information Provided by Three Different Samplings Combined with GC–MS to Describe the Sensory Properties in Cup. Food Chem. 2017, 218–226. [Google Scholar] [CrossRef] [PubMed]
- Esposito, A.; Bassis, S.; Morabito, F.C.; Pasero, E. Some Notes on Computational and Theoretical Issues in Artificial Intelligence and Machine Learning. In Smart Innovation, Systems and Technologies; Springer Science and Business Media Deutschland GmbH: Canberra, Australia, 2016; Volume 54, pp. 3–12. [Google Scholar] [CrossRef]
Sample Availability: Samples of the several key odor compounds of coffee are available from the authors. |


| Attributes | Mean | S.D. | Minimum | Maximum | CV |
|---|---|---|---|---|---|
| Acid | 1.79 | 1.68 | 0.10 | 7.80 | 0.93 |
| Bitter | 1.50 | 1.70 | 0.20 | 9.00 | 1.14 |
| Aromatic Intensity | 6.71 | 1.29 | 1.00 | 10.00 | 0.19 |
| Flowery | 1.08 | 1.76 | 0.00 | 9.00 | 1.62 |
| Fruity | 0.69 | 1.49 | 0.00 | 10.00 | 2.16 |
| Nutty | 1.41 | 2.06 | 0.00 | 9.00 | 1.46 |
| Woody | 1.36 | 2.02 | 0.00 | 8.00 | 1.49 |
| Spicy | 0.76 | 1.57 | 0.00 | 8.00 | 2.07 |
| Overall Quality | 6.63 | 1.46 | 0.60 | 10.00 | 0.22 |
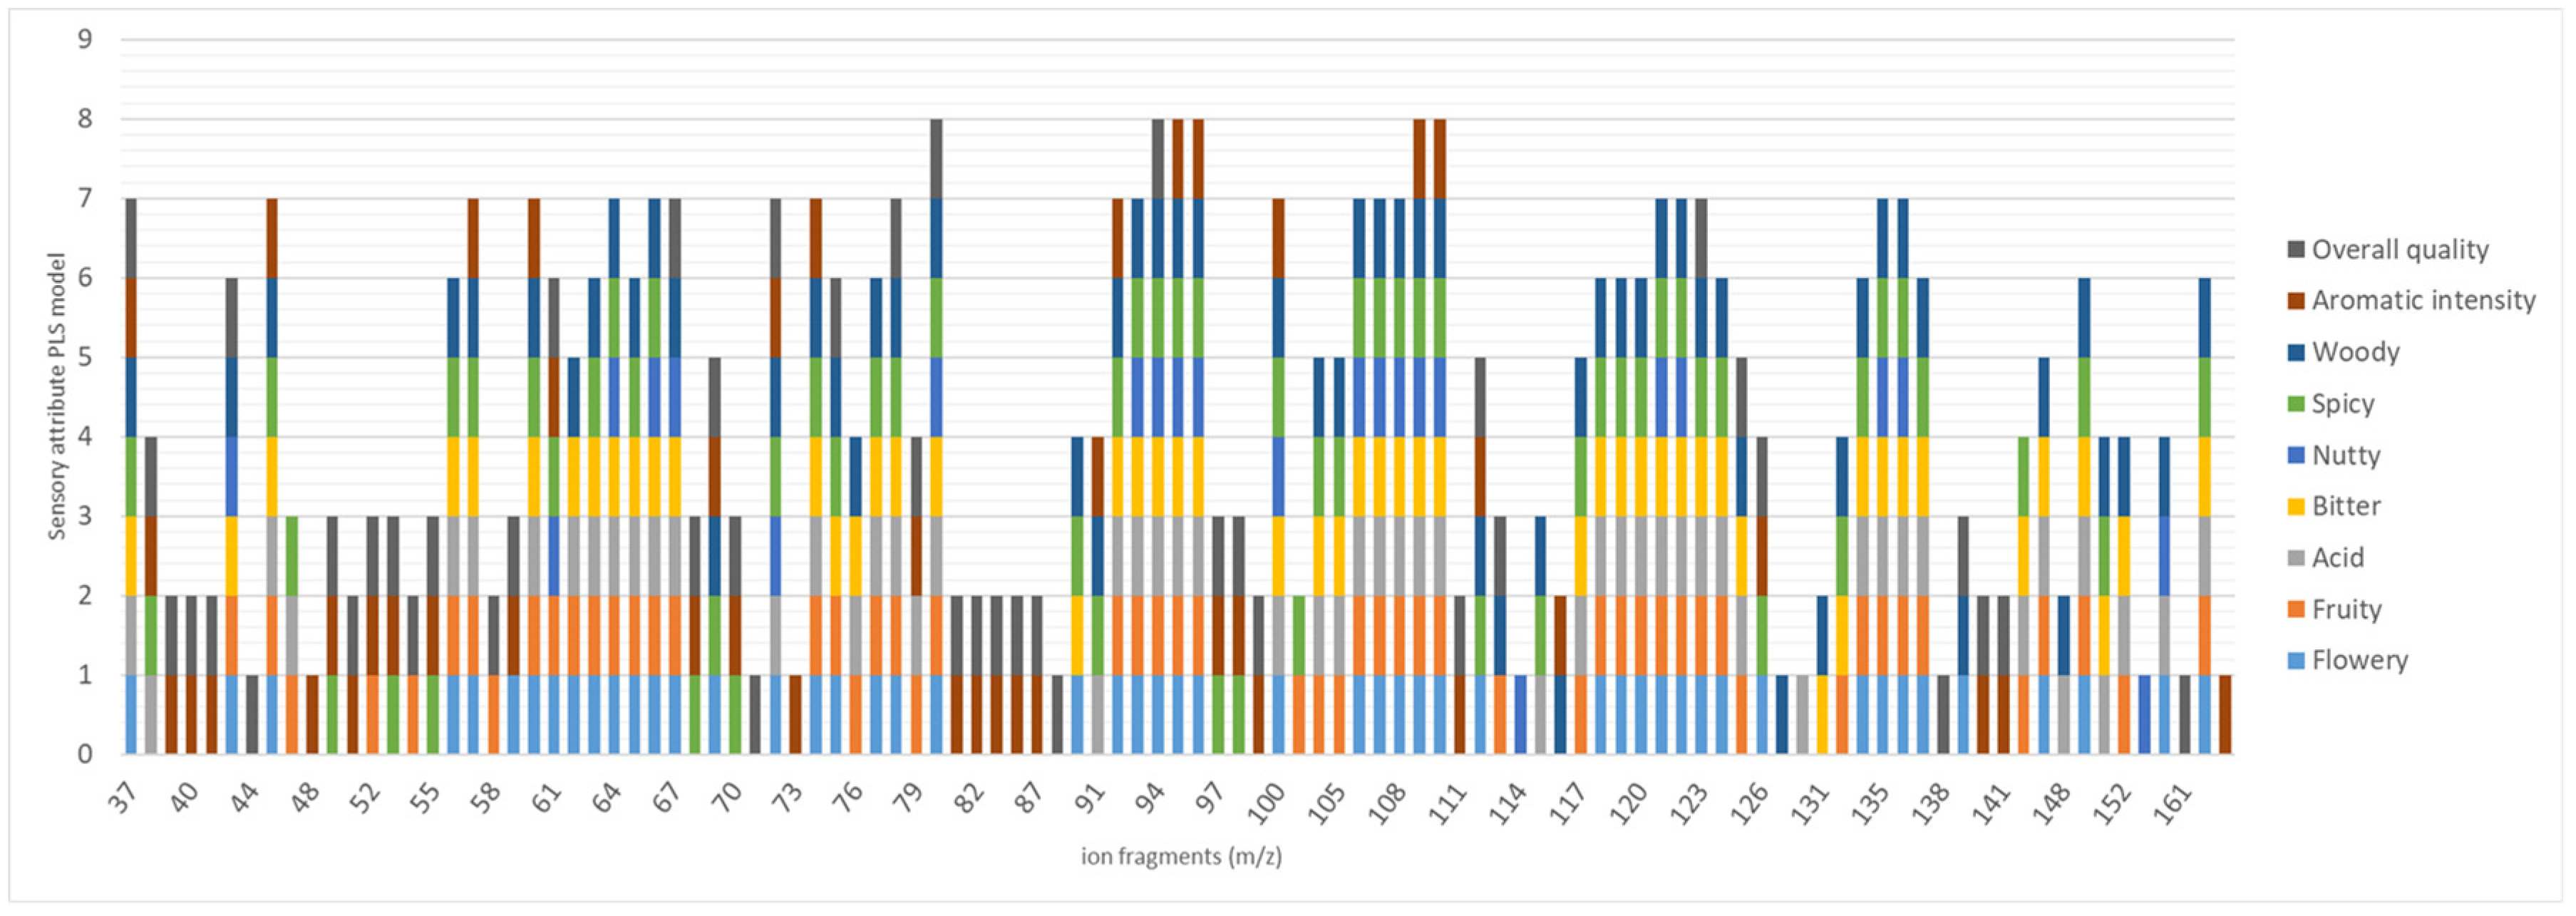
| Flowery | Fruity | Acid | Bitter | Nutty | Spicy | Woody | Aromatic Intensity | Overall Quality | ||||||||||||||||||
|---|---|---|---|---|---|---|---|---|---|---|---|---|---|---|---|---|---|---|---|---|---|---|---|---|---|---|
| m/z | VIP | SD | m/z | VIP | SD | m/z | VIP | SD | m/z | VIP | SD | m/z | VIP | SD | m/z | VIP | SD | m/z | VIP | SD | m/z | VIP | SD | m/z | VIP | SD |
| 37 | 2.012 | 0.201 | 42 | 2.060 | 0.197 | 36 | 1.822 | 0.208 | 37 | 1.751 | 0.171 | 42 | 2.668 | 0.795 | 96 | 1.839 | 0.175 | 110 | 1.626 | 0.085 | 100 | 1.819 | 0.262 | 79 | 2.060 | 0.316 |
| 42 | 1.967 | 0.184 | 45 | 1.999 | 0.176 | 37 | 1.814 | 0.201 | 42 | 1.722 | 0.170 | 61 | 2.266 | 0.557 | 36 | 1.830 | 0.182 | 36 | 1.612 | 0.114 | 36 | 1.717 | 0.096 | 37 | 2.054 | 0.265 |
| 45 | 1.960 | 0.213 | 46 | 1.887 | 0.188 | 38 | 1.775 | 0.168 | 45 | 1.714 | 0.180 | 64 | 2.218 | 0.542 | 37 | 1.824 | 0.189 | 37 | 1.603 | 0.108 | 37 | 1.717 | 0.118 | 38 | 1.925 | 0.220 |
| 56 | 1.953 | 0.196 | 52 | 1.884 | 0.183 | 45 | 1.769 | 0.212 | 56 | 1.682 | 0.140 | 66 | 2.003 | 0.751 | 38 | 1.819 | 0.168 | 42 | 1.602 | 0.109 | 38 | 1.697 | 0.106 | 39 | 1.858 | 0.296 |
| 57 | 1.821 | 0.157 | 54 | 1.877 | 0.304 | 46 | 1.752 | 0.190 | 57 | 1.667 | 0.079 | 67 | 1.955 | 0.408 | 45 | 1.800 | 0.144 | 45 | 1.564 | 0.103 | 39 | 1.666 | 0.113 | 40 | 1.816 | 0.140 |
| 59 | 1.795 | 0.349 | 56 | 1.847 | 0.138 | 56 | 1.703 | 0.211 | 60 | 1.666 | 0.074 | 72 | 1.954 | 0.452 | 46 | 1.699 | 0.123 | 56 | 1.549 | 0.109 | 40 | 1.664 | 0.198 | 41 | 1.781 | 0.258 |
| 60 | 1.757 | 0.133 | 57 | 1.826 | 0.172 | 57 | 1.675 | 0.176 | 62 | 1.659 | 0.103 | 80 | 1.890 | 0.478 | 50 | 1.681 | 0.224 | 57 | 1.546 | 0.036 | 41 | 1.664 | 0.269 | 42 | 1.729 | 0.079 |
| 61 | 1.755 | 0.139 | 58 | 1.805 | 0.264 | 60 | 1.655 | 0.165 | 63 | 1.642 | 0.056 | 93 | 1.868 | 0.480 | 53 | 1.645 | 0.054 | 60 | 1.529 | 0.049 | 45 | 1.651 | 0.208 | 44 | 1.696 | 0.255 |
| 62 | 1.748 | 0.127 | 60 | 1.787 | 0.197 | 62 | 1.621 | 0.153 | 64 | 1.632 | 0.088 | 94 | 1.810 | 0.396 | 55 | 1.609 | 0.074 | 62 | 1.514 | 0.038 | 48 | 1.634 | 0.164 | 50 | 1.671 | 0.409 |
| 63 | 1.734 | 0.113 | 61 | 1.775 | 0.252 | 63 | 1.610 | 0.141 | 65 | 1.594 | 0.050 | 95 | 1.693 | 0.527 | 56 | 1.609 | 0.203 | 63 | 1.512 | 0.074 | 50 | 1.592 | 0.265 | 51 | 1.655 | 0.370 |
| 64 | 1.732 | 0.097 | 62 | 1.754 | 0.184 | 64 | 1.609 | 0.114 | 66 | 1.591 | 0.185 | 96 | 1.648 | 0.667 | 57 | 1.575 | 0.180 | 64 | 1.501 | 0.047 | 51 | 1.584 | 0.130 | 52 | 1.644 | 0.346 |
| 65 | 1.716 | 0.169 | 63 | 1.750 | 0.213 | 65 | 1.608 | 0.178 | 67 | 1.589 | 0.071 | 100 | 1.646 | 0.674 | 60 | 1.572 | 0.126 | 65 | 1.497 | 0.053 | 52 | 1.580 | 0.197 | 53 | 1.641 | 0.286 |
| 66 | 1.709 | 0.119 | 64 | 1.731 | 0.129 | 66 | 1.608 | 0.154 | 74 | 1.580 | 0.045 | 106 | 1.638 | 0.764 | 61 | 1.532 | 0.166 | 66 | 1.491 | 0.056 | 53 | 1.548 | 0.145 | 54 | 1.607 | 0.388 |
| 67 | 1.688 | 0.261 | 65 | 1.723 | 0.121 | 67 | 1.597 | 0.132 | 75 | 1.579 | 0.096 | 107 | 1.629 | 0.609 | 63 | 1.531 | 0.098 | 67 | 1.489 | 0.047 | 55 | 1.544 | 0.104 | 55 | 1.596 | 0.279 |
| 69 | 1.687 | 0.174 | 66 | 1.697 | 0.315 | 72 | 1.565 | 0.067 | 76 | 1.564 | 0.206 | 108 | 1.612 | 0.471 | 64 | 1.530 | 0.067 | 69 | 1.480 | 0.095 | 57 | 1.525 | 0.152 | 58 | 1.571 | 0.383 |
| 72 | 1.673 | 0.173 | 67 | 1.654 | 0.294 | 74 | 1.557 | 0.198 | 77 | 1.561 | 0.030 | 109 | 1.567 | 0.493 | 65 | 1.503 | 0.057 | 72 | 1.480 | 0.075 | 59 | 1.522 | 0.274 | 59 | 1.562 | 0.092 |
| 74 | 1.643 | 0.232 | 74 | 1.647 | 0.279 | 76 | 1.524 | 0.129 | 78 | 1.534 | 0.107 | 110 | 1.438 | 0.586 | 66 | 1.497 | 0.160 | 74 | 1.477 | 0.097 | 60 | 1.517 | 0.194 | 61 | 1.559 | 0.388 |
| 75 | 1.612 | 0.291 | 75 | 1.621 | 0.144 | 77 | 1.511 | 0.097 | 80 | 1.504 | 0.039 | 114 | 1.429 | 0.719 | 68 | 1.497 | 0.180 | 75 | 1.471 | 0.068 | 61 | 1.503 | 0.129 | 67 | 1.551 | 0.223 |
| 77 | 1.585 | 0.222 | 76 | 1.618 | 0.153 | 78 | 1.492 | 0.129 | 89 | 1.477 | 0.076 | 121 | 1.418 | 0.711 | 69 | 1.493 | 0.075 | 76 | 1.461 | 0.068 | 68 | 1.492 | 0.197 | 68 | 1.548 | 0.327 |
| 78 | 1.578 | 0.259 | 77 | 1.609 | 0.203 | 79 | 1.492 | 0.101 | 92 | 1.451 | 0.093 | 122 | 1.382 | 0.613 | 70 | 1.488 | 0.219 | 77 | 1.451 | 0.077 | 69 | 1.481 | 0.178 | 69 | 1.533 | 0.253 |
| 80 | 1.559 | 0.349 | 78 | 1.585 | 0.146 | 80 | 1.470 | 0.153 | 93 | 1.423 | 0.061 | 135 | 1.379 | 0.693 | 72 | 1.478 | 0.119 | 78 | 1.446 | 0.105 | 70 | 1.468 | 0.230 | 70 | 1.497 | 0.190 |
| 89 | 1.512 | 0.415 | 79 | 1.580 | 0.199 | 91 | 1.464 | 0.143 | 94 | 1.417 | 0.063 | 136 | 1.357 | 0.494 | 74 | 1.464 | 0.203 | 80 | 1.435 | 0.101 | 72 | 1.463 | 0.220 | 71 | 1.478 | 0.128 |
| 92 | 1.495 | 0.475 | 80 | 1.565 | 0.344 | 92 | 1.462 | 0.125 | 95 | 1.417 | 0.049 | 159 | 1.356 | 0.614 | 75 | 1.445 | 0.250 | 89 | 1.430 | 0.118 | 73 | 1.462 | 0.190 | 72 | 1.477 | 0.520 |
| 93 | 1.487 | 0.285 | 92 | 1.554 | 0.344 | 93 | 1.435 | 0.096 | 96 | 1.412 | 0.230 | 160 | 1.327 | 0.645 | 77 | 1.444 | 0.130 | 91 | 1.425 | 0.110 | 74 | 1.457 | 0.310 | 75 | 1.450 | 0.107 |
| 94 | 1.480 | 0.186 | 93 | 1.487 | 0.365 | 94 | 1.399 | 0.157 | 100 | 1.399 | 0.074 | 78 | 1.440 | 0.113 | 92 | 1.419 | 0.115 | 79 | 1.450 | 0.112 | 78 | 1.416 | 0.363 | |||
| 95 | 1.468 | 0.172 | 94 | 1.435 | 0.252 | 95 | 1.392 | 0.140 | 104 | 1.394 | 0.063 | 80 | 1.436 | 0.165 | 93 | 1.418 | 0.122 | 81 | 1.435 | 0.190 | 80 | 1.409 | 0.433 | |||
| 96 | 1.445 | 0.439 | 95 | 1.372 | 0.383 | 96 | 1.388 | 0.195 | 105 | 1.392 | 0.045 | 89 | 1.425 | 0.181 | 94 | 1.417 | 0.045 | 82 | 1.421 | 0.359 | 81 | 1.386 | 0.436 | |||
| 100 | 1.423 | 0.137 | 96 | 1.366 | 0.237 | 100 | 1.376 | 0.127 | 106 | 1.374 | 0.075 | 91 | 1.422 | 0.277 | 95 | 1.405 | 0.108 | 83 | 1.421 | 0.246 | 82 | 1.352 | 0.198 | |||
| 106 | 1.419 | 0.286 | 103 | 1.354 | 0.330 | 104 | 1.374 | 0.300 | 107 | 1.366 | 0.116 | 92 | 1.403 | 0.138 | 96 | 1.401 | 0.157 | 86 | 1.415 | 0.136 | 83 | 1.340 | 0.291 | |||
| 107 | 1.412 | 0.302 | 104 | 1.316 | 0.205 | 105 | 1.374 | 0.247 | 108 | 1.362 | 0.162 | 93 | 1.384 | 0.190 | 100 | 1.396 | 0.059 | 87 | 1.401 | 0.222 | 86 | 1.338 | 0.405 | |||
| 108 | 1.404 | 0.242 | 105 | 1.287 | 0.170 | 106 | 1.368 | 0.086 | 109 | 1.350 | 0.225 | 94 | 1.344 | 0.146 | 104 | 1.392 | 0.126 | 91 | 1.375 | 0.265 | 87 | 1.317 | 0.297 | |||
| 109 | 1.389 | 0.275 | 106 | 1.285 | 0.182 | 107 | 1.367 | 0.125 | 110 | 1.347 | 0.114 | 95 | 1.338 | 0.367 | 105 | 1.378 | 0.072 | 92 | 1.343 | 0.258 | 88 | 1.295 | 0.280 | |||
| 110 | 1.328 | 0.158 | 107 | 1.254 | 0.158 | 108 | 1.366 | 0.241 | 117 | 1.340 | 0.129 | 97 | 1.320 | 0.351 | 106 | 1.369 | 0.066 | 95 | 1.310 | 0.216 | 94 | 1.277 | 0.272 | |||
| 112 | 1.307 | 0.322 | 108 | 1.253 | 0.197 | 109 | 1.365 | 0.163 | 118 | 1.339 | 0.204 | 98 | 1.312 | 0.151 | 107 | 1.351 | 0.103 | 96 | 1.280 | 0.333 | 97 | 1.272 | 0.338 | |||
| 118 | 1.274 | 0.259 | 109 | 1.235 | 0.438 | 110 | 1.345 | 0.101 | 119 | 1.324 | 0.070 | 100 | 1.298 | 0.185 | 108 | 1.329 | 0.166 | 97 | 1.267 | 0.319 | 98 | 1.271 | 0.265 | |||
| 119 | 1.239 | 0.301 | 110 | 1.228 | 0.315 | 115 | 1.335 | 0.174 | 120 | 1.309 | 0.120 | 103 | 1.267 | 0.209 | 109 | 1.327 | 0.085 | 98 | 1.255 | 0.134 | 99 | 1.251 | 0.228 | |||
| 120 | 1.211 | 0.231 | 113 | 1.223 | 0.272 | 117 | 1.329 | 0.109 | 121 | 1.291 | 0.165 | 104 | 1.260 | 0.425 | 112 | 1.303 | 0.099 | 99 | 1.214 | 0.393 | 111 | 1.213 | 0.446 | |||
| 121 | 1.202 | 0.215 | 117 | 1.221 | 0.308 | 118 | 1.318 | 0.150 | 122 | 1.284 | 0.120 | 105 | 1.254 | 0.371 | 113 | 1.285 | 0.088 | 109 | 1.210 | 0.424 | 112 | 1.206 | 0.226 | |||
| 122 | 1.186 | 0.459 | 118 | 1.220 | 0.228 | 119 | 1.309 | 0.263 | 123 | 1.283 | 0.120 | 106 | 1.219 | 0.136 | 115 | 1.285 | 0.175 | 110 | 1.185 | 0.510 | 113 | 1.190 | 0.333 | |||
| 123 | 1.176 | 0.525 | 119 | 1.206 | 0.375 | 120 | 1.292 | 0.207 | 124 | 1.276 | 0.125 | 107 | 1.209 | 0.231 | 116 | 1.258 | 0.144 | 111 | 1.133 | 0.324 | 123 | 1.187 | 0.382 | |||
| 124 | 1.150 | 0.193 | 120 | 1.187 | 0.329 | 121 | 1.288 | 0.164 | 125 | 1.274 | 0.081 | 108 | 1.180 | 0.122 | 117 | 1.255 | 0.153 | 112 | 1.131 | 0.483 | 125 | 1.143 | 0.411 | |||
| 126 | 1.112 | 0.242 | 121 | 1.180 | 0.249 | 122 | 1.268 | 0.196 | 131 | 1.265 | 0.137 | 109 | 1.173 | 0.196 | 118 | 1.244 | 0.121 | 116 | 1.109 | 0.305 | 126 | 1.120 | 0.353 | |||
| 134 | 1.100 | 0.479 | 122 | 1.167 | 0.391 | 123 | 1.265 | 0.186 | 132 | 1.263 | 0.195 | 110 | 1.168 | 0.209 | 119 | 1.230 | 0.179 | 126 | 1.055 | 0.445 | 138 | 1.096 | 0.196 | |||
| 135 | 1.093 | 0.381 | 123 | 1.156 | 0.277 | 124 | 1.225 | 0.167 | 134 | 1.259 | 0.141 | 112 | 1.148 | 0.203 | 120 | 1.224 | 0.128 | 140 | 1.036 | 0.459 | 139 | 1.068 | 0.285 | |||
| 136 | 1.085 | 0.304 | 124 | 1.146 | 0.348 | 125 | 1.215 | 0.186 | 135 | 1.231 | 0.118 | 115 | 1.146 | 0.138 | 121 | 1.223 | 0.125 | 141 | 1.025 | 0.370 | 140 | 1.063 | 0.585 | |||
| 137 | 1.072 | 0.387 | 125 | 1.145 | 0.401 | 129 | 1.195 | 0.207 | 136 | 1.175 | 0.145 | 117 | 1.142 | 0.142 | 122 | 1.214 | 0.232 | 166 | 1.014 | 0.527 | 141 | 1.060 | 0.184 | |||
| 139 | 1.053 | 0.336 | 132 | 1.132 | 0.187 | 134 | 1.173 | 0.166 | 137 | 1.174 | 0.160 | 118 | 1.131 | 0.188 | 123 | 1.206 | 0.130 | 161 | 1.028 | 0.269 | ||||||
| 146 | 1.044 | 0.371 | 134 | 1.102 | 0.327 | 135 | 1.139 | 0.155 | 145 | 1.160 | 0.137 | 119 | 1.124 | 0.224 | 124 | 1.205 | 0.111 | |||||||||
| 147 | 1.040 | 0.379 | 135 | 1.101 | 0.322 | 136 | 1.138 | 0.241 | 146 | 1.157 | 0.176 | 120 | 1.108 | 0.210 | 125 | 1.188 | 0.156 | |||||||||
| 150 | 1.021 | 0.471 | 136 | 1.099 | 0.220 | 137 | 1.125 | 0.411 | 150 | 1.138 | 0.122 | 121 | 1.102 | 0.257 | 127 | 1.177 | 0.157 | |||||||||
| 160 | 1.018 | 0.521 | 137 | 1.097 | 0.306 | 145 | 1.108 | 0.348 | 151 | 1.137 | 0.271 | 122 | 1.098 | 0.253 | 131 | 1.176 | 0.106 | |||||||||
| 164 | 1.002 | 0.467 | 145 | 1.092 | 0.248 | 146 | 1.096 | 0.246 | 152 | 1.126 | 0.146 | 123 | 1.085 | 0.199 | 132 | 1.168 | 0.190 | |||||||||
| 146 | 1.074 | 0.213 | 148 | 1.092 | 0.371 | 164 | 1.112 | 0.214 | 124 | 1.084 | 0.296 | 134 | 1.145 | 0.166 | ||||||||||||
| 150 | 1.039 | 0.274 | 150 | 1.077 | 0.204 | 126 | 1.056 | 0.303 | 135 | 1.131 | 0.146 | |||||||||||||||
| 152 | 1.006 | 0.280 | 151 | 1.046 | 0.225 | 132 | 1.037 | 0.488 | 136 | 1.119 | 0.226 | |||||||||||||||
| 164 | 1.001 | 0.272 | 152 | 1.031 | 0.405 | 134 | 1.036 | 0.420 | 137 | 1.114 | 0.208 | |||||||||||||||
| 160 | 1.028 | 0.231 | 135 | 1.034 | 0.318 | 139 | 1.107 | 0.152 | ||||||||||||||||||
| 164 | 1.011 | 0.142 | 136 | 1.023 | 0.331 | 146 | 1.092 | 0.169 | ||||||||||||||||||
| 137 | 1.016 | 0.487 | 148 | 1.089 | 0.250 | |||||||||||||||||||||
| 145 | 1.015 | 0.500 | 150 | 1.086 | 0.218 | |||||||||||||||||||||
| 150 | 1.015 | 0.383 | 151 | 1.082 | 0.300 | |||||||||||||||||||||
| 151 | 1.010 | 0.214 | 152 | 1.017 | 0.183 | |||||||||||||||||||||
| 164 | 1.001 | 0.384 | 160 | 1.014 | 0.263 | |||||||||||||||||||||
| 164 | 1.003 | 0.129 | ||||||||||||||||||||||||
| Total number | ||||||||||||||||||||||||||
| 52 | 56 | 58 | 53 | 24 | 63 | 64 | 46 | 47 | ||||||||||||||||||
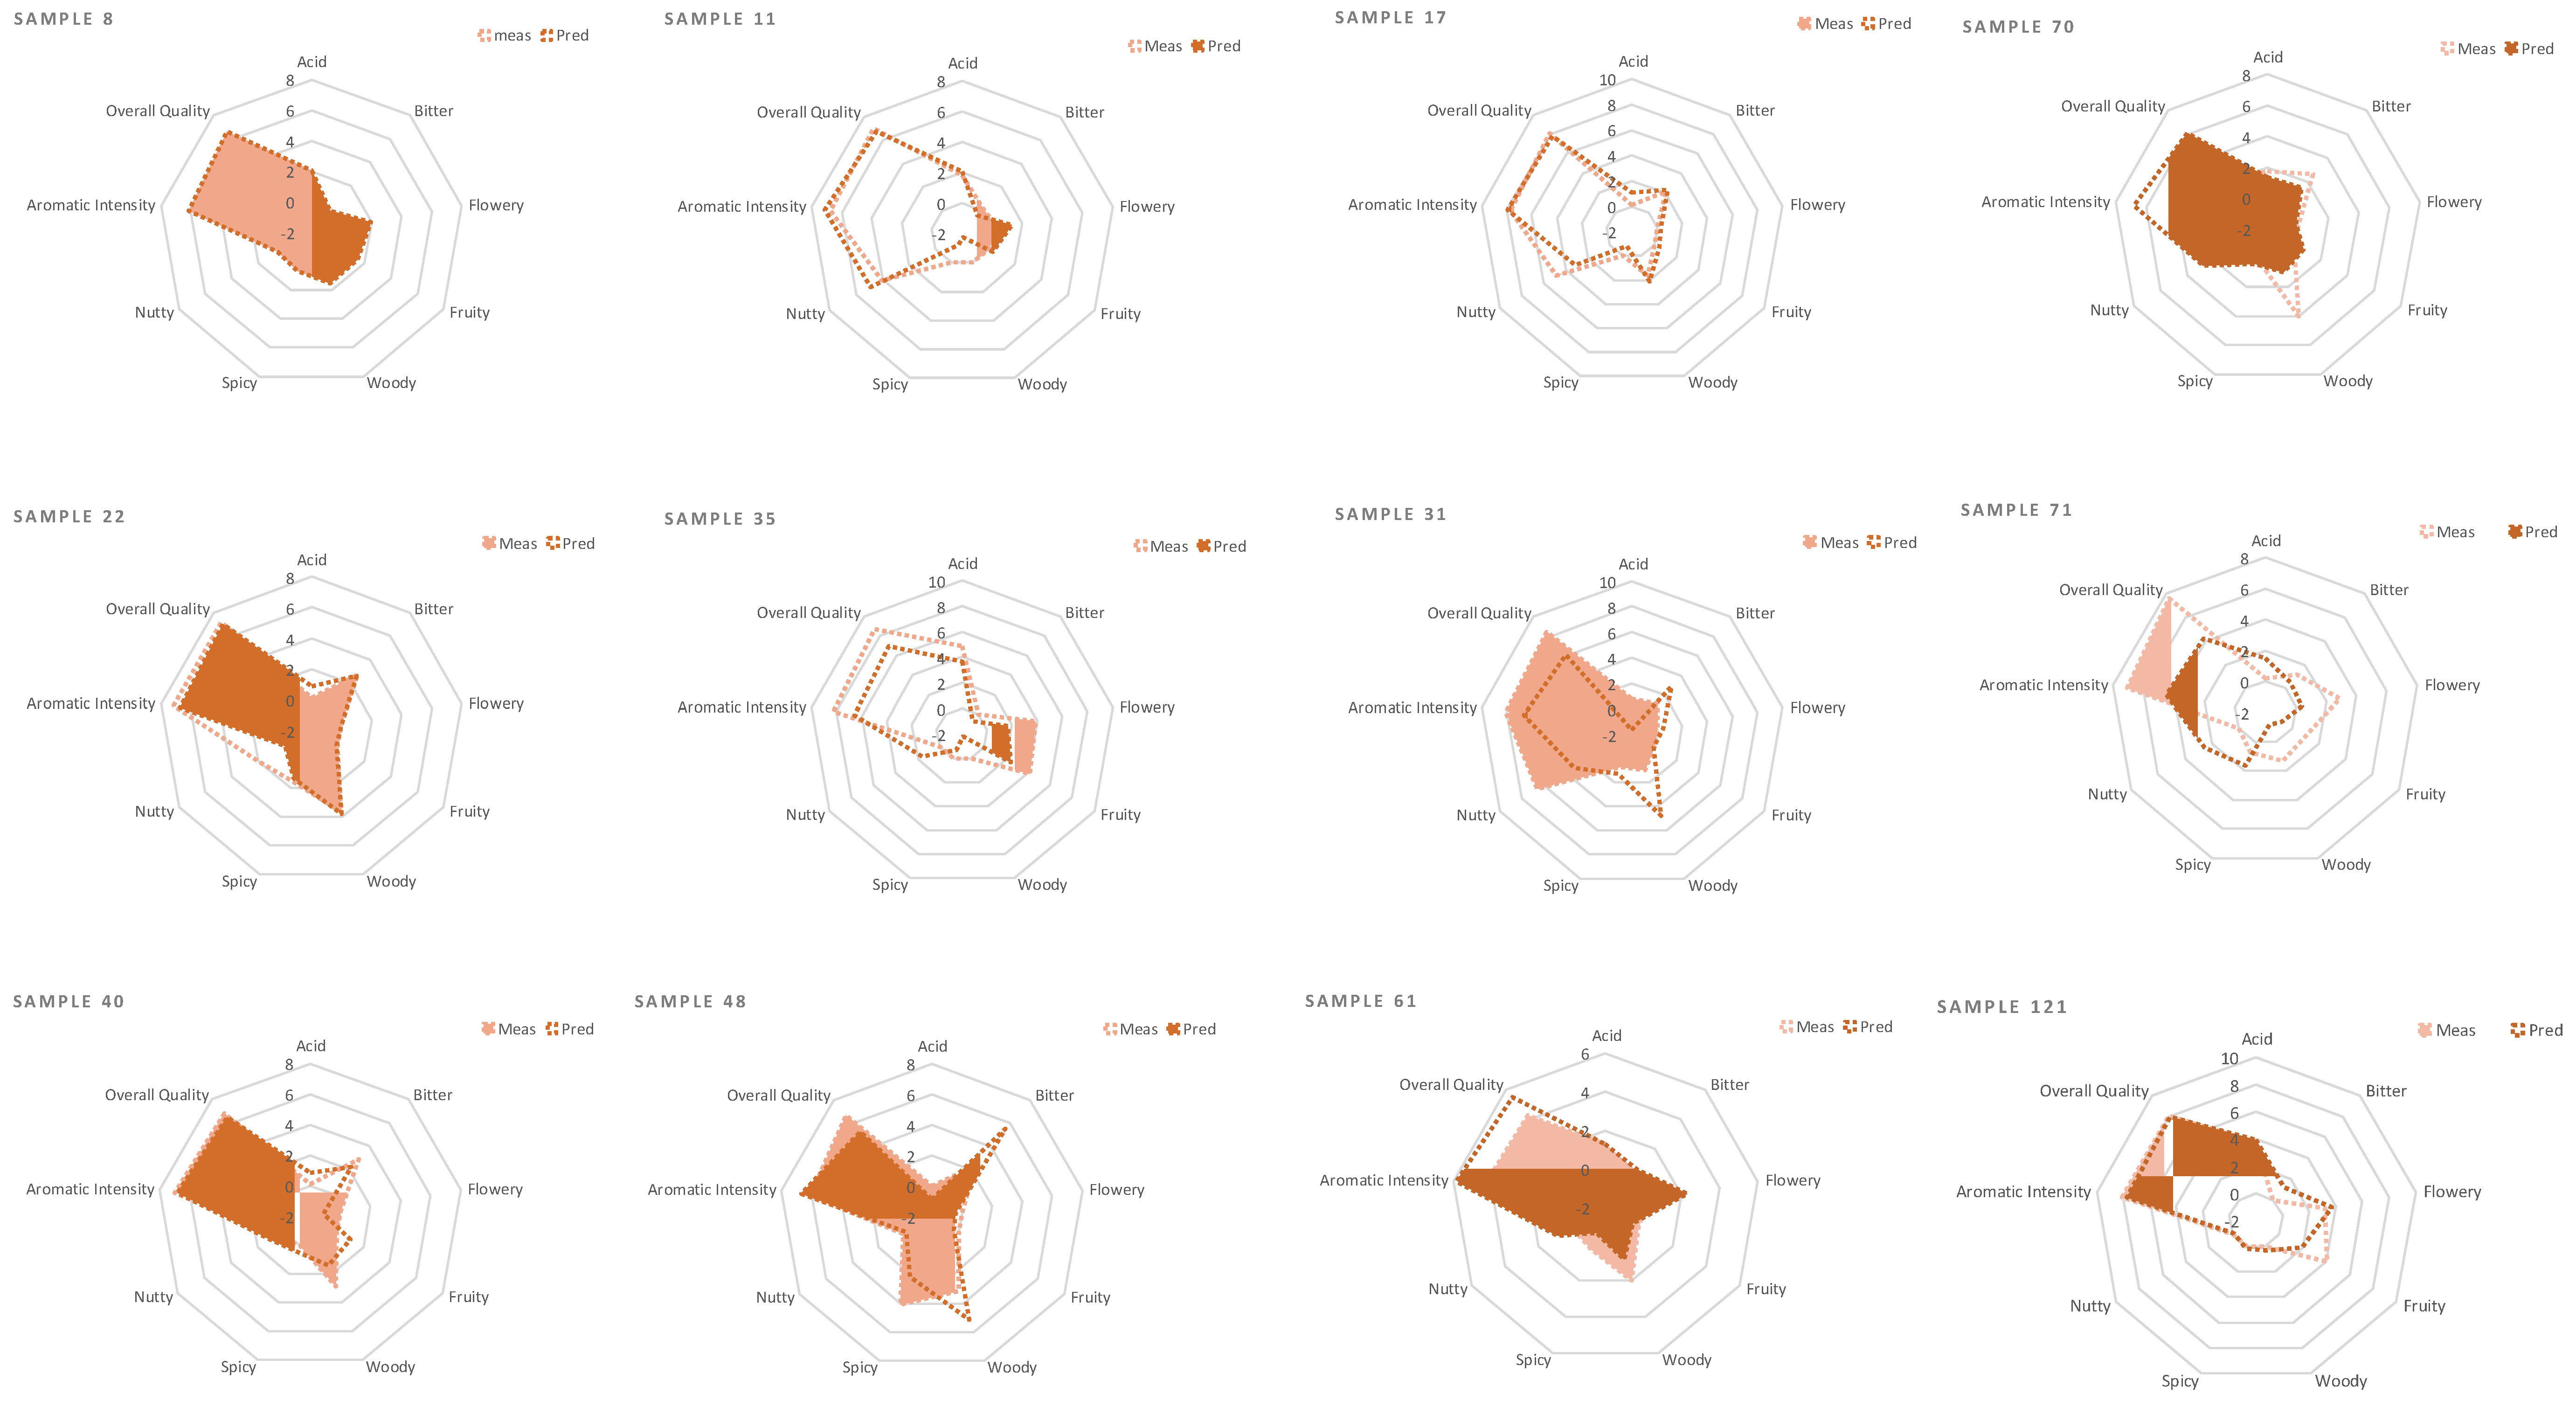
| Single-Note Model Performance | Multi-Note Model Performance | |||||||
|---|---|---|---|---|---|---|---|---|
| Sensory Note | Model Factors | R2val | RMSEV | RMSEP | Model Factors | R2val | RMSEV | RMSEP |
| Acid | 3 | 0.663 | 1.129 | 0.946 | 3 | 0.856 | 0.726 | 1.192 |
| Bitter | 4 | 0.817 | 1.142 | 1.063 | 4 | 0.936 | 0.626 | 1.315 |
| Woody | 4 | 0.669 | 1.570 | 1.725 | 4 | 0.884 | 1.003 | 2.306 |
| Flowery | 4 | 0.746 | 1.038 | 1.345 | 4 | 0.907 | 0.651 | 1.964 |
| Fruity | 4 | 0.661 | 1.026 | 1.499 | 2 | 0.790 | 0.785 | 1.598 |
| Spicy | 1 | 0.792 | 0.963 | 1.209 | 3 | 0.784 | 0.977 | 1.194 |
| Nutty | 6 | 0.544 | 1.506 | 1.661 | 4 | 0.893 | 0.864 | 1.891 |
| Aroma intensity | 1 | 0.557 | 0.936 | 1.296 | 4 | 0.764 | 0.627 | 1.642 |
| Overall quality | 4 | 0.556 | 0.936 | 2.120 | 4 | 0.756 | 0.726 | 2.239 |
© 2019 by the authors. Licensee MDPI, Basel, Switzerland. This article is an open access article distributed under the terms and conditions of the Creative Commons Attribution (CC BY) license (http://creativecommons.org/licenses/by/4.0/).
Share and Cite
Liberto, E.; Bressanello, D.; Strocchi, G.; Cordero, C.; Ruosi, M.R.; Pellegrino, G.; Bicchi, C.; Sgorbini, B. HS-SPME-MS-Enose Coupled with Chemometrics as an Analytical Decision Maker to Predict In-Cup Coffee Sensory Quality in Routine Controls: Possibilities and Limits. Molecules 2019, 24, 4515. https://doi.org/10.3390/molecules24244515
Liberto E, Bressanello D, Strocchi G, Cordero C, Ruosi MR, Pellegrino G, Bicchi C, Sgorbini B. HS-SPME-MS-Enose Coupled with Chemometrics as an Analytical Decision Maker to Predict In-Cup Coffee Sensory Quality in Routine Controls: Possibilities and Limits. Molecules. 2019; 24(24):4515. https://doi.org/10.3390/molecules24244515
Chicago/Turabian StyleLiberto, Erica, Davide Bressanello, Giulia Strocchi, Chiara Cordero, Manuela Rosanna Ruosi, Gloria Pellegrino, Carlo Bicchi, and Barbara Sgorbini. 2019. "HS-SPME-MS-Enose Coupled with Chemometrics as an Analytical Decision Maker to Predict In-Cup Coffee Sensory Quality in Routine Controls: Possibilities and Limits" Molecules 24, no. 24: 4515. https://doi.org/10.3390/molecules24244515