
Techno–Economic Analysis of the Optimum Configuration for Supercritical Carbon Dioxide Cycles in Concentrating Solar Power Systems


Abstract
:1. Introduction
2. Methodology
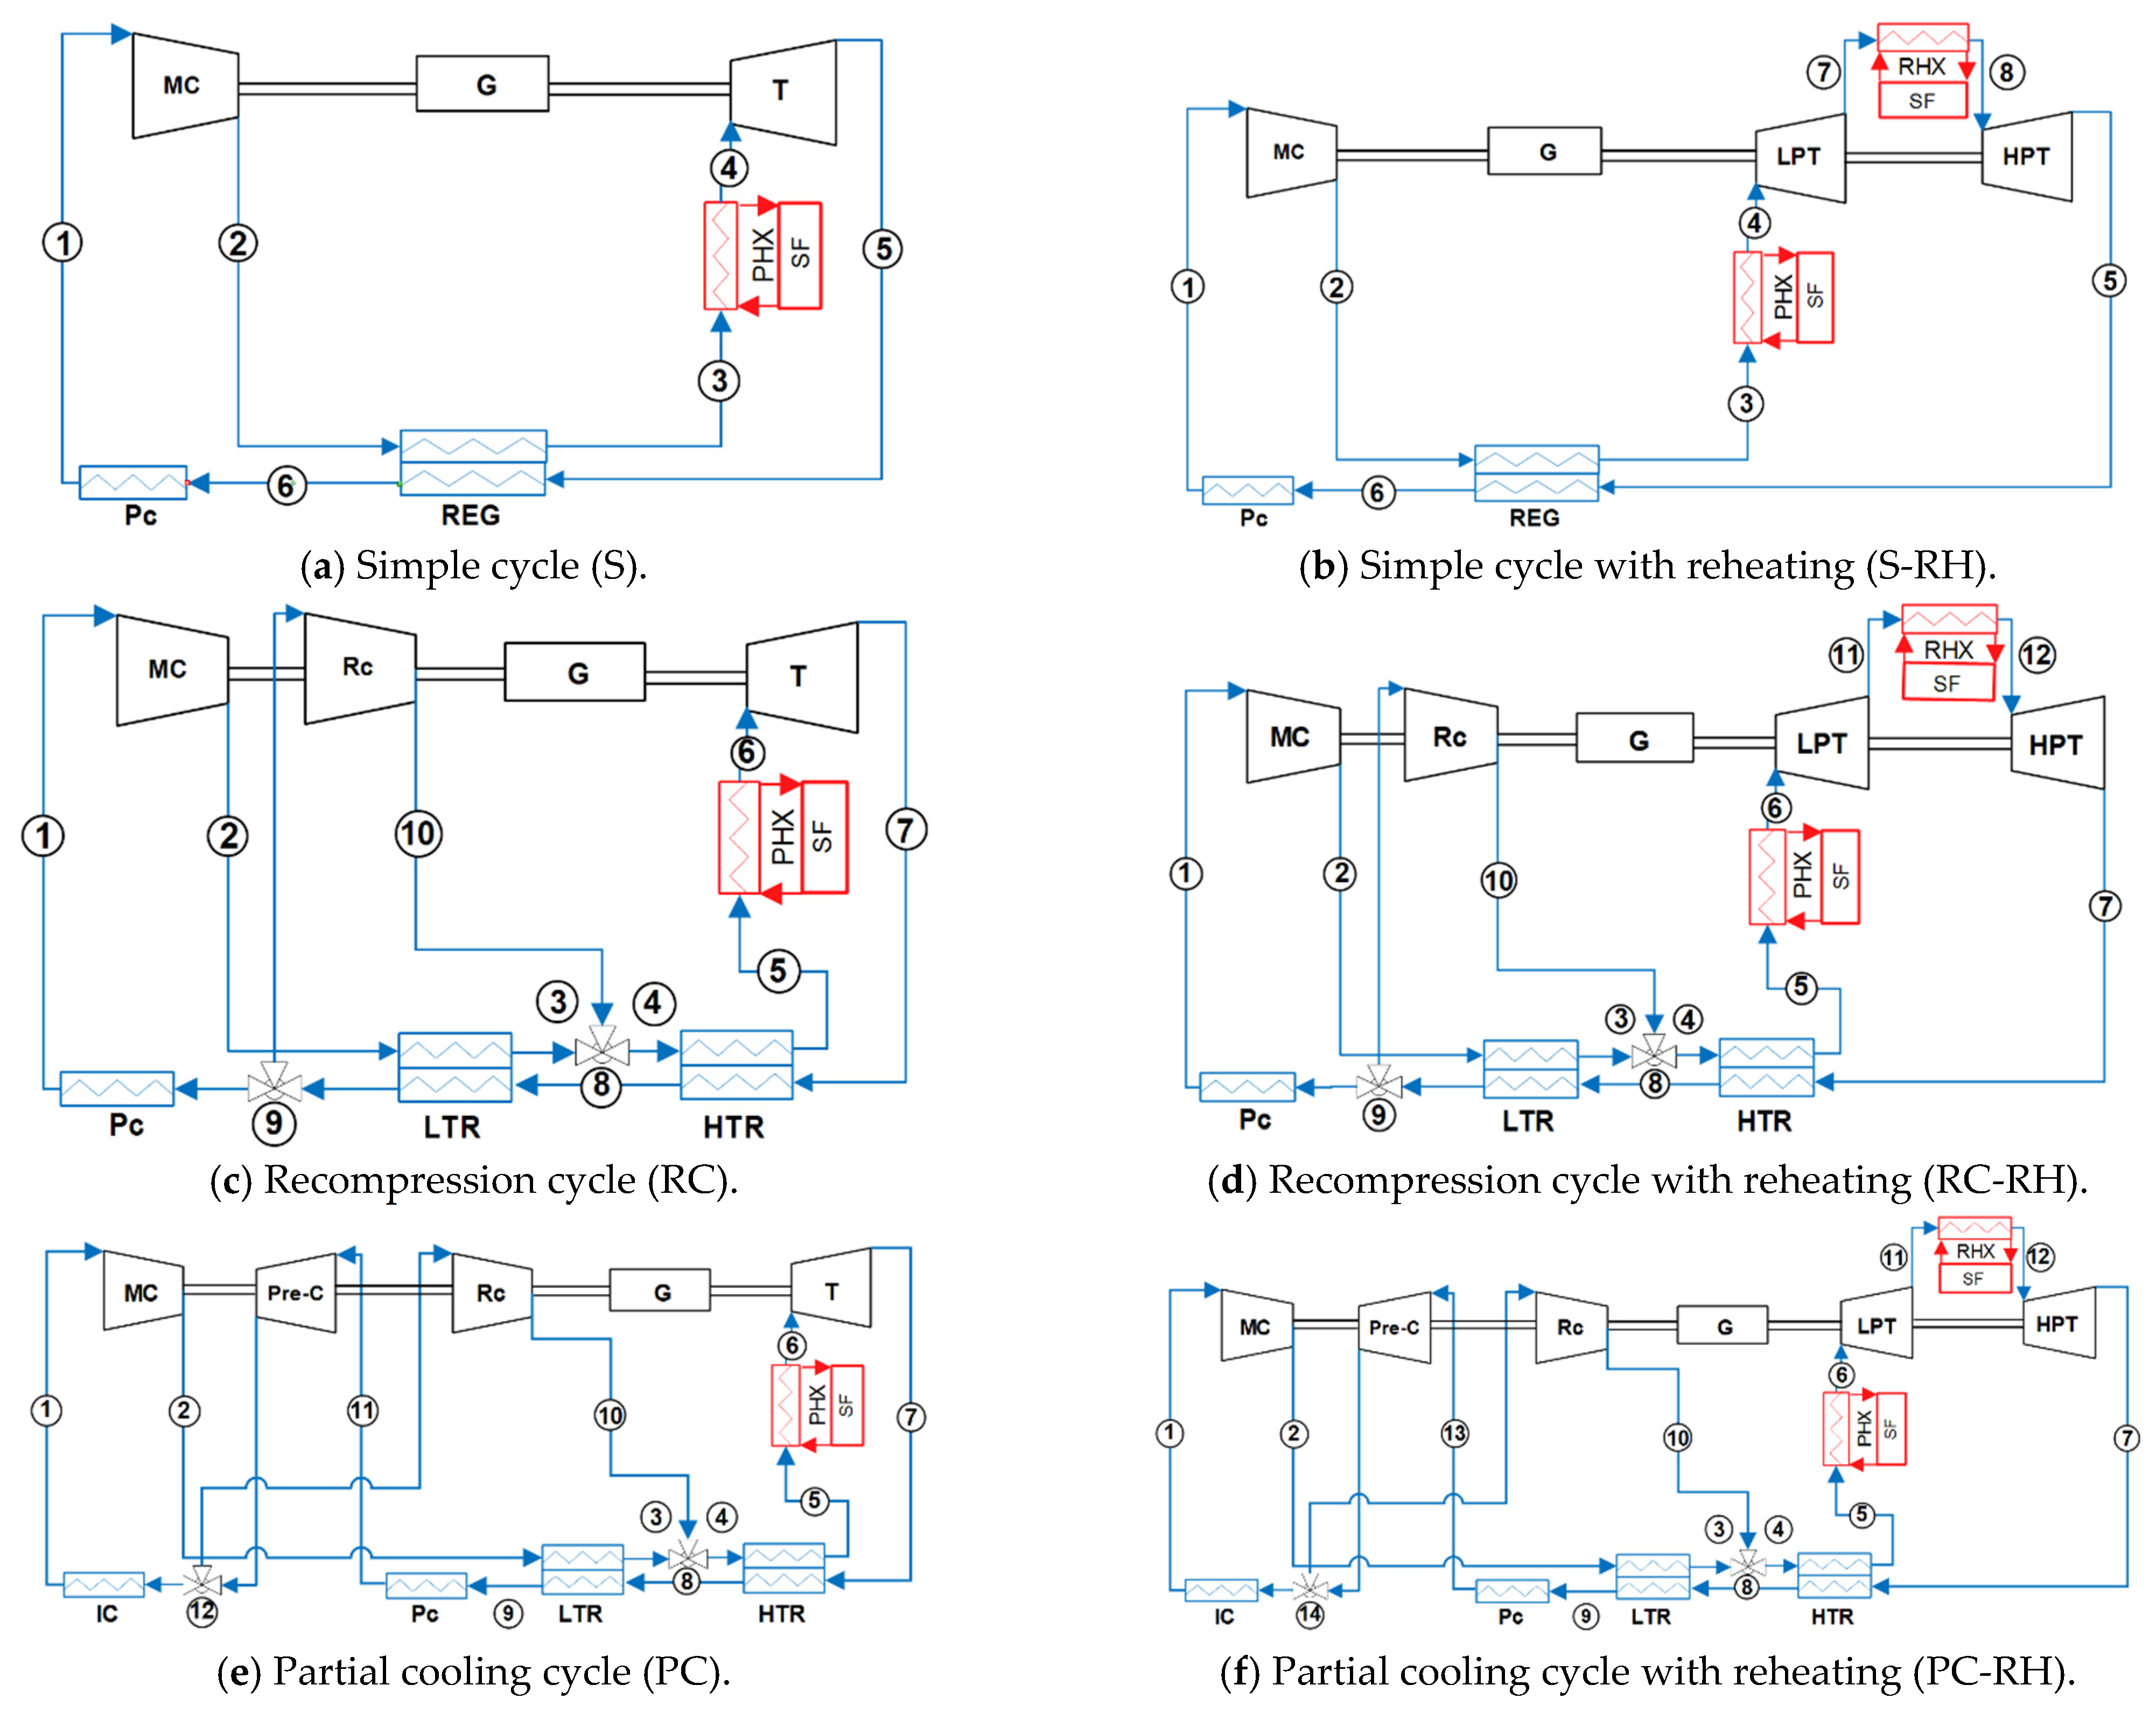
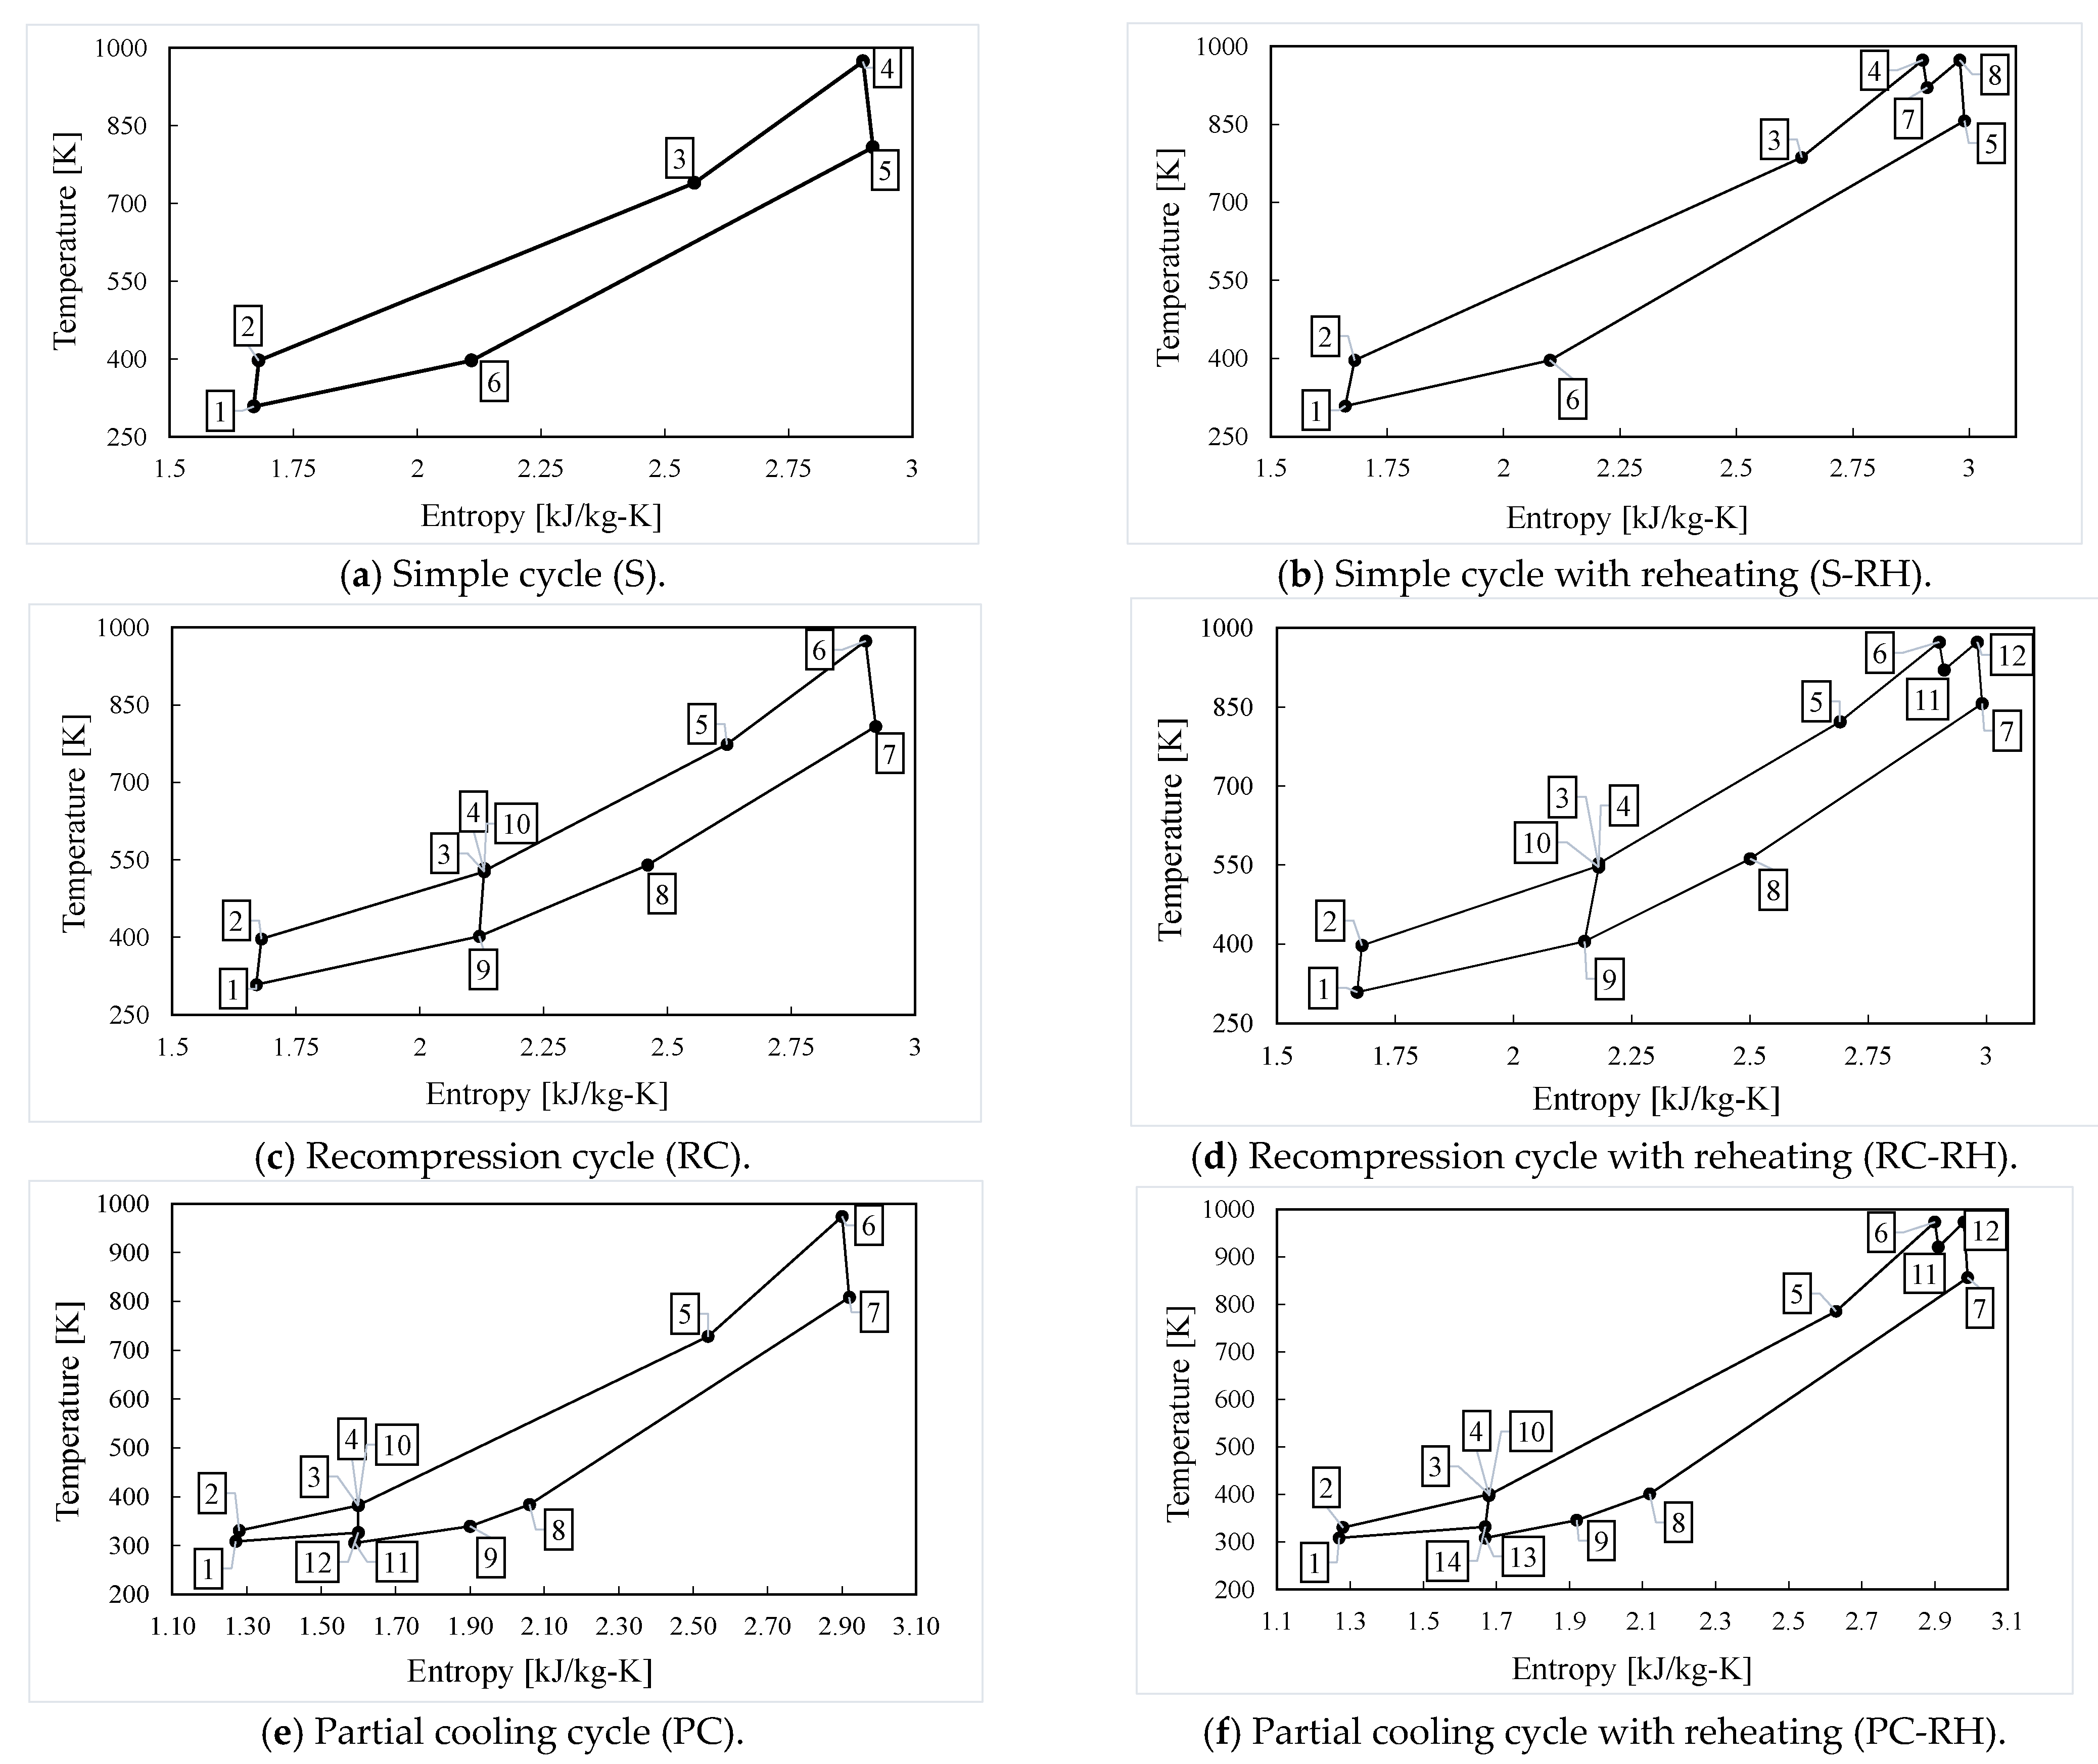
2.1. Cycle Configurations
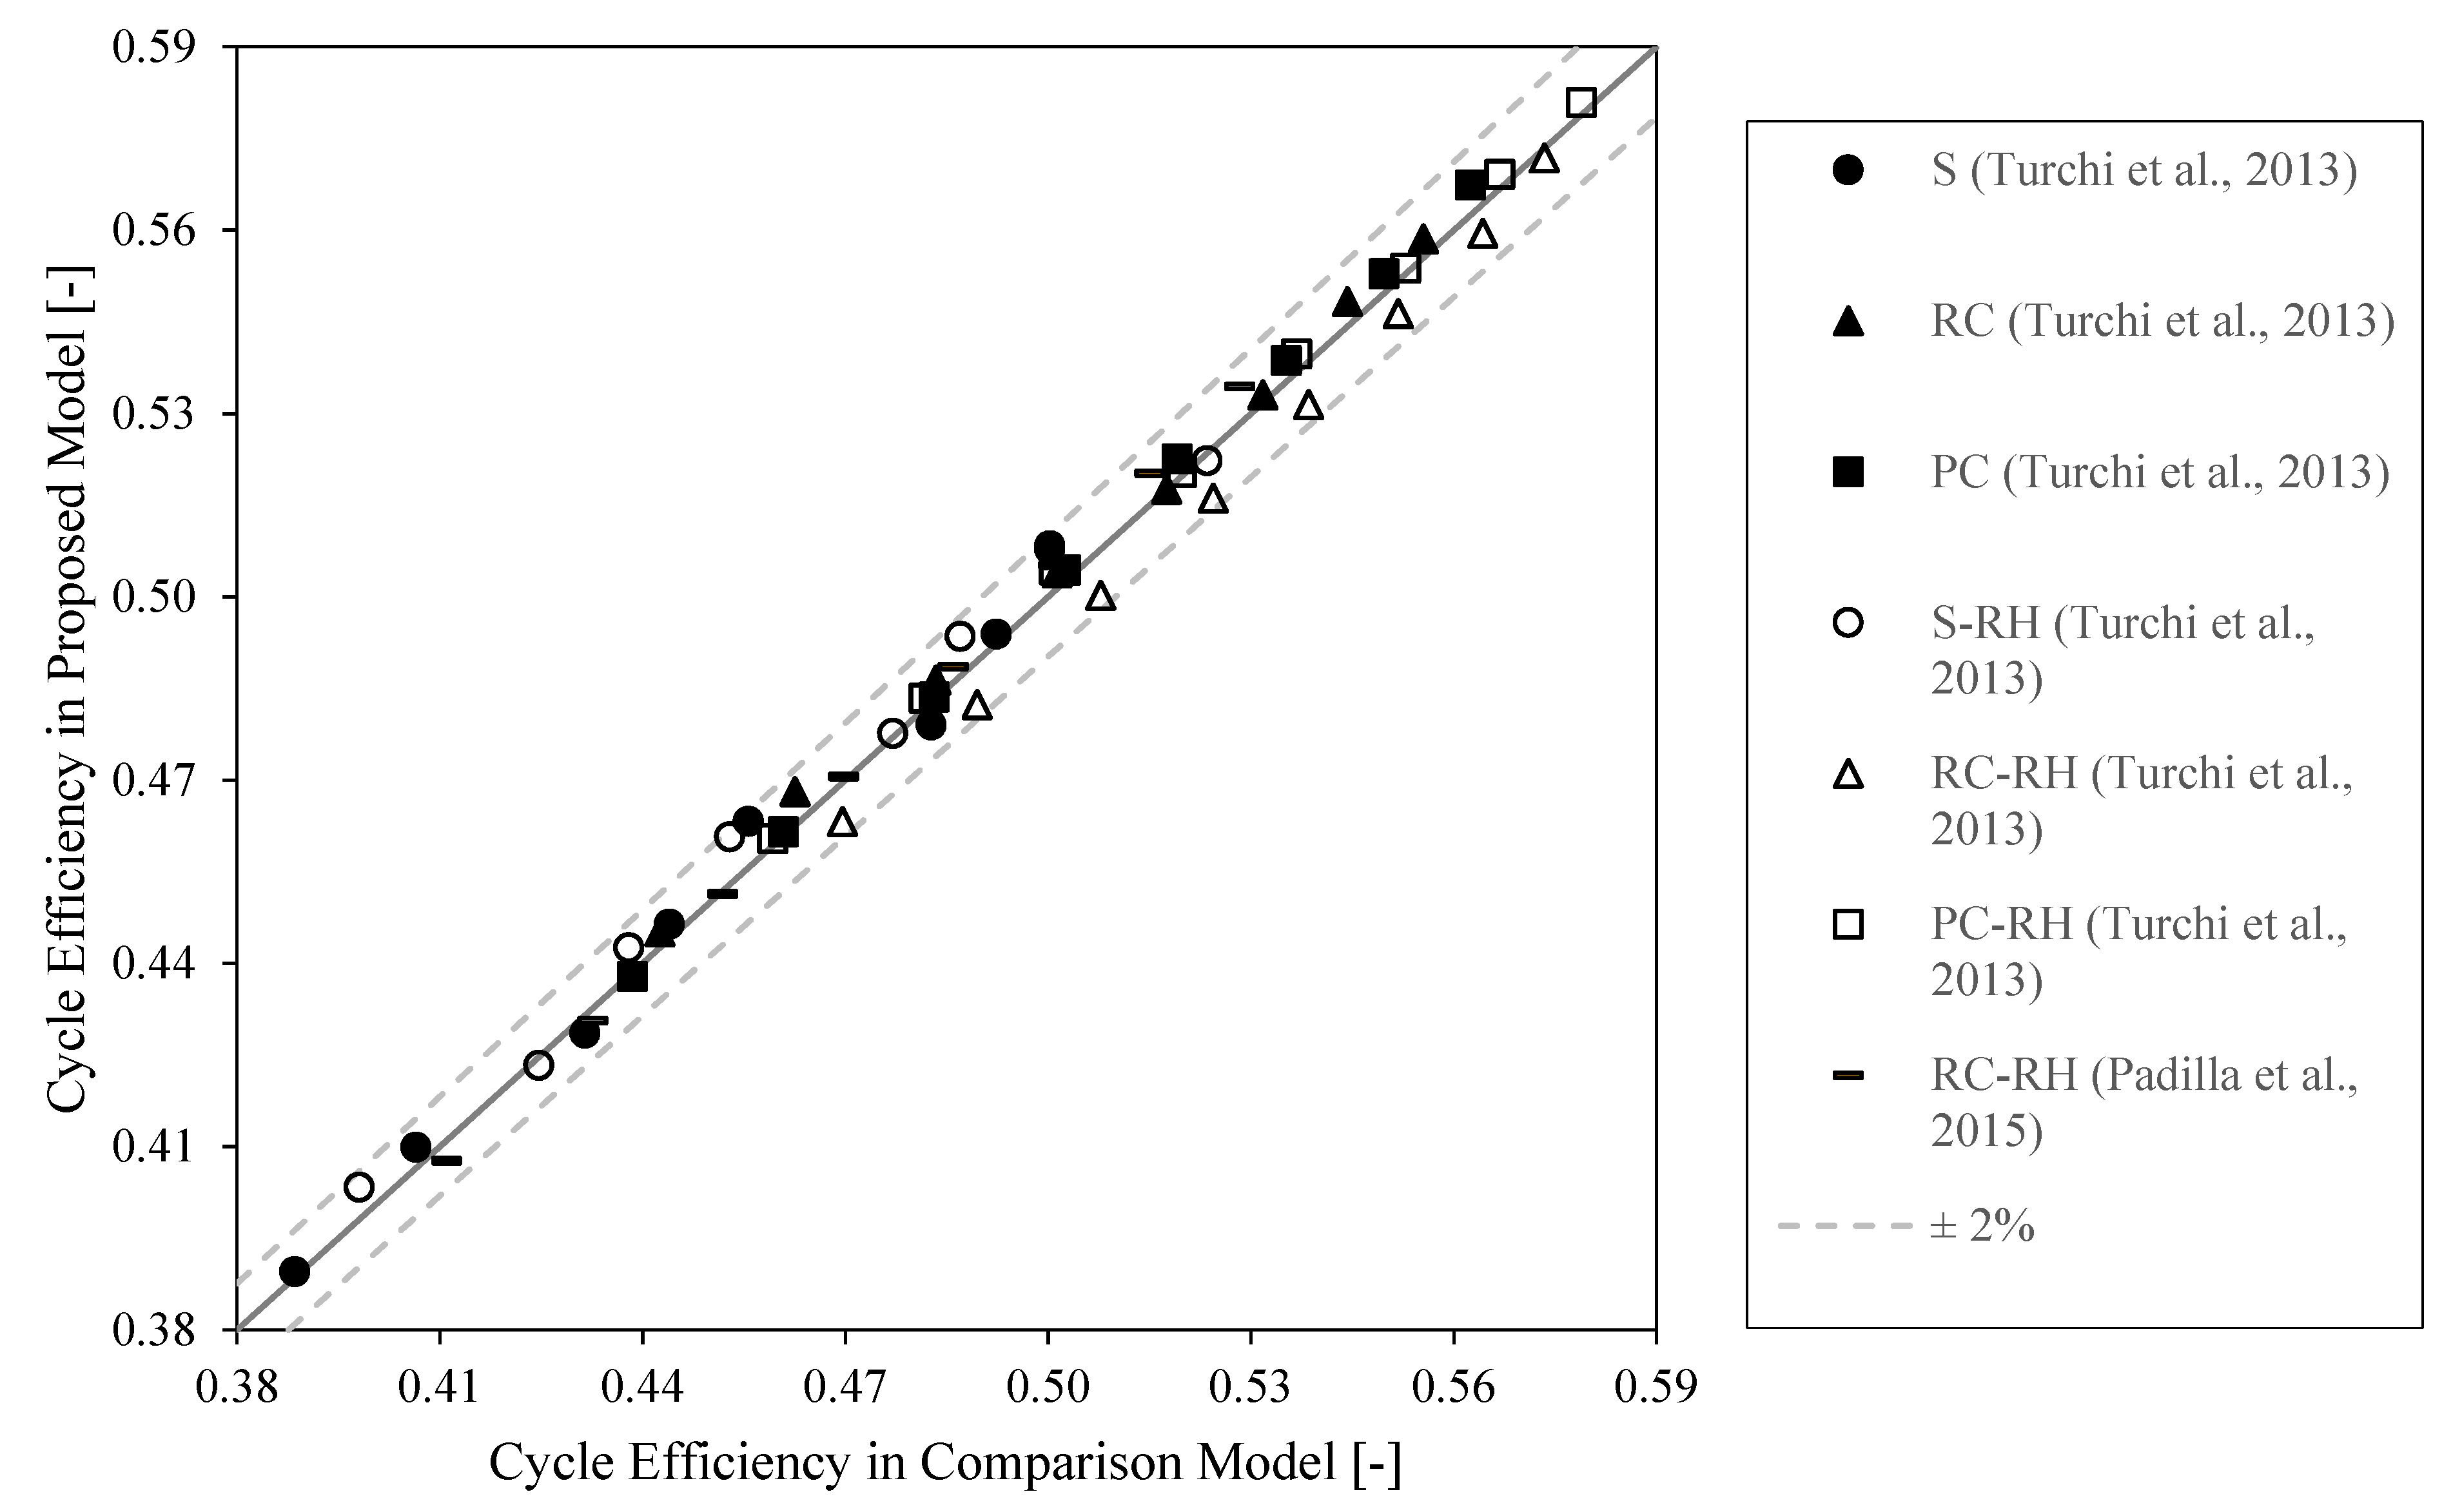
2.2. Model and Benchmark
- the cycle operates in steady-state conditions;
- pressure drops are considered in each component as a percentage of the working pressure;
- compressors and turbines work in adiabatic conditions.
2.3. Variables to Analyze
2.4. Cycle Optimization
3. Results
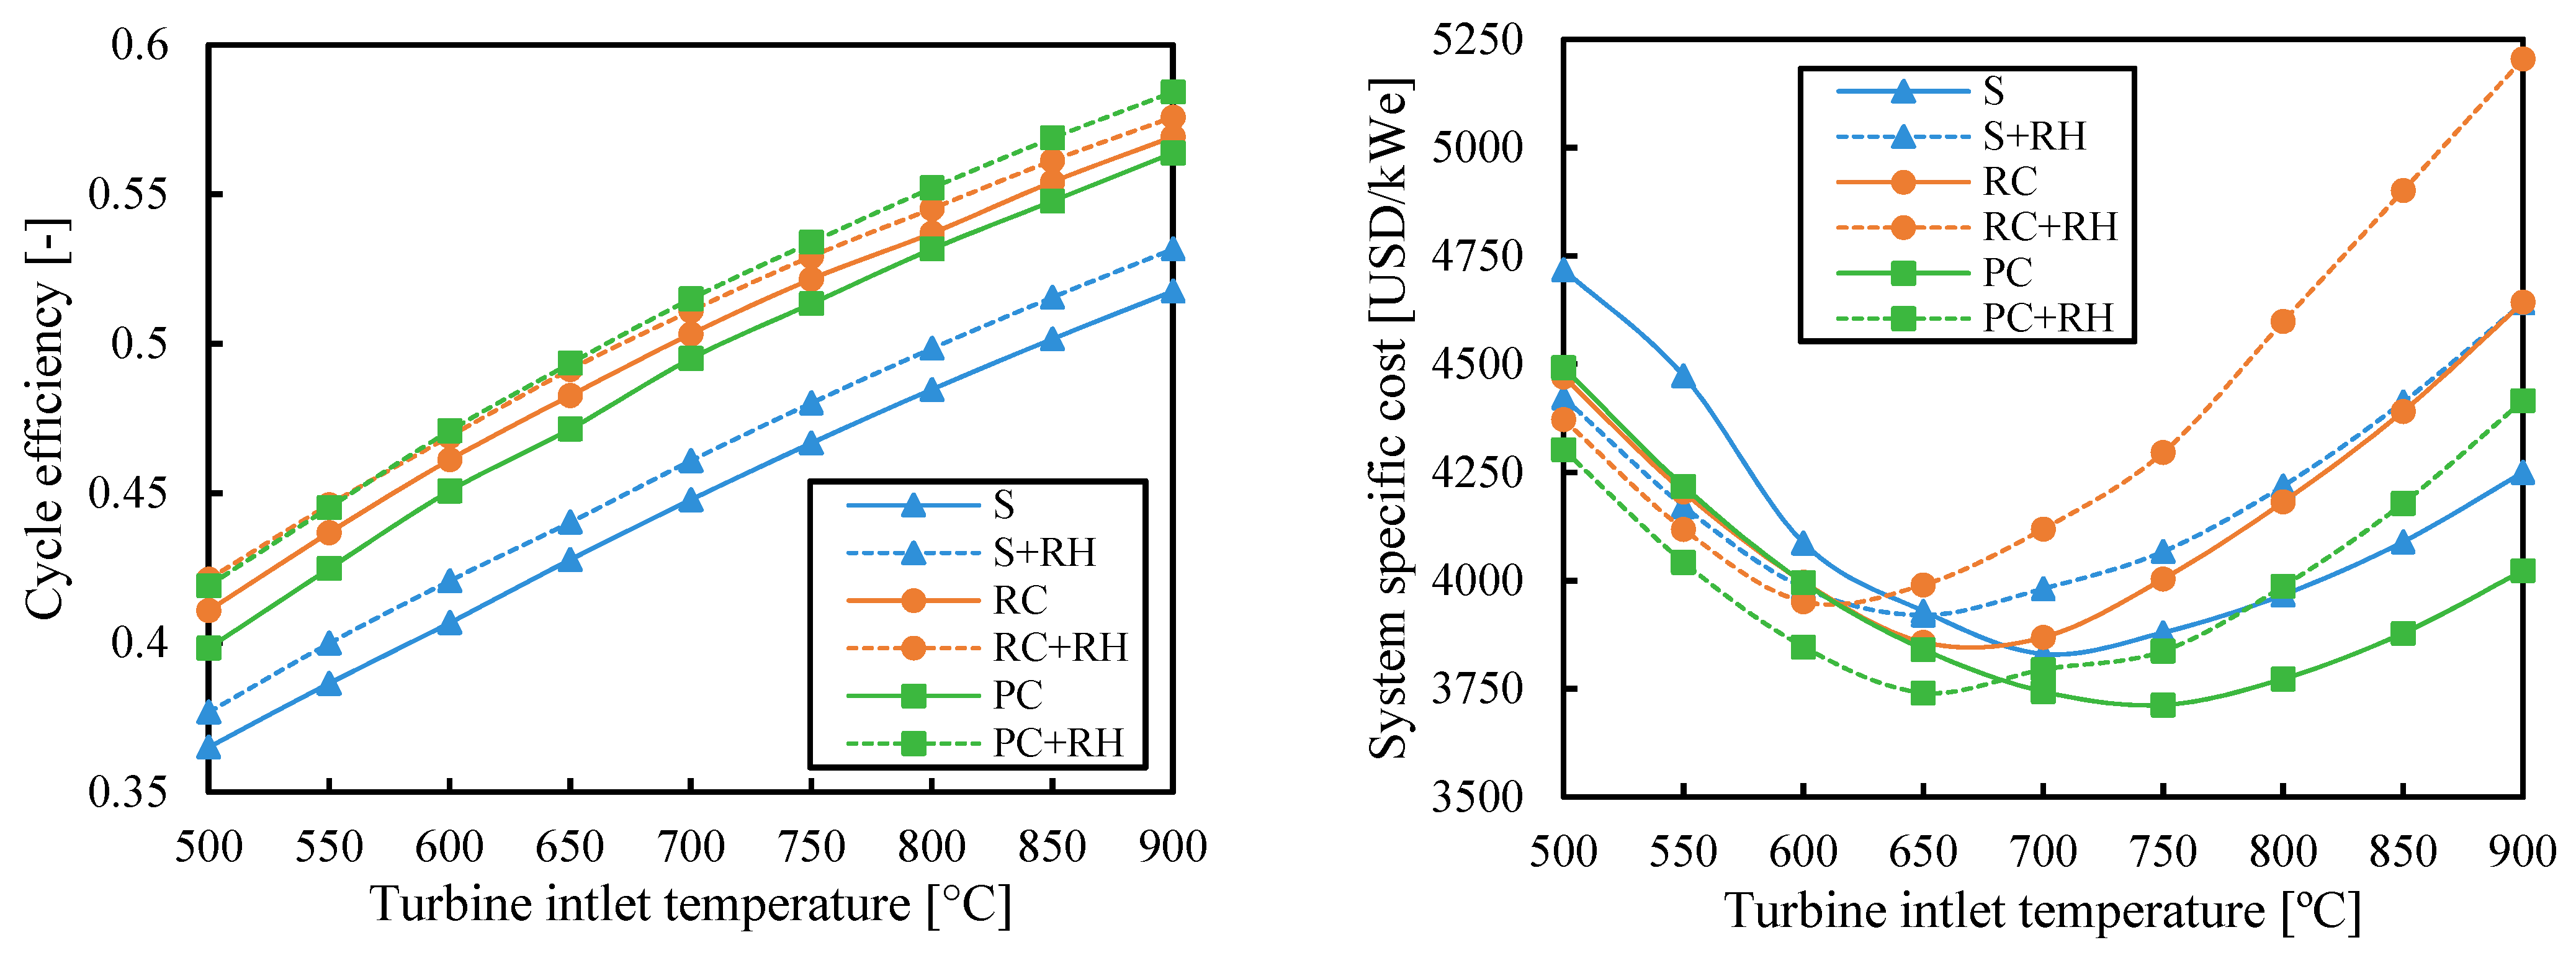
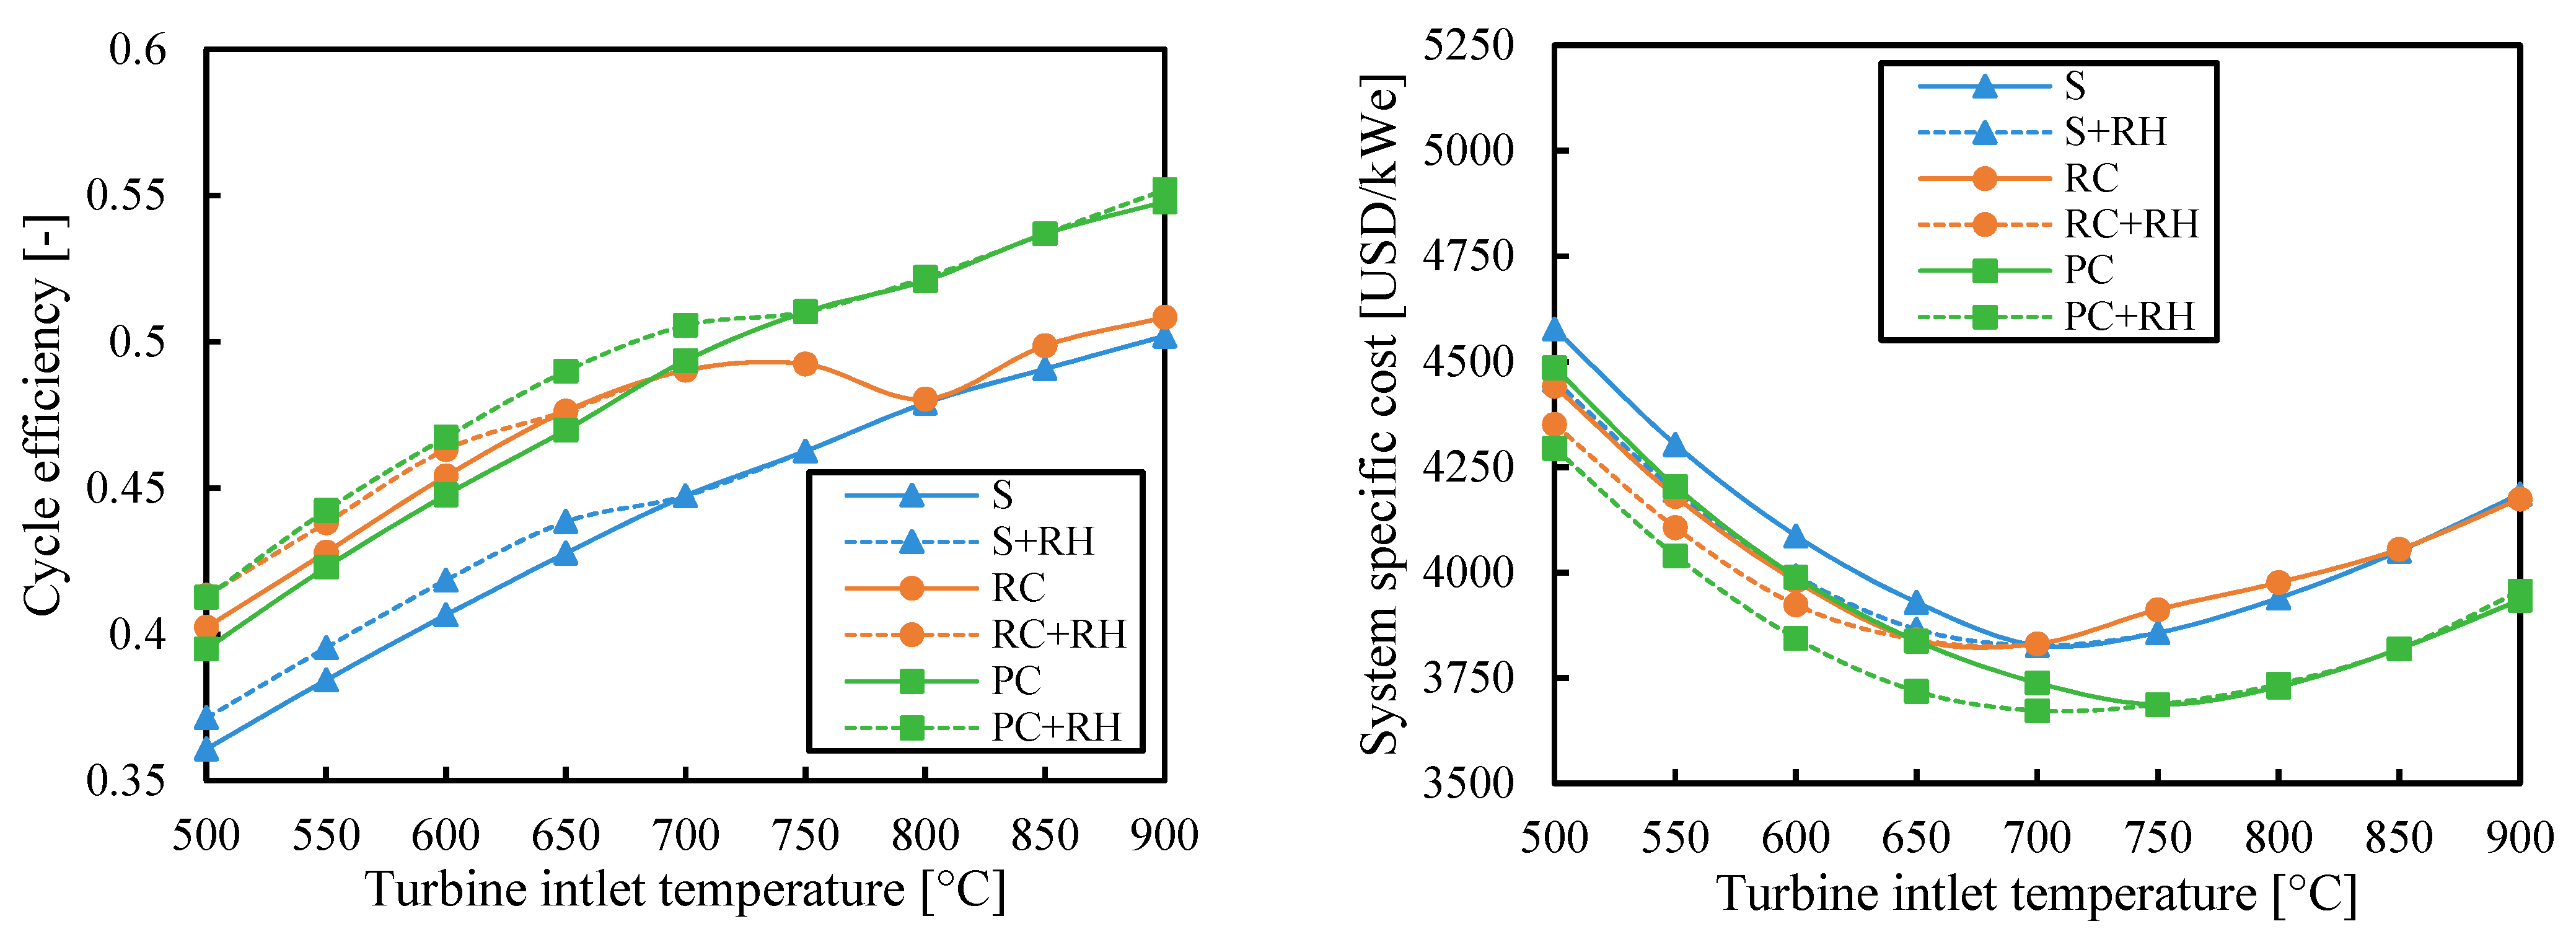
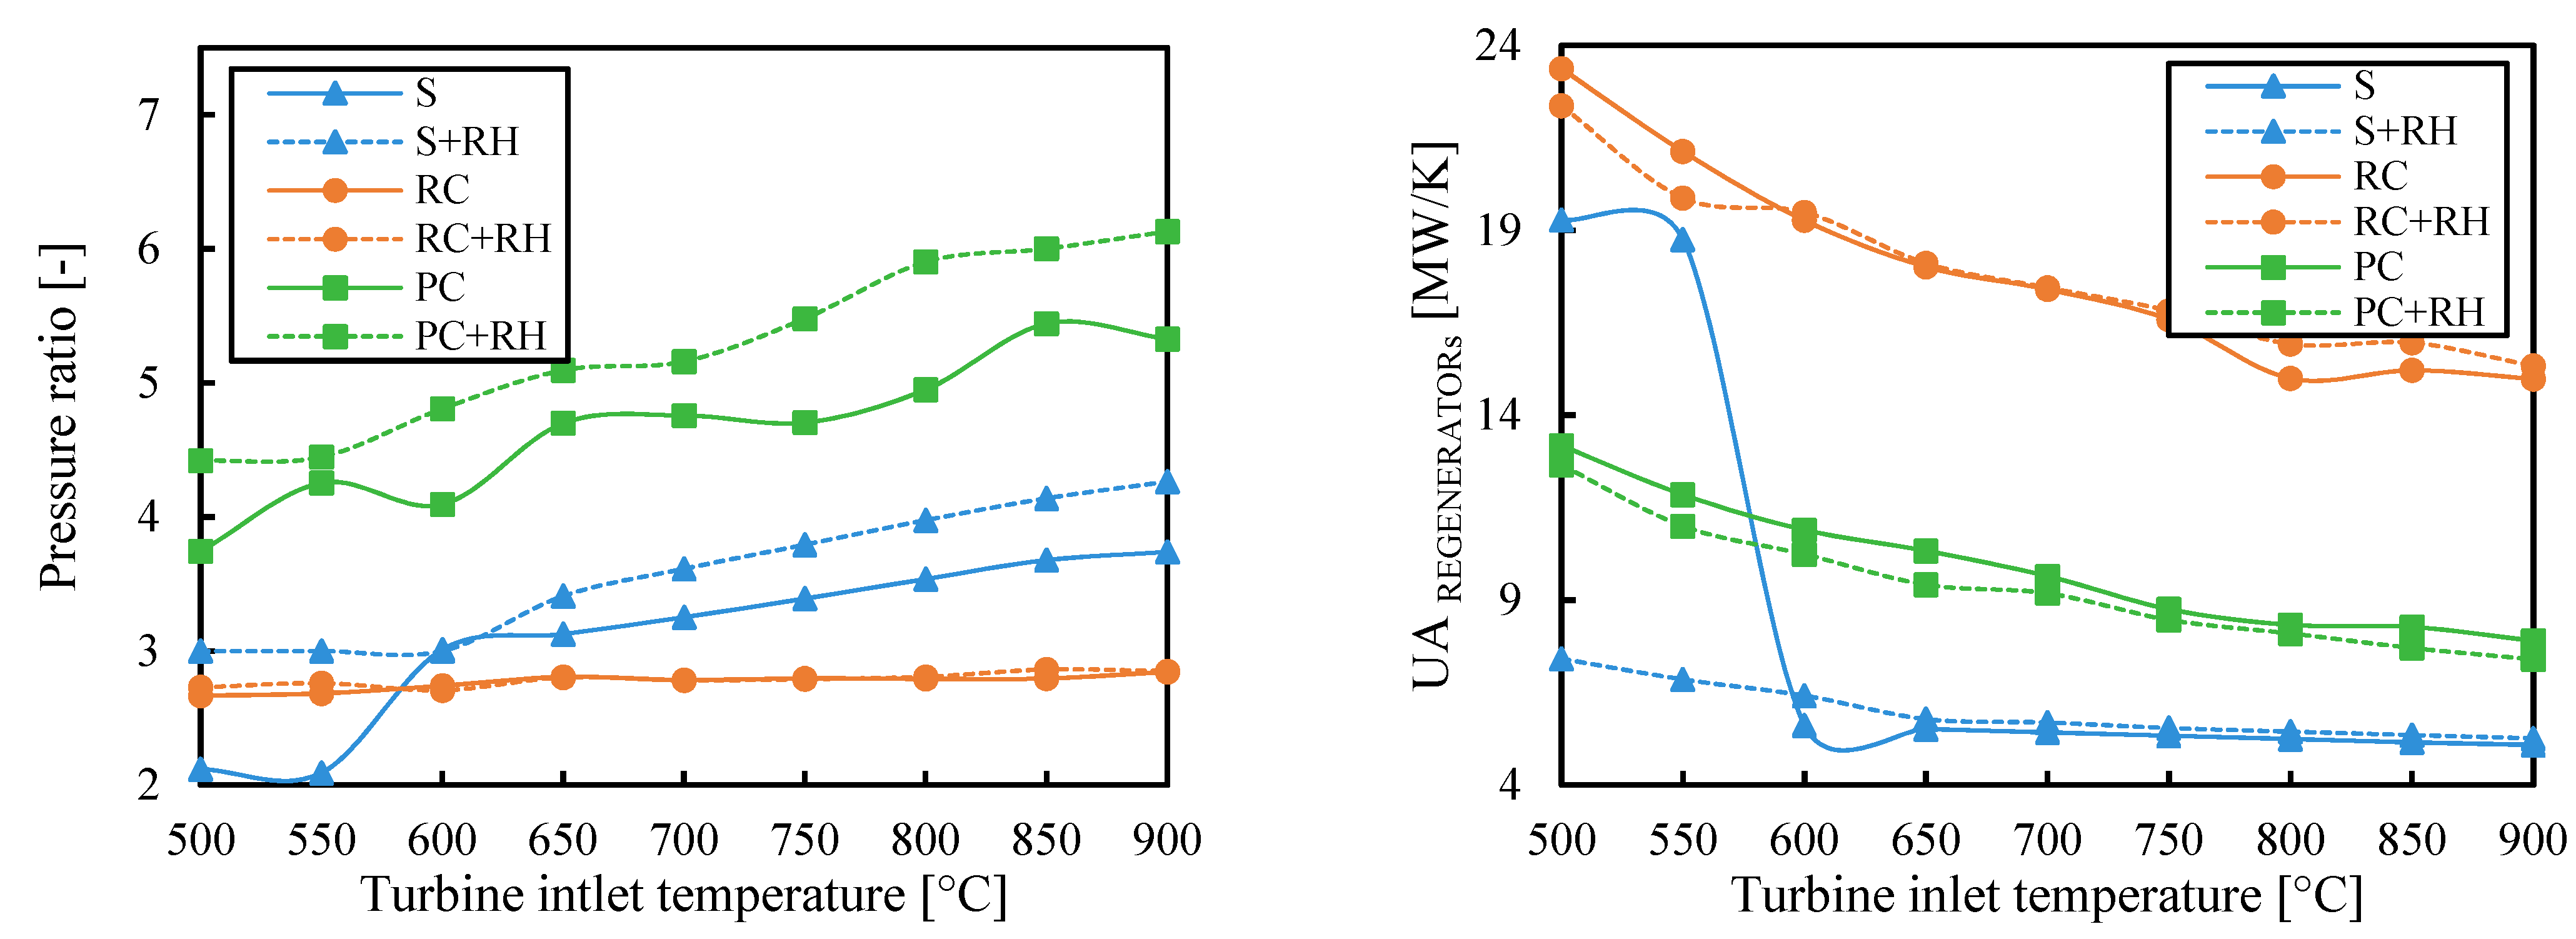
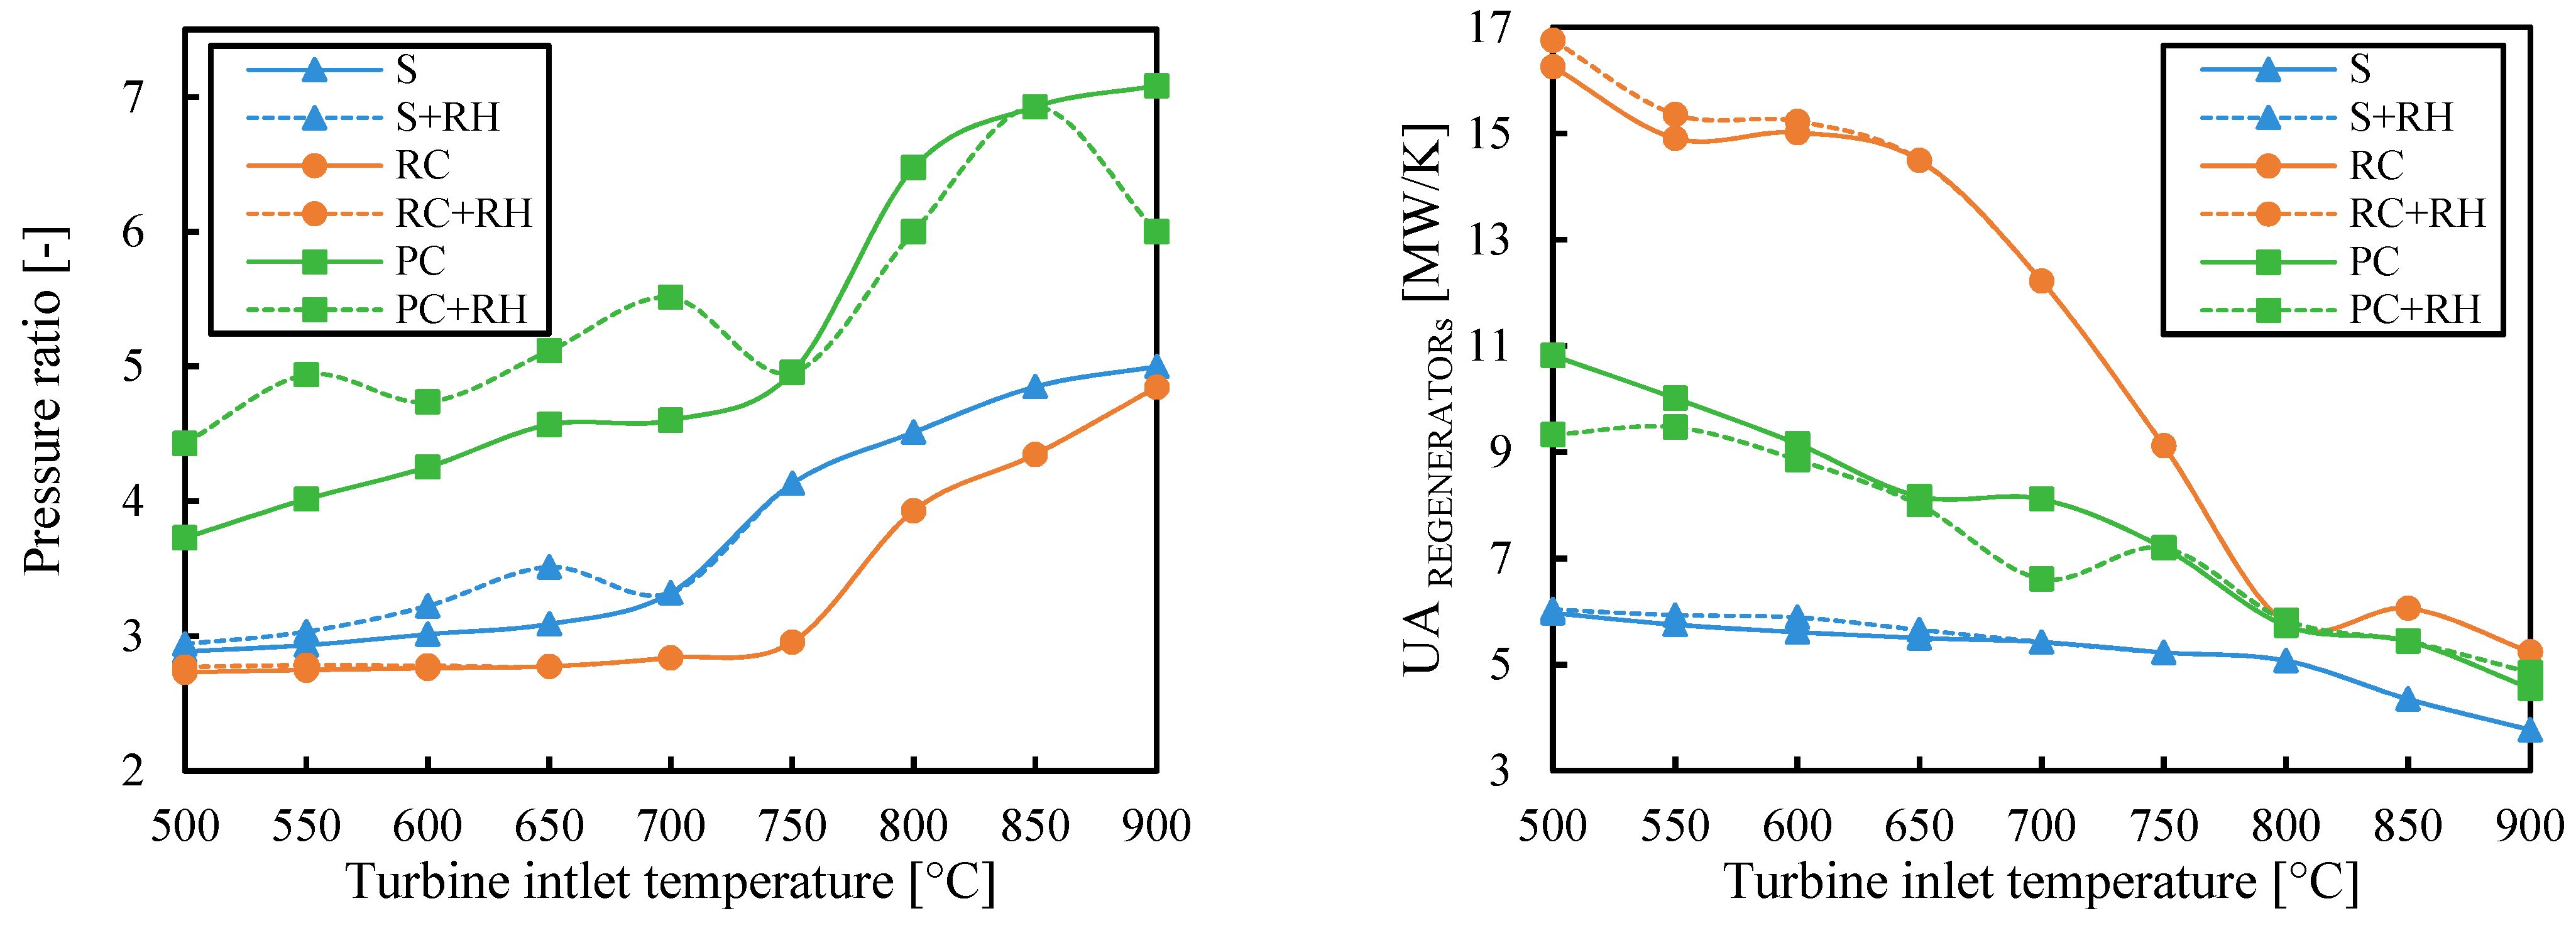
3.1. Turbine Inlet Temperature
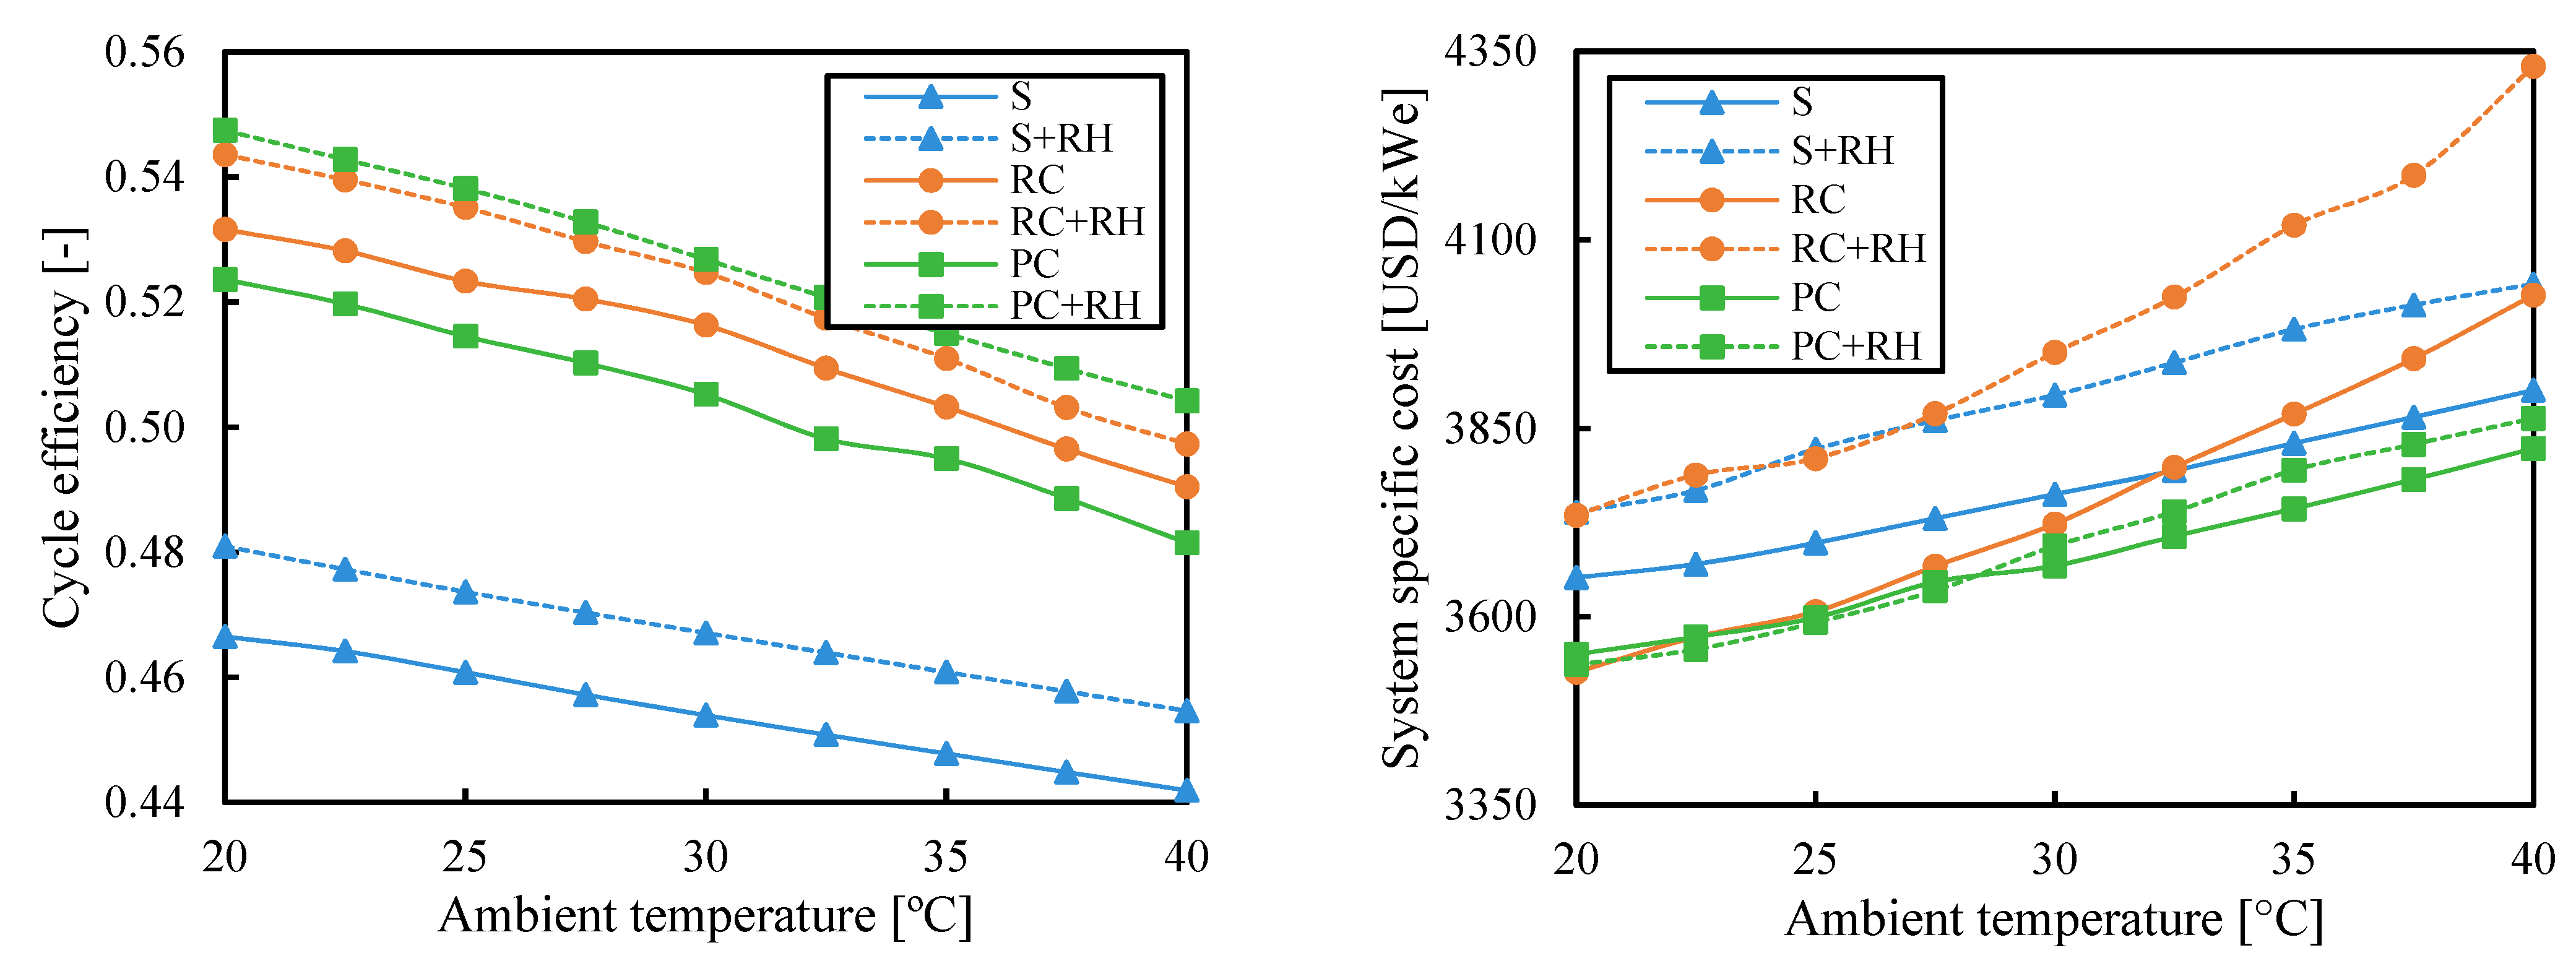
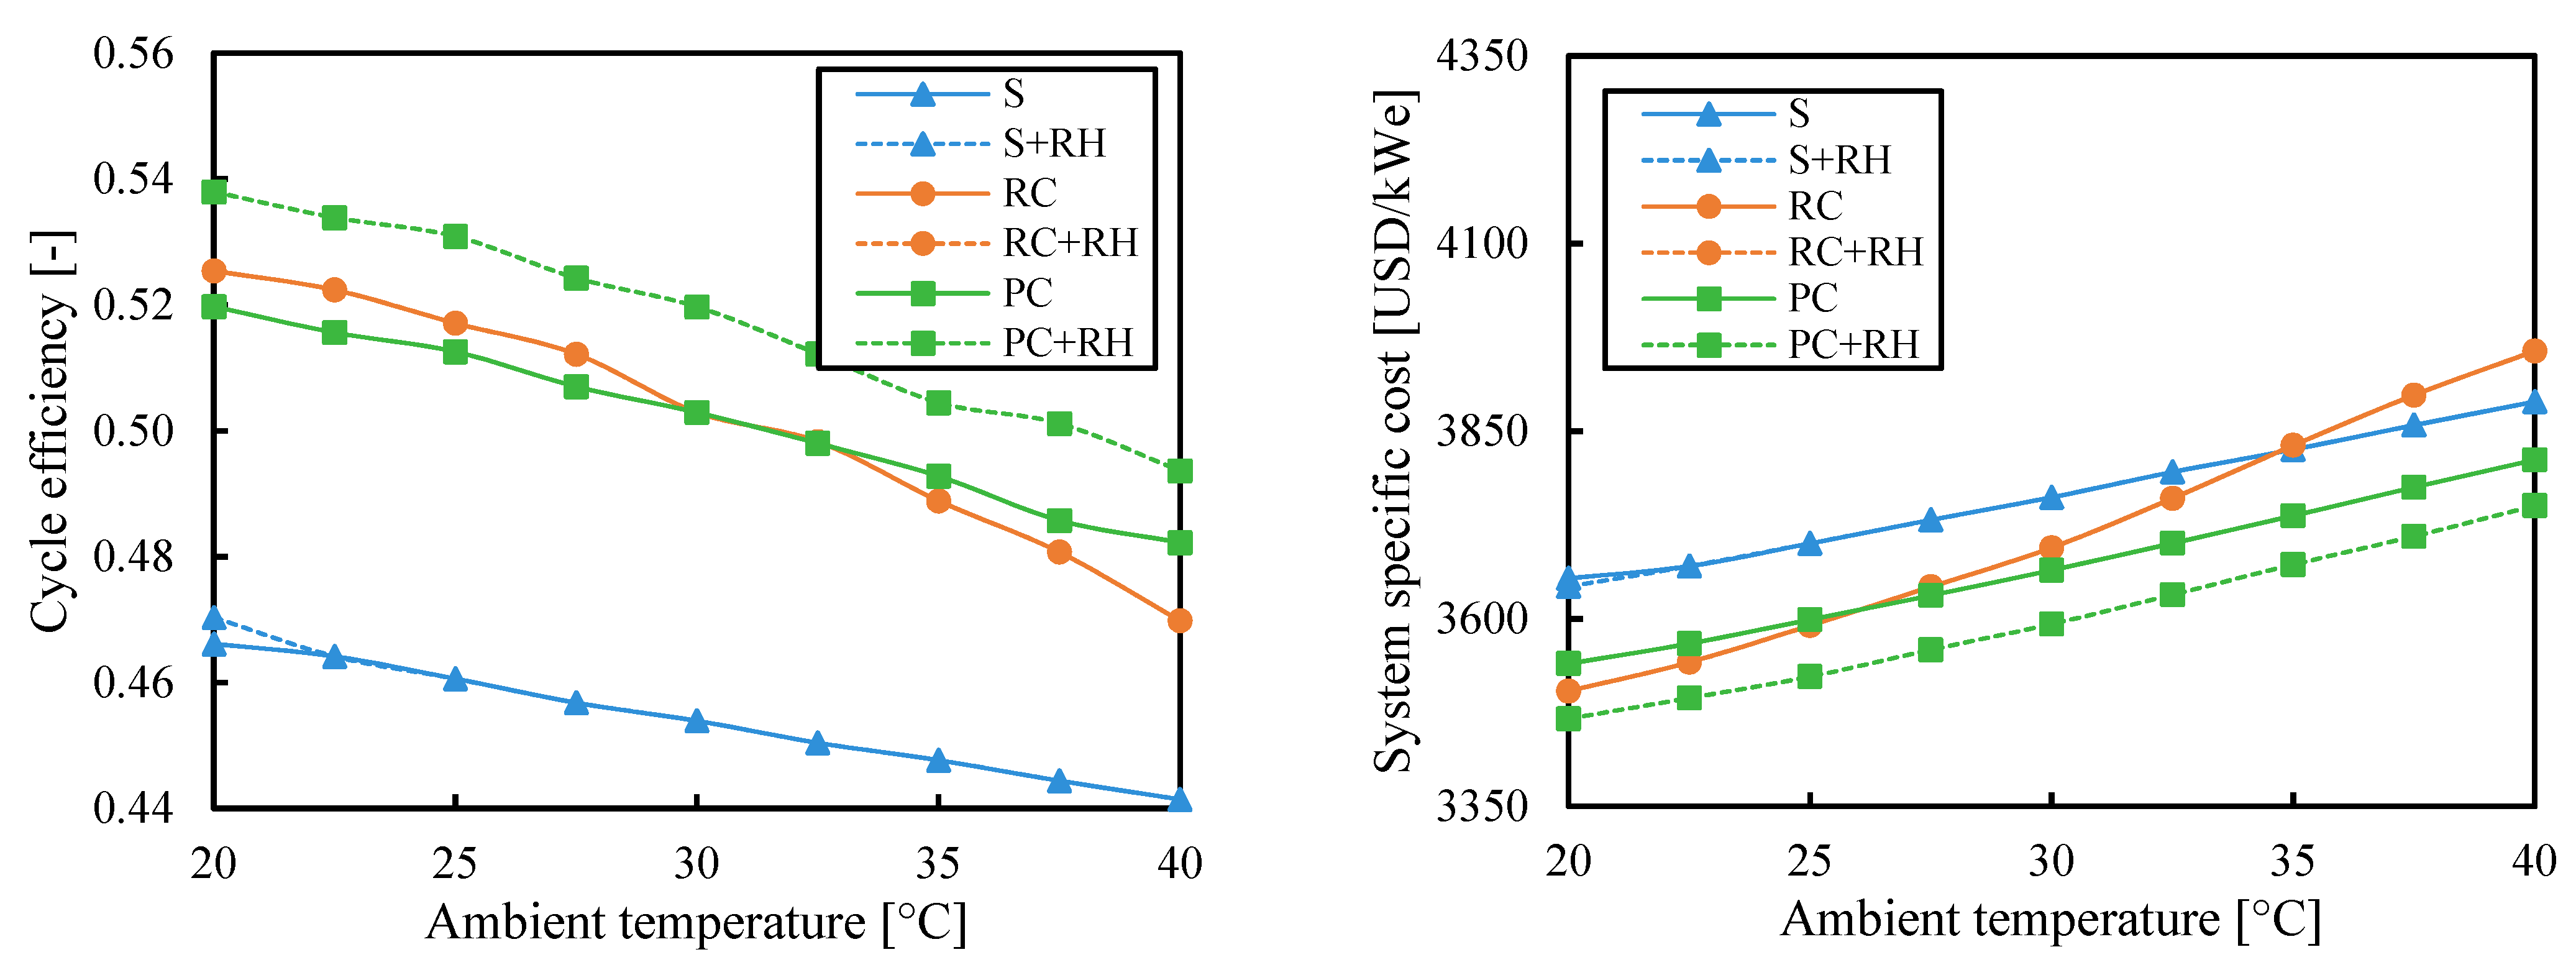
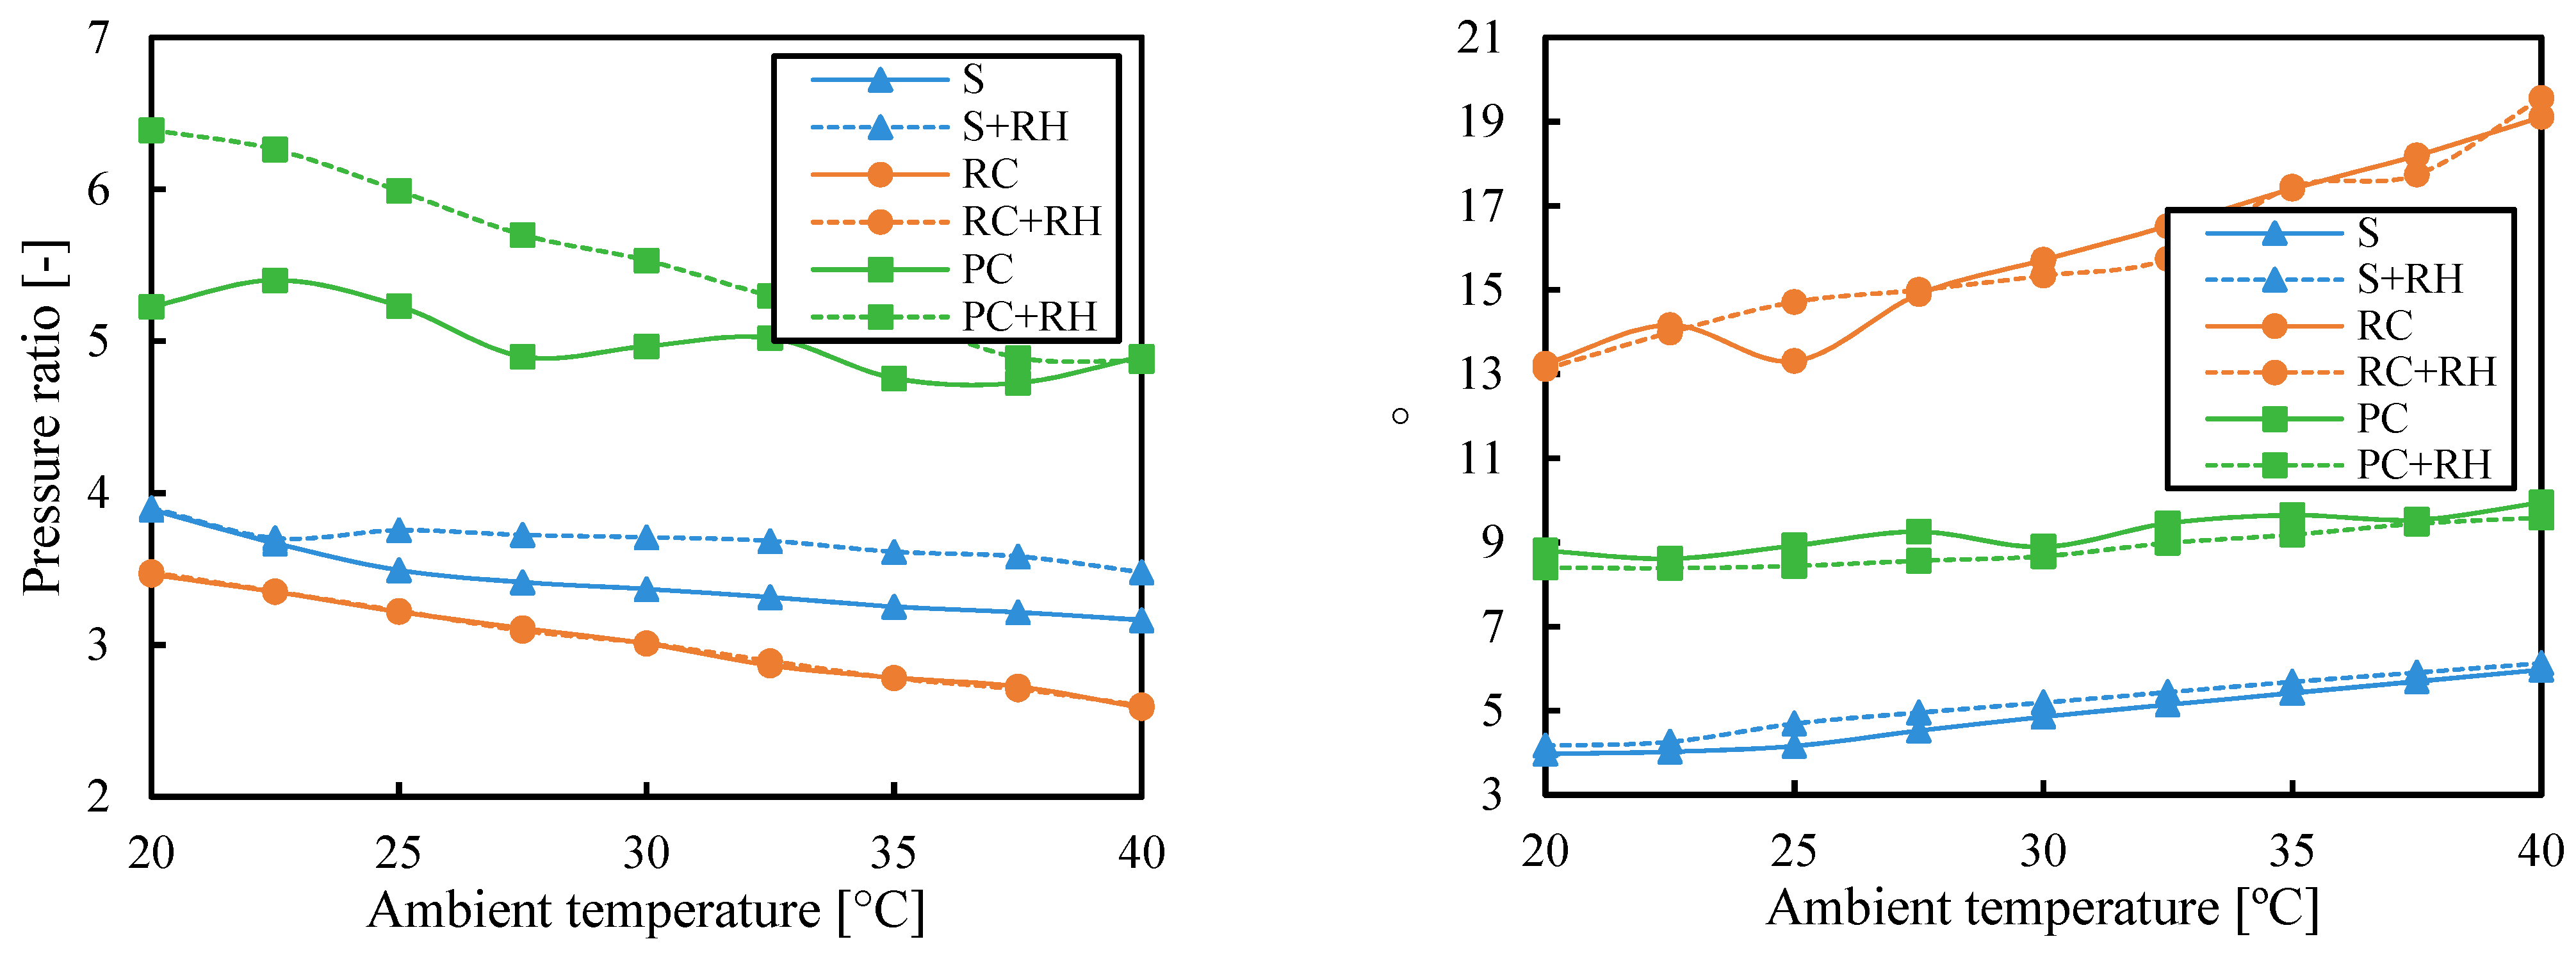
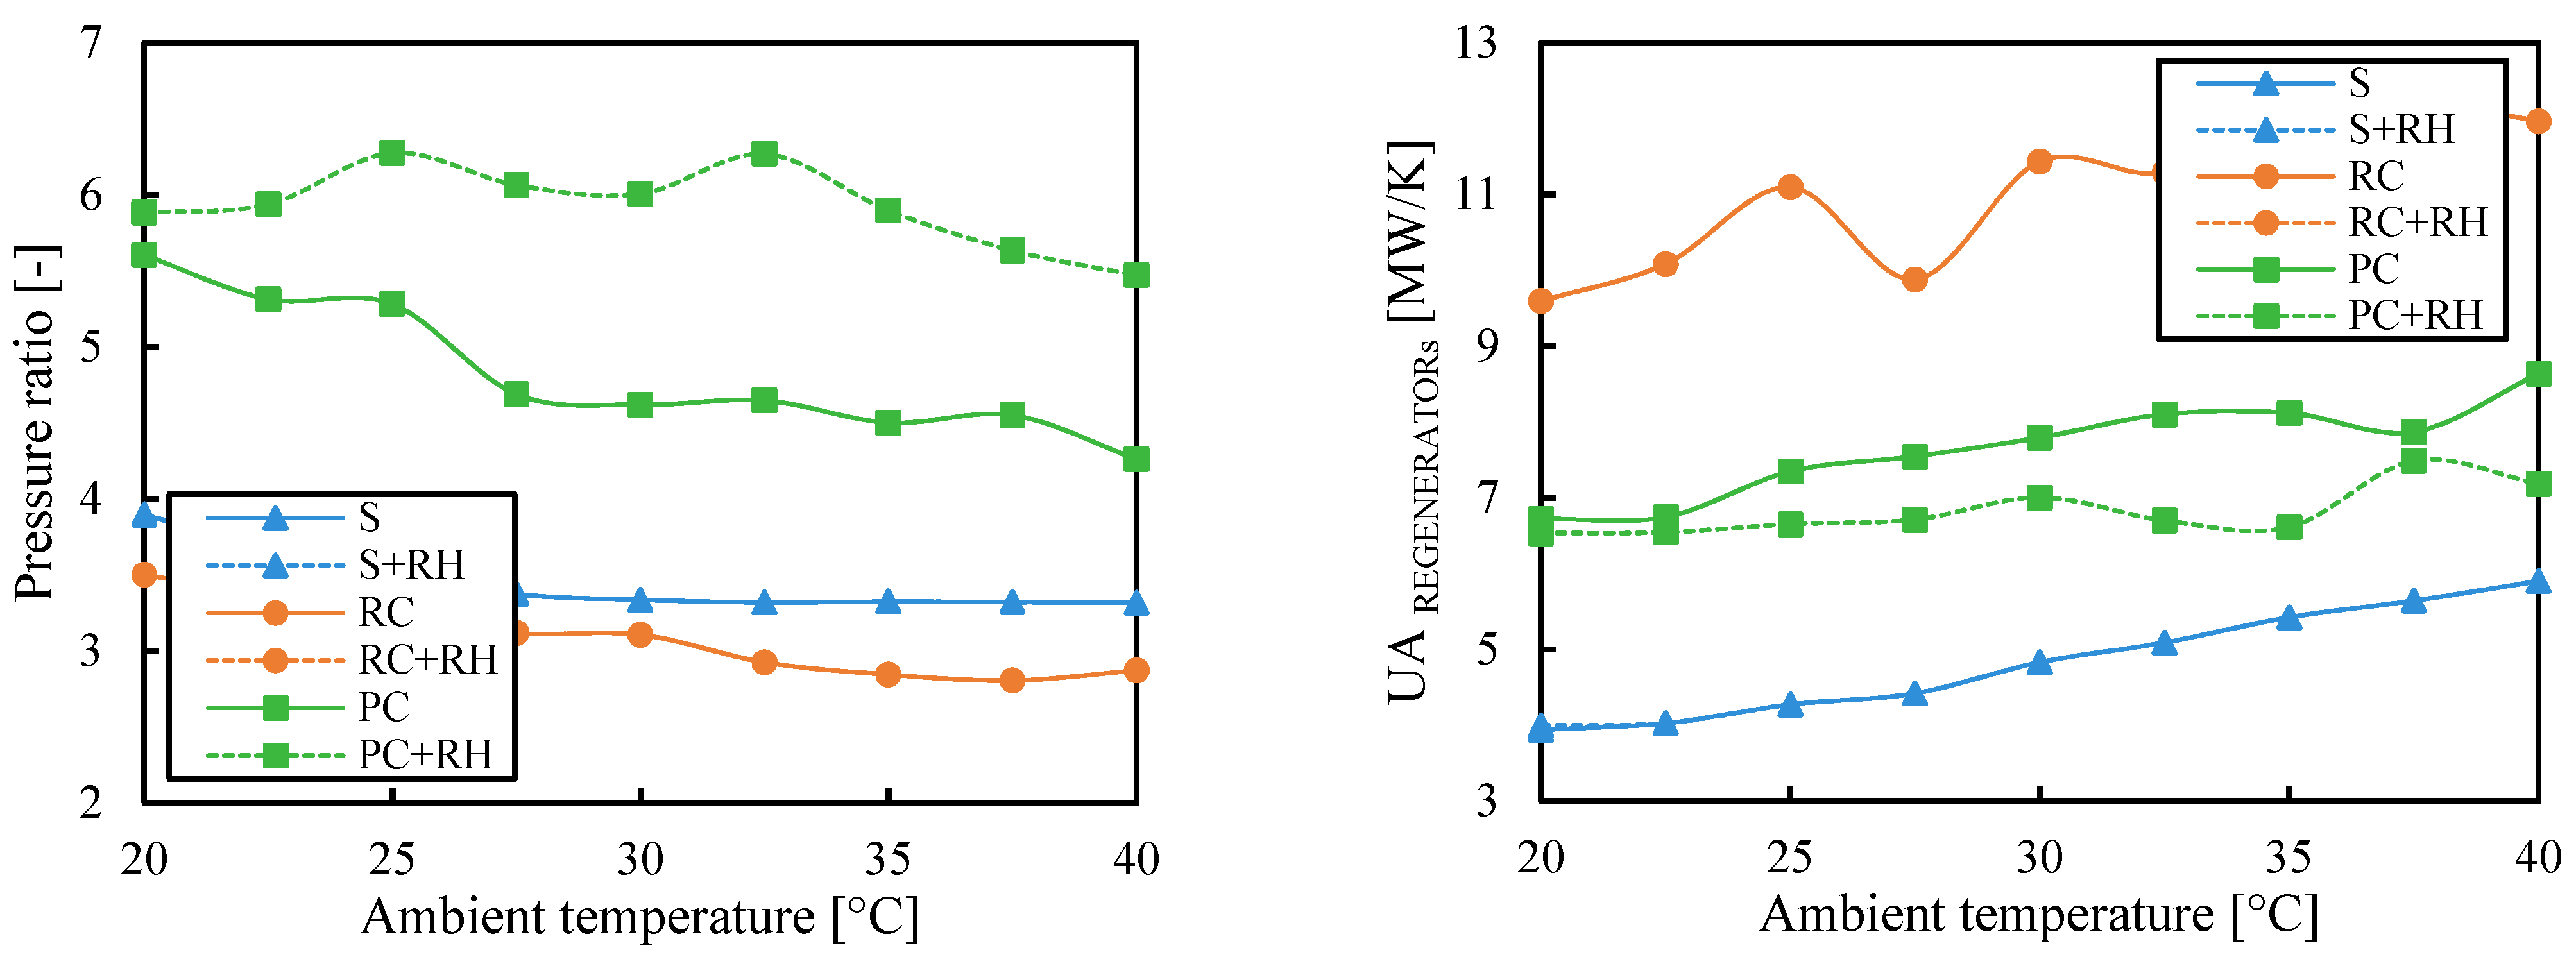
3.2. Ambient Temperature
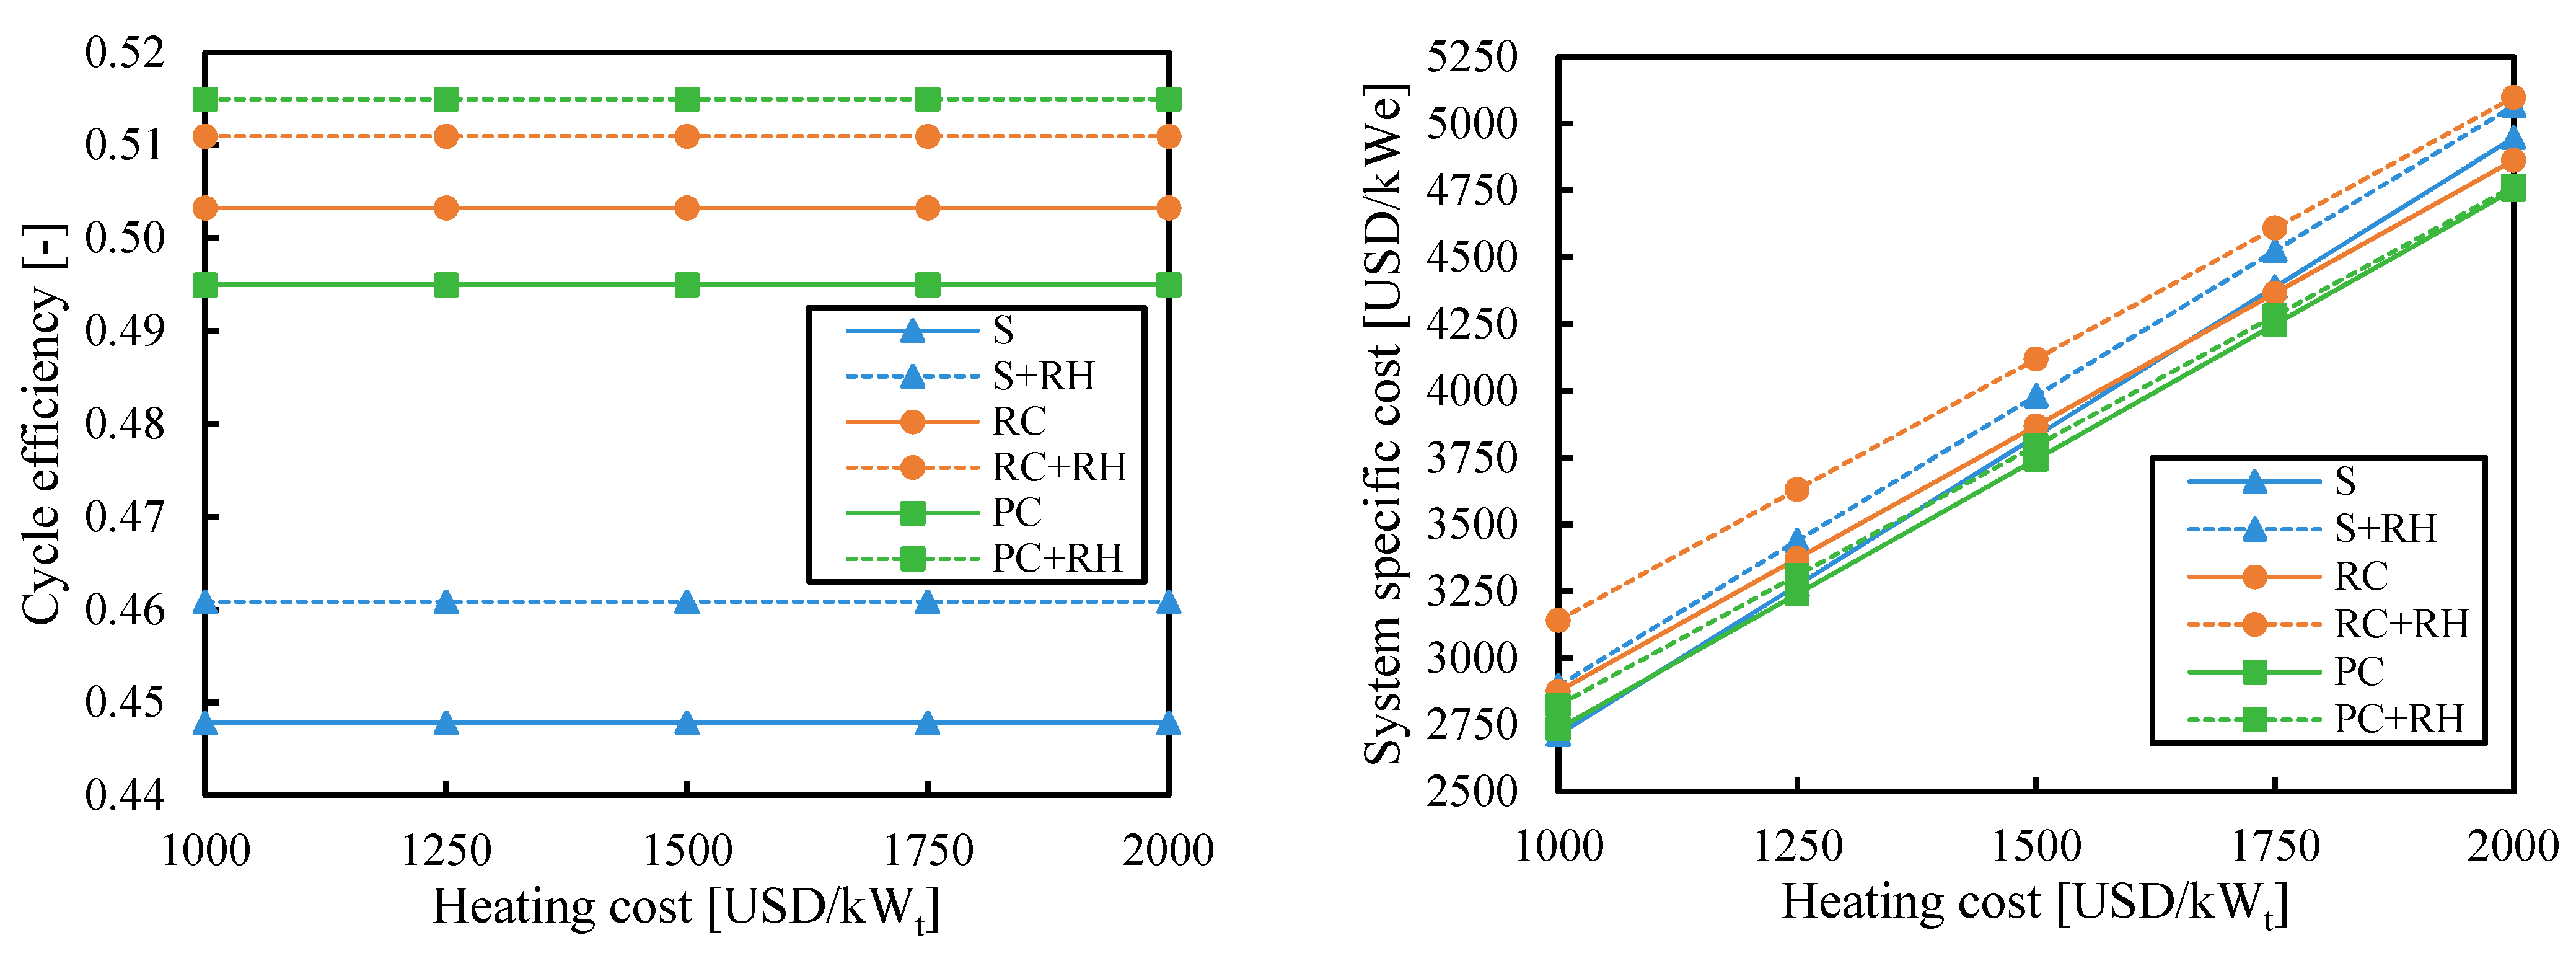
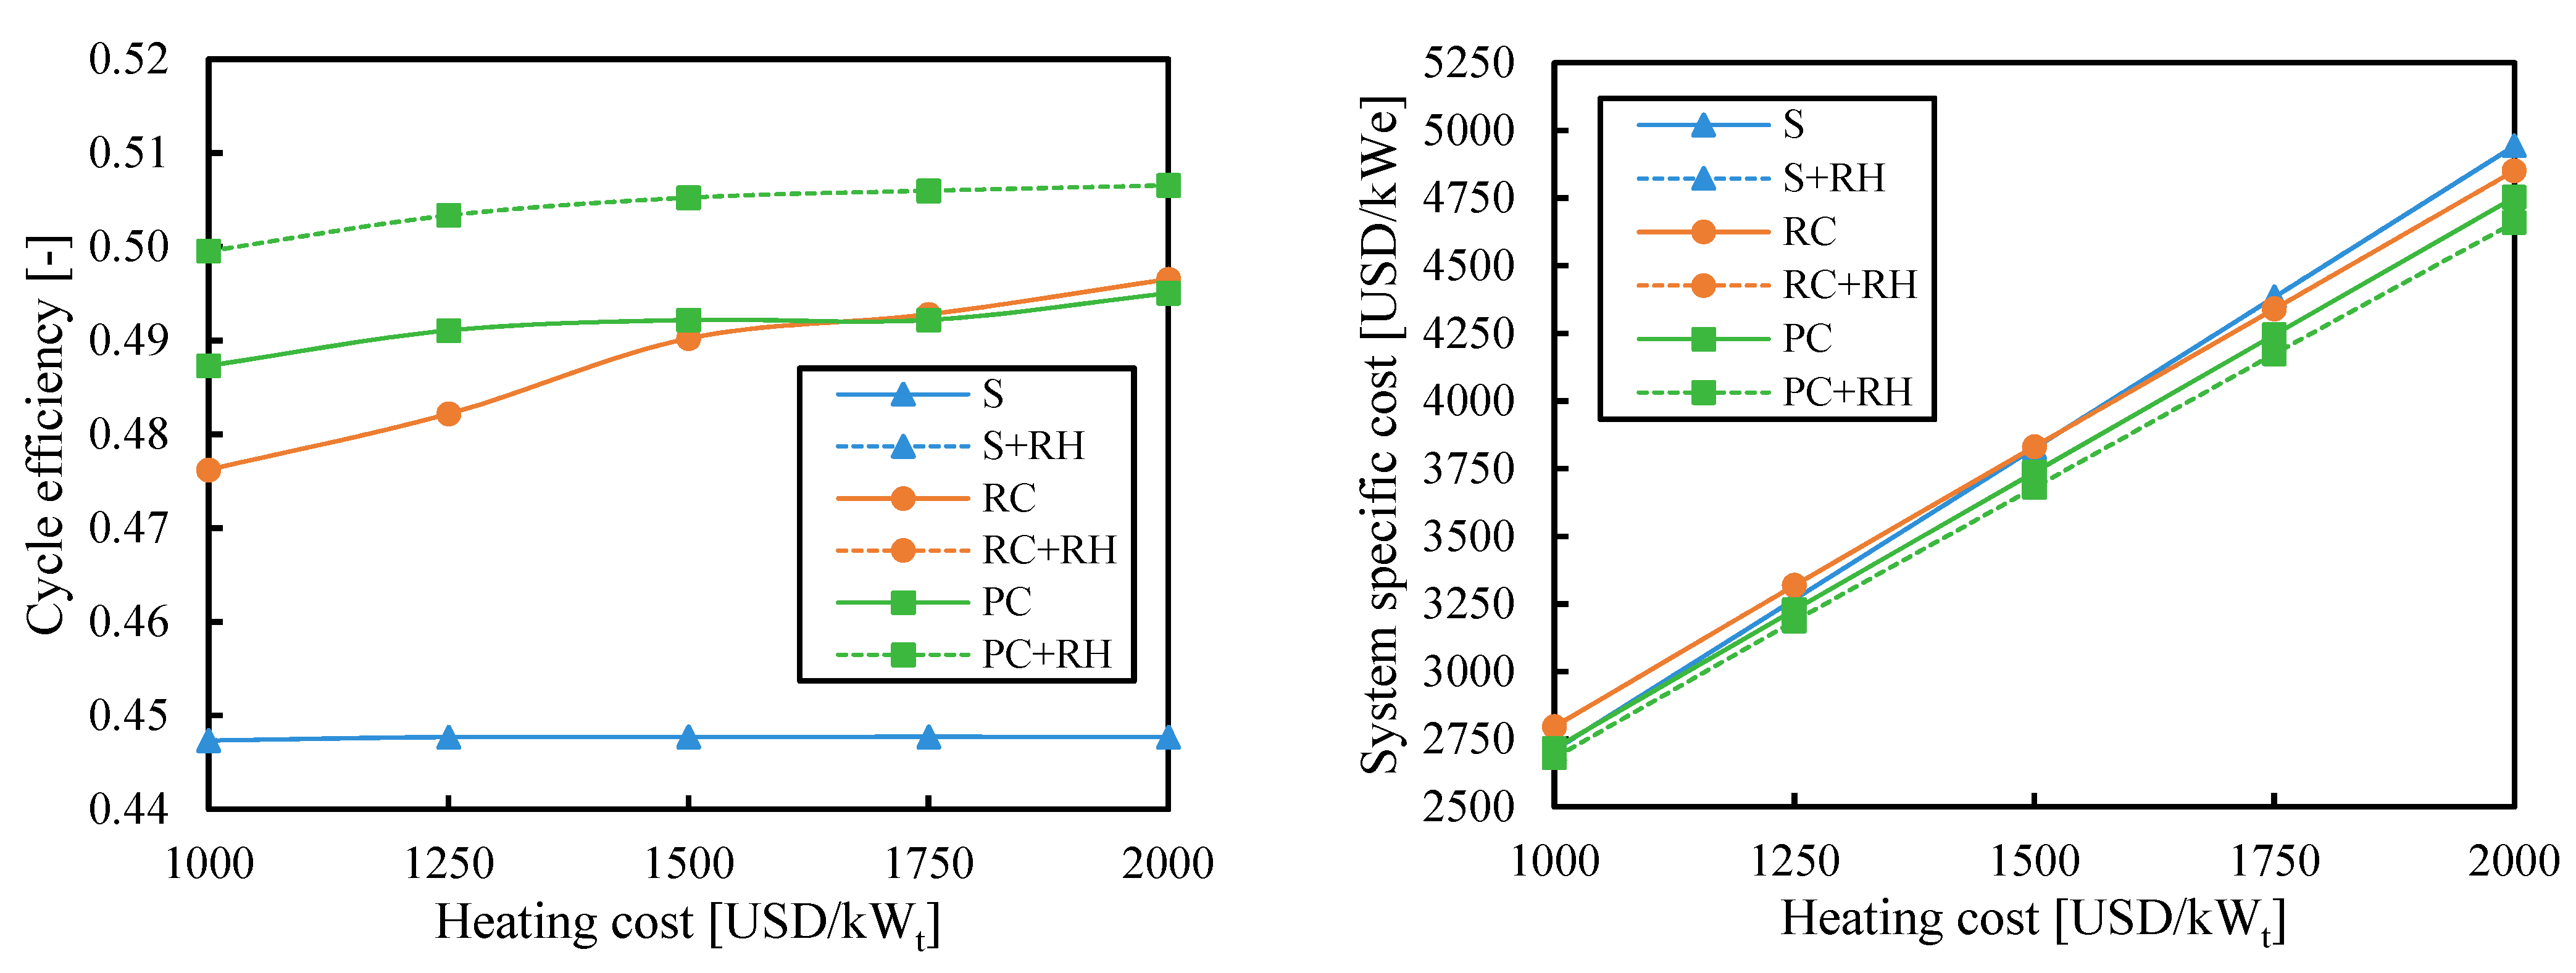
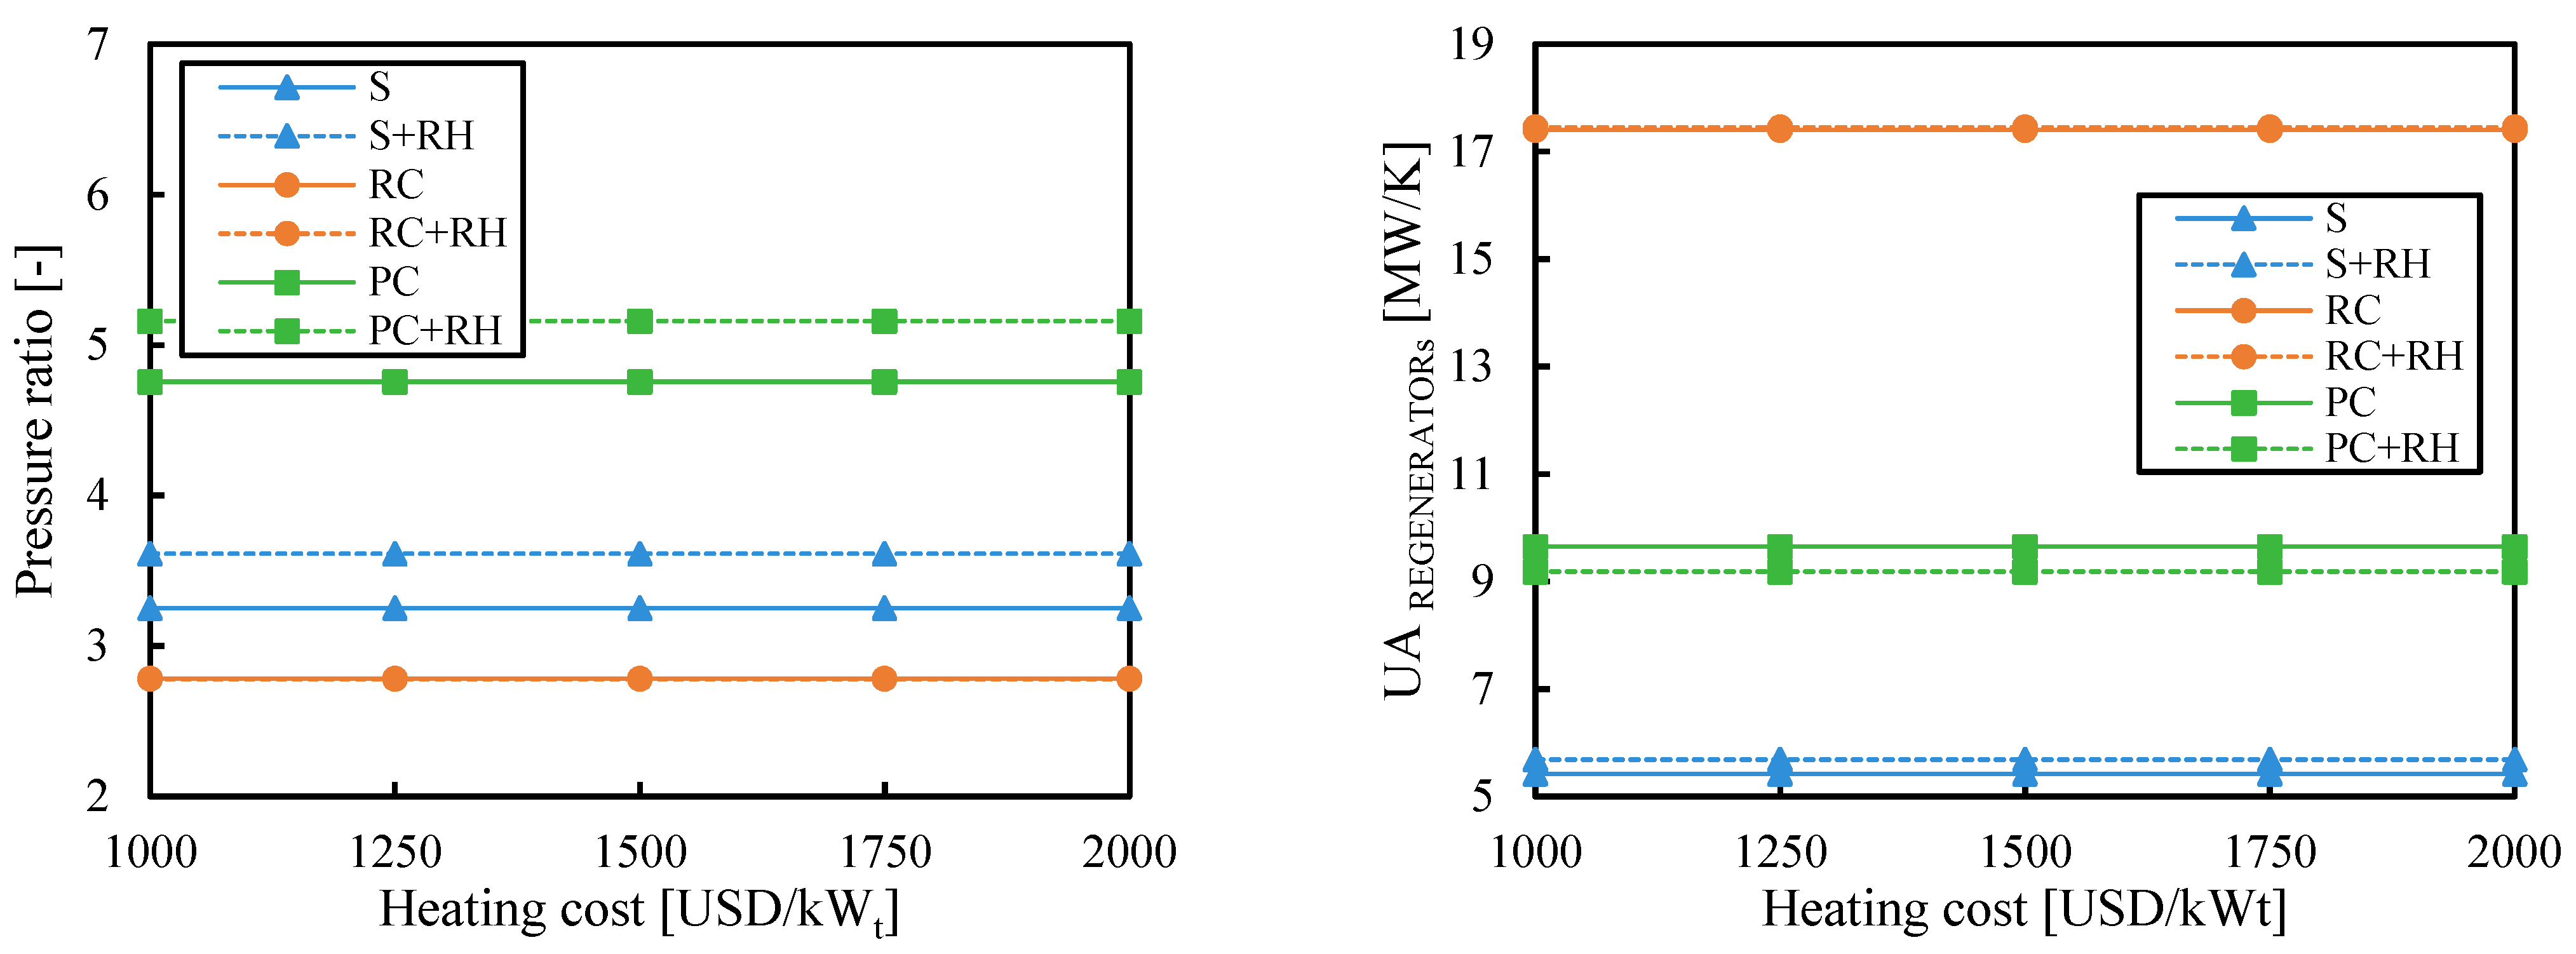
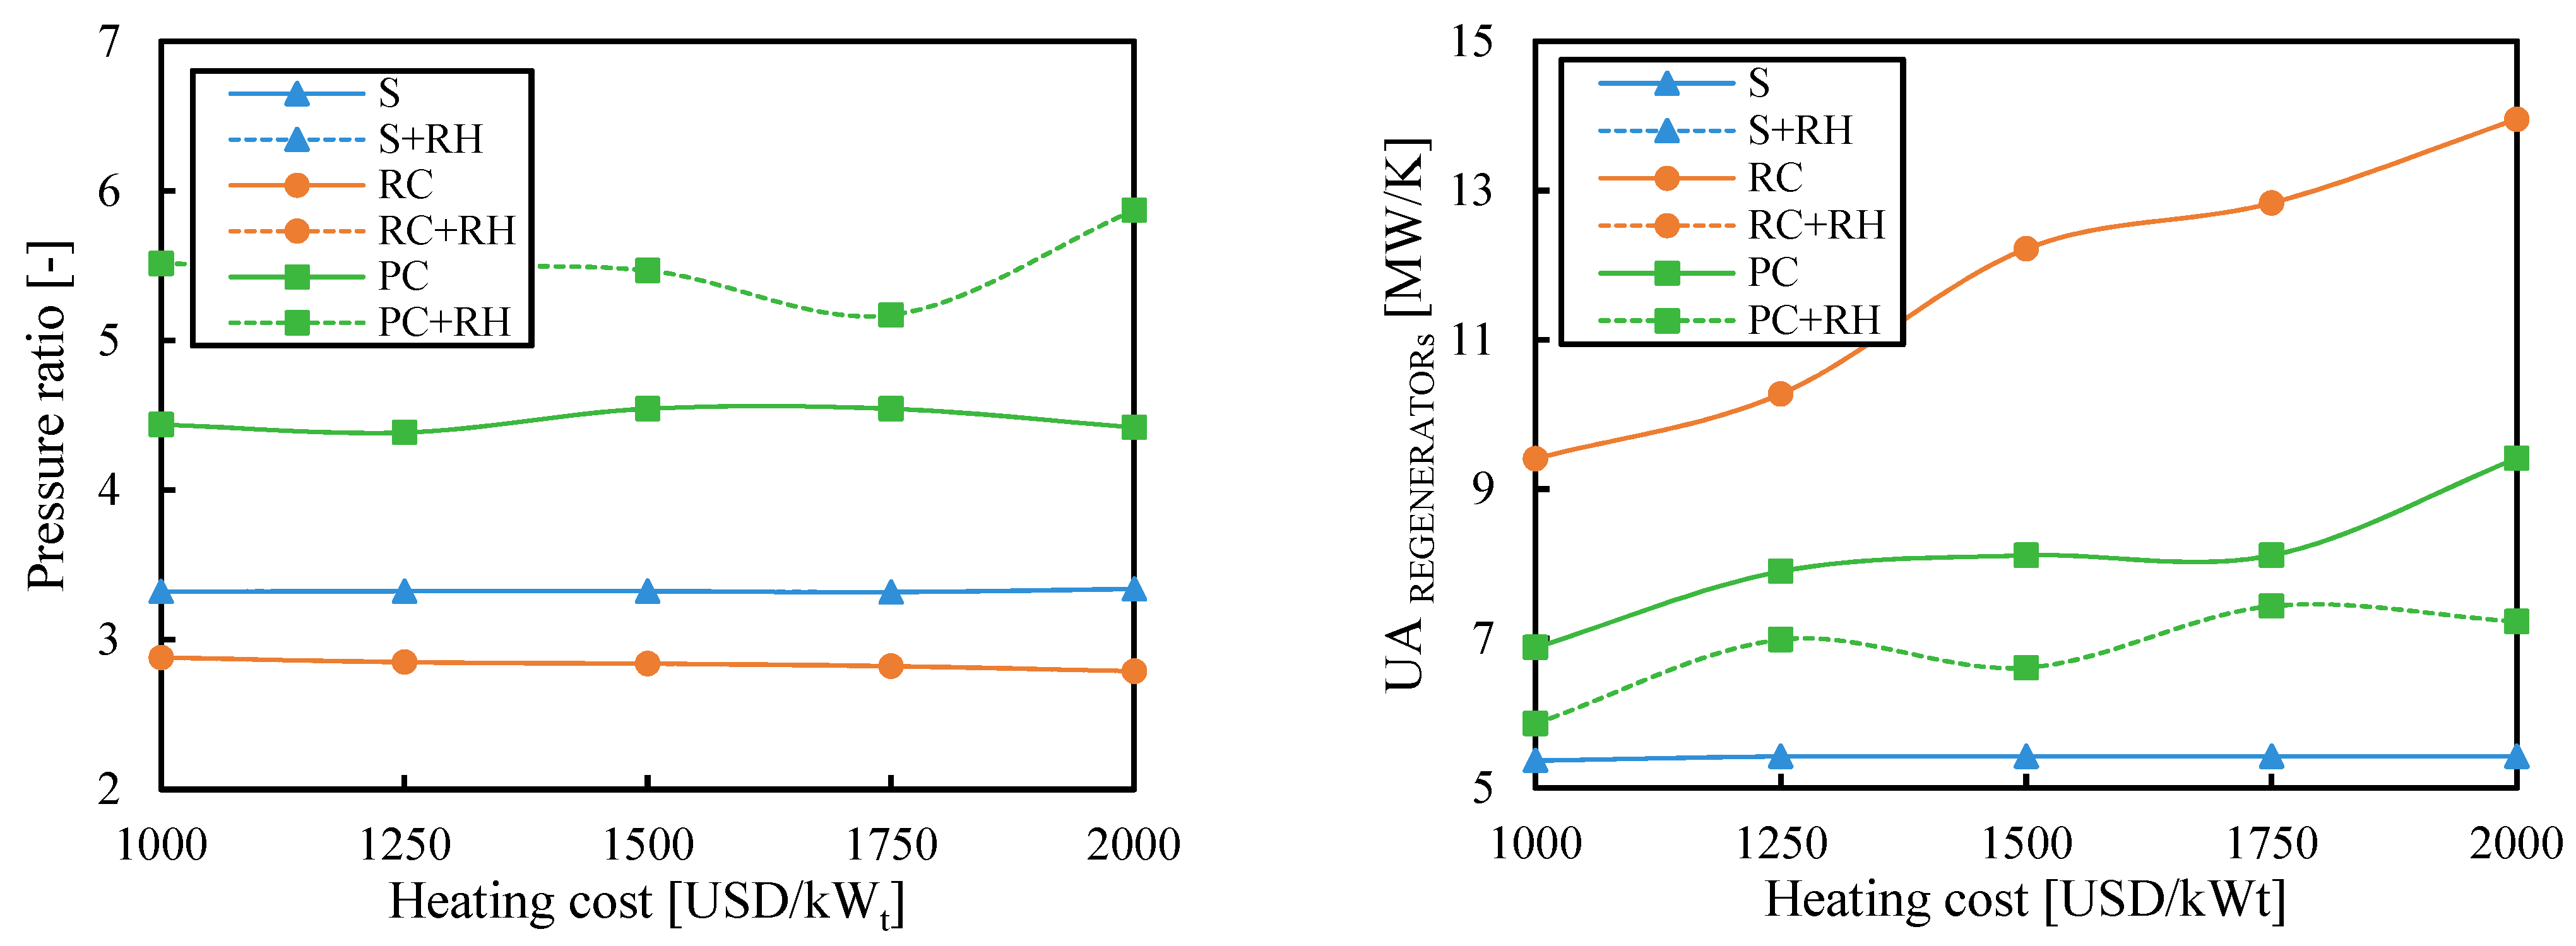
3.3. Heating Cost
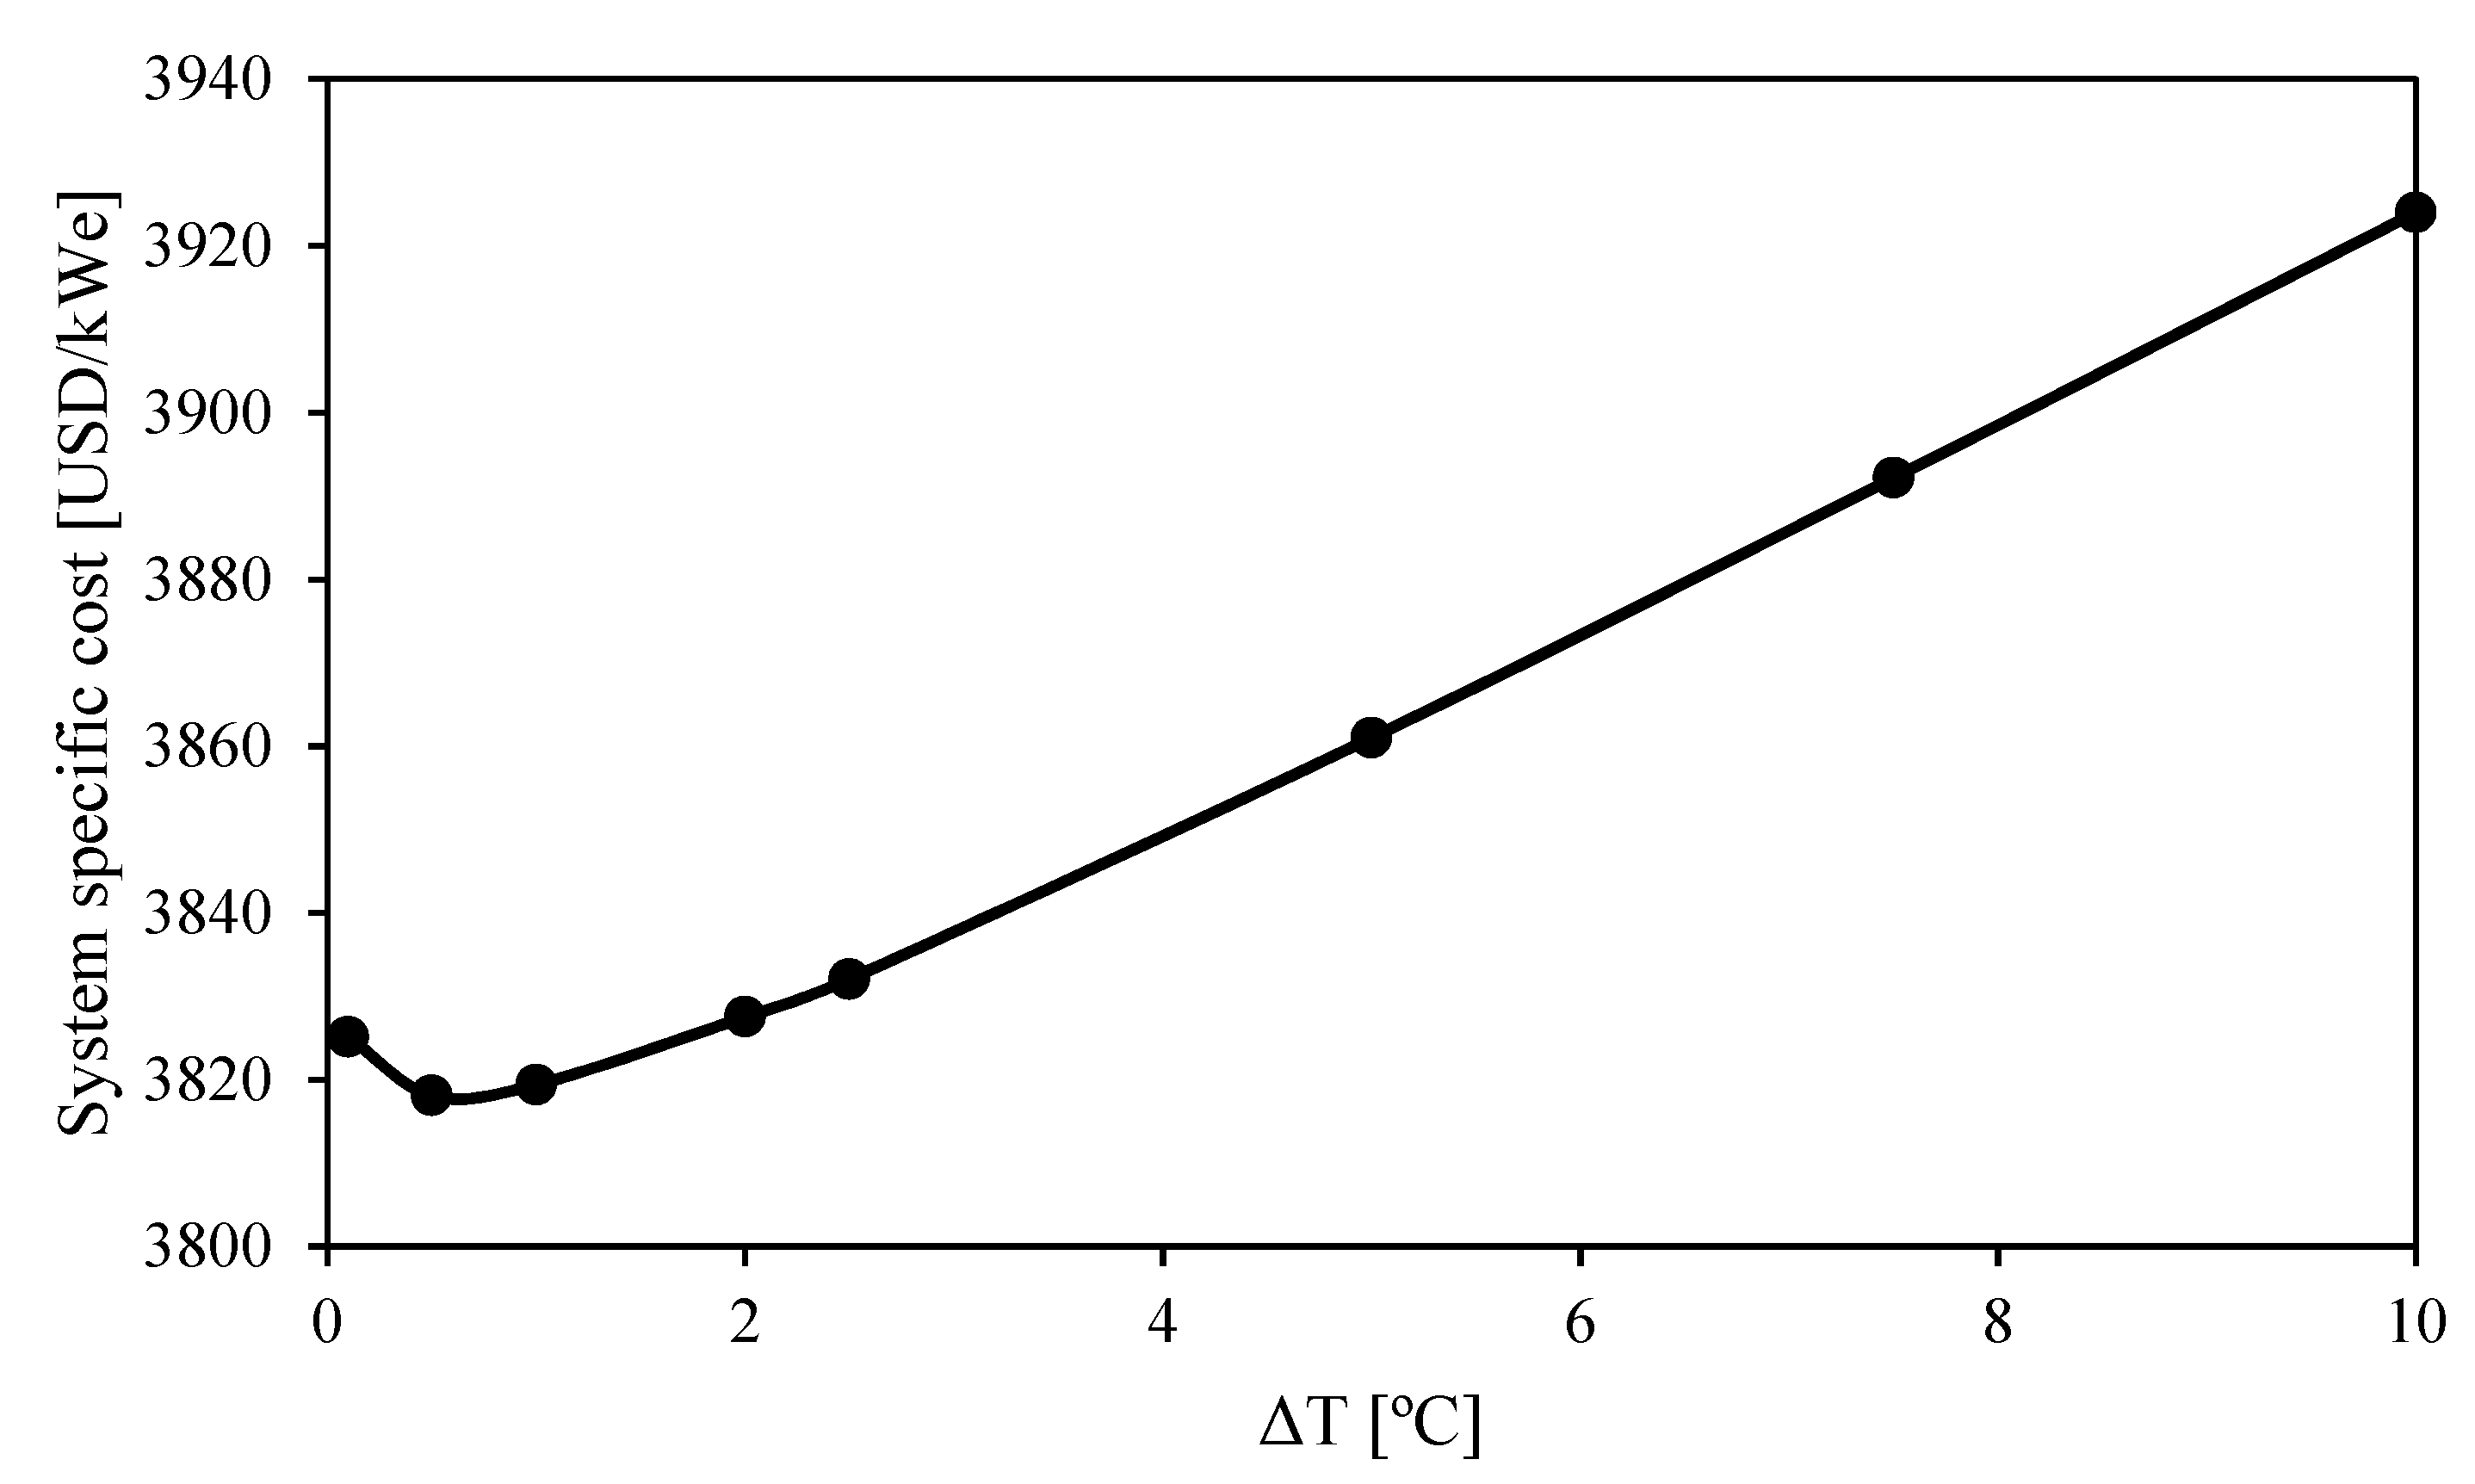
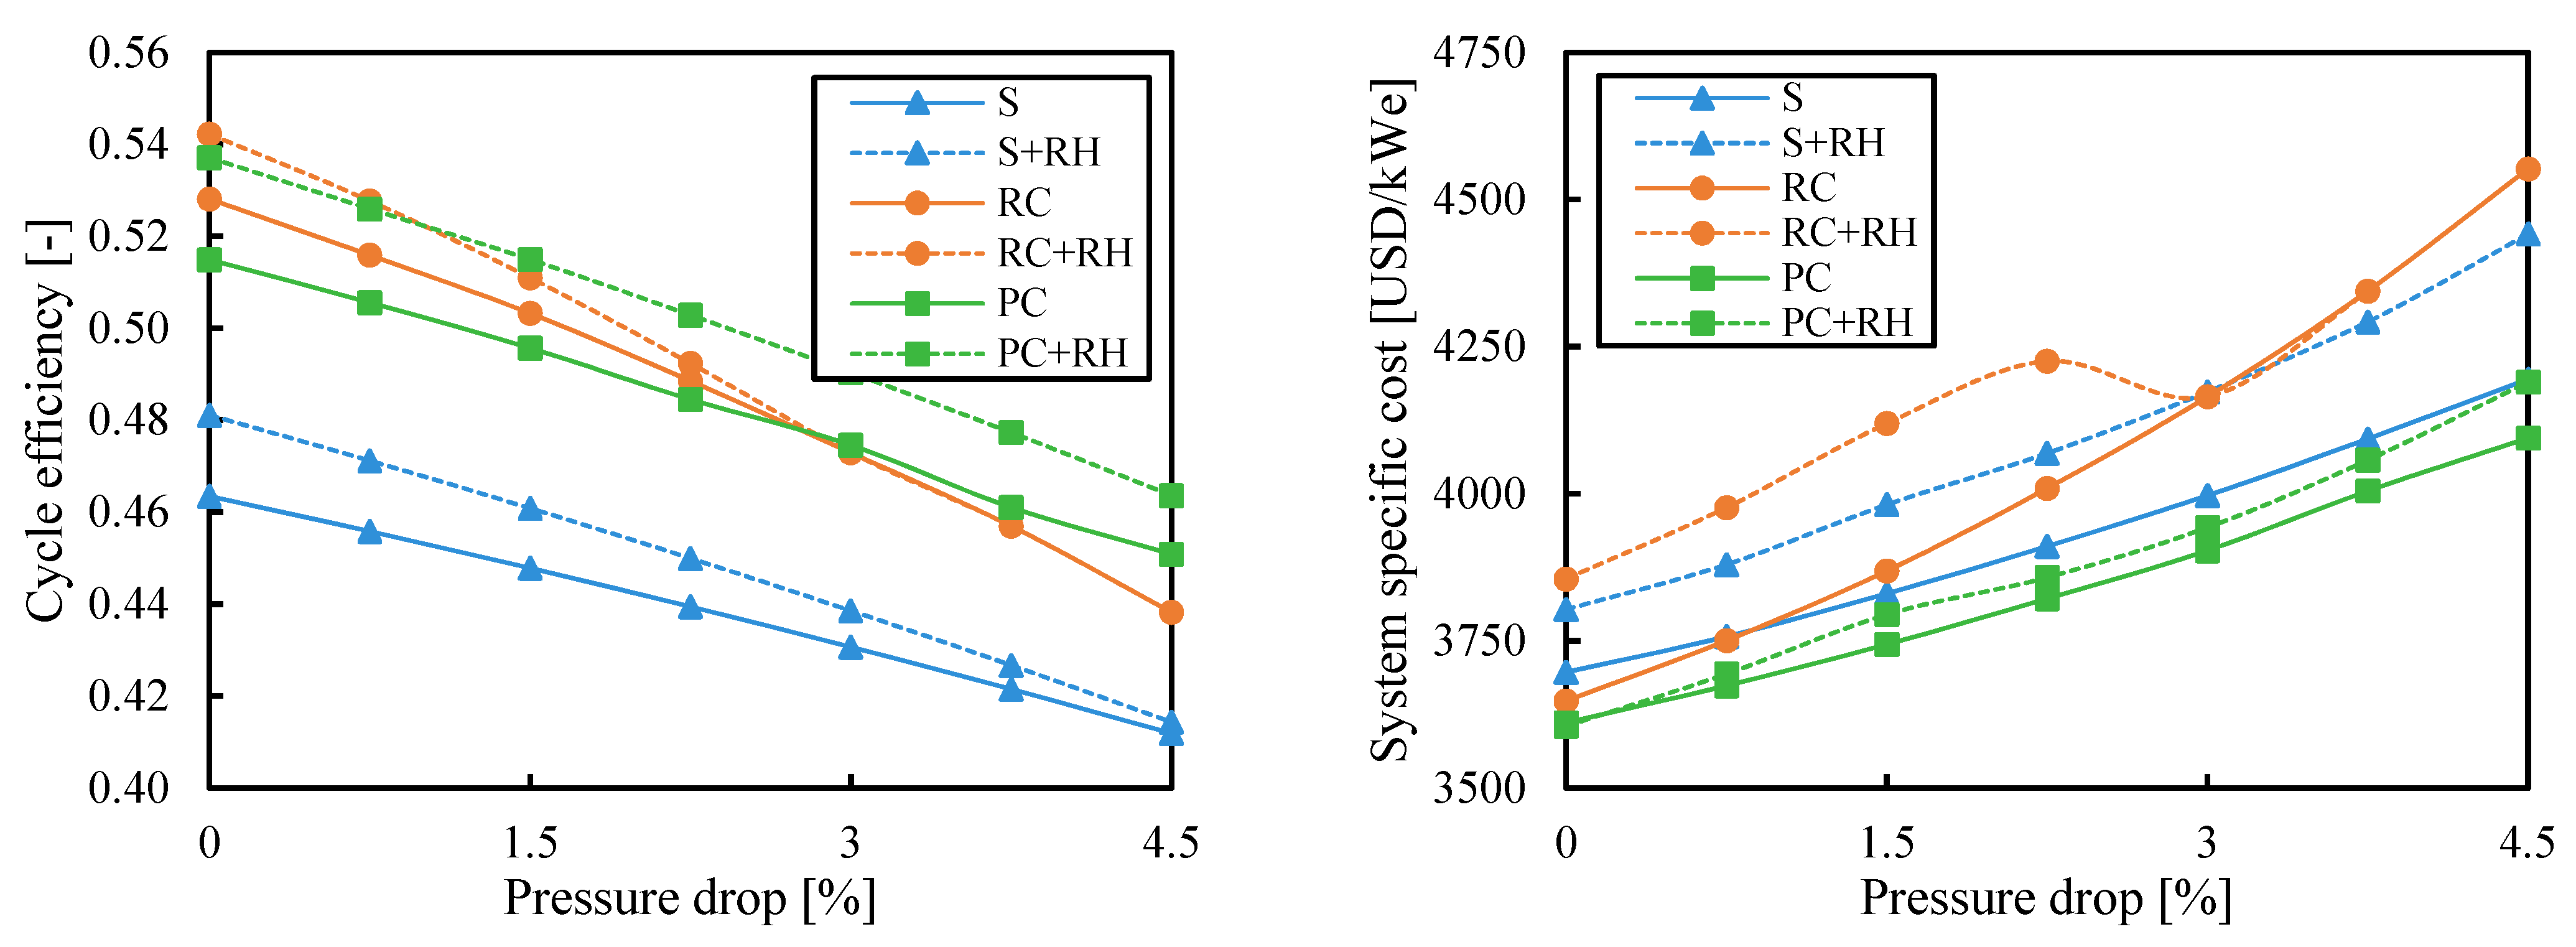
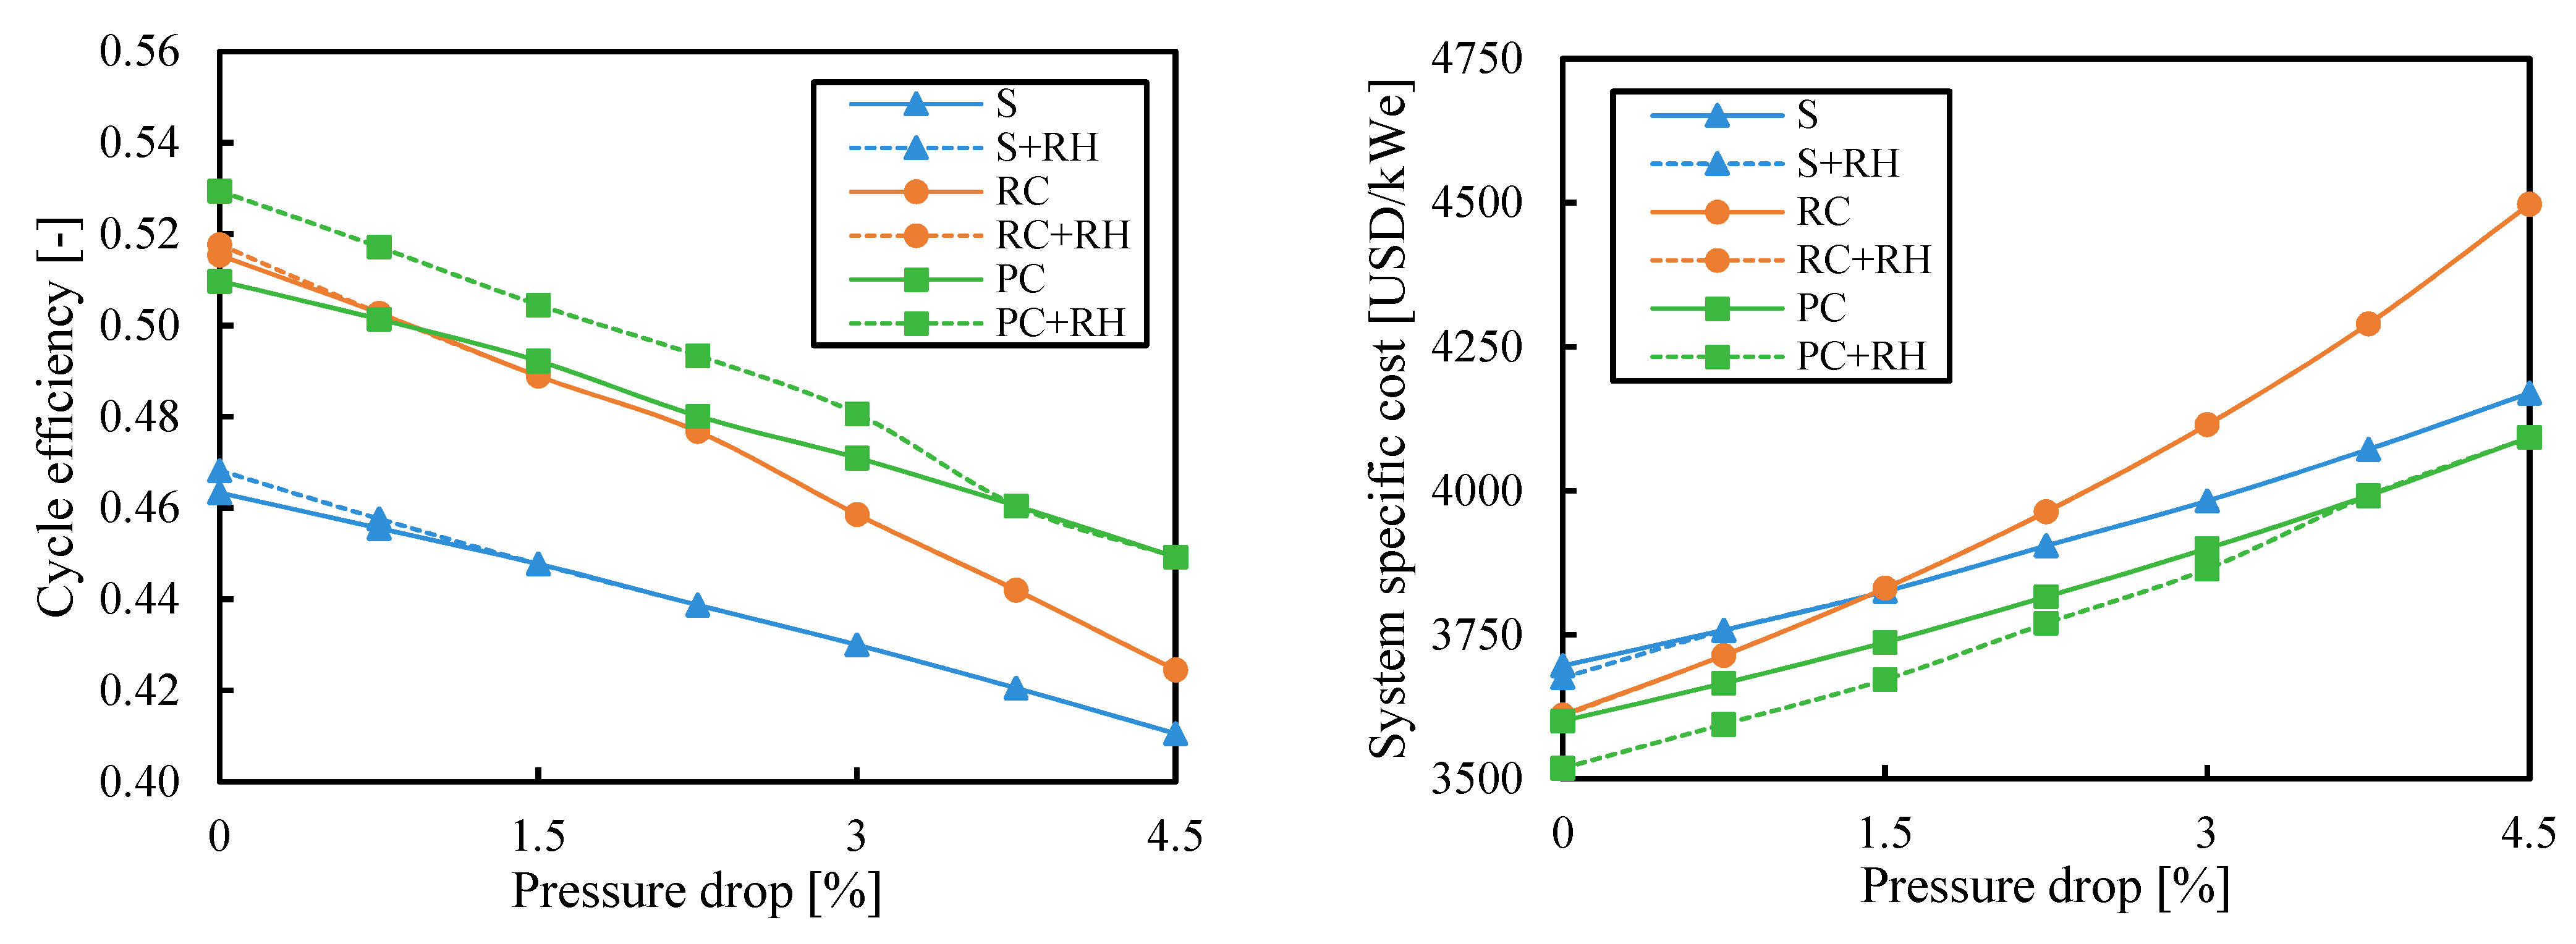
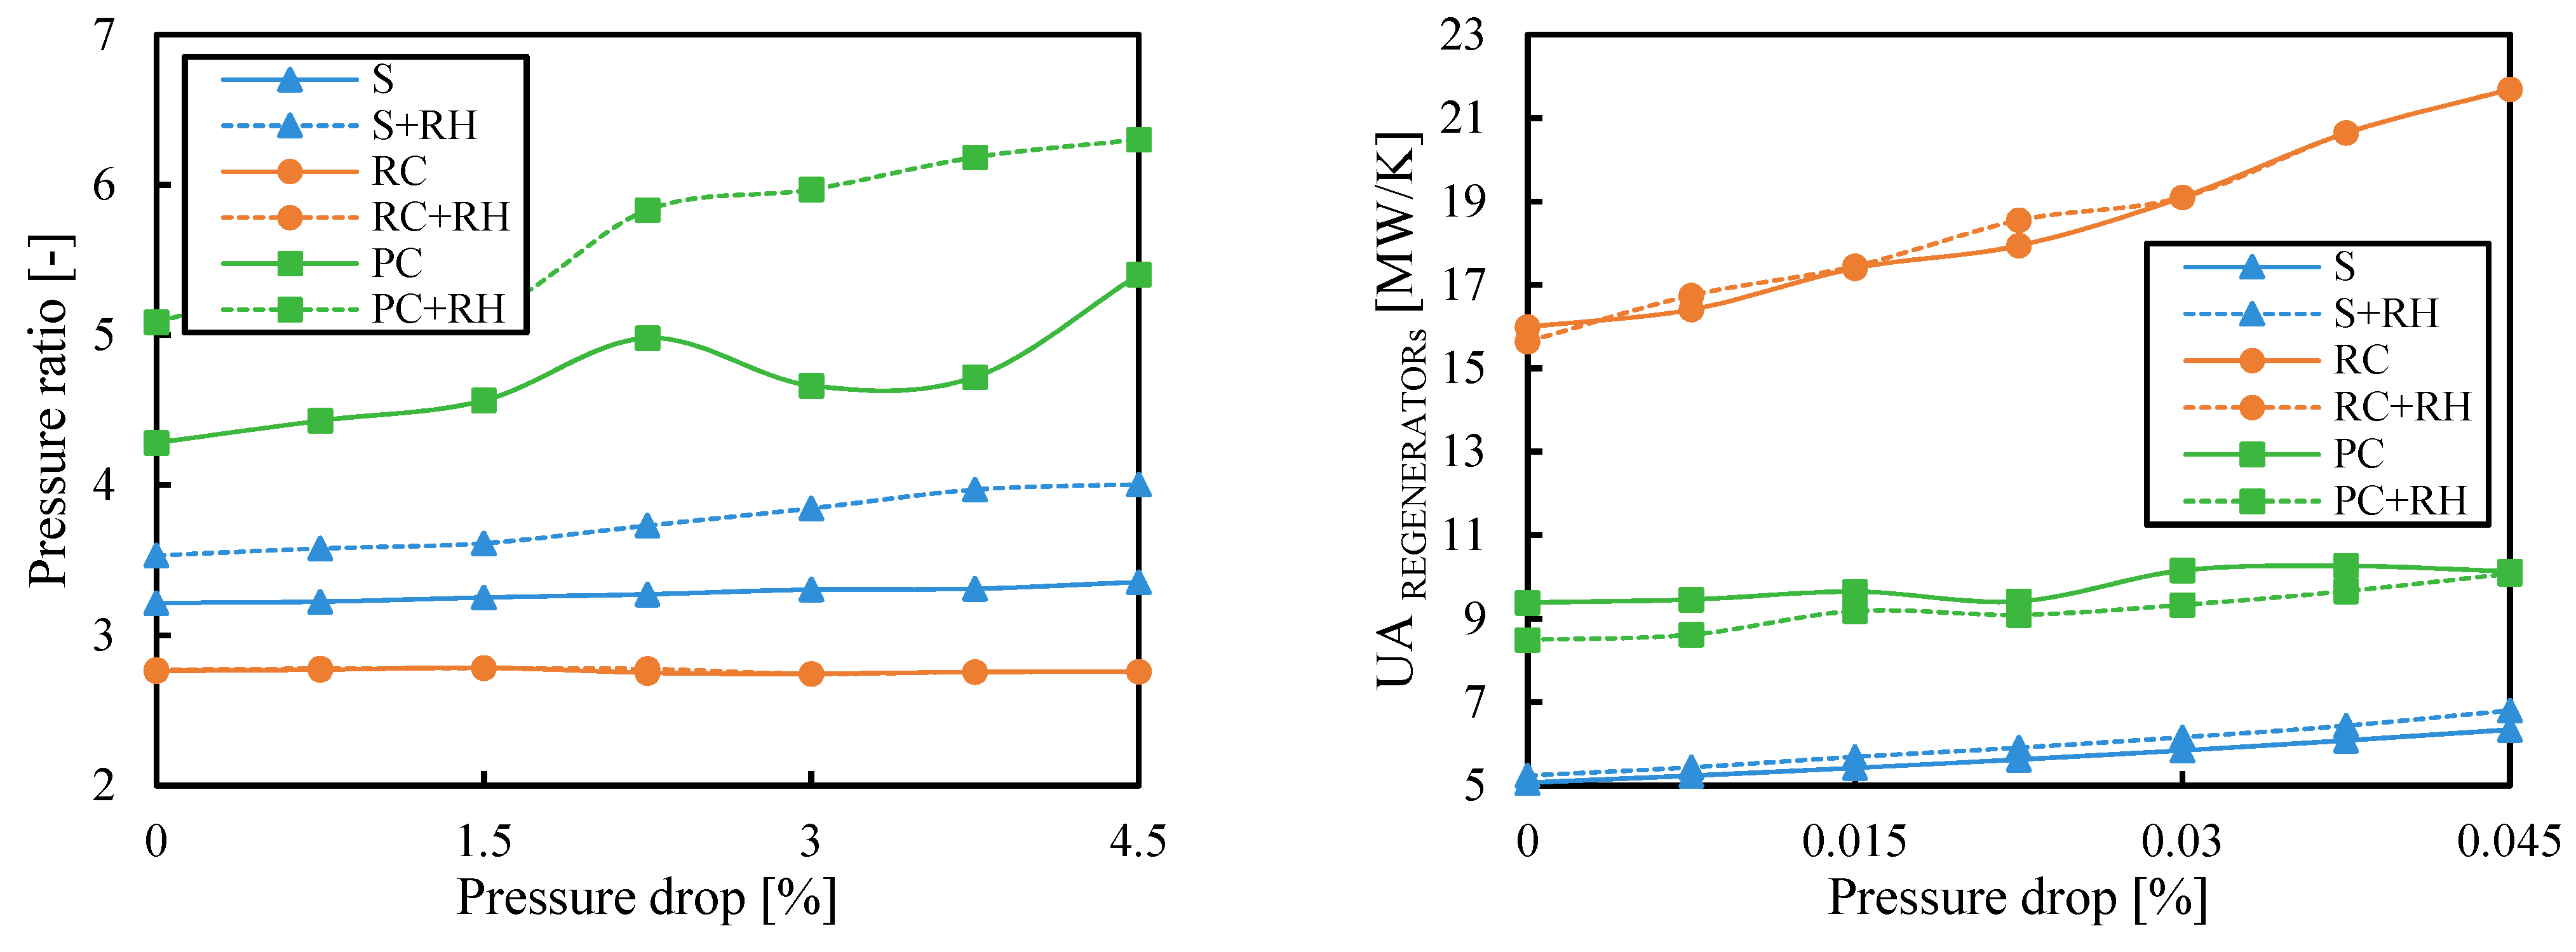
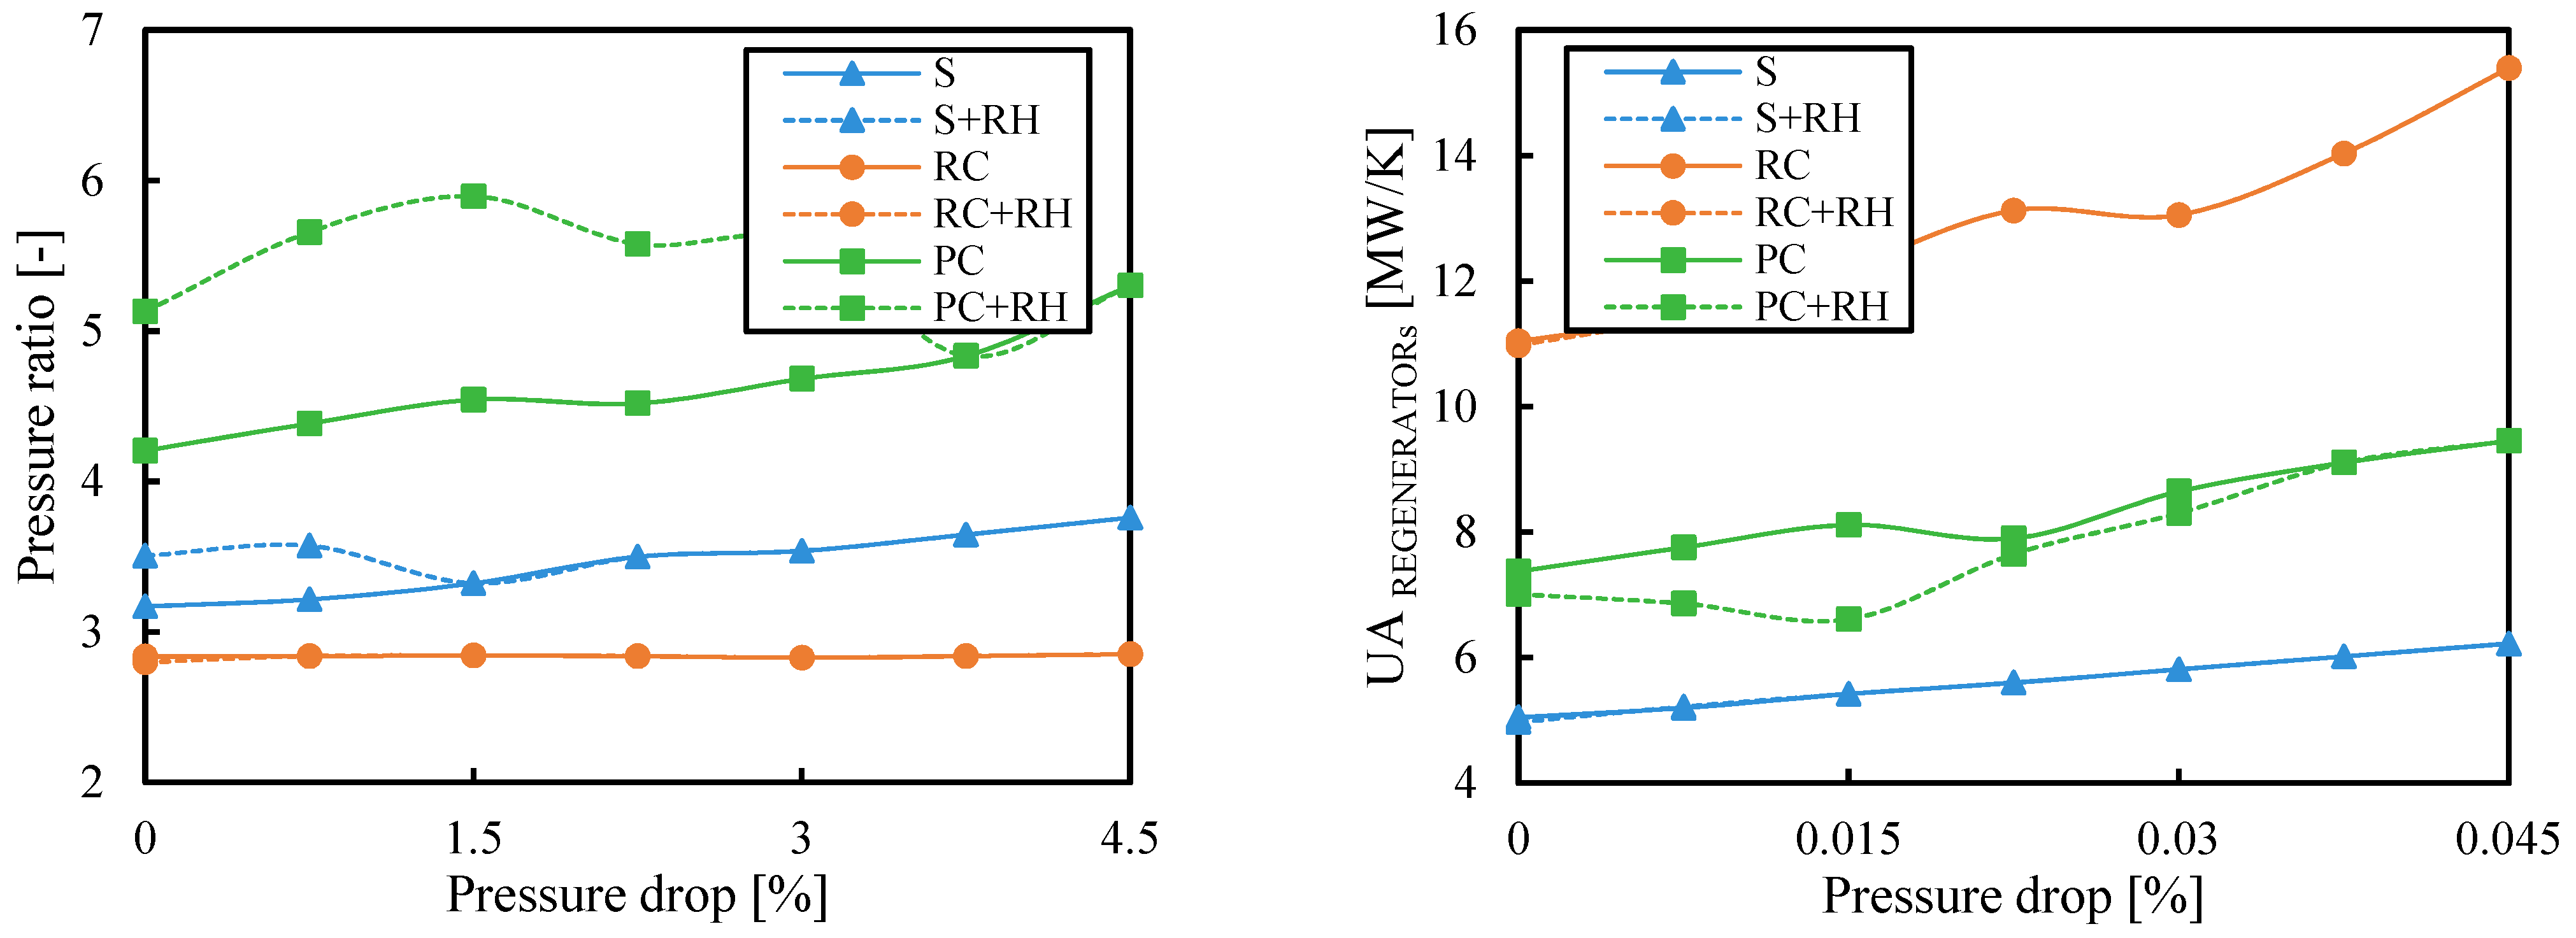
3.4. Pressure Drop
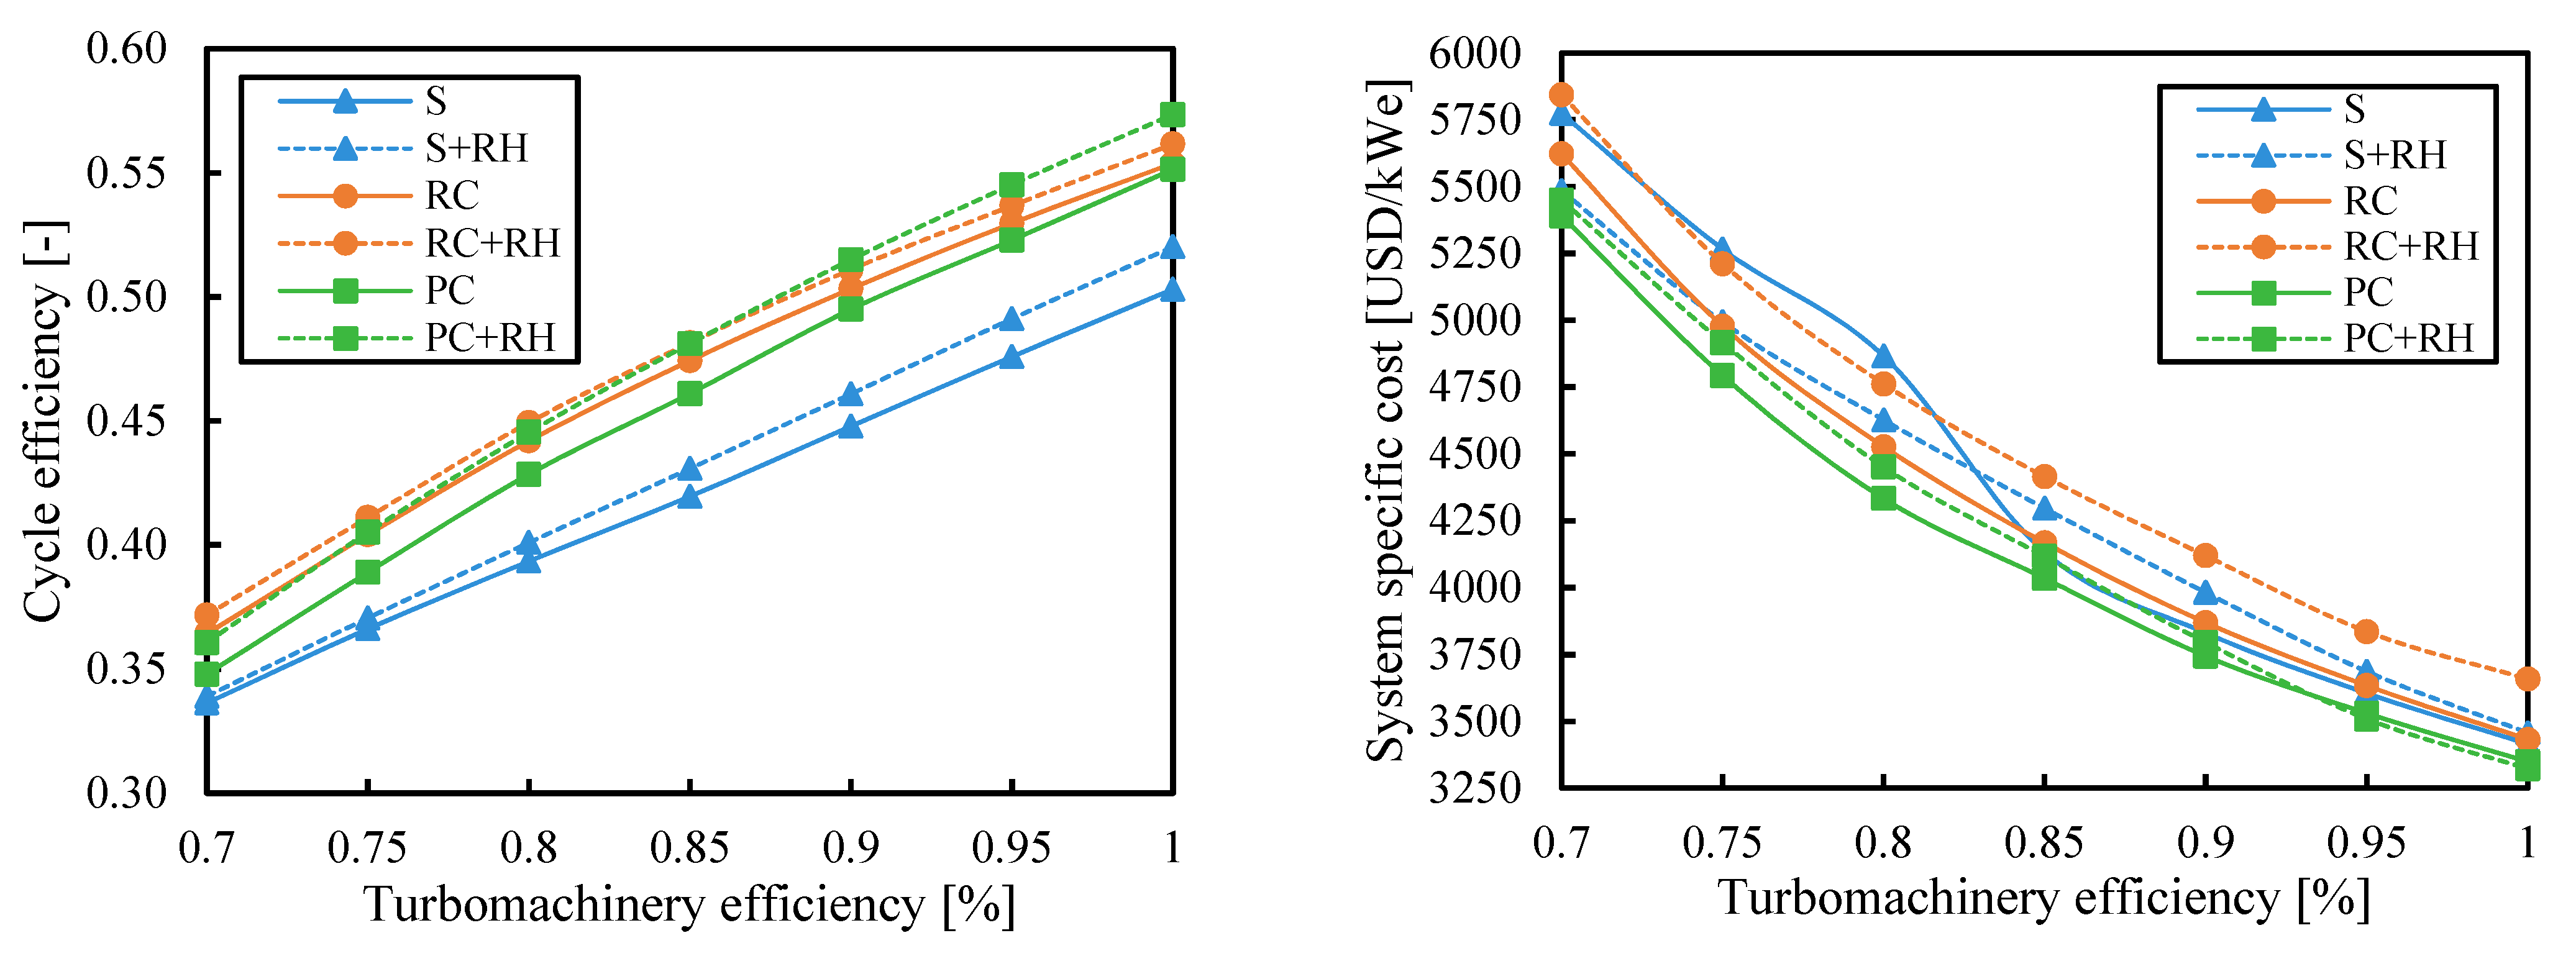
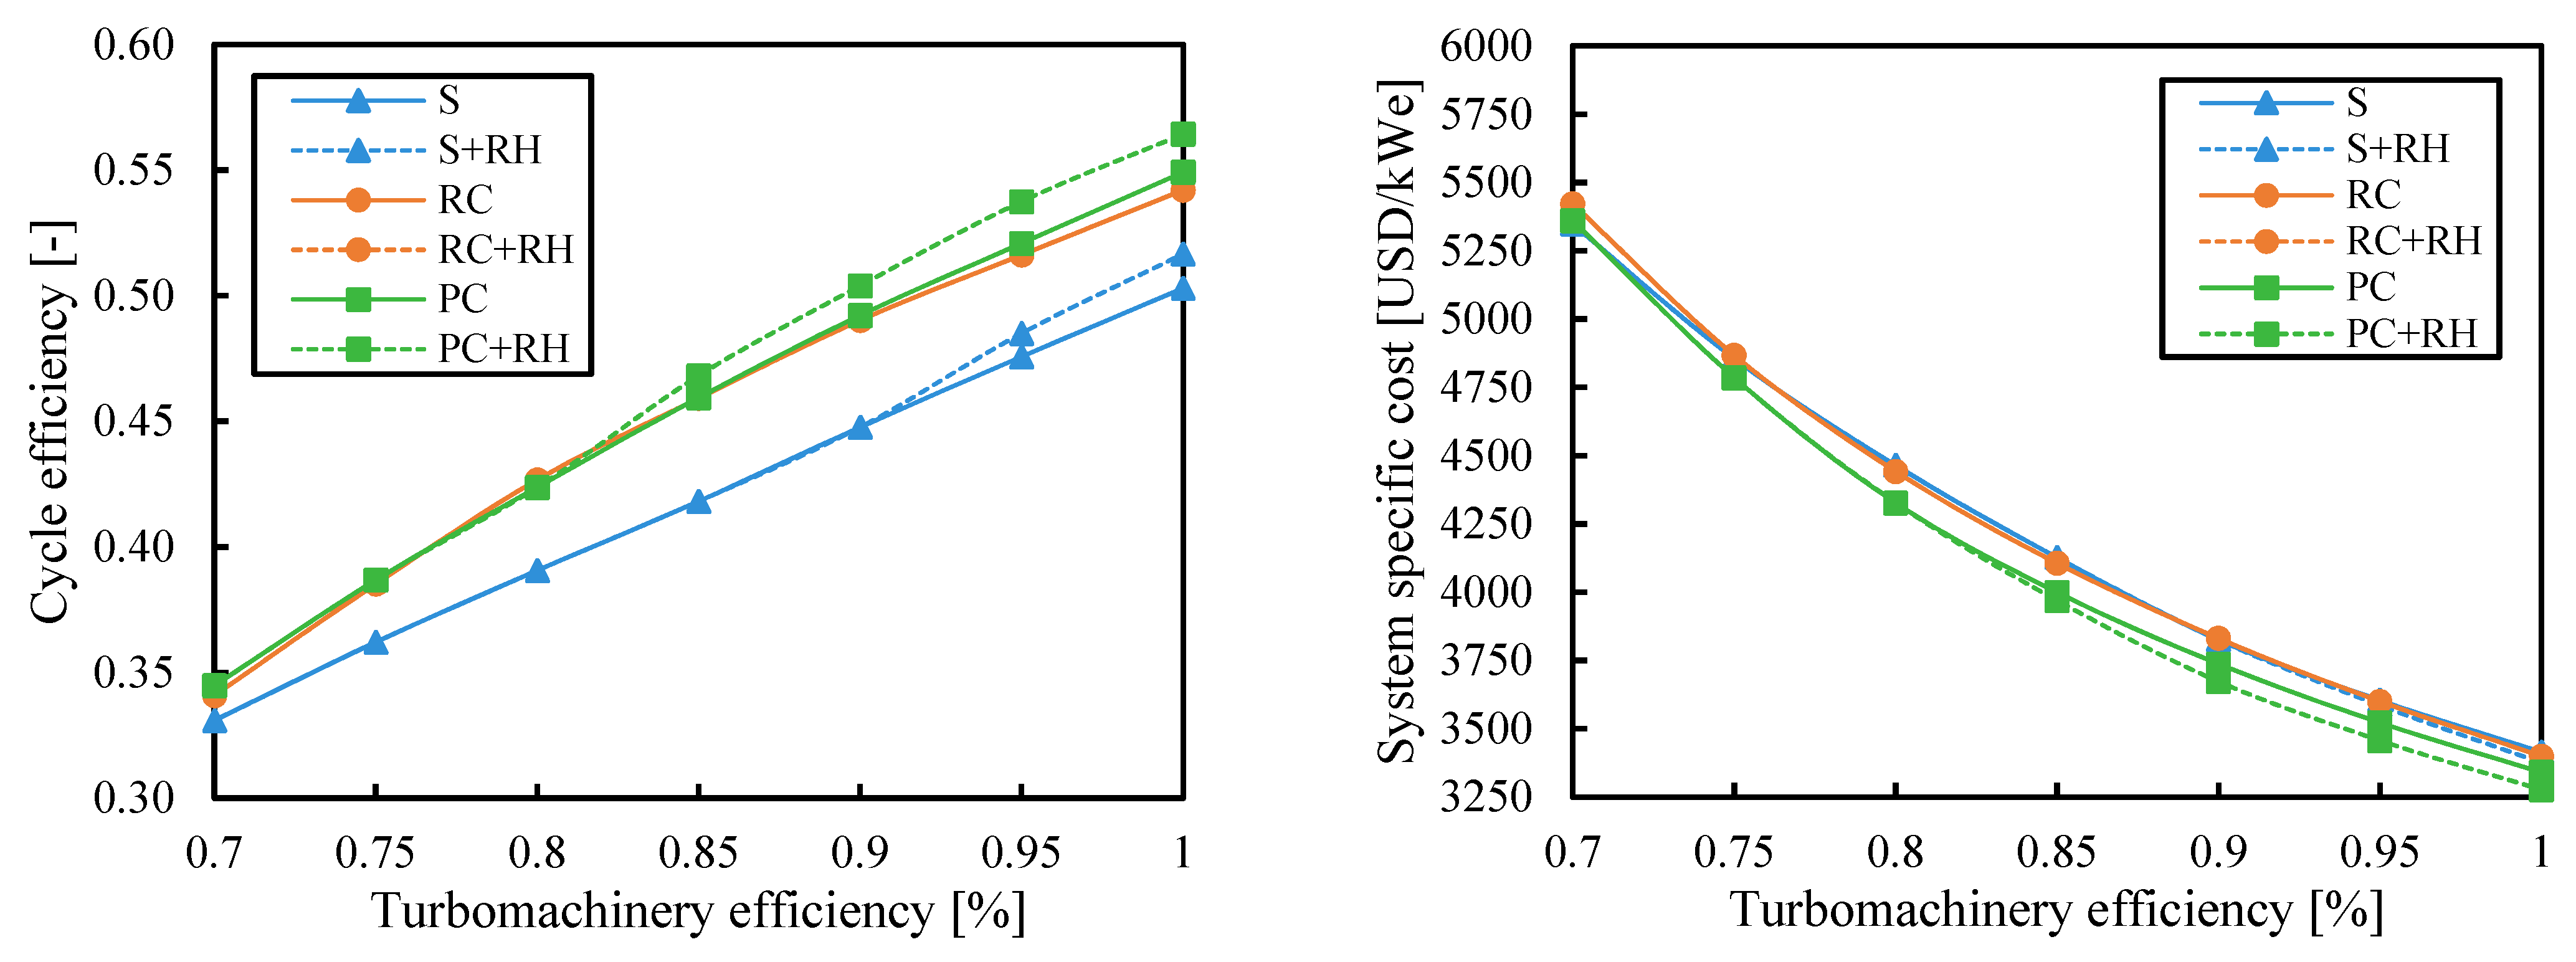
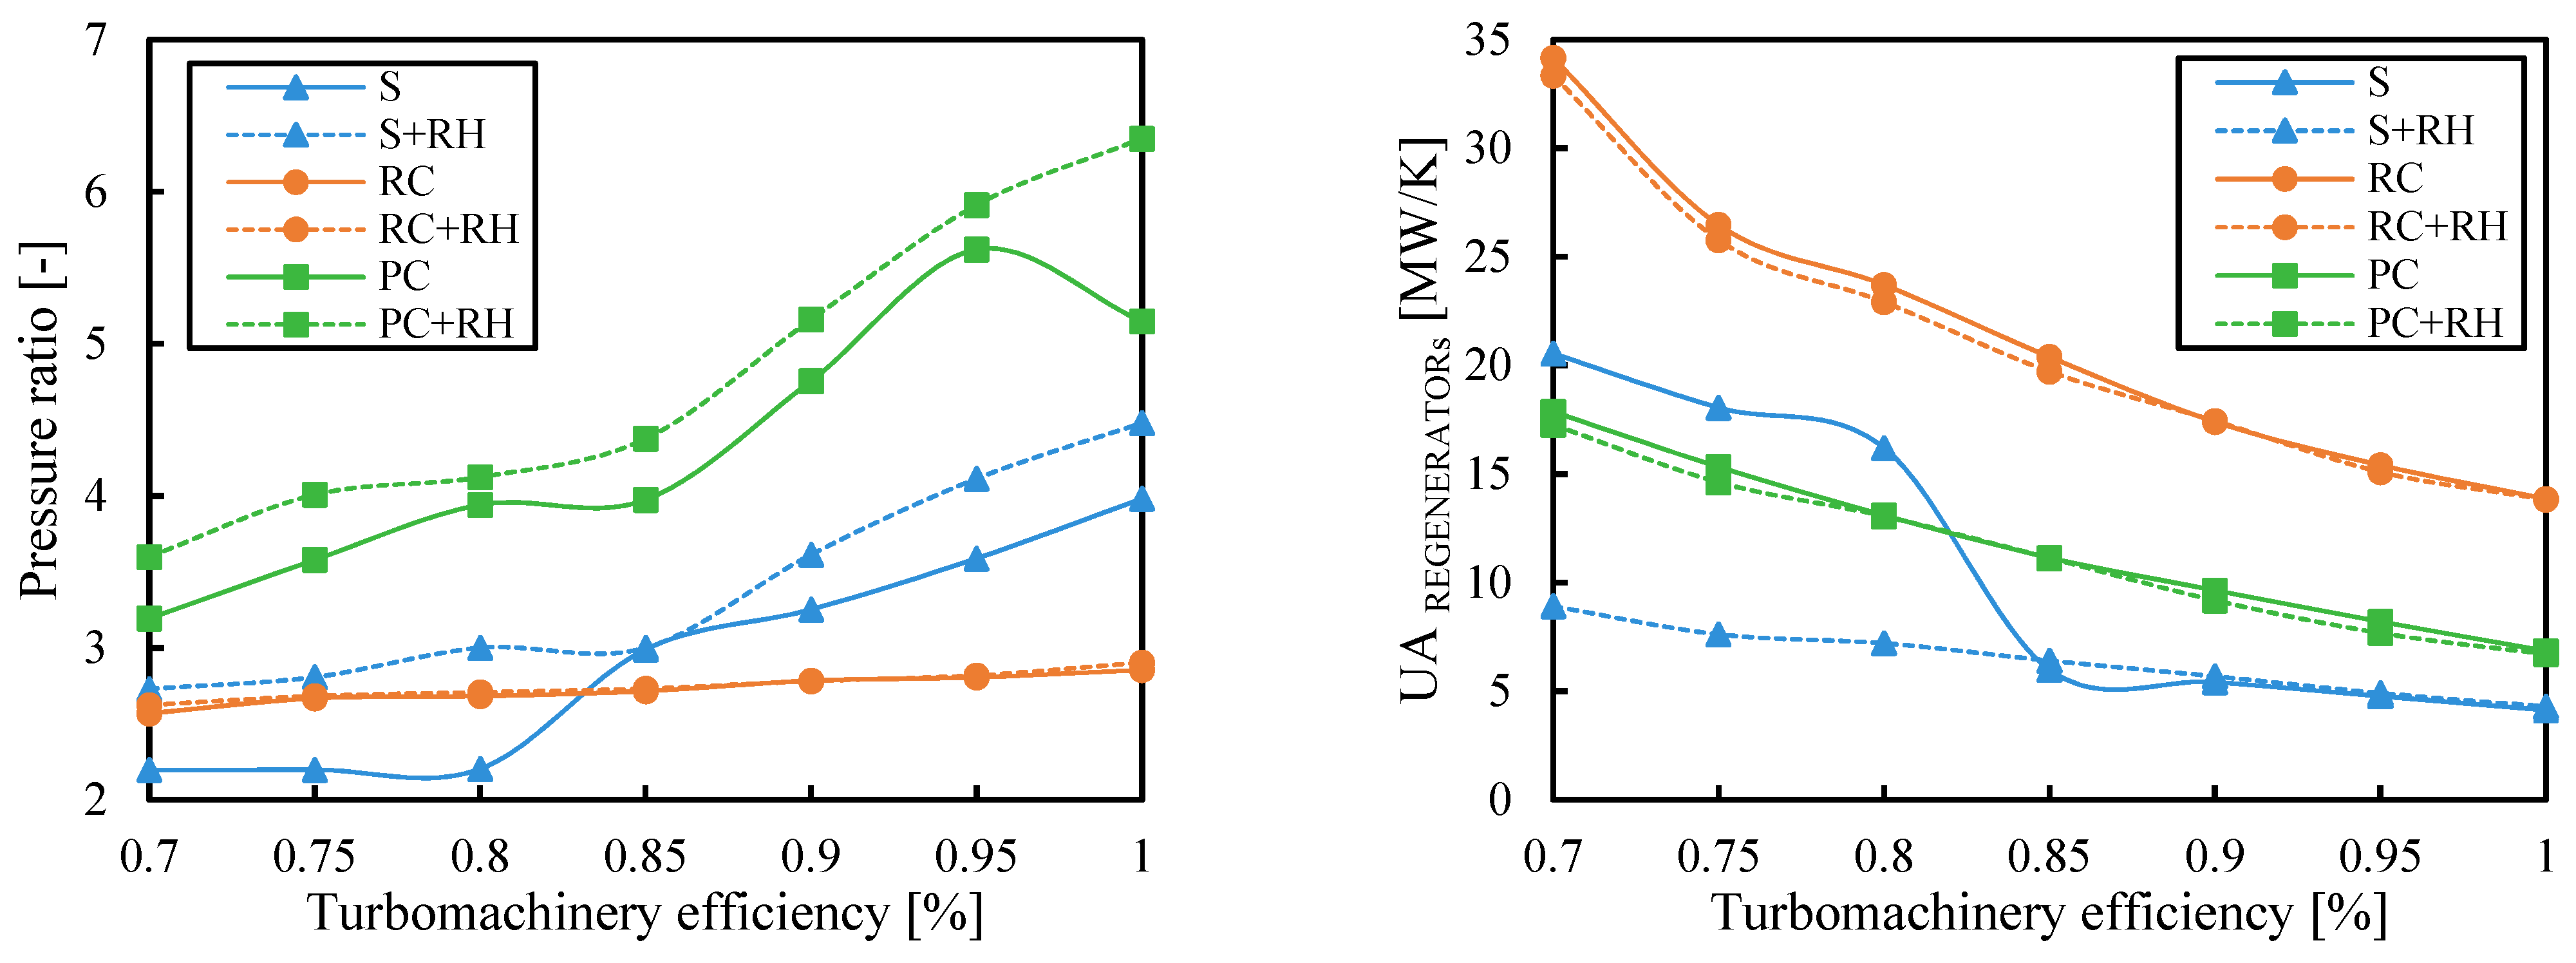
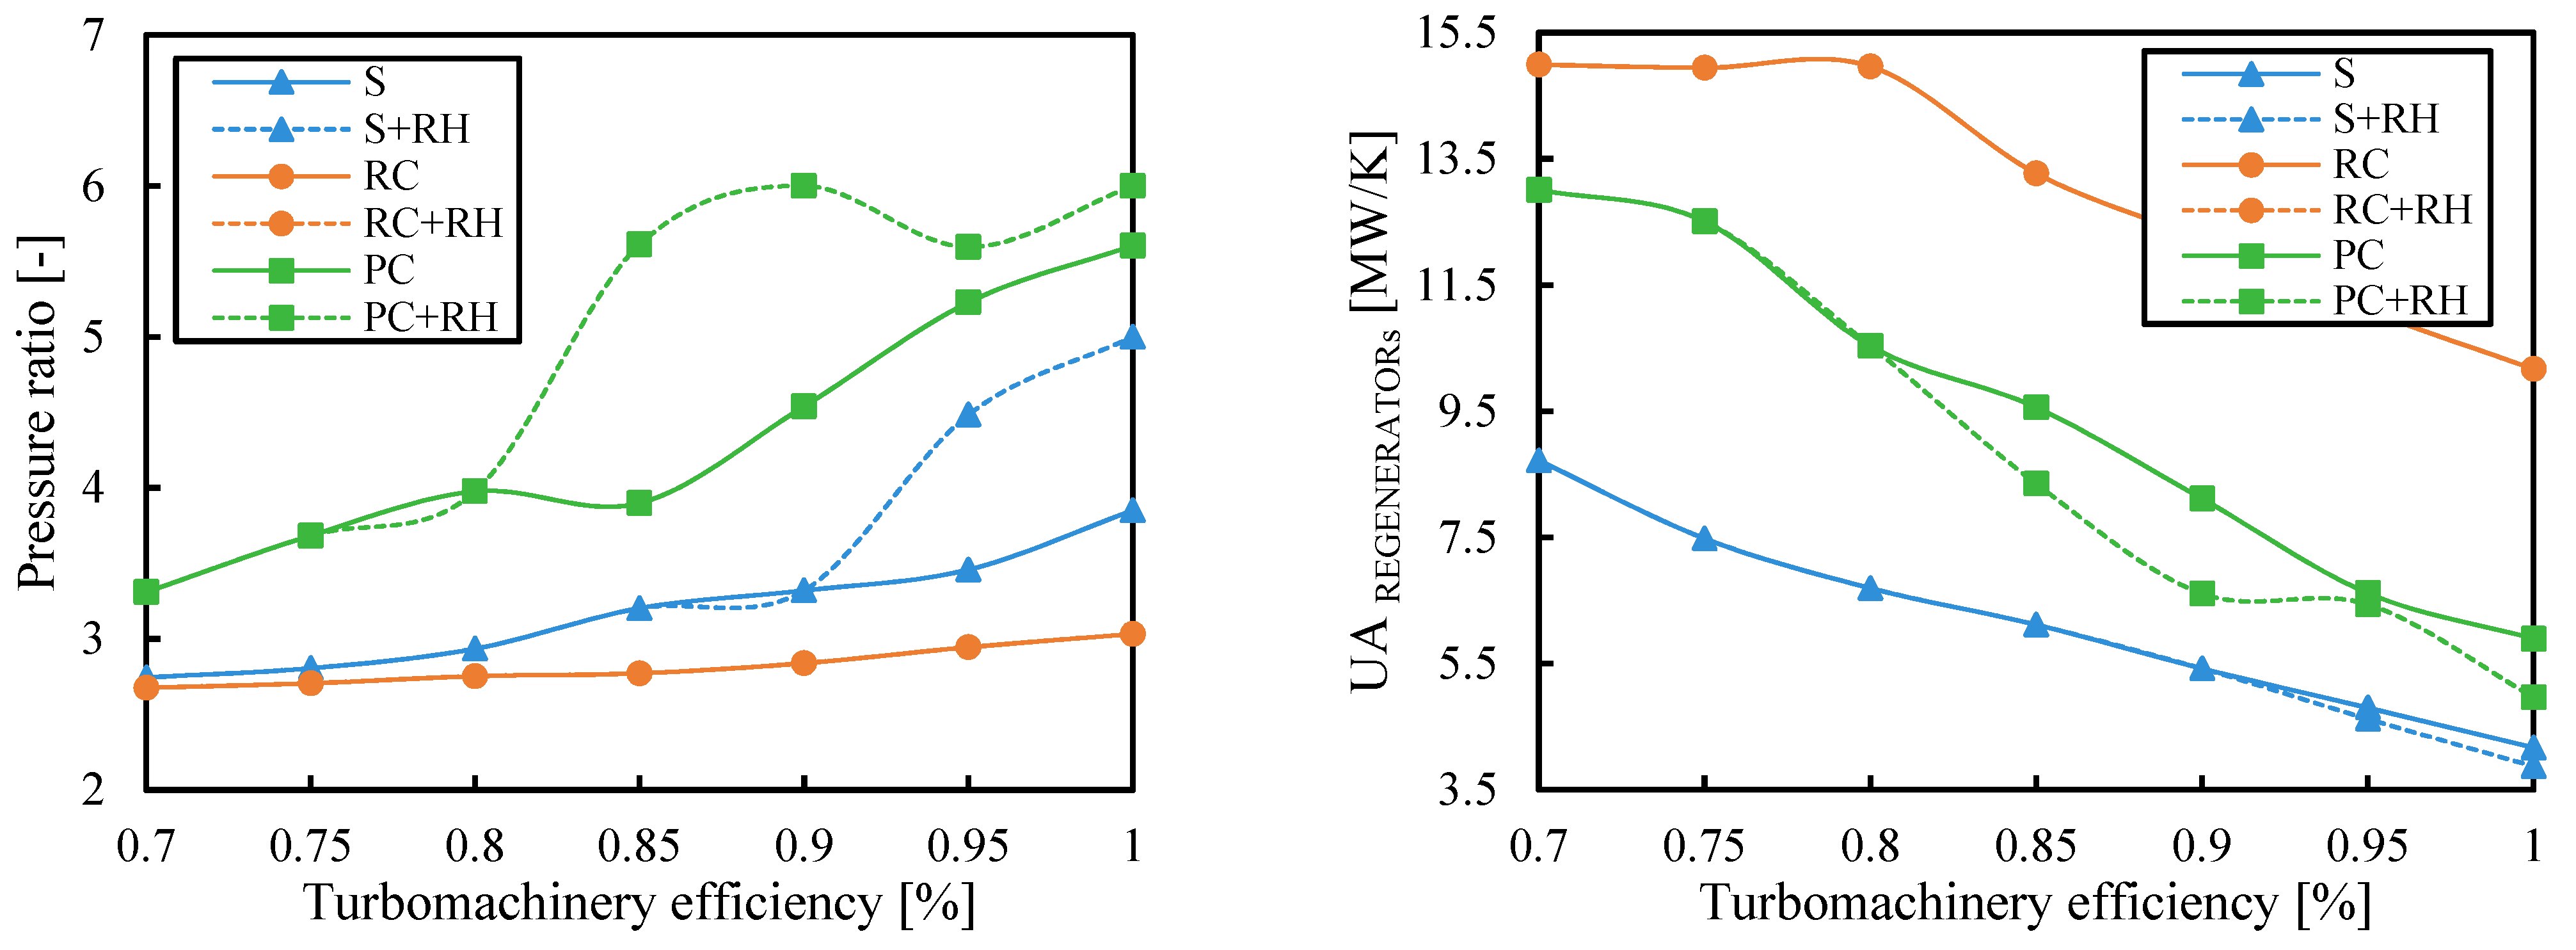
3.5. Turbomachinery Efficiency
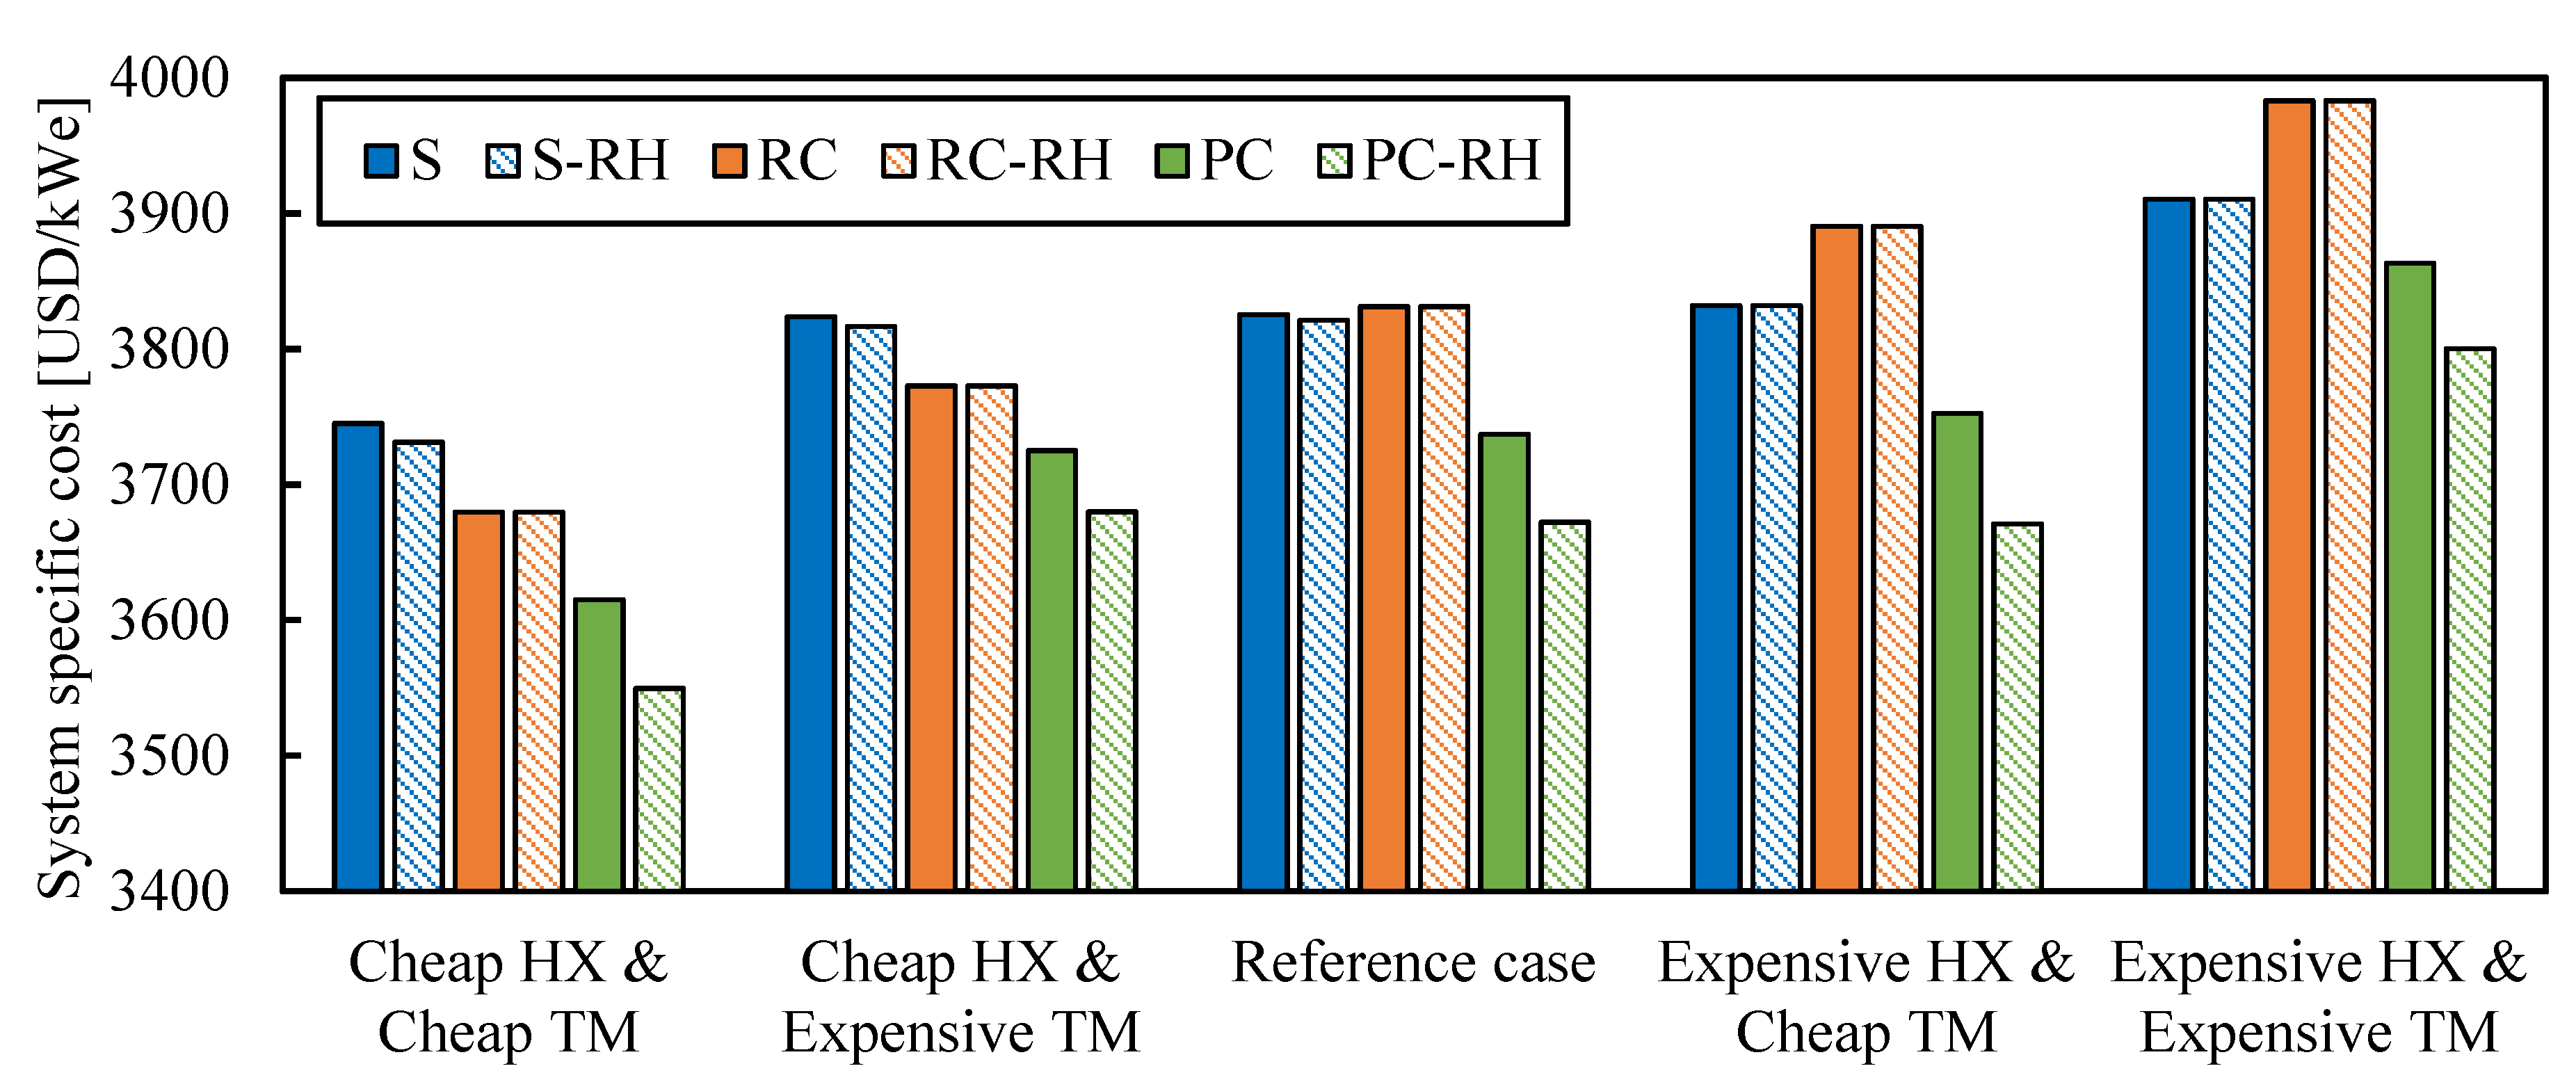
3.6. Cost Uncertainties
- reference case: no uncertainty used;
- cheap HX and expensive TM: lower bounds applied to heat exchangers (HX) and upper bounds applied to turbomachinery (TM);
- expensive HX and cheap TM: upper uncertainties applied to heat exchangers (HX) and lower uncertainty applied to turbomachinery (TM);
- expensive HX and expensive TM: upper uncertainties applied to heat exchangers (HX) and turbomachinery (TM);
- cheap HX and cheap TM: lower uncertainties applied to heat exchangers (HX) and turbomachinery (TM).
4. Conclusions
Author Contributions
Funding
Institutional Review Board Statement
Data Availability Statement
Conflicts of Interest
Nomenclature
| CAPEX | capital expenditure | RC | recompression cycle |
| EES | engineering equation solver | RC-RH | recompression cycle with reheating |
| HPT | high-pressure turbine | Rc | recompressor |
| HTR | high-temperature regenerator | REG | regenerator |
| IC | intercooler | RH | reheating |
| LCoE | levelized cost of electricity | RHX | reheater |
| LPT | low-pressure turbine | S | simple cycle |
| LTR | low-temperature regenerator | S-RH | simple cycle with reheating |
| MC | main compressor | sCO2 | supercritical CO2 |
| NETL | National Energy Technology Laboratory | SF | solar field |
| PC | partial cooling cycle | SR | split ratio |
| PC-RH | partial cooling cycle with reheating | T | turbine |
| Pc | precooler | TIT | turbine inlet temperature |
| PHX | primary heat exchanger | TM | turbomachinery |
| Pre-C | precompressor | UA | heat exchanger conductance |
Appendix A

| Component | a | b | c | d |
|---|---|---|---|---|
| PHX/RHX | 3500 | 1 | 0 | 5.4 × 10⁻⁵ |
| REG/LTR/Additional heat regenerator/HTR | 49.45 | 0.7544 | 0.02141 | 0 |
| Direct air coolers/IC | 32.88 | 0.75 | 0 | 0 |
| Axial turbines | 182,600 | 0.5561 | 0 | 1.106 × 10⁻⁴ |
| IG centrifugal MC/Rc/Pre-C | 1,230,000 | 0.3992 | 0 | 0 |
| Gearbox | 177,200 | 0.2434 | 0 | 0 |
| Generator | 108,900 | 0.5463 | 0 | 0 |
| Motor MC/Rc/Pre-C–open drip-proof motor | 399,400 | 0.6062 | 0 | 0 |
| Component | |
|---|---|
| PHX/RHX | |
| REG/LTR/Additional heat regenerator/HTR | |
| Direct air coolers/IC | |
| Axial turbines | |
| IG centrifugal MC/Rc/Pre-C | |
| Gearbox | |
| Generator | |
| Motor MC | |
| Motor Rc | |
| Motor Pre-C |
Appendix B
Appendix B.1. Turbine Inlet Temperature


Appendix B.2. Ambient Temperature


Appendix B.3. Heating Cost


Appendix B.4. Pressure Drop


Appendix B.5. Turbomachinery Efficiency


References
- Iverson, B.D.; Conboy, T.M.; Pasch, J.J.; Kruizenga, A.M. Supercritical CO2 Brayton cycles for solar-thermal energy. Appl. Energy 2013, 111, 957–970. [Google Scholar] [CrossRef]
- Dostal, V. A Supercritical Carbon Dioxide Cycle for Next Generation Nuclear Reactors. Ph.D. Thesis, Massachusetts Institute of Technology, Cambridge, MA, USA, 2004. [Google Scholar]
- Cheang, V.T.T.; Hedderwick, R.A.A.; McGregor, C. Benchmarking supercritical carbon dioxide cycles against steam Rankine cycles for Concentrated Solar Power. Sol. Energy 2015, 113, 199–211. [Google Scholar] [CrossRef]
- Yin, J.M.; Zheng, Q.Y.; Peng, Z.R.; Zhang, X.R. Review of supercritical CO2 power cycles integrated with CSP. Int. J. Energy Res. 2020, 44, 1337–1369. [Google Scholar] [CrossRef]
- Padilla, R.V.; Too, Y.C.S.; Benito, R.; McNaughton, R.; Stein, W. Thermodynamic feasibility of alternative supercritical CO2 Brayton cycles integrated with an ejector. Appl. Energy 2016, 169, 49–62. [Google Scholar] [CrossRef]
- Thanganadar, D.; Fornarelli, F.; Camporeale, S.; Asfand, F.; Patchigolla, K. Off-design and annual performance analysis of supercritical carbon dioxide cycle with thermal storage for CSP application. Appl. Energy 2021, 282, 116200. [Google Scholar] [CrossRef]
- Ma, Y.; Morosuk, T.; Luo, J.; Liu, M.; Liu, J. Superstructure design and optimization on supercritical carbon dioxide cycle for application in concentrated solar power plant. Energy Convers. Manag. 2020, 206, 112290. [Google Scholar] [CrossRef]
- Thanganadar, D.; Asfand, F.; Patchigolla, K.; Turner, P. Techno-economic analysis of supercritical carbon dioxide cycle integrated with coal-fired power plant. Energy Convers. Manag. 2021, 242, 114294. [Google Scholar] [CrossRef]
- Yang, J.; Yang, Z.; Duan, Y. A review on integrated design and off-design operation of solar power tower system with S-CO2 Brayton cycle. Energy 2022, 246, 123348. [Google Scholar] [CrossRef]
- Guo, J.Q.; Li, M.-J.; He, Y.-L.; Jiang, T.; Ma, T.; Xu, J.-L.; Cao, F. A systematic review of supercritical carbon dioxide(S-CO2) power cycle for energy industries: Technologies, key issues, and potential prospects. Energy Convers. Manag. 2022, 258, 115437. [Google Scholar] [CrossRef]
- Chen, J.; Cheng, K.; Li, X.; Huai, X.; Dong, H. Thermodynamic evaluation and optimization of supercritical CO2 Brayton cycle considering recuperator types and designs. J. Clean. Prod. 2023, 414, 137615. [Google Scholar] [CrossRef]
- Yun, S.; Zhang, D.; Li, X.; Zhou, X.; Jiang, D.; Lv, X.; Wu, W.; Feng, Z.; Min, X.; Tian, W.; et al. Design, optimization and thermodynamic analysis of SCO2 Brayton cycle system for FHR. Prog. Nucl. Energy 2023, 157, 104593. [Google Scholar] [CrossRef]
- White, C.; Gray, D.; Plunkett, J.; Shelton, W.; Weiland, N.; Shultz, T. Techno-Economic Evaluation of Utility-Scale Power Plants Based on the Indirect sCO2 Brayton Cycle; U.S. Department of Energy, Office of Scientific and Technical Information: Washington, DC, USA, 2017. [Google Scholar] [CrossRef]
- Atif, M.; Al-Sulaiman, F.A. Performance analysis of supercritical CO2 Brayton cycles integrated with solar central receiver system. In Proceedings of the IREC 2014—5th International Renewable Energy Congress, Hammamet, Tunisia, 25–27 March 2014; pp. 2–7. [Google Scholar] [CrossRef]
- Al-Sulaiman, F.A.; Atif, M. Performance comparison of different supercritical carbon dioxide Brayton cycles integrated with a solar power tower. Energy 2015, 82, 61–71. [Google Scholar] [CrossRef]
- Padilla, R.V.; Too, Y.C.S.; Beath, A.; McNaughton, R.; Stein, W. Effect of Pressure Drop and Reheating on Thermal and Exergetic Performance of Supercritical Carbon Dioxide Brayton Cycles Integrated with a Solar Central Receiver. J. Sol. Energy Eng. 2015, 137, 051012. [Google Scholar] [CrossRef]
- Neises, T.; Turchi, C. A Comparison of Supercritical Carbon Dioxide Power Cycle Configurations with an Emphasis on CSP Applications. Energy Procedia 2014, 49, 1187–1196. [Google Scholar] [CrossRef]
- Alfani, D.; Neises, T.; Astolfi, M.; Binotti, M.; Silva, P. Techno-economic analysis of CSP incorporating sCO2 Brayton power cycles: Trade-off between cost and performance. In Proceedings of the SolarPACES2020, Online, 28 September–2 October 2020; p. 090001. [Google Scholar] [CrossRef]
- Meybodi, M.A.; Beath, A.; Gwynn-Jones, S.; Veeraragavan, A.; Gurgenci, H.; Hooman, K. Techno-economic analysis of supercritical carbon dioxide power blocks. In Proceedings of the SolarPACES2016, Abu Dhabi, United Arab Emirates, 11–14 October 2016; American Institute of Physics Inc.: College Park, MD, USA, 2017; p. 060001. [Google Scholar] [CrossRef]
- Marchionni, M.; Bianchi, G.; Tsamos, K.M.; Tassou, S.A. Techno-economic comparison of different cycle architectures for high temperature waste heat to power conversion systems using CO2 in supercritical phase. Energy Procedia 2017, 123, 305–312. [Google Scholar] [CrossRef]
- Ho, C.K.; Carlson, M.; Garg, P.; Kumar, P. Technoeconomic Analysis of Alternative Solarized s-CO2 Brayton Cycle Configurations. J. Sol. Energy Eng. Trans. ASME 2016, 138, 051008. [Google Scholar] [CrossRef]
- Crespi, F. Thermo-Economic Assessment of Supercritical CO2 Power Cycles for Concentrated Solar Power Plants. Ph.D. Thesis, Universidad de Sevilla, Sevilla, Spain, 2019. [Google Scholar]
- Crespi, F.; Sánchez, D.; Martínez, G.S.; Sánchez-Lencero, T.; Jiménez-Espadafor, F. Potential of Supercritical Carbon Dioxide Power Cycles to Reduce the Levelised Cost of Electricity of Contemporary Concentrated Solar Power Plants. Appl. Sci. 2020, 10, 5049. [Google Scholar] [CrossRef]
- Turchi, C.S.; Ma, Z.; Neises, T.W.; Wagner, M.J. Thermodynamic Study of Advanced Supercritical Carbon Dioxide Power Cycles for Concentrating Solar Power Systems. J. Sol. Energy Eng. 2013, 135, 041007. [Google Scholar] [CrossRef]
- Neises, T.; Turchi, C. Supercritical carbon dioxide power cycle design and configuration optimization to minimize levelized cost of energy of molten salt power towers operating at 650 °C. Sol. Energy 2019, 181, 27–36. [Google Scholar] [CrossRef]
- Siddiqui, M.E.; Taimoor, A.A.; Almitani, K.H. Energy and exergy analysis of the S-CO2 Brayton cycle coupled with bottoming cycles. Processes 2018, 6, 153. [Google Scholar] [CrossRef]
- Yang, Z.; Kang, R.; Luo, X.; Chen, J.; Liang, Y.; Wang, C.; Chen, Y.; Xu, J. Rigorous modelling and deterministic multi-objective optimization of a super-critical CO2 power system based on equation of state and non-linear programming. Energy Convers. Manag. 2019, 198, 111798. [Google Scholar] [CrossRef]
- Mohammadi, K.; Ellingwood, K.; Powell, K. Novel hybrid solar tower-gas turbine combined power cycles using supercritical carbon dioxide bottoming cycles. Appl. Therm. Eng. 2020, 178, 115588. [Google Scholar] [CrossRef]
- Heller, L.; Glos, S.; Buck, R. A detailed economic comparison of supercritical CO2 and steam power cycles in particle CSP plants. In Proceedings of the SolarPACES22, Albuquerque, NM, USA, 26–30 September 2022. [Google Scholar]
- Klein, S.A. EES: Engineering Equation Solver for the Microsoft Windows Operating System; F-Chart Software: Fitchburg, WI, USA, 1992; Available online: https://books.google.es/books/about/EES.html?id=L0zDPwAACAAJ&redir_esc=y (accessed on 3 November 2021).
- Lemmon, E.W.; Bell, I.H.; Huber, M.L.; McLinden, M.O. NIST Standard Reference Database 23: Reference Fluid Thermodynamic and Transport Properties-REFPROP; Version 10.0; National Institute of Standards and Technology: Gaithersbg, MD, USA, 2018. Available online: https://www.nist.gov/sites/default/files/documents/2018/05/23/refprop10a.pdf (accessed on 20 April 2021).
- Turchi, C.S.; Ma, Z.; Neises, T.; Wagner, M. Thermodynamic Study of Advanced Supercritical Carbon Dioxide Power Cycles for High Performance Concentrating Solar Power Systems. In Proceedings of the ASME 2012 6th International Conference on Energy Sustainability, San Diego, CA, USA, 23–26 July 2012. [Google Scholar]
- Weiland, N.T.; Lance, B.W.; Pidaparti, S.R. SCO2 power cycle component cost correlations from DOE data spanning multiple scales and applications. In Proceedings of the ASME Turbo Expo, Phoenix, AZ, USA, 17–21 June 2019; Volume 9, pp. 1–17. [Google Scholar] [CrossRef]
- Turchi, C.S.; Vidal, J.; Bauer, M. Molten salt power towers operating at 600–650 °C: Salt selection and cost benefits. Sol. Energy 2018, 164, 38–46. [Google Scholar] [CrossRef]
- Tse, L.A.; Neises, T. Analysis and Optimization for off—Design Performance of the Recompression sCO2 Cycles for High Temperature CSP Applications. In Proceedings of the 5th International Symposium—sCO2 Power Cycles2, San Antonio, TX, USA, 29–31 March 2016; pp. 1–13. [Google Scholar] [CrossRef]
- Albrecht, K.J.; Bauer, M.L.; Ho, C.K. Parametric Analysis of Particle CSP System Performance and Cost to Intrinsic Particle Properties and Operating Conditions. In Proceedings of the ASME 2019 13th International Conference on Energy Sustainability, Bellevue, WA, USA, 15–17 July 2019; American Society of Mechanical Engineers: New York, NY, USA, 2019. [Google Scholar] [CrossRef]
- Dyreby, J. Modeling the Supercritical Carbon Dioxide Brayton Cycle with Recompression. Ph.D. Thesis, The University of Wisconsin, Madison, WI, USA, 2014. [Google Scholar]
- Padilla, R.V.; Too, Y.C.S.; Benito, R.; Stein, W. Exergetic analysis of supercritical CO2 Brayton cycles integrated with solar central receivers. Appl. Energy 2015, 148, 348–365. [Google Scholar] [CrossRef]
- Wilk, G.; DeAngelis, A.; Henry, A. Estimating the cost of high temperature liquid metal based concentrated solar power. J. Renew. Sustain. Energy 2018, 10, 023705. [Google Scholar] [CrossRef]
- Caraballo, A.; Galán-Casado, S.; Caballero, Á.; Serena, S. Molten Salts for Sensible Thermal Energy Storage: A Review and an Energy Performance Analysis. Energies 2021, 14, 1197. [Google Scholar] [CrossRef]
- Ho, C.K.; Carlson, M.; Garg, P.; Kumar, P. Cost and Performance Tradeoffs of Alternative Solar-driven S-CO2 Brayton Cycle Configurations. In Proceedings of the ASME 2015 Power and Energy Conversion Conference, San Diego, CA, USA, 28 June–2 July 2015; pp. 1–10. [Google Scholar] [CrossRef]
- González-Portillo, L.F.; Albrecht, K.; Ho, C.K. Techno-Economic Optimization of CSP Plants with Free-Falling Particle Receivers. Entropy 2021, 23, 76. [Google Scholar] [CrossRef]
- NREL. SAM (System Advisor Model) version 2020.11.29. 2020. Available online: https://sam.nrel.gov (accessed on 12 September 2023).
- Crespi, F.; Gavagnin, G.; Sánchez, D.; Martínez, G.S. Analysis of the Thermodynamic Potential of Supercritical Carbon Dioxide Cycles: A Systematic Approach. J. Eng. Gas Turbines Power 2018, 140, 051701. [Google Scholar] [CrossRef]
- Gen 3 CSP Topic 1—sCO2 Cycle Modeling Assumptions and Boundary Conditions; United States Department of Energy, Office of Energy Efficiency and Renewable Energy: Washington, DC, USA, 2019.
- Seo, H.; Cha, J.E.; Kim, J.; Sah, I.; Kim, Y.W. Design and performance analysis of a supercritical carbon dioxide heat exchanger. Appl. Sci. 2020, 10, 4545. [Google Scholar] [CrossRef]
- Dennis, R. DOE Initiative on SCO2 Power Cycles (STEP)—Heat Exchangers: A Performance and Cost Challenge. In EPRI—NETL Workshop on Heat Exchangers for SCO2 Power Cycles; US Department of Energy: San Diego, CA, USA, 2015. [Google Scholar]
- Reznicek, E.P. Design and Simulation of Supercritical Carbon Dioxide Recompression Brayton Cycles with Regenerators for Recuperation. Ph.D. Thesis, Colorado School of Mines, Golden, CO, USA, 2019. [Google Scholar]
- Zhang, R.; Su, W.; Lin, X.; Zhou, N.; Zhao, L. Thermodynamic analysis and parametric optimization of a novel S–CO2 power cycle for the waste heat recovery of internal combustion engines. Energy 2020, 209, 118484. [Google Scholar] [CrossRef]
- González-Portillo, L.F.; Muñoz-Antón, J.; Martínez-Val, J.M. Thermodynamic mapping of power cycles working around the critical point. Energy Convers. Manag. 2019, 192, 359–373. [Google Scholar] [CrossRef]
- Mehos, M.; Turchi, C.; Vidal, J.; Wagner, M.; Ma, Z.; Ho, C.; Kolb, W.; Andraka, C.; Kruizenga, A. Concentrating Solar Power Gen3 Demonstration Roadmap. 2017. Available online: www.nrel.gov/publications (accessed on 1 June 2023).
- Linares, J.I.; Montes, M.J.; Cantizano, A.; Sánchez, C. A novel supercritical CO2 recompression Brayton power cycle for power tower concentrating solar plants. Appl. Energy 2020, 263, 114644. [Google Scholar] [CrossRef]


| Fixed Parameter | Value | Optimized Variable | Value |
|---|---|---|---|
| High pressure | 25 MPa | REG/global effectiveness | Optimized |
| Minimum pinch point temperature difference | 5 K | Pressure ratio | Optimized |
| REG steps number | 20 | Compressor inlet temperature | Optimized |
| HTR/LTR/IC steps number | 10 | Split ratio (RC and PC) | Optimized |
| Pc steps number | 5 | Pressure at the outlet of Pre-C (PC) | Optimized |
| Cycle power | 50 MW | ||
| Pressure at RHX inlet (RH) | Optimized | ||
| Analyzed Variable | Reference Value | Lower Bound | Upper Bound |
| Ambient temperature | 35 °C | 20 °C | 40 °C |
| Turbine inlet temperature | 700 °C | 500 °C | 900 °C |
| Heating cost | 1500 USD/kWt | 1000 USD/kWt | 2000 USD/kWt |
| Pressure drop | 1.5% | 0% | 4.5% |
| Turbomachinery efficiency | 0.90 | 0.7 | 1 |
| Component | Component Type | Lower Bounds | Upper Bounds |
|---|---|---|---|
| Recuperator | Heat exchanger | −31% | 38% |
| Cooler | Heat exchanger | −25% | 28% |
| Turbine | Turbomachine | −25% | 30% |
| Compressor | Turbomachine | −39% | 48% |
Disclaimer/Publisher’s Note: The statements, opinions and data contained in all publications are solely those of the individual author(s) and contributor(s) and not of MDPI and/or the editor(s). MDPI and/or the editor(s) disclaim responsibility for any injury to people or property resulting from any ideas, methods, instructions or products referred to in the content. |
© 2024 by the authors. Licensee MDPI, Basel, Switzerland. This article is an open access article distributed under the terms and conditions of the Creative Commons Attribution (CC BY) license (https://creativecommons.org/licenses/by/4.0/).
Share and Cite
Merchán, R.P.; González-Portillo, L.F.; Muñoz-Antón, J. Techno–Economic Analysis of the Optimum Configuration for Supercritical Carbon Dioxide Cycles in Concentrating Solar Power Systems. Entropy 2024, 26, 124. https://doi.org/10.3390/e26020124
Merchán RP, González-Portillo LF, Muñoz-Antón J. Techno–Economic Analysis of the Optimum Configuration for Supercritical Carbon Dioxide Cycles in Concentrating Solar Power Systems. Entropy. 2024; 26(2):124. https://doi.org/10.3390/e26020124
Chicago/Turabian StyleMerchán, Rosa P., Luis F. González-Portillo, and Javier Muñoz-Antón. 2024. "Techno–Economic Analysis of the Optimum Configuration for Supercritical Carbon Dioxide Cycles in Concentrating Solar Power Systems" Entropy 26, no. 2: 124. https://doi.org/10.3390/e26020124