
On the Effect of Imperfect Reference Signal Phase Recovery on Performance of PSK System Influenced by TWDP Fading


Abstract
:1. Introduction
1.1. Literature Review
1.2. Contribution
1.3. Structure
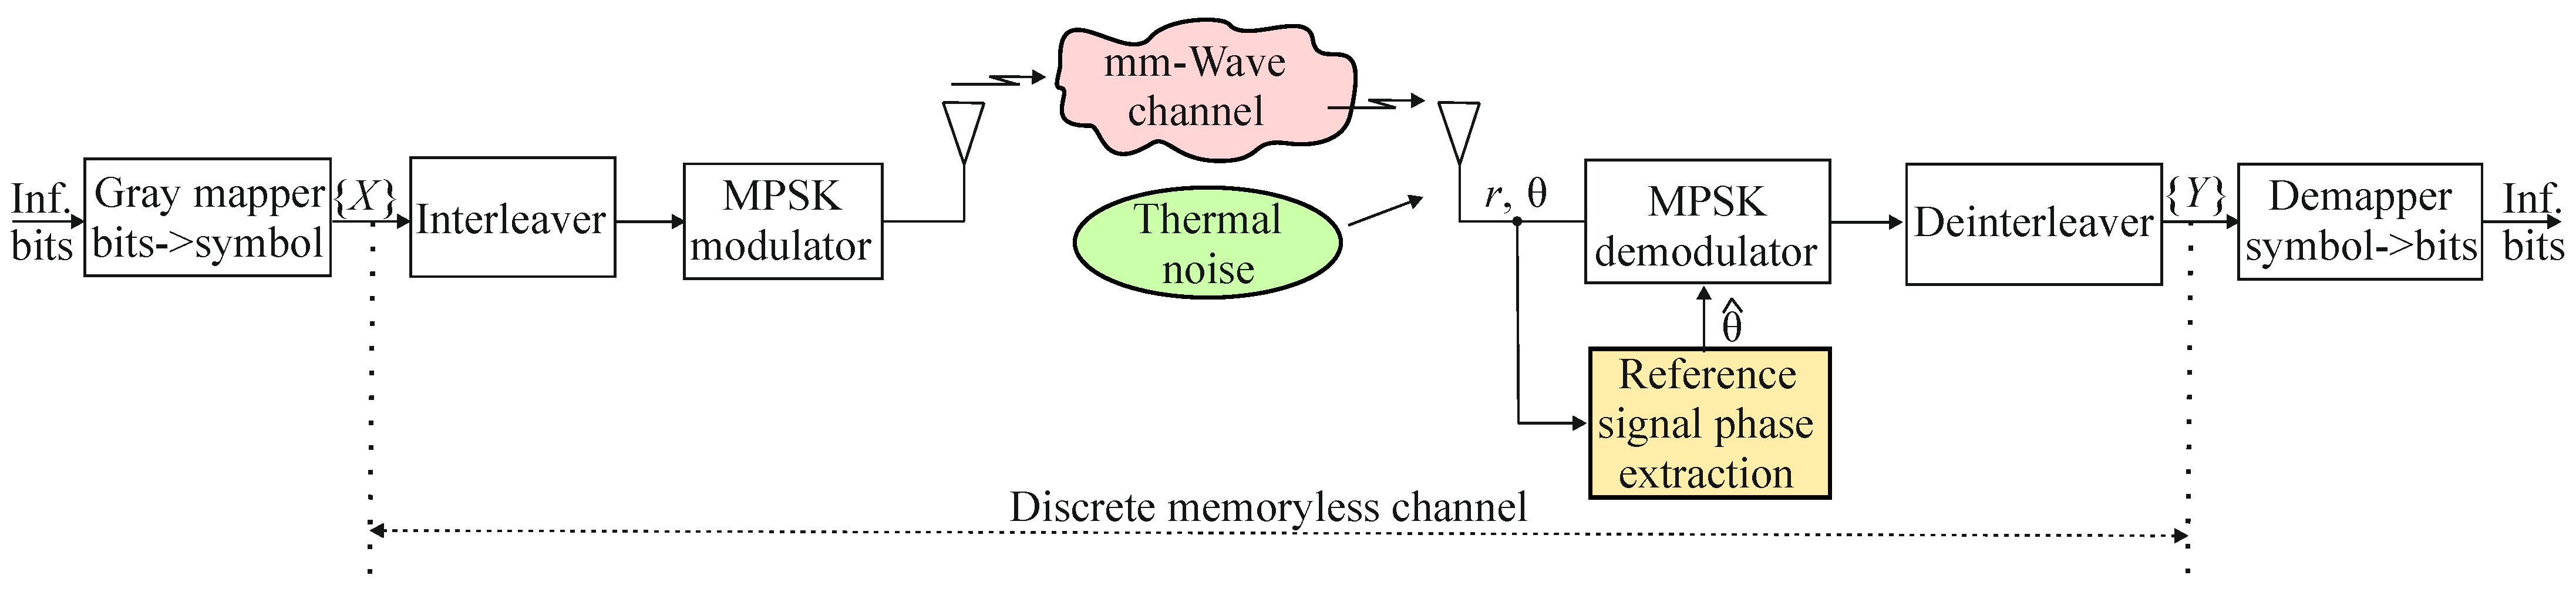
2. System Model
2.1. Transmitter
2.2. Channel
2.3. Receiver
3. Performance Evaluation
3.1. Error Probability
3.1.1. Analytical Approach
3.1.2. Numerical Approach
3.1.3. Monte Carlo Simulations
3.2. Mutual Information
4. Results and Discussion
5. Conclusions
Author Contributions
Funding
Institutional Review Board Statement
Data Availability Statement
Acknowledgments
Conflicts of Interest
Abbreviations
| MPSK | Multilevel phase shift keying |
| TWDP | Two-Wave Diffuse-Power |
| QoS | Quality-of-service |
| PLL | Phase-locked loop |
| AWGN | Additive white Gaussian noise |
| SNR | Signal-to-noise ratio |
| MGF | Moment-generating function |
| VCO | Voltage controlled oscillator |
| Probability density function | |
| BER | Bit error rate |
| SER | Symbol error rate |
| BPSK | Binary phase shift keying |
| QPSK | Quaternary phase shift keying |
| PSK | Phase shift keying |
| FSM | Fourier Series Method |
References
- Sánchez, J.D.V.; Urquiza-Aguiar, L.; Paredes Paredes, M.C. Fading Channel Models for mm-Wave Communications. Electronics 2021, 10, 798. [Google Scholar] [CrossRef]
- Simon, M.K.; Alouini, M.S. Digital Communication over Fading Channels, 2nd ed.; John Wiley & Sons, Ltd.: New York, NY, USA, 2004. [Google Scholar] [CrossRef]
- Kostić, I.M. Average SEP for M-ary CPSK with noisy phase reference in Nakagami fading and Gaussian noise. Eur. Trans. Telecommun. 2007, 18, 109–113. [Google Scholar] [CrossRef]
- Marjanović, Z.M.; Djordjević, G.T.; Milovanović, G.V. Truncation error analysis in computing of SEP and SEP floor for partially coherent receiver of MPSK signals over composite fading channels. J. Frankl. Inst. 2018, 355, 965–980. [Google Scholar] [CrossRef]
- Smadi, M.A.; Prabhu, V.K. Performance analysis of generalized-faded coherent PSK channels with equal-gain combining and carrier phase error. IEEE Trans. Wirel. Commun. 2006, 5, 509–513. [Google Scholar] [CrossRef]
- Lindsey, W.C.; Simon, M.K. Telecommunication Systems Engineering; Courier Corporation: North Chelmsford, MA, USA, 1991. [Google Scholar]
- Durgin, G.D.; Rappaport, T.S.; De Wolf, D.A. New analytical models and probability density functions for fading in wireless communications. IEEE Trans. Commun. 2002, 50, 1005–1015. [Google Scholar] [CrossRef]
- Kim, D.; Lee, H.; Kang, J. Comprehensive analysis of the impact of TWDP fading on the achievable error rate performance of BPSK signaling. IEICE Trans. Commun. 2017, 101, 500–507. [Google Scholar] [CrossRef]
- Rao, M.; Lopez-Martinez, F.J.; Goldsmith, A. Statistics and system performance metrics for the two wave with diffuse power fading model. In Proceedings of the 2014 48th Annual Conference on Information Sciences and Systems (CISS), Princeton, NJ, USA, 19–21 March 2014; pp. 1–6. [Google Scholar] [CrossRef]
- Rao, M.; Lopez-Martinez, F.J.; Alouini, M.S.; Goldsmith, A. MGF approach to the analysis of generalized two-ray fading models. IEEE Trans. Wirel. Commun. 2015, 14, 2548–2561. [Google Scholar] [CrossRef]
- Maric, A.; Kaljic, E.; Njemcevic, P. An alternative statistical characterization of TWDP fading model. Sensors 2021, 21, 7513. [Google Scholar] [CrossRef] [PubMed]
- Njemcevic, P.; Kaljic, E.; Maric, A. Moment-Based Parameter Estimation for the Γ-Parameterized TWDP Model. Sensors 2022, 22, 774. [Google Scholar] [CrossRef]
- Zöchmann, E.; Caban, S.; Mecklenbräuker, C.F.; Pratschner, S.; Lerch, M.; Schwarz, S.; Rupp, M. Better than Rician: Modelling millimetre wave channels as two-wave with diffuse power. EURASIP J. Wirel. Commun. Netw. 2019, 2019, 21. [Google Scholar] [CrossRef]
- Kostic, I. Envelope probability density function of the sum of signal, noise and interference. Electron. Lett. 1978, 14, 490–491. [Google Scholar] [CrossRef]
- Cover, T.M.; Thomas, J.A. Elements of Information Theory (Wiley Series in Telecommunications and Signal Processing), 2nd ed.; John Wiley & Sons, Ltd.: New York, NY, USA, 2006. [Google Scholar] [CrossRef]
- Ivaniš, P.; Drajić, D. Information Theory and Coding-Solved Problems; Springer: New York, NY, USA, 2017. [Google Scholar] [CrossRef]
- Baig, I.; Farooq, U.; Hasan, N.U.; Zghaibeh, M.; Jeoti, V. A multi-carrier waveform design for 5G and beyond communication systems. Mathematics 2020, 8, 1466. [Google Scholar] [CrossRef]
- Gradshteyn, I.S.; Ryzhik, I.M. Table of Integrals, Series, and Products, 6th ed.; Academic Press: San Diego, CA, USA, 2000. [Google Scholar]
- Kostic, I. Cumulative distribution function of envelope of sum of signal, noise and interference. In Proceedings of the Telecommunication Forum (TELFOR), Belgrade, Yugoslavia, 26–28 November 1996; pp. 301–303. [Google Scholar]
- Marjanovic, Z.; Milic, D.N.; Djordjevic, G.T. Estimation of Truncation Error in Statistical Description of Communication Signals over mm-Wave Channels. Axioms 2022, 11, 569. [Google Scholar] [CrossRef]
- Wolfram Research, Inc. The Mathematical Functions Site. 1998–2023. Available online: http://functions.wolfram.com (accessed on 4 September 2023).
- Erldelyi, A.; Magnus, W.; Oberhettinger, F.; Tricomi, F. Higher Transcendental Functions; McGraw-Hill: New York, NY, USA, 1955; Volume 2. [Google Scholar]
- Olver, F.W.J.; Olde Daalhuis, A.B.; Lozier, D.W.; Schneider, B.I.; Boisvert, R.F.; Clark, C.W.; Miller, B.R.; Saunders, B.V.; Cohl, H.S.; McClain, M.A. (Eds.) NIST Digital Library of Mathematical Functions. Available online: http://dlmf.nist.gov/ (accessed on 4 September 2023).
- Prabhu, V. PSK performance with imperfect carrier phase recovery. IEEE Trans. Aerosp. Electron. Syst. 1976, AES-12, 275–286. [Google Scholar] [CrossRef]
- Milovanovic, G.; Djordjevic, R. Mathematical Analysis I; Faculty of Electronic Engineering, University of Nis: Nis, Serbia, 2005. [Google Scholar]
- Press, W.H.; Teukolsky, S.A.; Vetterling, W.T.; Flannery, B.P. Numerical Recipes: The Art of Scientific Computing, 3rd ed.; Cambridge University Press: Cambridge, MA, USA, 2007. [Google Scholar]
- Jeruchim, M.C.; Balaban, P.; Shanmugan, K.S. Simulation of Communication Systems: Modeling, Methodology and Techniques; Springer Science & Business Media: Berlin/Heidelberg, Germany, 2000. [Google Scholar] [CrossRef]


Disclaimer/Publisher’s Note: The statements, opinions and data contained in all publications are solely those of the individual author(s) and contributor(s) and not of MDPI and/or the editor(s). MDPI and/or the editor(s) disclaim responsibility for any injury to people or property resulting from any ideas, methods, instructions or products referred to in the content. |
© 2023 by the authors. Licensee MDPI, Basel, Switzerland. This article is an open access article distributed under the terms and conditions of the Creative Commons Attribution (CC BY) license (https://creativecommons.org/licenses/by/4.0/).
Share and Cite
Djordjevic, G.T.; Milic, D.N.; Vasic, B.; Makal, J.; Vasic, B. On the Effect of Imperfect Reference Signal Phase Recovery on Performance of PSK System Influenced by TWDP Fading. Entropy 2023, 25, 1341. https://doi.org/10.3390/e25091341
Djordjevic GT, Milic DN, Vasic B, Makal J, Vasic B. On the Effect of Imperfect Reference Signal Phase Recovery on Performance of PSK System Influenced by TWDP Fading. Entropy. 2023; 25(9):1341. https://doi.org/10.3390/e25091341
Chicago/Turabian StyleDjordjevic, Goran T., Dejan N. Milic, Bata Vasic, Jarosław Makal, and Bane Vasic. 2023. "On the Effect of Imperfect Reference Signal Phase Recovery on Performance of PSK System Influenced by TWDP Fading" Entropy 25, no. 9: 1341. https://doi.org/10.3390/e25091341