
Deep Learning in Precision Agriculture: Artificially Generated VNIR Images Segmentation for Early Postharvest Decay Prediction in Apples

 , , ,
, , ,
Abstract
:1. Introduction
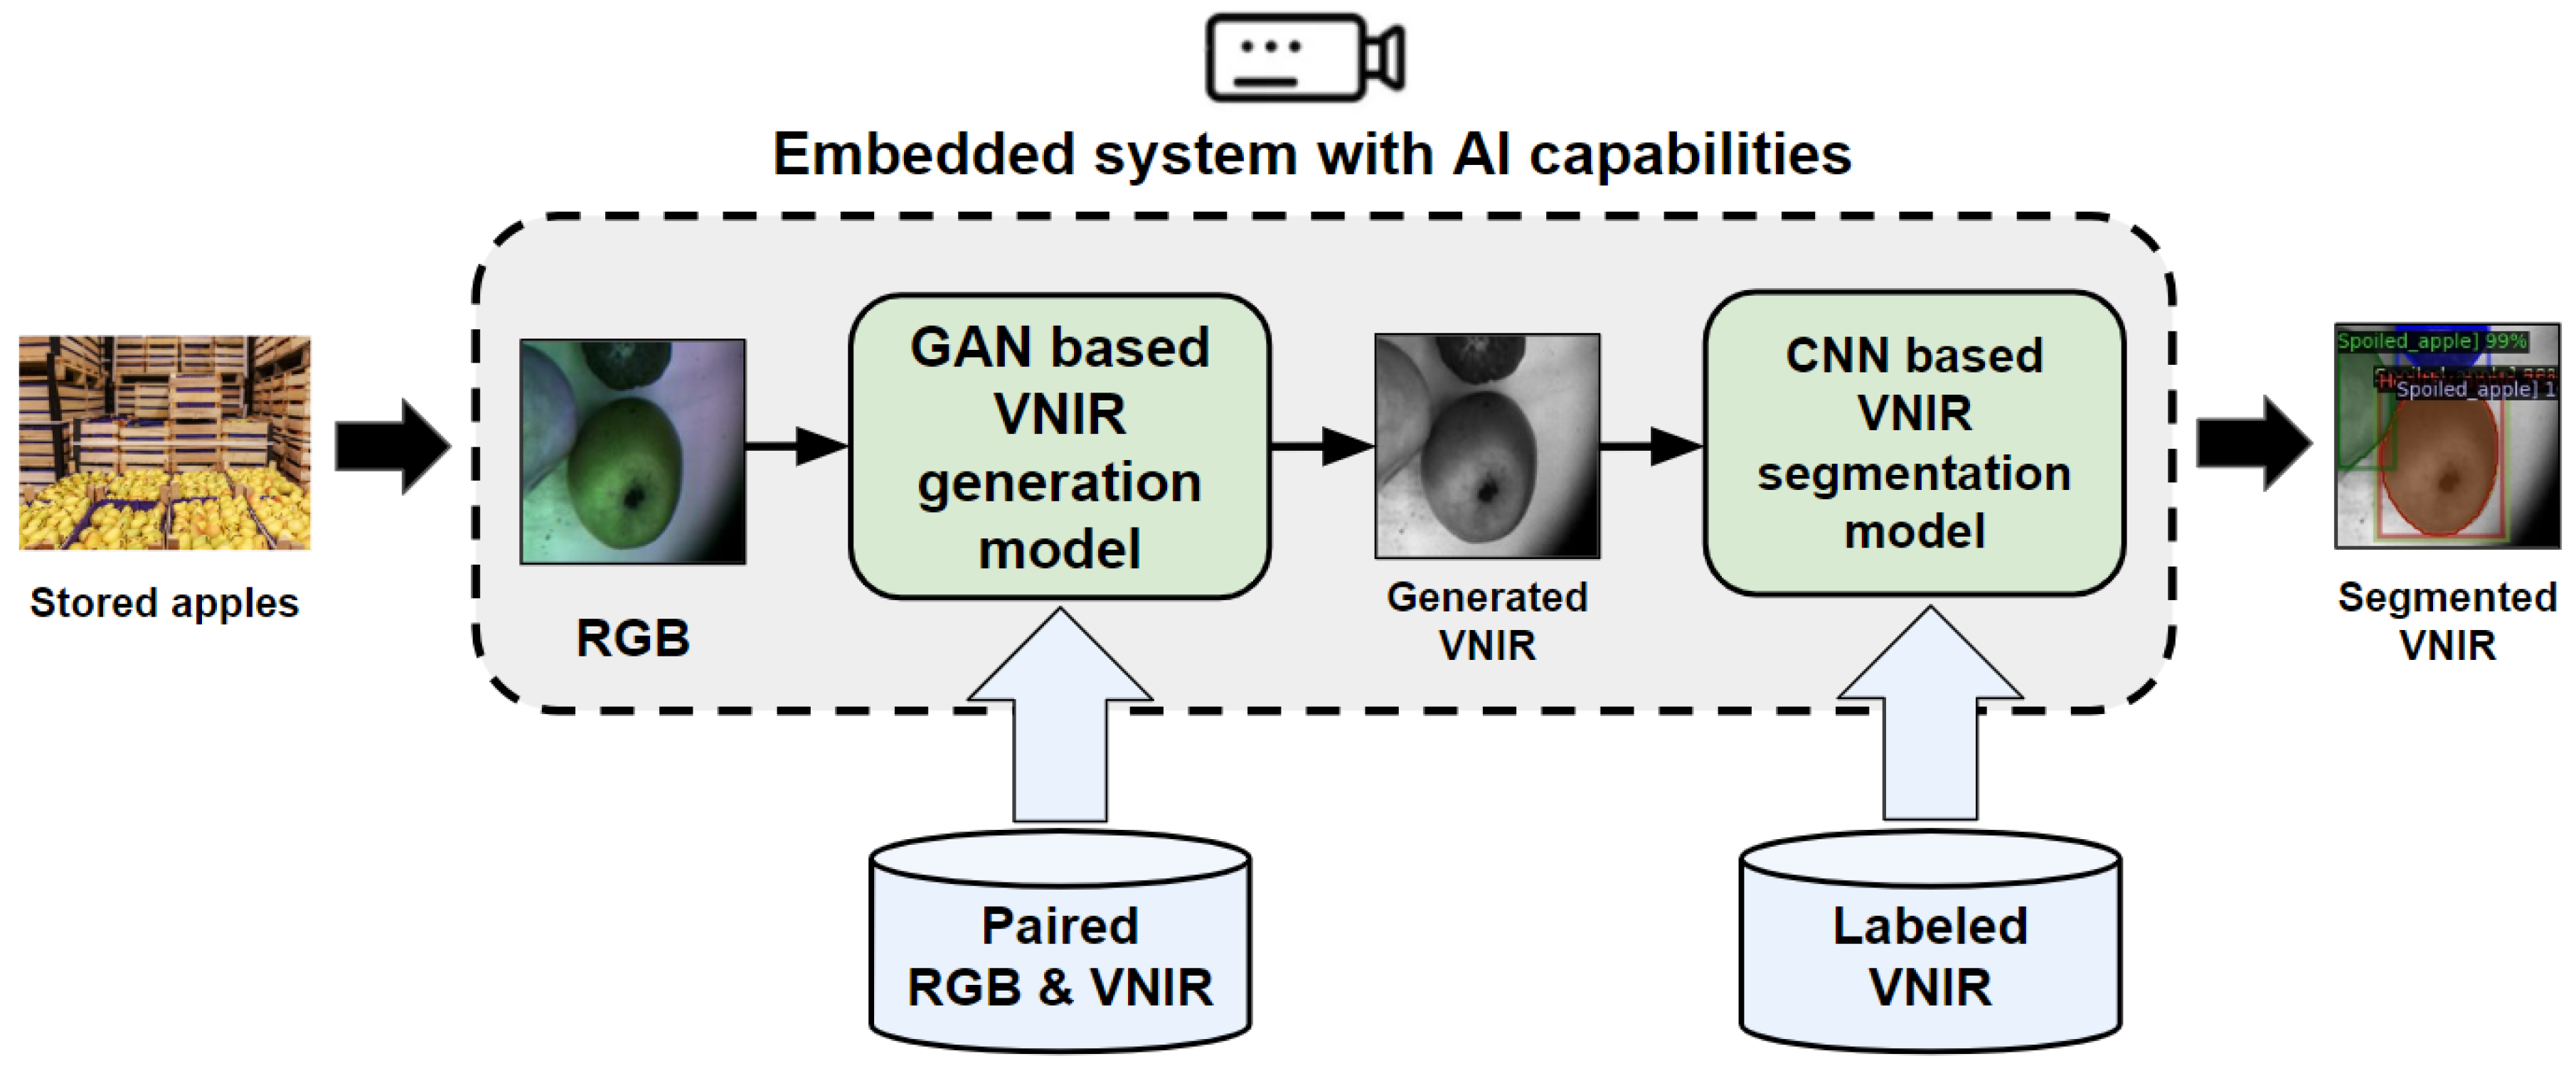
- Generation of VNIR imaging data containing the stored apples with postharvest decay and fungi zones using the GAN technique.
- Segmentation of generated VNIR images using the CNN technique in order to detect the decayed and fungi zones in the stored apples.
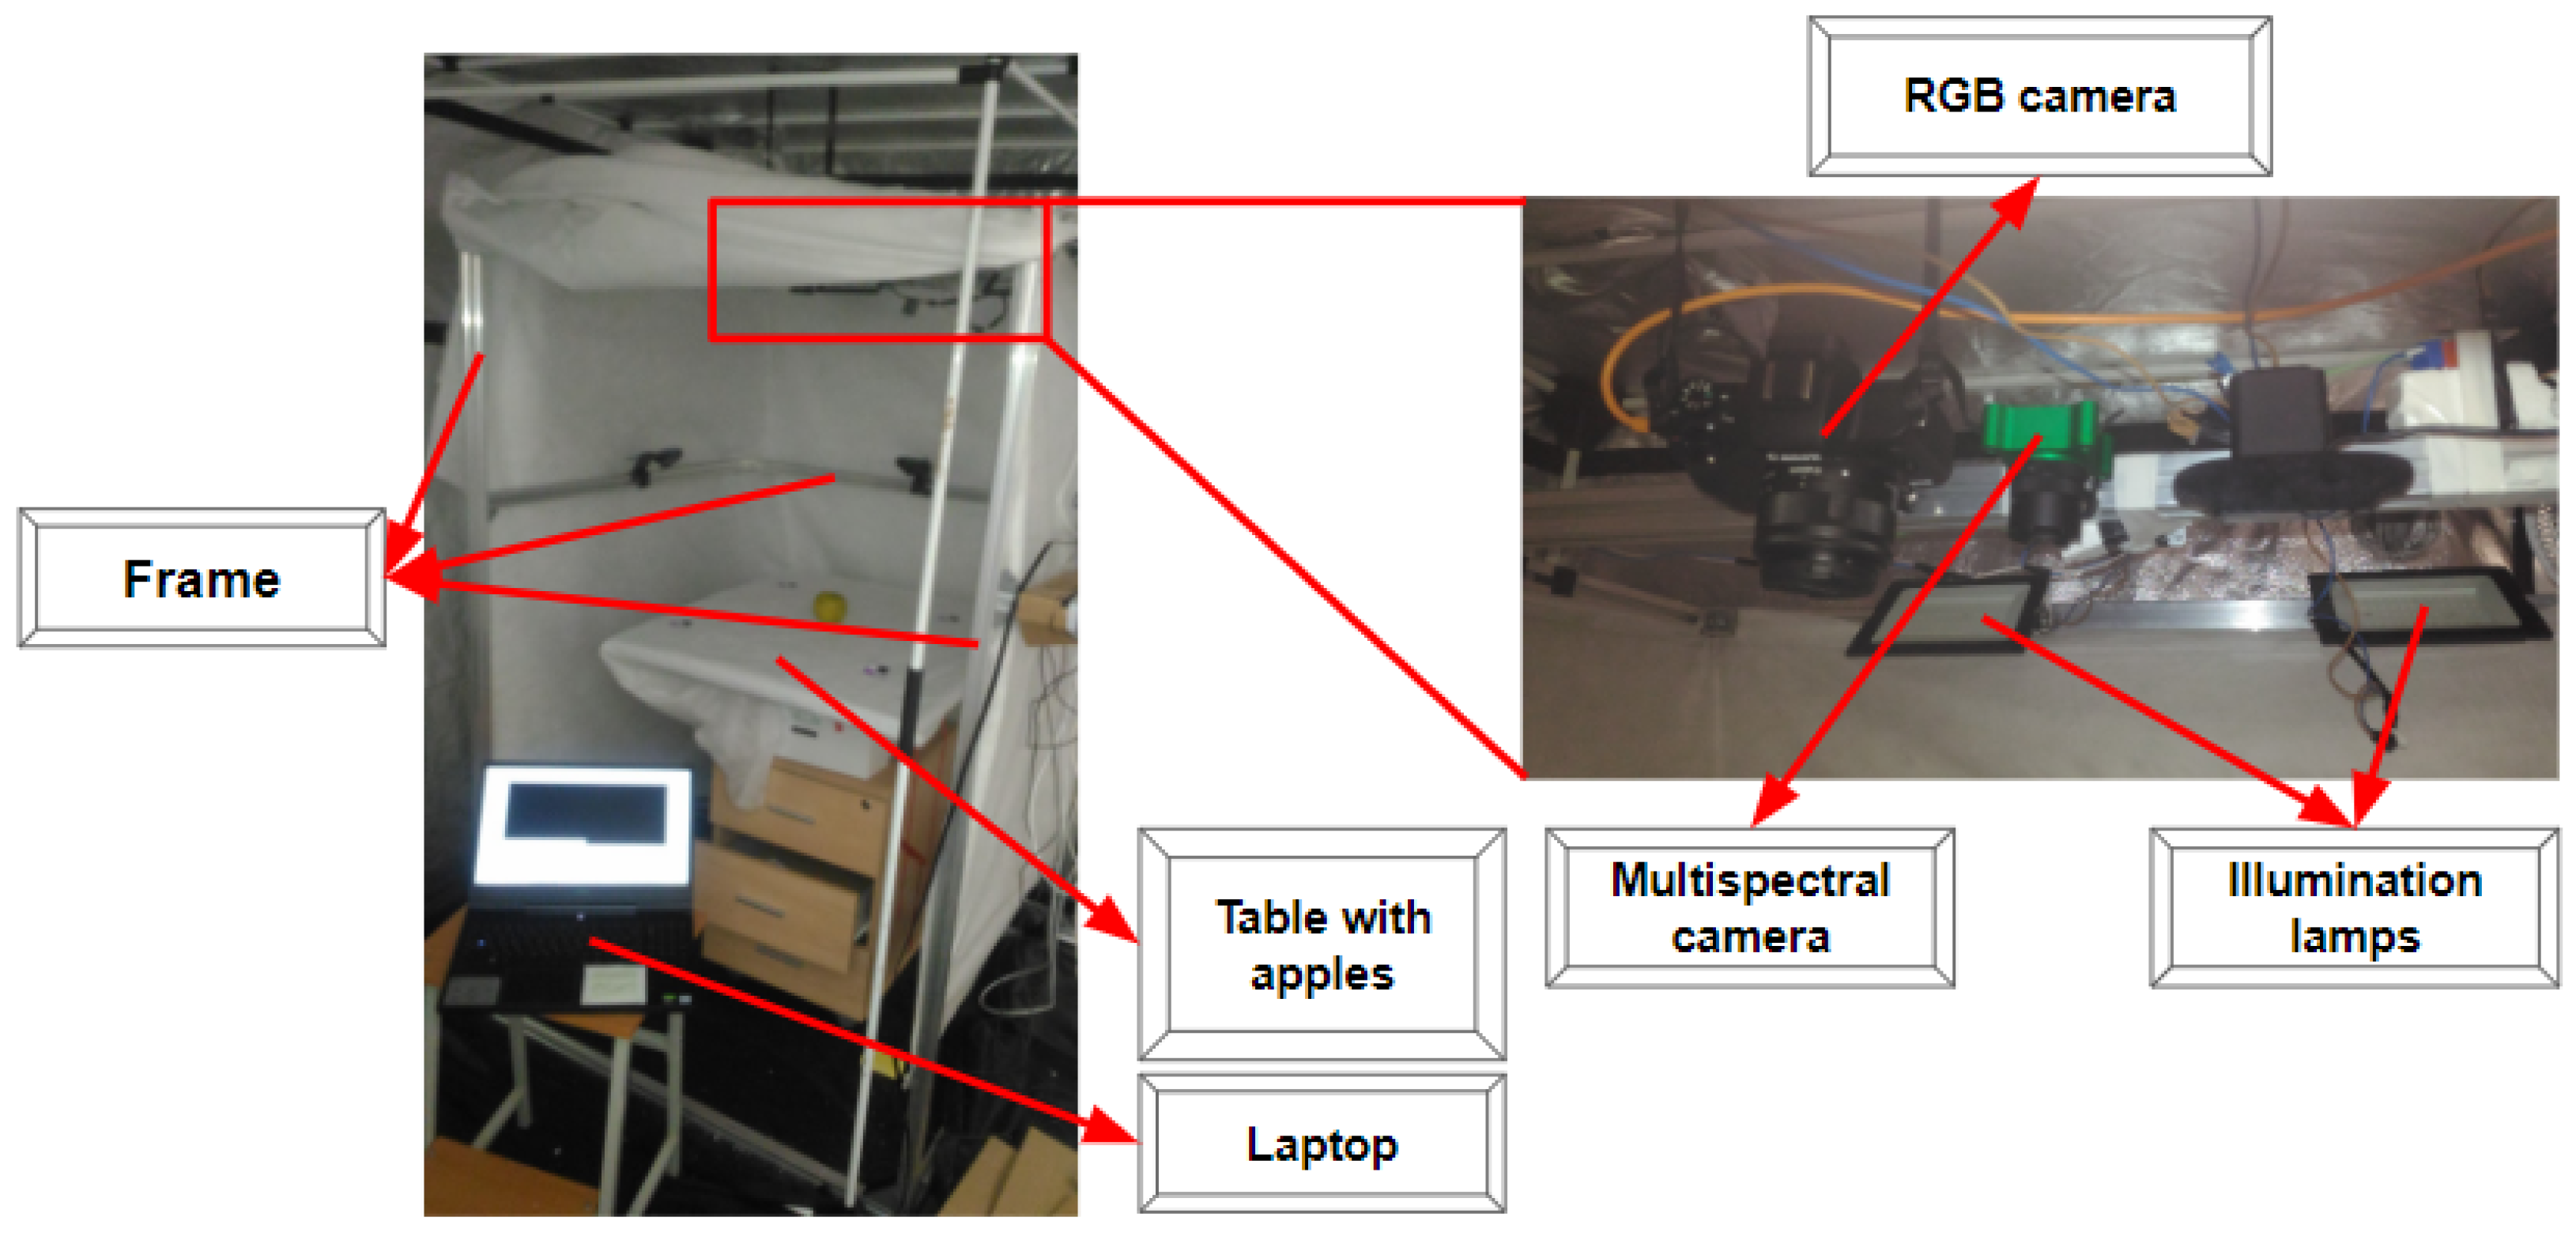
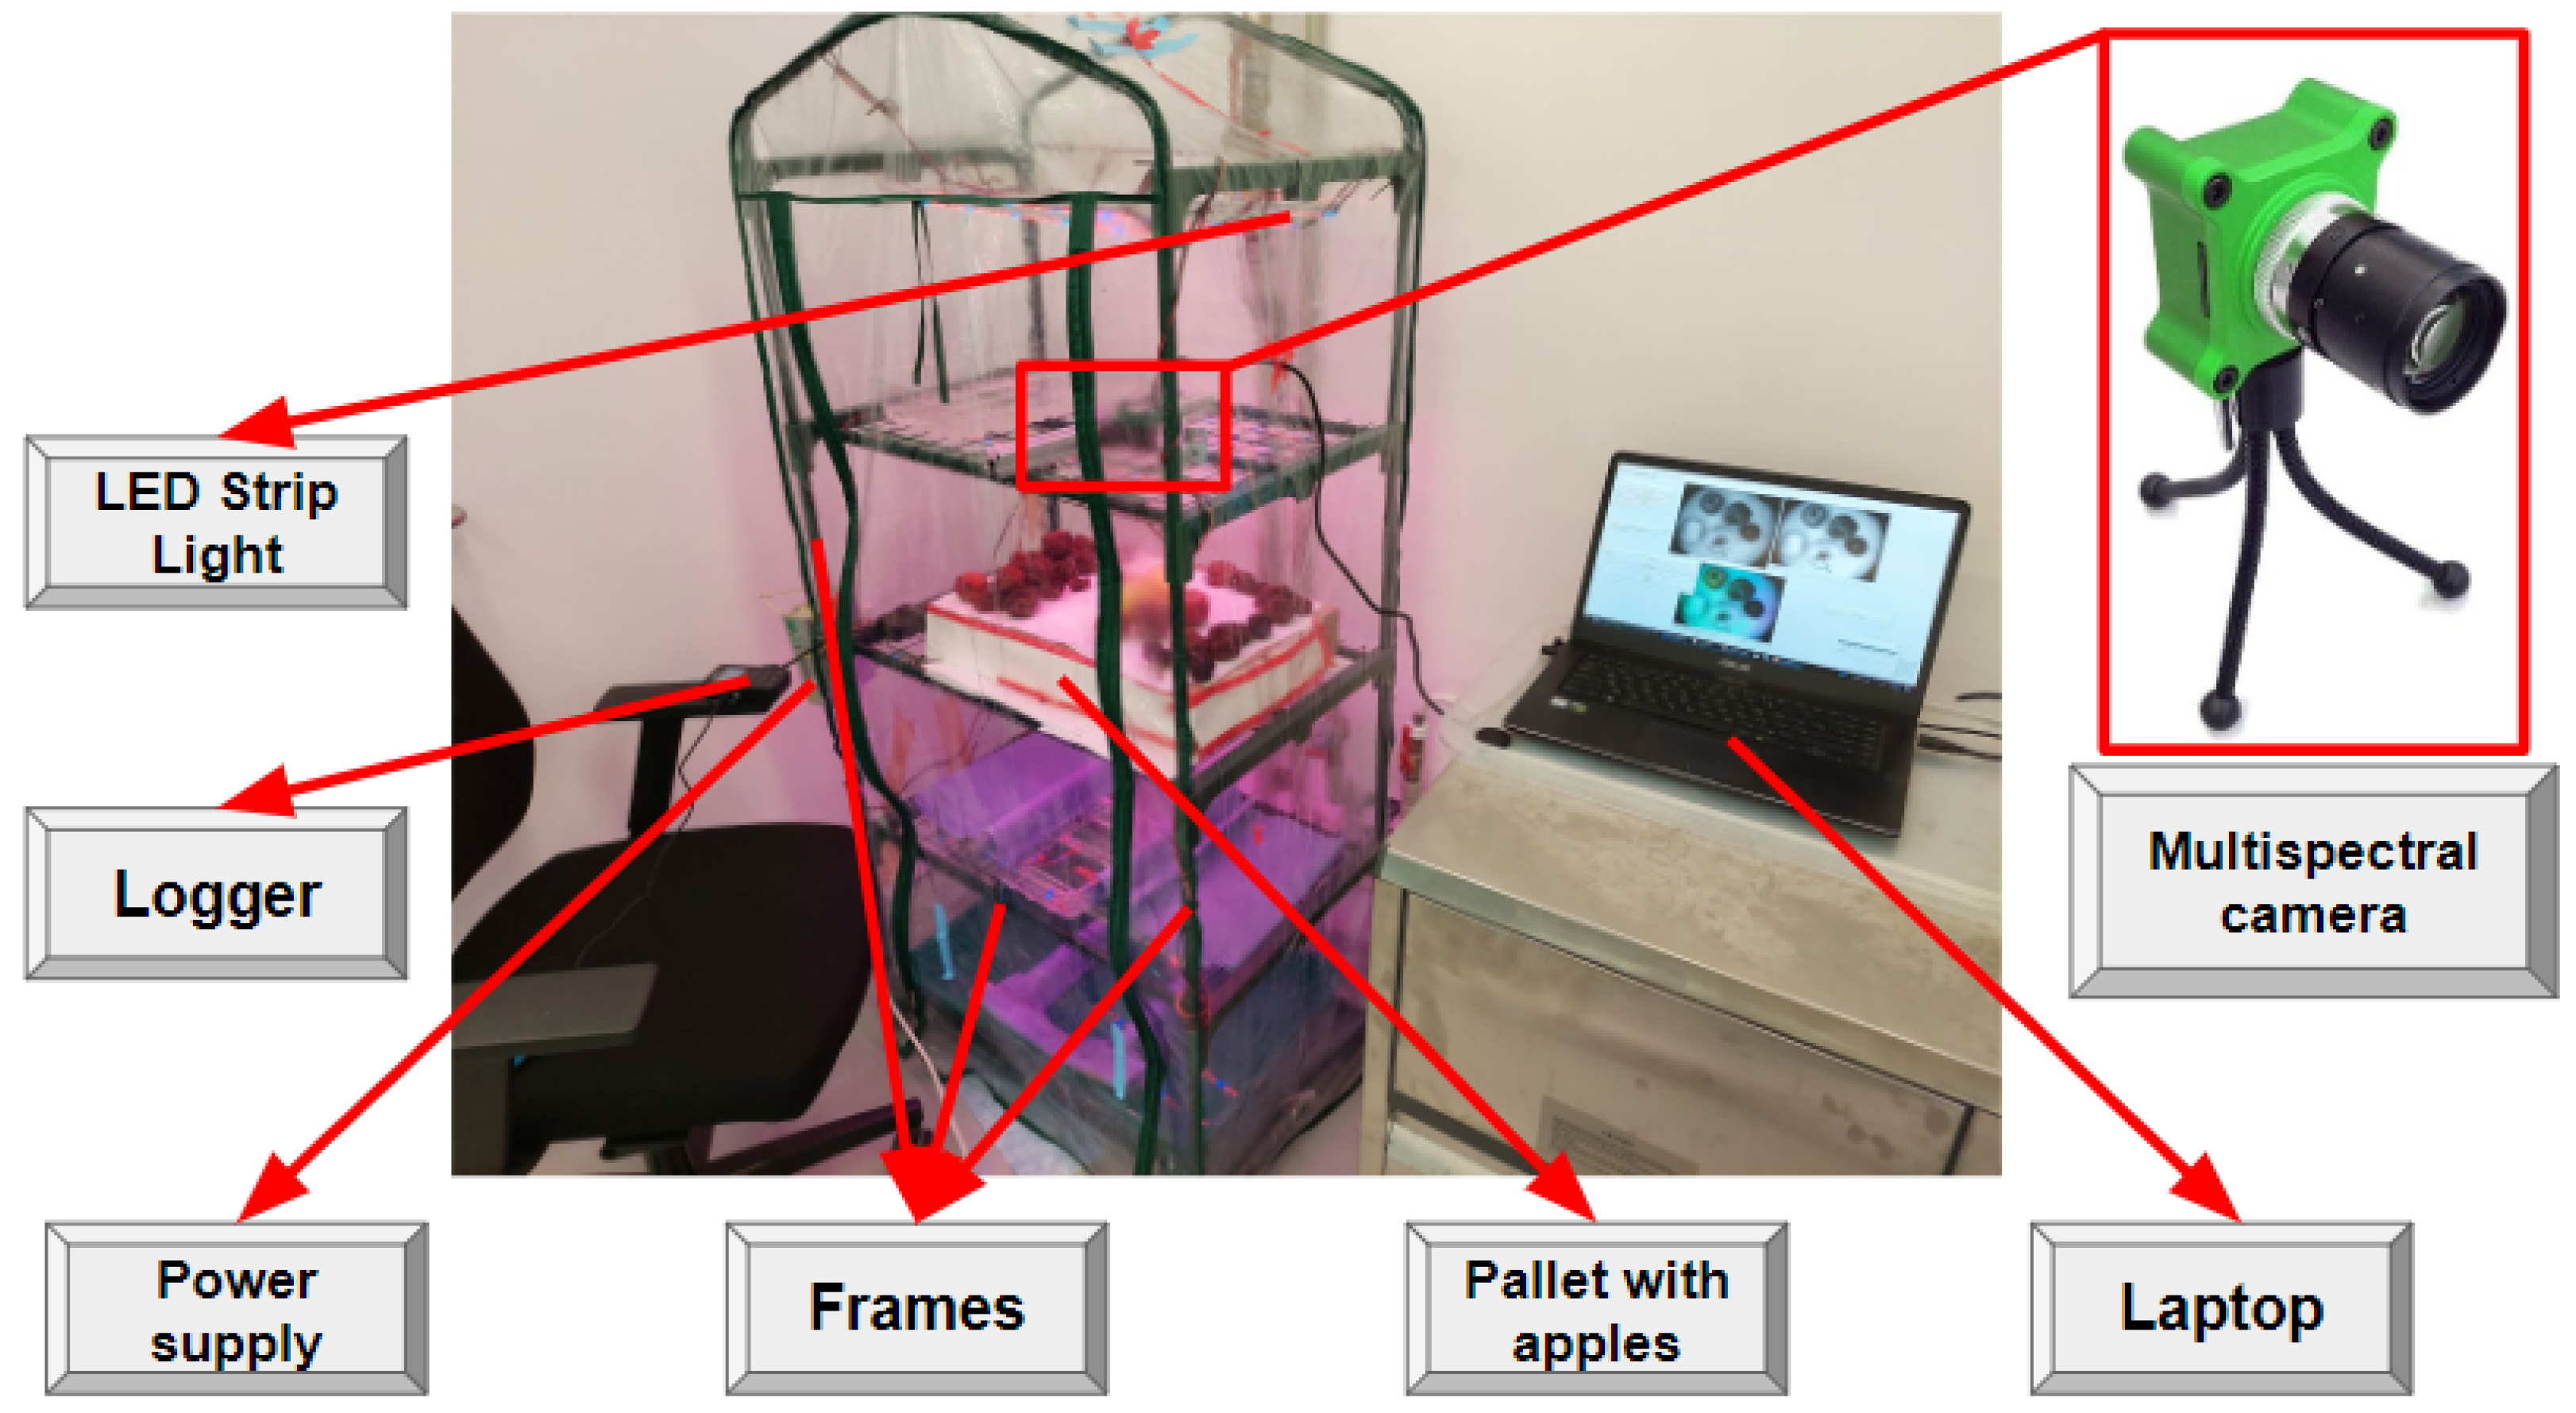
- Two experimental testbeds for paired RGB and VNIR imaging data collection under various environmental (temperature and humidity) conditions.
- Application of CNN models, for instance, on the segmentation of decayed and fungi areas in apples at the postharvest stage.
- Separate segmentation of fungi zones and postharvest decay areas in stored apples using the CNN model.
- Application of the trained CNN-based model for the instance segmentation of postharvest decay zones and fungi areas in VNIR images generated by the GAN-based model.
- Implementation of the proposed approach based on the GAN and CNN techniques for postharvest decay detection, segmentation and prediction using generated VNIR imaging data on a low-cost embedded system with the AI capabilities.
2. Related Works
2.1. CV Approaches Based on CNN Models Using RGB Imaging Data
2.2. Machine Learning and Deep Learning Methods for NIR Data Analysis
2.3. GAN-Based Models for RGB and NIR Data Analysis
3. Materials and Methods
3.1. DL Techniques
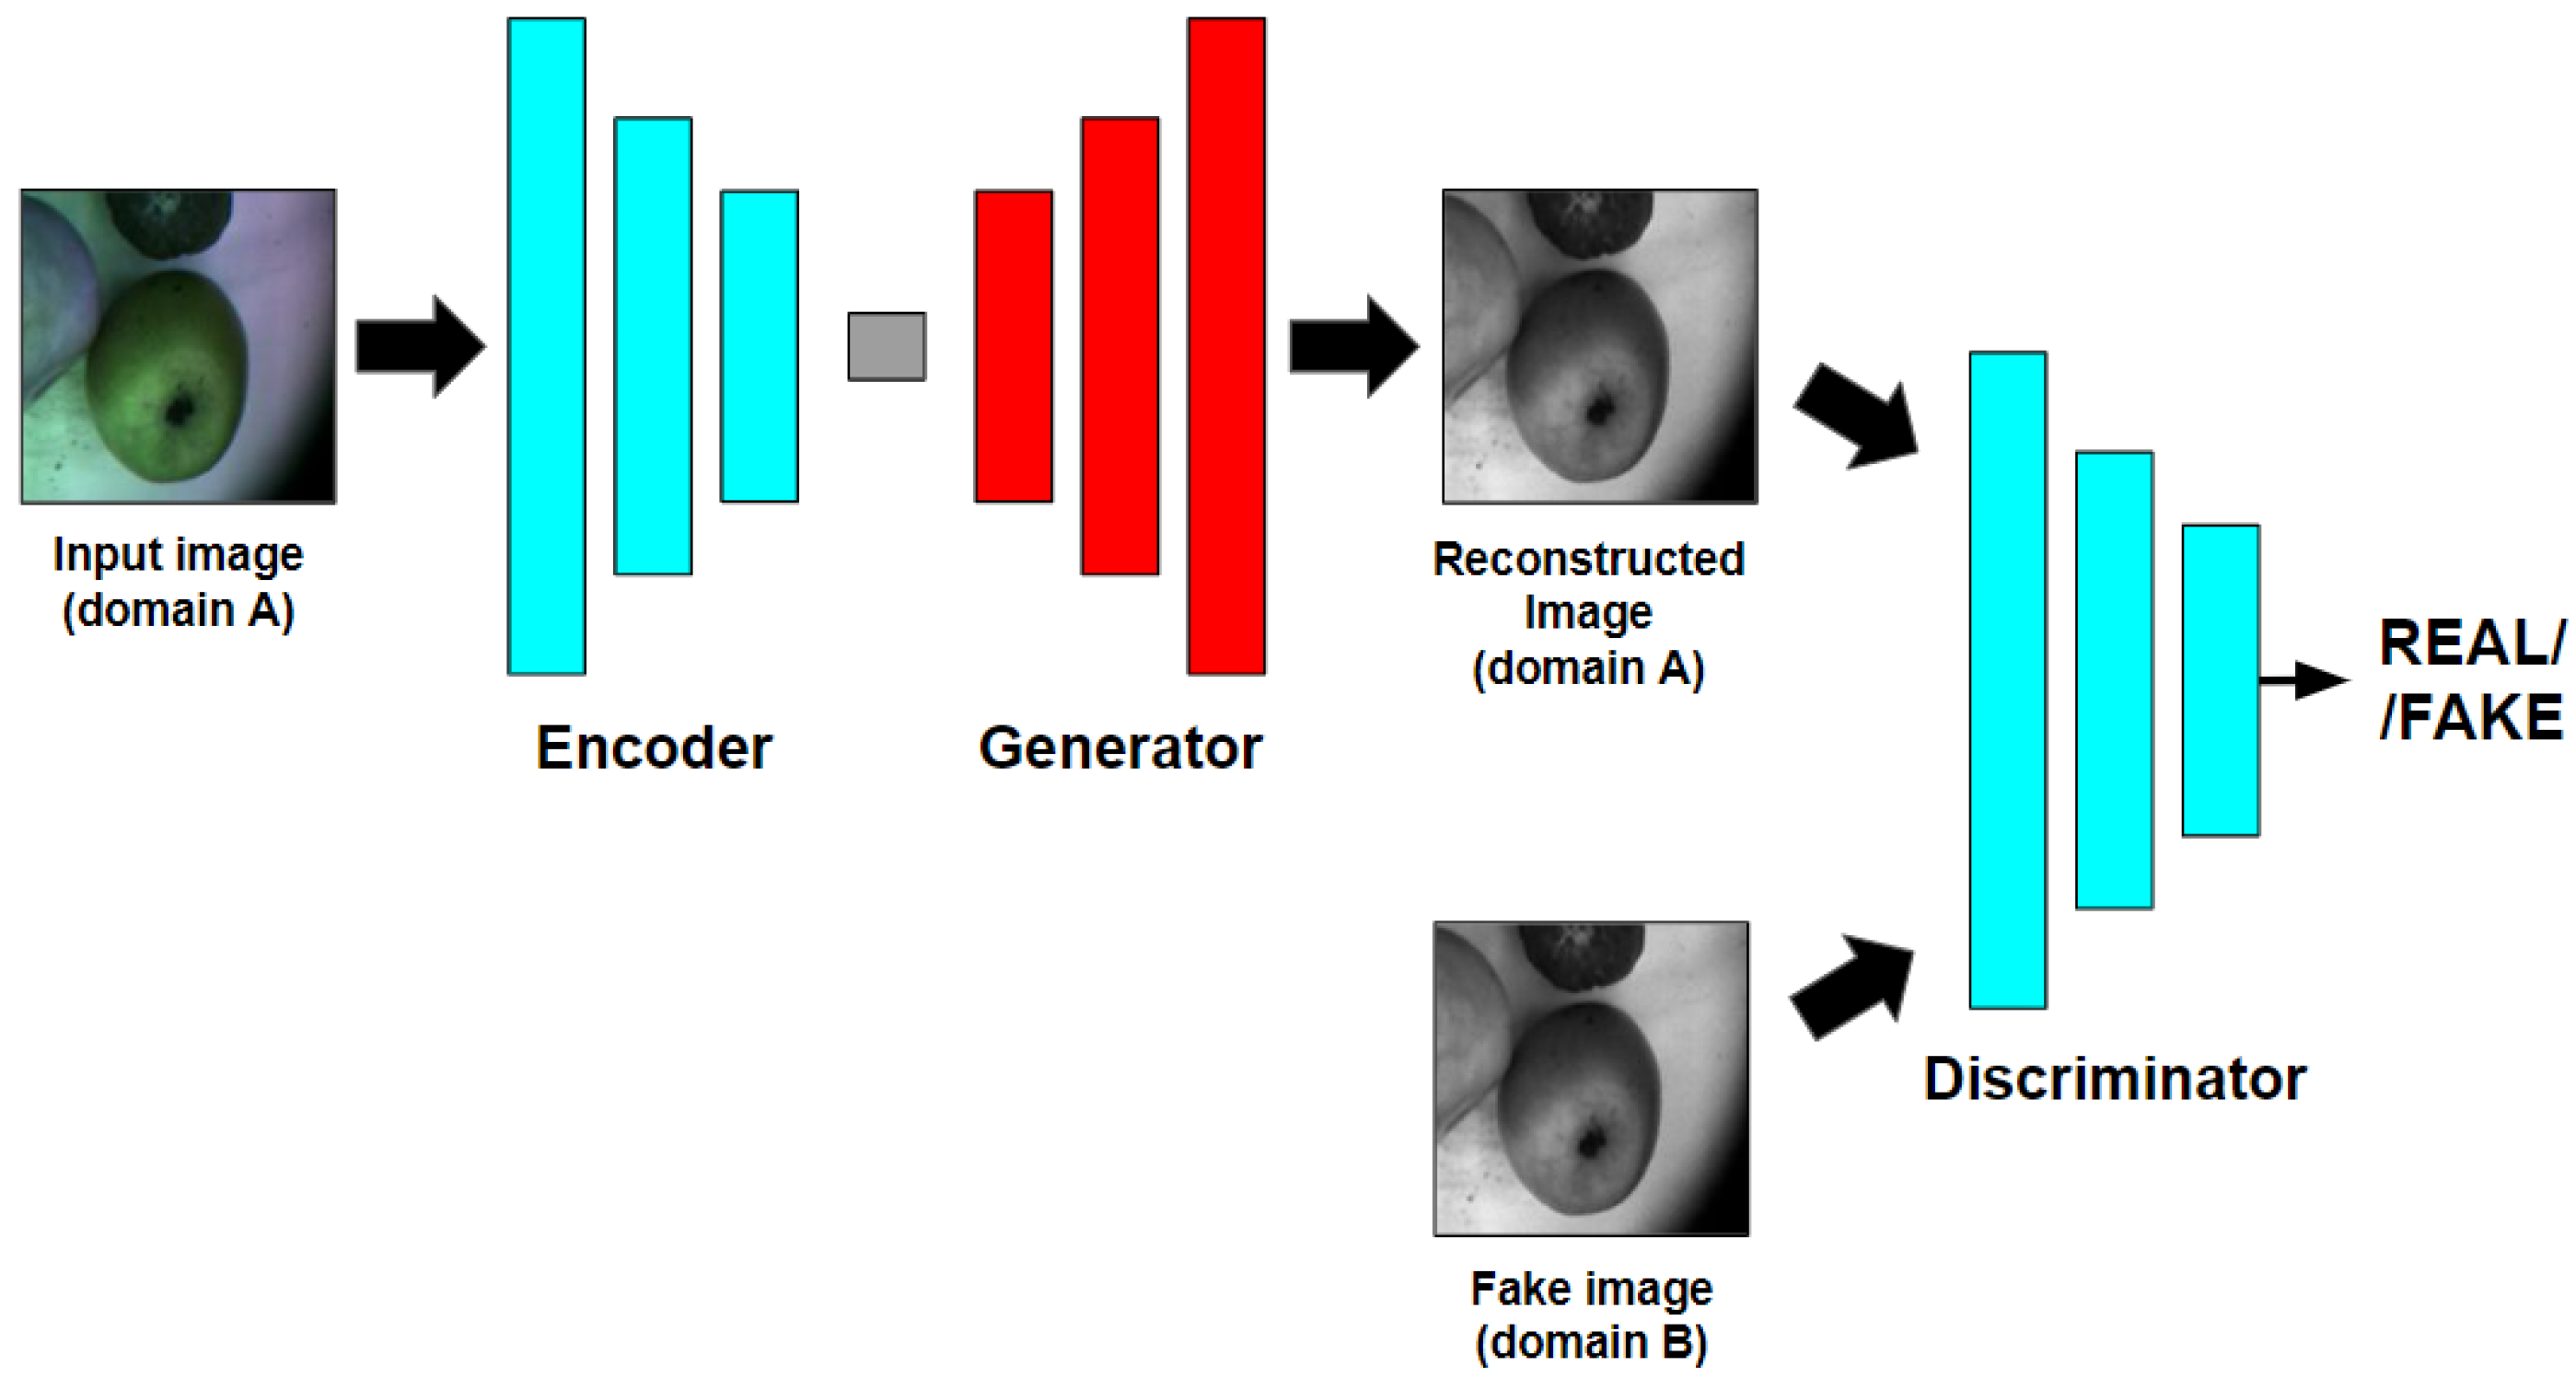
3.1.1. Pix2Pix
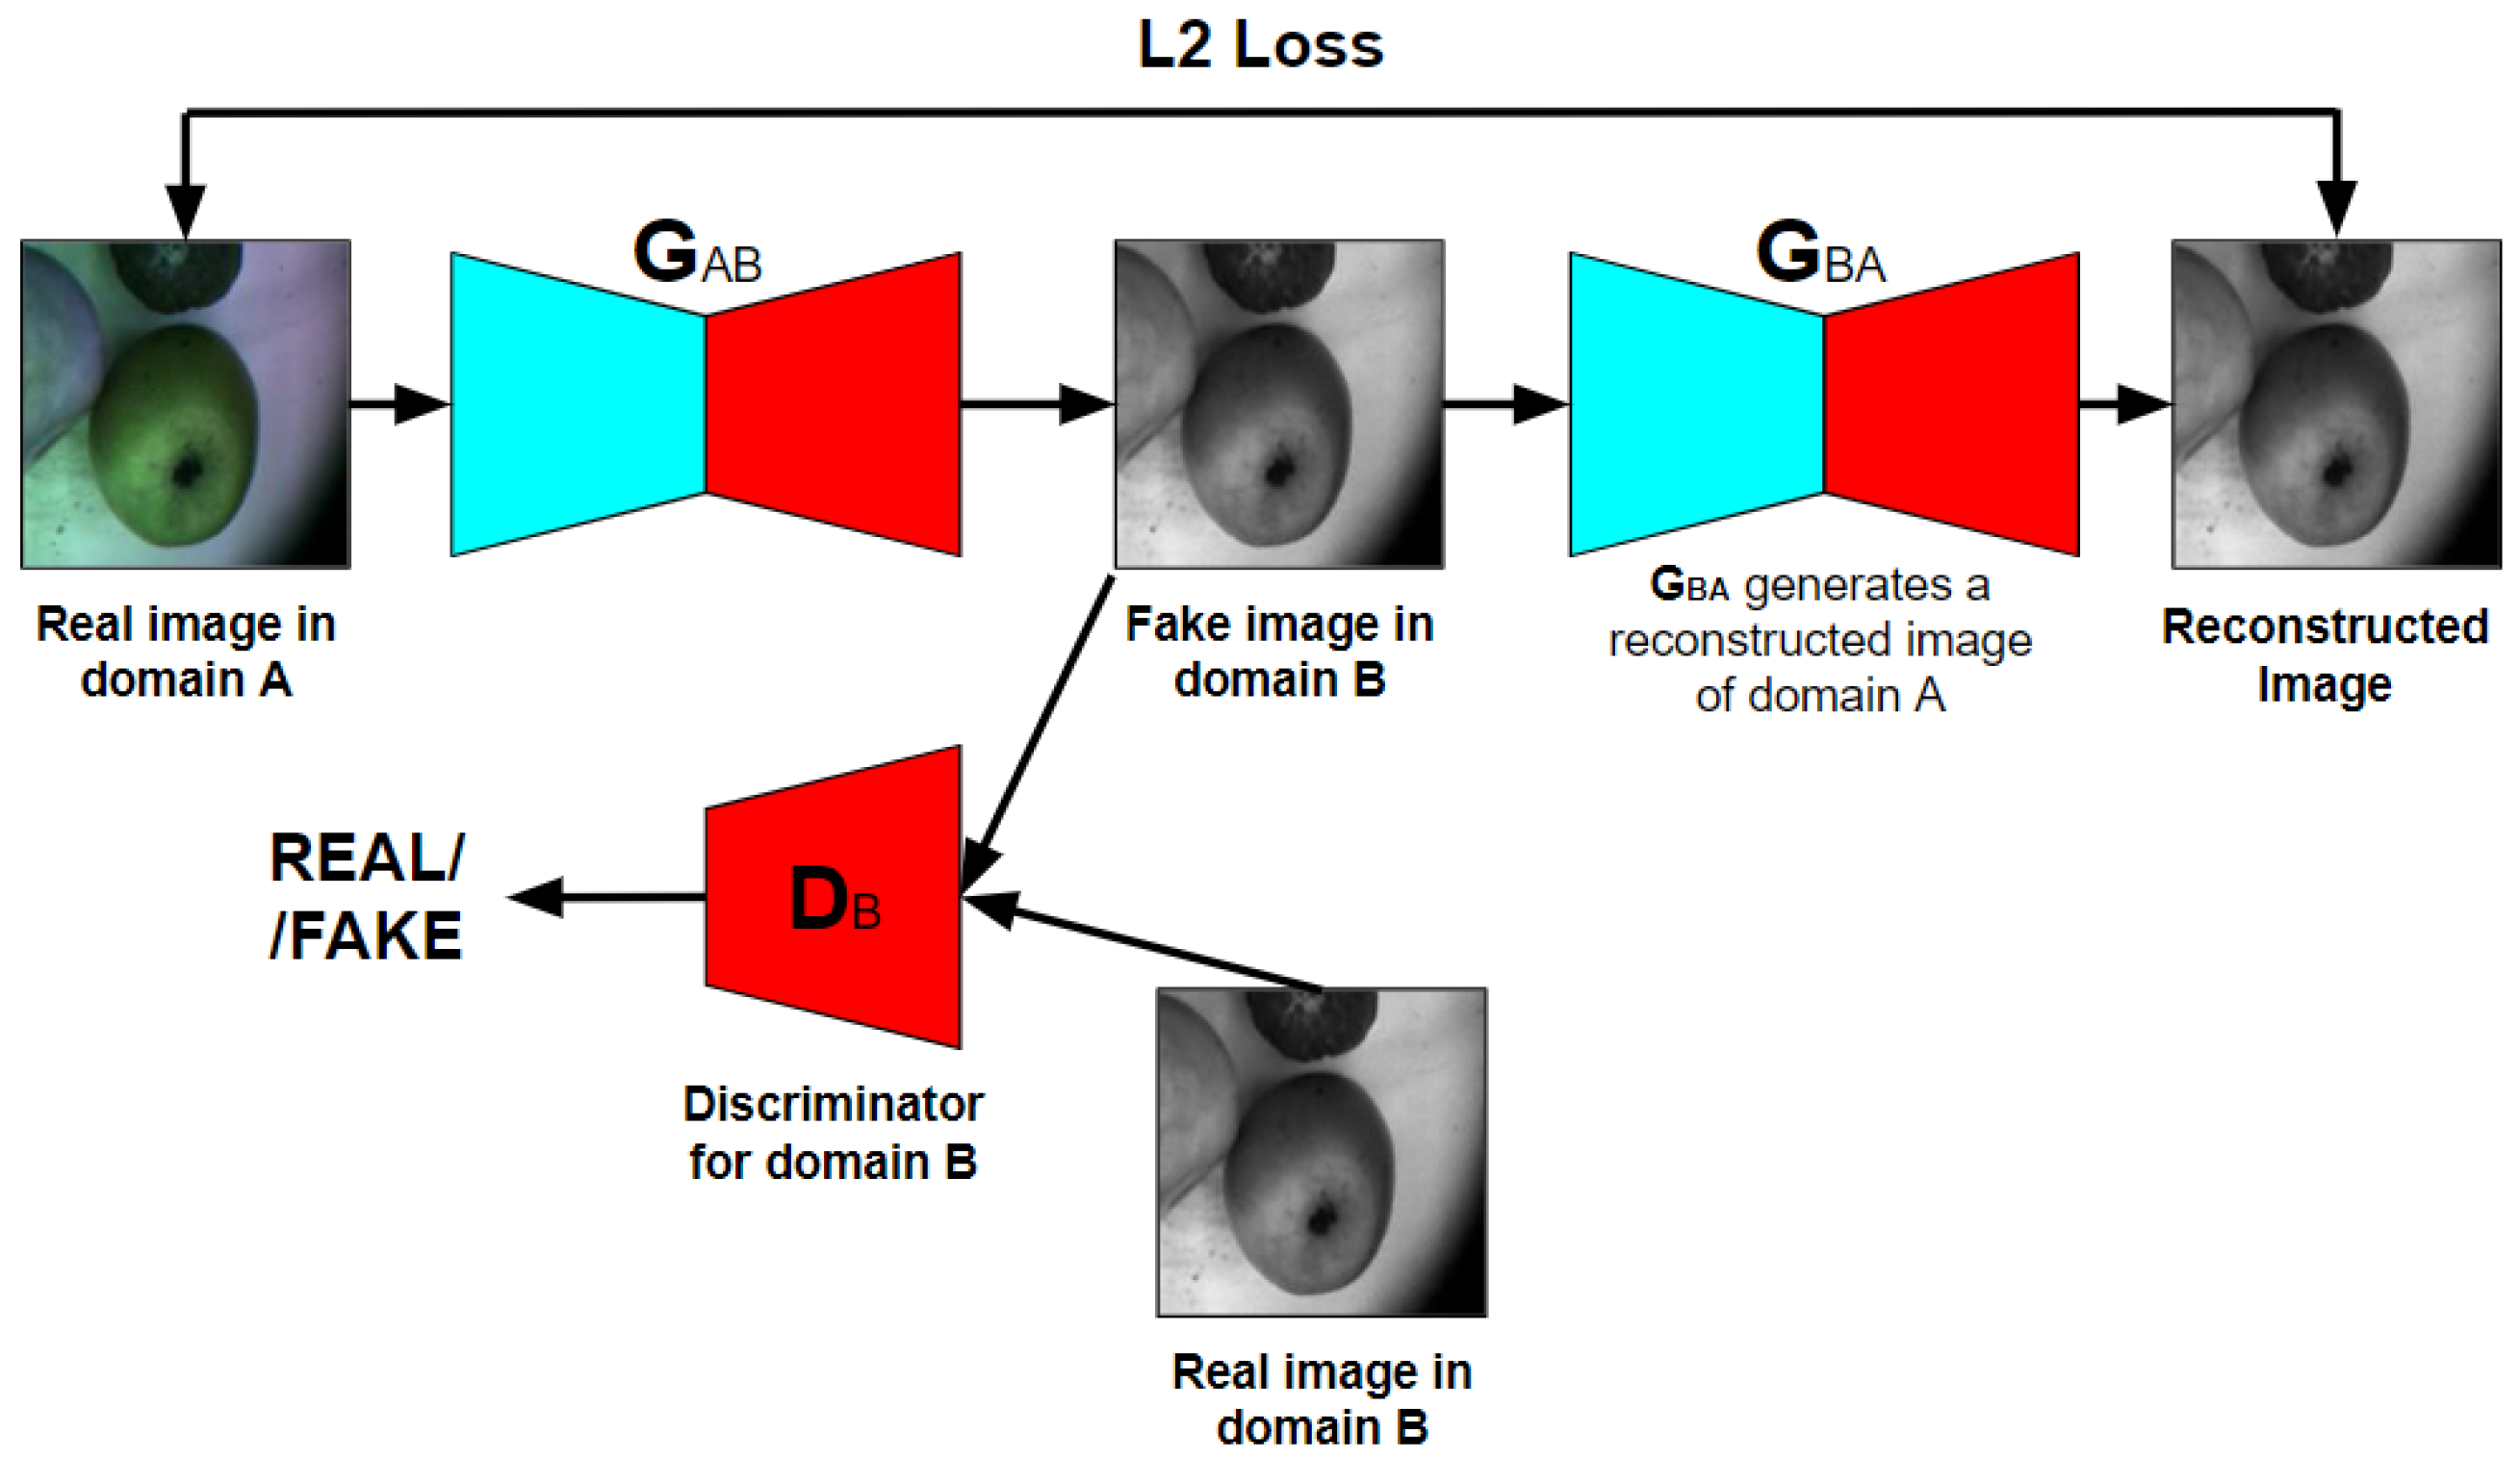
3.1.2. CycleGAN
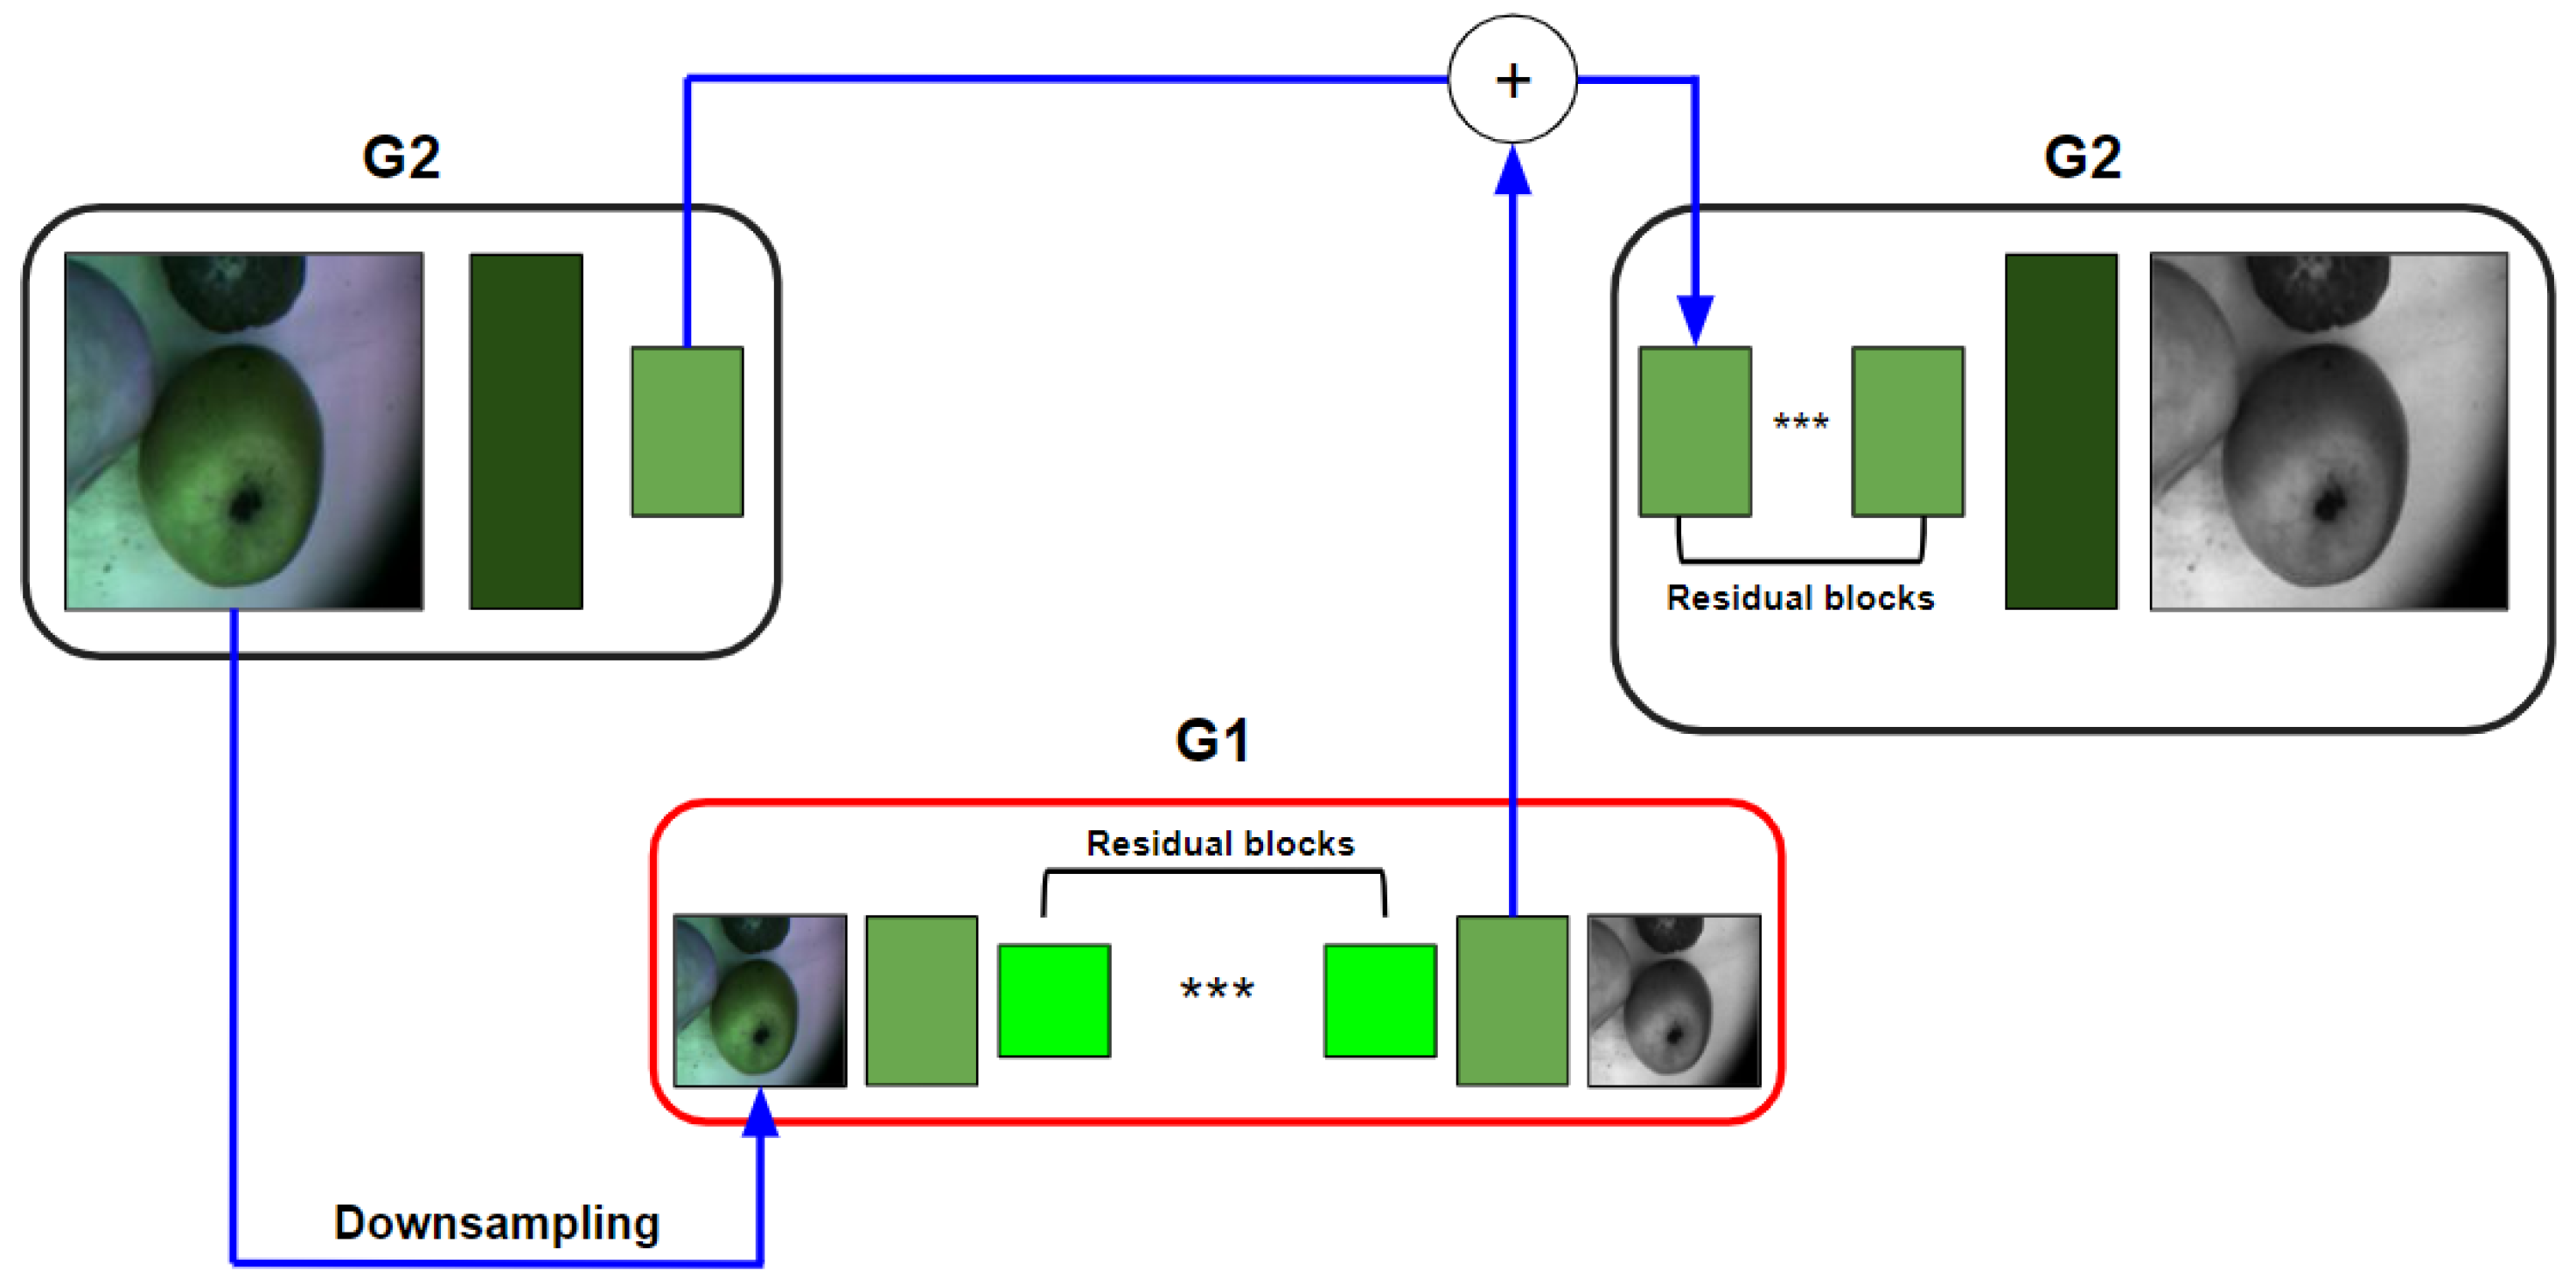
3.1.3. Pix2PixHD
3.1.4. Mask R-CNN
3.2. Performance Metrics
3.3. Experimental Testbeds and Data Acquisition
3.3.1. Experimental Testbed for Paired RGB and VNIR Imaging Data Collection
3.3.2. Experimental Testbed for VNIR Imaging Data Collection
3.4. Data Annotation
4. Results and Discussion
4.1. Image-to-Image Models Comparison for VNIR Images Generation from RGB
4.2. Segmentation of Generated VNIR Images for Early Postharvest Decay Detection in Apples
4.3. Early Postharvest Decay Detection in Stored Apples Using Generated VNIR Imaging Data on an Embedded System
4.4. Discussion
5. Conclusions
- The analysis of Pix2Pix, CycleGAN, and Pix2PixHD models, which are widely used GAN techniques, and their application to a dataset containing paired 1305 sequential RGB images and 1305 sequential VNIR images of stored apples of different varieties and various pre-treatments. The images were acquired under the full and partial illumination with the goal to simulate real storage conditions.
- Comparison of the real VNIR images with the VNIR images synthesized by selected GAN based models. The VNIR images generated via Pix2PixHD a 0.972 score for the SSIM metric.
- The training and test of Mask R-CNN on another dataset containing only 1029 sequential VNIR images of apples under violated storage conditions. Within this test, an F1-score of 58.861 is achieved for the postharvest decay zones and F1-score 40.968 for the fungal zones detection. The spoiled apples with the decayed and fungal zones are detected and segmented with F1-score 94.800.
- Testing of the proposed solution on an embedded system with AI capabilities. We used 100 RGB images of stored apples as an input data for NVIDIA Jetson Nano, and the time processing of VNIR images generation by Pix2PixHD showed 17 FPS. The detection and segmentation by Mask R-CNN achieved 0.42 FPS.
Author Contributions
Funding
Institutional Review Board Statement
Data Availability Statement
Conflicts of Interest
Abbreviations
| NIR | Near Infrared Image |
| VNIR | Visible Near Infrared Image |
| AI | Artificial Intelligence |
| CV | Computer Vision |
| ML | Machine Learning |
| SVM | Support Vector Machines |
| RF | Random Forest |
| kNN | K-Nearest Neighbors Algorithm |
| GTB | Gradient Tree Boosting |
| DL | Deep Learning |
| CNN | Convolutional Neural Network |
| GAN | Generative Adversarial Network |
| ROI | Regions of Interests |
| SBC | Single Board Computer |
| RH | Relative Humidity |
References
- United Nations Data about Current World Population. Available online: https://www.worldometers.info/world-population/ (accessed on 26 June 2023).
- United Nations Data on Current and Prospected World Population. Available online: https://population.un.org/wpp/Graphs/Probabilistic/POP/TOT/900 (accessed on 26 June 2023).
- Ullah, S.; Hashmi, M.; Lee, J.; Youk, J.H.; Kim, I.S. Recent Advances in Pre-harvest, Post-harvest, Intelligent, Smart, Active, and Multifunctional Food Packaging. Fibers Polym. 2022, 23, 2063–2074. [Google Scholar] [CrossRef]
- Coradi, P.C.; Maldaner, V.; Lutz, É.; da Silva Daí, P.V.; Teodoro, P.E. Influences of drying temperature and storage conditions for preserving the quality of maize postharvest on laboratory and field scales. Sci. Rep. 2020, 10, 22006. [Google Scholar] [CrossRef] [PubMed]
- Mohammed, M.; Alqahtani, N.; El-Shafie, H. Development and evaluation of an ultrasonic humidifier to control humidity in a cold storage room for postharvest quality management of dates. Foods 2021, 10, 949. [Google Scholar] [CrossRef] [PubMed]
- Sun, X.; Baldwin, E.; Bai, J. Applications of gaseous chlorine dioxide on postharvest handling and storage of fruits and vegetables—A review. Food Control 2019, 95, 18–26. [Google Scholar] [CrossRef]
- Yahia, E.M.; Fonseca, J.M.; Kitinoja, L. Postharvest losses and waste. In Postharvest Technology of Perishable Horticultural Commodities; Elsevier: Amsterdam, The Netherlands, 2019; pp. 43–69. [Google Scholar]
- Palumbo, M.; Attolico, G.; Capozzi, V.; Cozzolino, R.; Corvino, A.; de Chiara, M.L.V.; Pace, B.; Pelosi, S.; Ricci, I.; Romaniello, R.; et al. Emerging Postharvest Technologies to Enhance the Shelf-Life of Fruit and Vegetables: An Overview. Foods 2022, 11, 3925. [Google Scholar] [CrossRef]
- Elik, A.; Yanik, D.K.; Istanbullu, Y.; Guzelsoy, N.A.; Yavuz, A.; Gogus, F. Strategies to reduce post-harvest losses for fruits and vegetables. Strategies 2019, 5, 29–39. [Google Scholar]
- FAO Data on Global Apple Production. Available online: https://www.fao.org/faostat/en/#data/QCL/visualize (accessed on 26 June 2023).
- Harker, F.; Feng, J.; Johnston, J.; Gamble, J.; Alavi, M.; Hall, M.; Chheang, S. Influence of postharvest water loss on apple quality: The use of a sensory panel to verify destructive and non-destructive instrumental measurements of texture. Postharvest Biol. Technol. 2019, 148, 32–37. [Google Scholar] [CrossRef]
- de Andrade, J.C.; Galvan, D.; Effting, L.; Tessaro, L.; Aquino, A.; Conte-Junior, C.A. Multiclass Pesticide Residues in Fruits and Vegetables from Brazil: A Systematic Review of Sample Preparation Until Post-Harvest. Crit. Rev. Anal. Chem. 2021, 1–23. Available online: https://www.tandfonline.com/doi/abs/10.1080/10408347.2021.2013157 (accessed on 26 June 2023).
- Bratu, A.M.; Petrus, M.; Popa, C. Monitoring of post-harvest maturation processes inside stored fruit using photoacoustic gas sensing spectroscopy. Materials 2020, 13, 2694. [Google Scholar] [CrossRef]
- Sottocornola, G.; Baric, S.; Nocker, M.; Stella, F.; Zanker, M. Picture-based and conversational decision support to diagnose post-harvest apple diseases. Expert Syst. Appl. 2022, 189, 116052. [Google Scholar] [CrossRef]
- Malvandi, A.; Feng, H.; Kamruzzaman, M. Application of NIR spectroscopy and multivariate analysis for Non-destructive evaluation of apple moisture content during ultrasonic drying. Spectrochim. Acta Part A Mol. Biomol. Spectrosc. 2022, 269, 120733. [Google Scholar] [CrossRef]
- Schlie, T.P.; Dierend, W.; Koepcke, D.; Rath, T. Detecting low-oxygen stress of stored apples using chlorophyll fluorescence imaging and histogram division. Postharvest Biol. Technol. 2022, 189, 111901. [Google Scholar] [CrossRef]
- Wang, L.; Huang, J.; Li, Z.; Liu, D.; Fan, J. A review of the polyphenols extraction from apple pomace: Novel technologies and techniques of cell disintegration. Crit. Rev. Food Sci. Nutr. 2022, 1–14. [Google Scholar] [CrossRef] [PubMed]
- Wu, X.; Fauconnier, M.L.; Bi, J. Characterization and Discrimination of Apples by Flash GC E-Nose: Geographical Regions and Botanical Origins Studies in China. Foods 2022, 11, 1631. [Google Scholar] [CrossRef] [PubMed]
- Biasi, A.; Zhimo, V.Y.; Kumar, A.; Abdelfattah, A.; Salim, S.; Feygenberg, O.; Wisniewski, M.; Droby, S. Changes in the fungal community assembly of apple fruit following postharvest application of the yeast biocontrol agent Metschnikowia fructicola. Horticulturae 2021, 7, 360. [Google Scholar] [CrossRef]
- Bartholomew, H.P.; Lichtner, F.J.; Bradshaw, M.; Gaskins, V.L.; Fonseca, J.M.; Bennett, J.W.; Jurick, W.M. Comparative Penicillium spp. Transcriptomics: Conserved Pathways and Processes Revealed in Ungerminated Conidia and during Postharvest Apple Fruit Decay. Microorganisms 2022, 10, 2414. [Google Scholar] [CrossRef]
- Morales-Cedeno, L.R.; del Carmen Orozco-Mosqueda, M.; Loeza-Lara, P.D.; Parra-Cota, F.I.; de Los Santos-Villalobos, S.; Santoyo, G. Plant growth-promoting bacterial endophytes as biocontrol agents of pre-and post-harvest diseases: Fundamentals, methods of application and future perspectives. Microbiol. Res. 2021, 242, 126612. [Google Scholar] [CrossRef]
- Nikparvar, B.; Thill, J.C. Machine learning of spatial data. ISPRS Int. J. Geo-Inf. 2021, 10, 600. [Google Scholar] [CrossRef]
- Zhang, Y.; Liu, M.; Yu, F.; Zeng, T.; Wang, Y. An o-shape neural network with attention modules to detect junctions in biomedical images without segmentation. IEEE J. Biomed. Health Inform. 2021, 26, 774–785. [Google Scholar] [CrossRef]
- Zhao, S.; Blaabjerg, F.; Wang, H. An overview of artificial intelligence applications for power electronics. IEEE Trans. Power Electron. 2020, 36, 4633–4658. [Google Scholar] [CrossRef]
- Meshram, V.; Patil, K.; Meshram, V.; Hanchate, D.; Ramkteke, S. Machine learning in agriculture domain: A state-of-art survey. Artif. Intell. Life Sci. 2021, 1, 100010. [Google Scholar] [CrossRef]
- Kakani, V.; Nguyen, V.H.; Kumar, B.P.; Kim, H.; Pasupuleti, V.R. A critical review on computer vision and artificial intelligence in food industry. J. Agric. Food Res. 2020, 2, 100033. [Google Scholar] [CrossRef]
- Rasti, S.; Bleakley, C.J.; Holden, N.; Whetton, R.; Langton, D.; O’Hare, G. A survey of high resolution image processing techniques for cereal crop growth monitoring. Inf. Process. Agric. 2022, 9, 300–315. [Google Scholar] [CrossRef]
- Tang, Y.; Qiu, J.; Zhang, Y.; Wu, D.; Cao, Y.; Zhao, K.; Zhu, L. Optimization strategies of fruit detection to overcome the challenge of unstructured background in field orchard environment: A review. Precis. Agric. 2023, 24, 1183–1219. [Google Scholar] [CrossRef]
- Ouhami, M.; Hafiane, A.; Es-Saady, Y.; El Hajji, M.; Canals, R. Computer vision, IoT and data fusion for crop disease detection using machine learning: A survey and ongoing research. Remote Sens. 2021, 13, 2486. [Google Scholar] [CrossRef]
- Wu, Z.; Chen, Y.; Zhao, B.; Kang, X.; Ding, Y. Review of weed detection methods based on computer vision. Sensors 2021, 21, 3647. [Google Scholar] [CrossRef] [PubMed]
- Mendigoria, C.H.; Aquino, H.; Concepcion, R.; Alajas, O.J.; Dadios, E.; Sybingco, E. Vision-based postharvest analysis of musa acuminata using feature-based machine learning and deep transfer networks. In Proceedings of the 2021 IEEE 9th Region 10 Humanitarian Technology Conference (R10-HTC), Bangalore, India, 30 September–2 October 2021; pp. 1–6. [Google Scholar]
- Bucio, F.; Isaza, C.; Gonzalez, E.; De Paz, J.Z.; Sierra, J.R.; Rivera, E.A. Non-Destructive Post-Harvest Tomato Mass Estimation Model Based on Its Area via Computer Vision and Error Minimization Approaches. IEEE Access 2022, 10, 100247–100256. [Google Scholar] [CrossRef]
- Ropelewska, E. Postharvest Authentication of Potato Cultivars Using Machine Learning to Provide High-Quality Products. Chem. Proc. 2022, 10, 30. [Google Scholar]
- Isola, P.; Zhu, J.Y.; Zhou, T.; Efros, A.A. Image-to-Image Translation with Conditional Adversarial Networks. arXiv 2018, arXiv:1611.07004. [Google Scholar]
- Zhu, J.Y.; Park, T.; Isola, P.; Efros, A.A. Unpaired Image-to-Image Translation using Cycle-Consistent Adversarial Networks. arXiv 2020, arXiv:1703.10593. [Google Scholar]
- Wang, T.C.; Liu, M.Y.; Zhu, J.Y.; Tao, A.; Kautz, J.; Catanzaro, B. High-Resolution Image Synthesis and Semantic Manipulation with Conditional GANs. arXiv 2018, arXiv:1711.11585. [Google Scholar]
- Christovam, L.E.; Shimabukuro, M.H.; Galo, M.d.L.B.; Honkavaara, E. Pix2pix conditional generative adversarial network with MLP loss function for cloud removal in a cropland time series. Remote Sens. 2022, 14, 144. [Google Scholar] [CrossRef]
- de Lima, D.C.; Saqui, D.; Mpinda, S.A.T.; Saito, J.H. Pix2pix network to estimate agricultural near infrared images from rgb data. Can. J. Remote Sens. 2022, 48, 299–315. [Google Scholar] [CrossRef]
- Farooque, A.A.; Afzaal, H.; Benlamri, R.; Al-Naemi, S.; MacDonald, E.; Abbas, F.; MacLeod, K.; Ali, H. Red-green-blue to normalized difference vegetation index translation: A robust and inexpensive approach for vegetation monitoring using machine vision and generative adversarial networks. Precis. Agric. 2023, 24, 1097–1115. [Google Scholar] [CrossRef]
- Bertoglio, R.; Mazzucchelli, A.; Catalano, N.; Matteucci, M. A comparative study of Fourier transform and CycleGAN as domain adaptation techniques for weed segmentation. Smart Agric. Technol. 2023, 4, 100188. [Google Scholar] [CrossRef]
- Jung, D.H.; Kim, C.Y.; Lee, T.S.; Park, S.H. Depth image conversion model based on CycleGAN for growing tomato truss identification. Plant Methods 2022, 18, 83. [Google Scholar] [CrossRef] [PubMed]
- van Marrewijk, B.M.; Polder, G.; Kootstra, G. Investigation of the added value of CycleGAN on the plant pathology dataset. IFAC-PapersOnLine 2022, 55, 89–94. [Google Scholar] [CrossRef]
- Yang, J.; Zhang, T.; Fang, C.; Zheng, H. A defencing algorithm based on deep learning improves the detection accuracy of caged chickens. Comput. Electron. Agric. 2023, 204, 107501. [Google Scholar] [CrossRef]
- Tsuchikawa, S.; Ma, T.; Inagaki, T. Application of near-infrared spectroscopy to agriculture and forestry. Anal. Sci. 2022, 38, 635–642. [Google Scholar] [CrossRef]
- Stasenko, N.; Savinov, M.; Burlutskiy, V.; Pukalchik, M.; Somov, A. Deep Learning for Postharvest Decay Prediction in Apples. In Proceedings of the IECON 2021—47th Annual Conference of the IEEE Industrial Electronics Society, Toronto, ON, Canada, 13–16 October 2021; pp. 1–6. [Google Scholar]
- Ronneberger, O.; Fischer, P.; Brox, T. U-net: Convolutional networks for biomedical image segmentation. In Proceedings of the International Conference on Medical Image Computing and Computer-Assisted Intervention, Munich, Germany, 5–9 October 2015; Springer: Berlin/Heidelberg, Germany, 2015; pp. 234–241. [Google Scholar]
- Yurtkulu, S.C.; Şahin, Y.H.; Unal, G. Semantic Segmentation with Extended DeepLabv3 Architecture. In Proceedings of the 2019 27th Signal Processing and Communications Applications Conference (SIU), Sivas, Turkey, 24–26 April 2019; pp. 1–4. [Google Scholar]
- Assunção, E.; Gaspar, P.D.; Mesquita, R.; Simões, M.P.; Alibabaei, K.; Veiros, A.; Proença, H. Real-Time Weed Control Application Using a Jetson Nano Edge Device and a Spray Mechanism. Remote Sens. 2022, 14, 4217. [Google Scholar] [CrossRef]
- Saddik, A.; Latif, R.; Taher, F.; El Ouardi, A.; Elhoseny, M. Mapping Agricultural Soil in Greenhouse Using an Autonomous Low-Cost Robot and Precise Monitoring. Sustainability 2022, 14, 15539. [Google Scholar] [CrossRef]
- de Aguiar, A.S.P.; dos Santos, F.B.N.; dos Santos, L.C.F.; de Jesus Filipe, V.M.; de Sousa, A.J.M. Vineyard trunk detection using deep learning–An experimental device benchmark. Comput. Electron. Agric. 2020, 175, 105535. [Google Scholar] [CrossRef]
- Mazzia, V.; Khaliq, A.; Salvetti, F.; Chiaberge, M. Real-time apple detection system using embedded systems with hardware accelerators: An edge AI application. IEEE Access 2020, 8, 9102–9114. [Google Scholar] [CrossRef]
- Beegam, K.S.; Shenoy, M.V.; Chaturvedi, N. Hybrid consensus and recovery block-based detection of ripe coffee cherry bunches using RGB-D sensor. IEEE Sens. J. 2021, 22, 732–740. [Google Scholar] [CrossRef]
- Zhang, W.; Liu, Y.; Chen, K.; Li, H.; Duan, Y.; Wu, W.; Shi, Y.; Guo, W. Lightweight fruit-detection algorithm for edge computing applications. Front. Plant Sci. 2021, 12, 740936. [Google Scholar] [CrossRef]
- Vilcamiza, G.; Trelles, N.; Vinces, L.; Oliden, J. A coffee bean classifier system by roast quality using convolutional neural networks and computer vision implemented in an NVIDIA Jetson Nano. In Proceedings of the 2022 Congreso Internacional de Innovación y Tendencias en Ingeniería (CONIITI), Bogota, Colombia, 5–7 October 2022; pp. 1–6. [Google Scholar]
- Fan, K.J.; Su, W.H. Applications of Fluorescence Spectroscopy, RGB-and MultiSpectral Imaging for Quality Determinations of White Meat: A Review. Biosensors 2022, 12, 76. [Google Scholar] [CrossRef]
- Zou, X.; Zhang, Y.; Lin, R.; Gong, G.; Wang, S.; Zhu, S.; Wang, Z. Pixel-level Bayer-type colour router based on metasurfaces. Nat. Commun. 2022, 13, 3288. [Google Scholar] [CrossRef]
- Rivero Mesa, A.; Chiang, J. Non-invasive grading system for banana tiers using RGB imaging and deep learning. In Proceedings of the 2021 7th International Conference on Computing and Artificial Intelligence, Tianjin, China, 23–26 April 2021; pp. 113–118. [Google Scholar]
- Nasiri, A.; Taheri-Garavand, A.; Zhang, Y.D. Image-based deep learning automated sorting of date fruit. Postharvest Biol. Technol. 2019, 153, 133–141. [Google Scholar] [CrossRef]
- Deng, L.; Li, J.; Han, Z. Online defect detection and automatic grading of carrots using computer vision combined with deep learning methods. LWT 2021, 149, 111832. [Google Scholar] [CrossRef]
- Zhang, X.; Zhou, X.; Lin, M.; Sun, J. ShuffleNet: An extremely efficient convolutional neural network for mobile devices. arXiv 2017, arXiv:1707.01083. [Google Scholar]
- Wu, F.; Yang, Z.; Mo, X.; Wu, Z.; Tang, W.; Duan, J.; Zou, X. Detection and counting of banana bunches by integrating deep learning and classic image-processing algorithms. Comput. Electron. Agric. 2023, 209, 107827. [Google Scholar] [CrossRef]
- Baheti, B.; Innani, S.; Gajre, S.; Talbar, S. Semantic scene segmentation in unstructured environment with modified DeepLabV3+. Pattern Recognit. Lett. 2020, 138, 223–229. [Google Scholar] [CrossRef]
- Wu, F.; Duan, J.; Ai, P.; Chen, Z.; Yang, Z.; Zou, X. Rachis detection and three-dimensional localization of cut off point for vision-based banana robot. Comput. Electron. Agric. 2022, 198, 107079. [Google Scholar] [CrossRef]
- Buyukarikan, B.; Ulker, E. Classification of physiological disorders in apples fruit using a hybrid model based on convolutional neural network and machine learning methods. Neural Comput. Appl. 2022, 34, 16973–16988. [Google Scholar] [CrossRef]
- Li, J.; Zheng, K.; Yao, J.; Gao, L.; Hong, D. Deep unsupervised blind hyperspectral and multispectral data fusion. IEEE Geosci. Remote Sens. Lett. 2022, 19, 1–5. [Google Scholar] [CrossRef]
- Liang, J.; Li, X.; Zhu, P.; Xu, N.; He, Y. Hyperspectral reflectance imaging combined with multivariate analysis for diagnosis of Sclerotinia stem rot on Arabidopsis thaliana leaves. Appl. Sci. 2019, 9, 2092. [Google Scholar] [CrossRef] [Green Version]
- Vashpanov, Y.; Heo, G.; Kim, Y.; Venkel, T.; Son, J.Y. Detecting green mold pathogens on lemons using hyperspectral images. Appl. Sci. 2020, 10, 1209. [Google Scholar] [CrossRef] [Green Version]
- Fahrentrapp, J.; Ria, F.; Geilhausen, M.; Panassiti, B. Detection of gray mold leaf infections prior to visual symptom appearance using a five-band multispectral sensor. Front. Plant Sci. 2019, 10, 628. [Google Scholar] [CrossRef] [Green Version]
- Wan, L.; Li, H.; Li, C.; Wang, A.; Yang, Y.; Wang, P. Hyperspectral Sensing of Plant Diseases: Principle and Methods. Agronomy 2022, 12, 1451. [Google Scholar] [CrossRef]
- Błaszczyk, U.; Wyrzykowska, S.; Gąstoł, M. Application of Bioactive Coatings with Killer Yeasts to Control Post-Harvest Apple Decay Caused by Botrytis cinerea and Penicillium italicum. Foods 2022, 11, 1868. [Google Scholar] [CrossRef]
- Amaral Carneiro, G.; Walcher, M.; Baric, S. Cadophora luteo-olivacea isolated from apple (Malus domestica) fruit with post-harvest side rot symptoms in northern Italy. Eur. J. Plant Pathol. 2022, 162, 247–255. [Google Scholar] [CrossRef]
- Ghooshkhaneh, N.G.; Golzarian, M.R.; Mollazade, K. VIS-NIR spectroscopy for detection of citrus core rot caused by Alternaria alternata. Food Control 2023, 144, 109320. [Google Scholar] [CrossRef]
- Ekramirad, N.; Khaled, A.Y.; Doyle, L.E.; Loeb, J.R.; Donohue, K.D.; Villanueva, R.T.; Adedeji, A.A. Nondestructive detection of codling moth infestation in apples using pixel-based nir hyperspectral imaging with machine learning and feature selection. Foods 2022, 11, 8. [Google Scholar] [CrossRef]
- Jiang, B.; He, J.; Yang, S.; Fu, H.; Li, T.; Song, H.; He, D. Fusion of machine vision technology and AlexNet-CNNs deep learning network for the detection of postharvest apple pesticide residues. Artif. Intell. Agric. 2019, 1, 1–8. [Google Scholar] [CrossRef]
- Huang, C.; Li, X.; Wen, Y. AN OTSU image segmentation based on fruitfly optimization algorithm. Alex. Eng. J. 2021, 60, 183–188. [Google Scholar] [CrossRef]
- Krizhevsky, A.; Sutskever, I.; Hinton, G.E. Imagenet classification with deep convolutional neural networks. Commun. ACM 2017, 60, 84–90. [Google Scholar] [CrossRef] [Green Version]
- Zhang, D.; Zhou, X.; Zhang, J.; Lan, Y.; Xu, C.; Liang, D. Detection of rice sheath blight using an unmanned aerial system with high-resolution color and multispectral imaging. PLoS ONE 2018, 13, e0187470. [Google Scholar] [CrossRef] [Green Version]
- Sun, Y.; Xiao, H.; Tu, S.; Sun, K.; Pan, L.; Tu, K. Detecting decayed peach using a rotating hyperspectral imaging testbed. LWT 2018, 87, 326–332. [Google Scholar] [CrossRef]
- Li, J.; Luo, W.; Wang, Z.; Fan, S. Early detection of decay on apples using hyperspectral reflectance imaging combining both principal component analysis and improved watershed segmentation method. Postharvest Biol. Technol. 2019, 149, 235–246. [Google Scholar] [CrossRef]
- Hyperspectral Imaging Systems Market Size Report. Available online: https://www.grandviewresearch.com/industry-analysis/hyperspectral-imaging-systems-market (accessed on 26 June 2023).
- Mirza, M.; Osindero, S. Conditional generative adversarial nets. arXiv 2014, arXiv:1411.1784. [Google Scholar]
- Illarionova, S.; Shadrin, D.; Trekin, A.; Ignatiev, V.; Oseledets, I. Generation of the nir spectral band for satellite images with convolutional neural networks. Sensors 2021, 21, 5646. [Google Scholar] [CrossRef]
- Lu, Y.; Chen, D.; Olaniyi, E.; Huang, Y. Generative adversarial networks (GANs) for image augmentation in agriculture: A systematic review. Comput. Electron. Agric. 2022, 200, 107208. [Google Scholar] [CrossRef]
- Khatri, K.; Asha, C.; D’Souza, J.M. Detection of Animals in Thermal Imagery for Surveillance using GAN and Object Detection Framework. In Proceedings of the 2022 International Conference for Advancement in Technology (ICONAT), Goa, India, 21–22 January 2022; pp. 1–6. [Google Scholar]
- Valerio Giuffrida, M.; Scharr, H.; Tsaftaris, S.A. Arigan: Synthetic arabidopsis plants using generative adversarial network. In Proceedings of the IEEE International Conference on Computer Vision Workshops, Venice, Italy, 22–29 October 2017; pp. 2064–2071. [Google Scholar]
- Tang, H.; Xu, D.; Yan, Y.; Corso, J.J.; Torr, P.H.; Sebe, N. Multi-channel attention selection gans for guided image-to-image translation. arXiv 2020, arXiv:2002.01048. [Google Scholar] [CrossRef]
- Guo, Z.; Shao, M.; Li, S. Image-to-image translation using an offset-based multi-scale codes GAN encoder. Vis. Comput. 2023, 1–17. [Google Scholar] [CrossRef]
- Fard, A.S.; Reutens, D.C.; Vegh, V. From CNNs to GANs for cross-modality medical image estimation. Comput. Biol. Med. 2022, 146, 105556. [Google Scholar] [CrossRef] [PubMed]
- Saharia, C.; Chan, W.; Chang, H.; Lee, C.; Ho, J.; Salimans, T.; Fleet, D.; Norouzi, M. Palette: Image-to-image diffusion models. In Proceedings of the ACM SIGGRAPH 2022 Conference Proceedings, Vancouver, BC, Canada, 7–11 August 2022; pp. 1–10. [Google Scholar]
- Kshatriya, B.S.; Dubey, S.R.; Sarma, H.; Chaudhary, K.; Gurjar, M.R.; Rai, R.; Manchanda, S. Semantic Map Injected GAN Training for Image-to-Image Translation. In Proceedings of the Satellite Workshops of ICVGIP 2021, Gandhinagar, India, 8–10 December 2022; Springer: Berlin/Heidelberg, Germany, 2022; pp. 235–249. [Google Scholar]
- Sa, I.; Lim, J.Y.; Ahn, H.S.; MacDonald, B. deepNIR: Datasets for generating synthetic NIR images and improved fruit detection system using deep learning techniques. Sensors 2022, 22, 4721. [Google Scholar] [CrossRef] [PubMed]
- Li, C.; Wand, M. Precomputed real-time texture synthesis with markovian generative adversarial networks. In Proceedings of the European Conference on Computer Vision, Amsterdam, The Netherlands, 11–14 October 2016; Springer: Berlin/Heidelberg, Germany, 2016; pp. 702–716. [Google Scholar]
- Simonyan, K.; Zisserman, A. Very deep convolutional networks for large-scale image recognition. arXiv 2014, arXiv:1409.1556. [Google Scholar]
- He, K.; Gkioxari, G.; Dollár, P.; Girshick, R. Mask r-cnn. In Proceedings of the IEEE International Conference on Computer Vision, Venice, Italy, 22–29 October 2017; pp. 2961–2969. [Google Scholar]
- Girshick, R.; Donahue, J.; Darrell, T.; Malik, J. Rich feature hierarchies for accurate object detection and semantic segmentation. In Proceedings of the IEEE Conference on Computer Vision and Pattern Recognition, Washington, DC, USA, 23–28 June 2014; pp. 580–587. [Google Scholar]
- Girshick, R. Fast r-cnn. In Proceedings of the IEEE International Conference on Computer Vision, Santiago, Chile, 7–13 December 2015; pp. 1440–1448. [Google Scholar]
- Ren, S.; He, K.; Girshick, R.; Sun, J. Faster r-cnn: Towards real-time object detection with region proposal networks. Adv. Neural Inf. Process. Syst. 2015, 28, 91–99. [Google Scholar] [CrossRef] [PubMed] [Green Version]
- Saletnik, B.; Zaguła, G.; Saletnik, A.; Bajcar, M.; Słysz, E.; Puchalski, C. Method for Prolonging the Shelf Life of Apples after Storage. Appl. Sci. 2022, 12, 3975. [Google Scholar] [CrossRef]
- Nesteruk, S.; Illarionova, S.; Akhtyamov, T.; Shadrin, D.; Somov, A.; Pukalchik, M.; Oseledets, I. XtremeAugment: Getting More From Your Data Through Combination of Image Collection and Image Augmentation. IEEE Access 2022, 10, 24010–24028. [Google Scholar] [CrossRef]
- Martínez-Zamora, L.; Castillejo, N.; Artés-Hernández, F. Postharvest UV-B and photoperiod with blue+ red LEDs as strategies to stimulate carotenogenesis in bell peppers. Appl. Sci. 2021, 11, 3736. [Google Scholar] [CrossRef]
- Supervisely Data Annotator. Available online: https://app.supervise.ly (accessed on 26 June 2023).
- Wu, Y.; Kirillov, A.; Massa, F.; Lo, W.Y.; Girshick, R. Detectron2. 2019. Available online: https://github.com/facebookresearch/detectron2 (accessed on 26 June 2023).
- NVIDIA. Jetson Modules Technical Specificatons. 2023. Available online: https://developer.nvidia.com/embedded/jetson-modules (accessed on 26 June 2023).
- Fan, S.; Liang, X.; Huang, W.; Zhang, V.J.; Pang, Q.; He, X.; Li, L.; Zhang, C. Real-time defects detection for apple sorting using NIR cameras with pruning-based YOLOV4 network. Comput. Electron. Agric. 2022, 193, 106715. [Google Scholar] [CrossRef]
- Tang, Y.; Bai, H.; Sun, L.; Wang, Y.; Hou, J.; Huo, Y.; Min, R. Multi-Band-Image Based Detection of Apple Surface Defect Using Machine Vision and Deep Learning. Horticulturae 2022, 8, 666. [Google Scholar] [CrossRef]
- Yuan, Y.; Yang, Z.; Liu, H.; Wang, H.; Li, J.; Zhao, L. Detection of early bruise in apple using near-infrared camera imaging technology combined with deep learning. Infrared Phys. Technol. 2022, 127, 104442. [Google Scholar] [CrossRef]
- Zhang, Z.; Pu, Y.; Wei, Z.; Liu, H.; Zhang, D.; Zhang, B.; Zhang, Z.; Zhao, J.; Hu, J. Combination of interactance and transmittance modes of Vis/NIR spectroscopy improved the performance of PLS-DA model for moldy apple core. Infrared Phys. Technol. 2022, 126, 104366. [Google Scholar] [CrossRef]
- Hu, Q.X.; Tian, J.; Fang, Y. Detection of moldy cores in apples with near-infrared transmission spectroscopy based on wavelet and BP network. Int. J. Pattern Recognit. Artif. Intell. 2019, 33, 1950020. [Google Scholar] [CrossRef]
- Sadek, M.E.; Shabana, Y.M.; Sayed-Ahmed, K.; Abou Tabl, A.H. Antifungal activities of sulfur and copper nanoparticles against cucumber postharvest diseases caused by Botrytis cinerea and Sclerotinia sclerotiorum. J. Fungi 2022, 8, 412. [Google Scholar] [CrossRef]


| Models | MAE | MAPE | MSE | PSNR | SSIM |
|---|---|---|---|---|---|
| CycleGAN | 0.067 | 0.105 | 0.01127 | 27.375 | 0.856 |
| Pix2Pix | 0.004 | 0.006 | 0.00003 | 46.433 | 0.955 |
| Pix2PixHD | 0.004 | 0.006 | 0.00003 | 46.859 | 0.972 |
| mAP | mAP | mAP | mAP | mAP | mAP | |
|---|---|---|---|---|---|---|
| 2 | 64.251 | 90.205 | 65.606 | 37.202 | 75.980 | 97.412 |
| 3 | 67.652 | 90.354 | 65.348 | 35.400 | 75.290 | 96.290 |
| 6 | 67.026 | 90.950 | 67.055 | 38.188 | 74.609 | 98.871 |
| 9 | 67.993 | 91.120 | 64.871 | 31.575 | 75.181 | 97.257 |
| Category | mAP | |||
|---|---|---|---|---|
| Healthy apple | 94.785 | 95.154 | 93.951 | 98.350 |
| Spoiled apple | 87.839 | 92.567 | 93.678 | 93.997 |
| Decay | 53.509 | 53.408 | 54.620 | 57.562 |
| Fungi | 31.581 | 30.609 | 34.285 | 39.967 |
| Category | F1-Score | |||
|---|---|---|---|---|
| Healthy apple | 95.640 | 95.589 | 94.799 | 98.375 |
| Spoiled apple | 88.120 | 93.134 | 94.689 | 94.800 |
| Decay | 53.309 | 53.213 | 54.850 | 58.861 |
| Fungi | 31.686 | 37.247 | 35.126 | 40.968 |
| References | Task | NIR Images Range, nm | Technique | Metric | Value |
|---|---|---|---|---|---|
| [104] | Real-time apple defect inspection | 850 | YOLO v4 | F1 | 92.000 |
| [105] | Apples surface defect segmentation | 460–842 | U-Net | F1-score | 87.000 |
| [105] | Apples surface defect segmentation | 460–842 | the improved U-Net | F1-score | 91.000 |
| [106] | Early bruise detection in apples | 900–2350 | Faster R-CNN | mAP | 96.900 |
| [106] | Early bruise detection in apples | 900–2350 | YOLO v3-Tiny | mAP | 99.100 |
| [106] | Early bruise detection in apples | 900–2350 | YOLO 5s | mAP | 99.600 |
| [107] | Moldy core detection in apples | 400–850 | CARS-PLS-DA model | Accuracy | 87.880 |
| [73] | Codling Moth detection in apples | 900–1700 | Gradient tree boosting | F1-score | 97.000 |
| [108] | Moldy core detection in apples | 200–1100 | BP-ANN | Accuracy | 95.000 |
Disclaimer/Publisher’s Note: The statements, opinions and data contained in all publications are solely those of the individual author(s) and contributor(s) and not of MDPI and/or the editor(s). MDPI and/or the editor(s) disclaim responsibility for any injury to people or property resulting from any ideas, methods, instructions or products referred to in the content. |
© 2023 by the authors. Licensee MDPI, Basel, Switzerland. This article is an open access article distributed under the terms and conditions of the Creative Commons Attribution (CC BY) license (https://creativecommons.org/licenses/by/4.0/).
Share and Cite
Stasenko, N.; Shukhratov, I.; Savinov, M.; Shadrin, D.; Somov, A. Deep Learning in Precision Agriculture: Artificially Generated VNIR Images Segmentation for Early Postharvest Decay Prediction in Apples. Entropy 2023, 25, 987. https://doi.org/10.3390/e25070987
Stasenko N, Shukhratov I, Savinov M, Shadrin D, Somov A. Deep Learning in Precision Agriculture: Artificially Generated VNIR Images Segmentation for Early Postharvest Decay Prediction in Apples. Entropy. 2023; 25(7):987. https://doi.org/10.3390/e25070987
Chicago/Turabian StyleStasenko, Nikita, Islomjon Shukhratov, Maxim Savinov, Dmitrii Shadrin, and Andrey Somov. 2023. "Deep Learning in Precision Agriculture: Artificially Generated VNIR Images Segmentation for Early Postharvest Decay Prediction in Apples" Entropy 25, no. 7: 987. https://doi.org/10.3390/e25070987