
Comparison of Heart Autonomic Control between Hemodynamically Stable and Unstable Patients during Hemodialysis Sessions: A Bayesian Approach
 , , , ,
Abstract
:1. Introduction
2. Methods
2.1. Sample
2.2. Proceedings and Measurements
Blood-Pressure Recordings and Hemodynamic Stability Characterization
2.3. RR Interval Recording
2.4. Frequency Domain Analysis
2.5. Entropy Analysis
2.6. Statistical Analysis
3. Results
4. Discussion
5. Conclusions
Author Contributions
Funding
Institutional Review Board Statement
Data Availability Statement
Conflicts of Interest
References
- Levin, A.S.; Bilous, R.W.; Coresh, J. Chapter 1: Definition and classification of CKD. Kidney Int. Suppl. 2013, 3, 19–62. [Google Scholar]
- Thomas, B.; Matsushita, K.; Abate, K.H.; Al-Aly, Z.; Ärnlöv, J.; Asayama, K.; Atkins, R.; Badawi, A.; Ballew, S.H.; Banerjee, A.; et al. Global cardiovascular and renal outcomes of reduced GFR. J. Am. Soc. Nephrol. 2017, 28, 2167–2179. [Google Scholar] [CrossRef]
- Neovius, M.; Jacobson, S.H.; Eriksson, J.K.; Elinder, C.G.; Hylander, B. Mortality in chronic kidney disease and renal replacement therapy: A population-based cohort study. BMJ Open 2014, 4, e004251. [Google Scholar] [CrossRef] [PubMed]
- Bregman, H.; Daugirdas, J.T.; Ing, T.S. Complications during hemodialysis. In Handbook of Dialysis; Little, Brown: New York, NY, USA, 1994; p. 149. [Google Scholar]
- Barnas, M.G.; Boer, W.H.; Koomans, H.A. Hemodynamic patterns and spectral analysis of heart rate variability during dialysis hypotension. J. Am. Soc. Nephrol. 1999, 10, 2577–2584. [Google Scholar] [CrossRef]
- Terra, F.S.; Costa, A.M.; Figueiredo, E.T.; Morais, A.M.; Costa, M.D.; Costa, R.D. The main complications presented by the chronic renal patients during hemodialysis. Rev. Bras. Clin. Med. 2010, 8, 187–192. [Google Scholar]
- Reilly, R.F. Attending rounds: A patient with intradialytic hypotension. Clin. J. Am. Soc. Nephrol. 2014, 9, 798–803. [Google Scholar] [CrossRef] [PubMed]
- Tisler, A.; Akocsi, K.; Borbas, B.; Fazakas, L.; Ferenczi, S.; Görögh, S.; Kulcsar, I.; Nagy, L.; Samik, J.; Szegedi, J.; et al. The effect of frequent or occasional dialysis-associated hypotension on survival of patients on maintenance haemodialysis. Nephrol. Dial. Transplant. 2003, 18, 2601–2605. [Google Scholar] [CrossRef] [PubMed]
- Shoji, T.; Tsubakihara, Y.; Fujii, M.; Imai, E. Hemodialysis-associated hypotension as an independent risk factor for two-year mortality in hemodialysis patients. Kidney Int. 2004, 66, 1212–1220. [Google Scholar] [CrossRef]
- Selby, N.M.; McIntyre, C.W. The acute cardiac effects of dialysis. Semin. Dial. 2007, 20, 220–228. [Google Scholar] [CrossRef]
- Sands, J.J.; Usvyat, L.A.; Sullivan, T.; Segal, J.H.; Zabetakis, P.; Kotanko, P.; Maddux, F.W.; Diaz-Buxo, J.A. Intradialytic hypotension: Frequency, sources of variation and correlation with clinical outcome. Hemodial. Int. 2014, 18, 415–422. [Google Scholar] [CrossRef]
- Malik, M.; Camm, A.J. Components of heart rate variability—What they really mean and what we really measure. Am. J. Cardiol. 1993, 72, 821–822. [Google Scholar] [CrossRef] [PubMed]
- Júnior, E.P.N.; Ribeiro, I.J.; Freire, I.V.; da Silva Passos, R.; Casotti, C.A.; Pereira, R. The smoking habit negatively influences autonomic heart control in community-dwelling elderly adults. Hell. J. Cardiol. 2017, 58, 283–288. [Google Scholar] [CrossRef]
- de Freitas, V.P.; da Silva Passos, R.; Oliveira, A.A.; Ribeiro, I.J.; Freire, I.V.; Schettino, L.; Teles, M.F.; Casotti, C.A.; Pereira, R. Sarcopenia is associated to an impaired autonomic heart rate modulation in community-dwelling old adults. Arch. Gerontol. Geriatr. 2018, 76, 120–124. [Google Scholar] [CrossRef] [PubMed]
- Holzinger, A.; Jurisica, I. (Eds.) Interactive Knowledge Discovery and Data Mining in Biomedical Informatics: State-of-the-Art and Future Challenges; Springer: Berlin/Heidelberg, Germany, 2014; Volume 8401, pp. 209–226. [Google Scholar]
- Costa, M.D.; Peng, C.K.; Goldberger, A.L. Multiscale analysis of heart rate dynamics: Entropy and time irreversibility measures. Cardiovasc. Eng. 2008, 8, 88–93. [Google Scholar] [CrossRef]
- Voss, A. Longitudinal analysis of heart rate variability. J. Electrocardiol. 2007, 40, S26–S29. [Google Scholar] [CrossRef]
- Buchman, T.G. The community of the self. Nature 2002, 420, 246–251. [Google Scholar] [CrossRef]
- Costa, M.; Goldberger, A.L.; Peng, C.-K. Multiscale entropy analysis of biological signals. Phys. Rev. E 2005, 71, 021906. [Google Scholar] [CrossRef]
- Mascarenhas, T.F.; Macedo, M.C.; da Silva, D.M.; Lemos, L.B.; Vieira, F.C.; Silva, J.R.; Couto, D.L.; Oliveira, A.A.; Pereira, R. Sympathetic activity is negatively associated to uremic state and hemodynamic instability during hemodialysis sessions. Rev. De Nefrol. Diálisis Y Transpl. 2019, 39, 38–45. [Google Scholar]
- Cavalcanti, S.; Severi, S.; Enzman, G. Analysis of oscillatory components of short-term heart rate variability in hemodynamically stable and unstable patients during hemodialysis. Artif. Organs 1998, 22, 98–106. [Google Scholar] [CrossRef]
- Converse, R.L.; Jacobsen, T.N.; Jost, C.M.; Toto, R.D.; Grayburn, P.A.; Obregon, T.M.; Fouad-Tarazi, F.; Victor, R.G. Paradoxical withdrawal of reflex vasoconstriction as a cause of hemodialysis-induced hypotension. J. Clin. Investig. 1992, 90, 1657–1665. [Google Scholar] [CrossRef]
- Sornmo, L.; Sandberg, F.; Gil, E.; Solem, K. Noninvasive techniques for prevention of intradialytic hypotension. IEEE Rev. Biomed. Eng. 2012, 5, 45–59. [Google Scholar] [CrossRef] [PubMed]
- Gamelin, F.X.; Berthoin, S.; Bosquet, L. Validity of the polar S810 heart rate monitor to measure RR intervals at rest. Med. Sci. Sports Exerc. 2006, 38, 887–893. [Google Scholar] [CrossRef]
- Silva, D.M.; Macedo, M.C.; Lemos, L.B.; Vieira, F.C.; Piropo, U.S.; Andrade, H.B.; Wessel, N.; Pereira, R. Reliability analysis of the heart autonomic control parameters during hemodialysis sessions. Biomed. Eng. Biomed. Tech. 2016, 61, 623–630. [Google Scholar] [CrossRef] [PubMed]
- Luque-Casado, A.; Zabala, M.; Morales, E.; Mateo-March, M.; Sanabria, D. Cognitive performance and heart rate variability: The influence of fitness level. PLoS ONE 2013, 8, e56935. [Google Scholar] [CrossRef] [PubMed]
- Malik, M. Heart rate variability: Standards of measurement, physiological interpretation, and clinical use: Task force of the European Society of Cardiology and the North American Society for Pacing and Electrophysiology. Ann. Noninvasive Electrocardiol. 1996, 1, 151–181. [Google Scholar] [CrossRef]
- Tarvainen, M.P.; Niskanen, J.P.; Lipponen, J.A.; Ranta-Aho, P.O.; Karjalainen, P.A. Kubios HRV–heart rate variability analysis software. Comput. Methods Programs Biomed. 2014, 113, 210–220. [Google Scholar] [CrossRef]
- Tang, S.C.; Jen, H.I.; Lin, Y.H.; Hung, C.S.; Jou, W.J.; Huang, P.W.; Shieh, J.S.; Ho, Y.L.; Lai, D.M.; Wu, A.Y.; et al. Complexity of heart rate variability predicts outcome in intensive care unit admitted patients with acute stroke. J. Neurol. Neurosurg. Psychiatry 2015, 86, 95–100. [Google Scholar] [CrossRef]
- Ho, Y.L.; Lin, C.; Lin, Y.H.; Lo, M.T. The prognostic value of nonlinear analysis of heart rate variability in patients with congestive heart failure—A pilot study of multiscale entropy. PLoS ONE 2011, 6, e18699. [Google Scholar] [CrossRef]
- Lin, Y.H.; Wu, V.C.; Lo, M.T.; Wu, X.M.; Hung, C.S.; Wu, K.D.; Lin, C.; Ho, Y.L.; Stowasser, M.; Peng, C.K. Reversible heart rhythm complexity impairment in patients with primary aldosteronism. Sci. Rep. 2015, 5, 11249. [Google Scholar] [CrossRef]
- Lin, Y.H.; Lin, C.; Ho, Y.H.; Wu, V.C.; Lo, M.T.; Hung, K.Y.; Liu, L.Y.D.; Lin, L.Y.; Huang, J.W.; Peng, C.K. Heart rhythm complexity impairment in patients undergoing peritoneal dialysis. Sci. Rep. 2016, 6, 28202. [Google Scholar] [CrossRef]
- Silva, L.E.V.; Fazan, R., Jr.; Marin-Neto, J.A. PyBioS: A freeware computer software for analysis of cardiovascular signals. Comput. Methods Programs Biomed. 2020, 197, 105718. [Google Scholar] [CrossRef]
- Herbert, R.; Jamtvedt, G.; Hagen, K.B.; Mead, J. Practical Evidence-based Physiotherapy. In Elsevier Health Sciences; Elsevier: Amsterdam, The Netherlands, 2011; p. 186. [Google Scholar]
- Dos Santos, J.H.B.; Passos, R.S.; Freire, I.V.; Ribeiro, I.J.; Oliveira, A.A.; Casotti, C.A.; Alkahtani, S.A.; Barbosa, A.A.L.; Pereira, R. The D allele of angiotensin-converting enzyme gene is associated with a worse autonomic heart control in community-based older adults. Exp. Gerontol. 2021, 146, 111227. [Google Scholar] [CrossRef] [PubMed]
- Lee, M.D.; Wagenmakers, E.-J. Bayesian Cognitive Modeling: A Practical Course; Cambridge University Press: Cambridge, UK, 2014; p. 279. [Google Scholar]
- Sampaio-Jorge, F.; Morales, A.P.; Pereira, R.; Barth, T.; Ribeiro, B.G. Caffeine increases performance and leads to a cardioprotective effect during intense exercise in cyclists. Sci. Rep. 2021, 11, 24327. [Google Scholar] [CrossRef] [PubMed]
- Vita, G.; Bellinghieri, G.; Trusso, A.; Costantino, G.; Santoro, D.; Monteleone, F.; Messina, C.; Savica, V. Uremic autonomic neuropathy studied by spectral analysis of heart rate. Kidney Int. 1999, 56, 232–237. [Google Scholar] [CrossRef]
- Chesterton, L.J.; Selby, N.M.; Burton, J.O.; Fialova, J.; Chan, C.; McIntyre, C.W. Categorization of the hemodynamic response to hemodialysis: The importance of baroreflex sensitivity. Hemodial. Int. 2010, 14, 18–28. [Google Scholar] [CrossRef] [PubMed]
- Sandberg, F.; Bailón, R.; Hernando, D.; Laguna, P.; Martínez, J.P.; Solem, K.; Sörnmo, L. Prediction of hypotension in hemodialysis patients. Physiol. Meas. 2014, 35, 1885–1898. [Google Scholar] [CrossRef]
- Cornforth, D.J.; Tarvainen, M.P.; Jelinek, H.F. How to calculate Renyi entropy from heart rate variability, and why it matters for detecting cardiac autonomic neuropathy. Front. Bioeng. Biotechnol. 2014, 2, 34. [Google Scholar] [CrossRef]
- Cornforth, D.; Jelinek, H.F.; Tarvainen, M. A comparison of nonlinear measures for the detection of cardiac autonomic neuropathy from heart rate variability. Entropy 2015, 17, 1425–1440. [Google Scholar] [CrossRef]
- Vanderlei, L.C.M.; Pastre, C.M.; Hoshi, R.A.; Carvalho, T.D.D.; Godoy, M.F.D. Basic notions of heart rate variability and its clinical applicability. Braz. J. Cardiovasc. Surg. 2009, 24, 205–217. [Google Scholar] [CrossRef]
- Porto, D.C.; Sande, L.S.; Perrone, A.C.B.; Campos, L.F.D.S.; Couto, D.L.; da Silva, J.R.; Passos, R.D.S.; Oliveira, A.A.; Pereira, R. The entropy of Rr intervals is associated to gestational age in full-term newborns with adequate weight for gestational age. J. Matern. Fetal Neonatal Med. 2021, 34, 3639–3644. [Google Scholar] [CrossRef]
- Silva, L.E.V.; Lataro, R.M.; Castania, J.A.; da Silva, C.A.A.; Valencia, J.F.; Murta, L.O., Jr.; Salgado, H.C.; Fazan, R., Jr.; Porta, A. Multiscale entropy analysis of heart rate variability in heart failure, hypertensive, and sinoaortic-denervated rats: Classical and refined approaches. Am. J. Physiol.-Regul. Integr. Comp. Physiol. 2016, 311, R150–R156. [Google Scholar] [CrossRef] [PubMed]
- Silva, L.E.V.; Lataro, R.M.; Castania, J.A.; Silva, C.A.A.; Salgado, H.C.; Fazan, R., Jr.; Porta, A. Nonlinearities of heart rate variability in animal models of impaired cardiac control: Contribution of different time scales. J. Appl. Physiol. 2017, 123, 344–351. [Google Scholar] [CrossRef] [PubMed]
- Silva, L.E.V.; Silva, C.A.A.; Salgado, H.C.; Fazan, R., Jr. The role of sympathetic and vagal cardiac control on complexity of heart rate dynamics. Am. J. Physiol. Heart Circ. Physiol. 2017, 312, H469–H477. [Google Scholar] [CrossRef] [PubMed]
- Figueiredo, R.; Pereira, R.; Neto, O.P. Nonlinear analysis is the most suitable method to detect changes in heart autonomic control after exercise of different durations. Comput. Biol. Med. 2018, 97, 83–88. [Google Scholar] [CrossRef]


| Variable | All (n = 46) | HS (n = 21) | HU (n = 25) |
|---|---|---|---|
| Sex (M/F) | 28/18 | 15/6 | 13/12 |
| Age (years old) | 49.0 ± 18.4 | 43.6 ± 19.3 | 53.6 ± 16.8 |
| Dialysis time (months) | 75.2 ± 71.6 | 63.9 ± 63.9 | 84.6 ± 77.4 |
| SBP (mmHg) | 149.0 ± 28.3 | 146.7 ± 23.8 | 151.0 ± 32.0 |
| DBP (mmHg) | 88.6 ± 17.5 | 87.7 ± 16.4 | 89.3 ± 18.7 |
| Uremic state * (mg/dL) | 133.2 ± 33.0 | 33.6 ± 7.3 | 31.9 ± 6.4 |
| URR (%) | 56.9 ± 14.7 | 15.5 ± 3.3 | 14.3 ± 2.9 |
| Kt/V | 2.3 ± 1.4 | 1.5 ± 0.3 | 1.4 ± 0.3 |
| Filtered volume (mL) | 2610.8 ± 955.0 | 1008.6 ± 220.1 | 919.6 ± 187.7 |
| Variables | Groups | Mean Difference between Groups (CI 95%) [HS-HU] | p Value | BF10,U | Probability (%) | |
|---|---|---|---|---|---|---|
| HS (n = 21) | HU (n = 25) | |||||
| LFnu | 72.6 ± 12.3 | 61.0 ± 21.6 | 11.61 (0.90 to 22.33) * | 0.03 | 1.93 | 65.9 |
| HFnu | 27.3 ± 12.3 | 38.8 ± 21.5 | −11.55 (−22.23 to −0.88) * | 0.03 | 1.92 | 65.8 |
| FuzzyEn | 1.09 ± 0.31 | 1.12 ± 0.32 | −0.035 (−0.22 to 0.15) | 0.70 | 0.31 | 23.4 |
| MSE 1 | 1.52 ± 0.21 | 1.46 ± 0.28 | 0.04 (−0.10 to 0.19) | 0.55 | 0.37 | 27.2 |
| MSE 2 | 1.64 ± 0.16 | 1.50 ± 0.26 | 0.13 (0.00 to 0.26) | 0.05 | 1.67 | 62.6 |
| MSE 3 | 1.58 ± 0.15 | 1.42 ± 0.24 | 0.17 (0.05 to 0.29) * | 0.006 | 3.86 | 79.4 |
| MSE 4 | 1.56 ± 0.16 | 1.34 ± 0.27 | 0.23 (0.10 to 0.36) * | 0.001 | 15.8 | 94.0 |
| MSE 5 | 1.55 ± 0.15 | 1.33 ± 0.26 | 0.24 (0.11 to 0.37) * | 0.001 | 25.9 | 96.3 |
| MSE 6 | 1.51 ± 0.17 | 1.30 ± 0.29 | 0.23 (0.09 to 0.37) * | 0.002 | 8.13 | 89.0 |
| MSE 7 | 1.45 ± 0.18 | 1.23 ± 0.30 | 0.25 (0.11 to 0.39) * | 0.001 | 10.1 | 91.0 |
| MSE 8 | 1.39 ± 0.19 | 1.16 ± 0.31 | 0.26 (0.11 to 0.41) * | 0.001 | 9.79 | 90.7 |
| MSE 9 | 1.31 ± 0.19 | 1.08 ± 0.31 | 0.25 (0.10 to 0.41) * | 0.001 | 6.42 | 86.5 |
| MSE 10 | 1.22 ± 0.21 | 1.01 ± 0.30 | 0.25 (0.10 to 0.40) * | 0.002 | 5.39 | 84.4 |
| MSE 11 | 1.16 ± 0.20 | 0.93 ± 0.31 | 0.26 (0.11 to 0.41) * | 0.001 | 7.31 | 88.0 |
| MSE 12 | 1.08 ± 0.20 | 0.87 ± 0.28 | 0.24 (0.10 to 0.38) * | 0.002 | 6.27 | 86.2 |
| MSE 13 | 1.00 ± 0.19 | 0.79 ± 0.25 | 0.23 (0.10 to 0.36) * | 0.001 | 10.00 | 90.9 |
| MSE 14 | 0.92 ± 0.17 | 0.75 ± 0.25 | 0.20 (0.07 to 0.33) * | 0.003 | 4.6 | 82.1 |
| MSE 15 | 0.88 ± 0.17 | 0.71 ± 0.24 | 0.20 (0.08 to 0.32) * | 0.002 | 6.11 | 85.9 |
| MSE 16 | 0.84 ± 0.16 | 0.67 ± 0.24 | 0.19 (0.07 to 0.31) * | 0.002 | 5.2 | 83.9 |
| MSE 17 | 0.80 ± 0.15 | 0.63 ± 0.22 | 0.19 (0.08 to 0.31) * | 0.001 | 7.34 | 88.0 |
| MSE 18 | 0.75 ± 0.14 | 0.59 ± 0.22 | 0.17 (0.06 to 0.28) * | 0.003 | 5.00 | 83.3 |
| MSE 19 | 0.71 ± 0.14 | 0.56 ± 0.22 | 0.17 (0.06 to 0.28) * | 0.003 | 5.65 | 85.0 |
| MSE 20 | 0.67 ± 0.13 | 0.53 ± 0.21 | 0.16 (0.05 to 0.26) * | 0.004 | 3.62 | 78.4 |
| MSE1–20 | 22.43 ± 2.70 | 18.88 ± 4.53 | 4.02 (1.82 to 6.21) * | 0.001 | 12.8 | 92.8 |
| MSE1–5 | 6.30 ± 0.51 | 5.66 ± 0.92 | 0.66 (0.21 to 1.10) * | 0.005 | 6.63 | 86.9 |
| MSE6–20 | 14.60 ± 2.38 | 11.91 ± 3.66 | 3.08 (1.27 to 4.89) * | 0.001 | 7.34 | 88.0 |
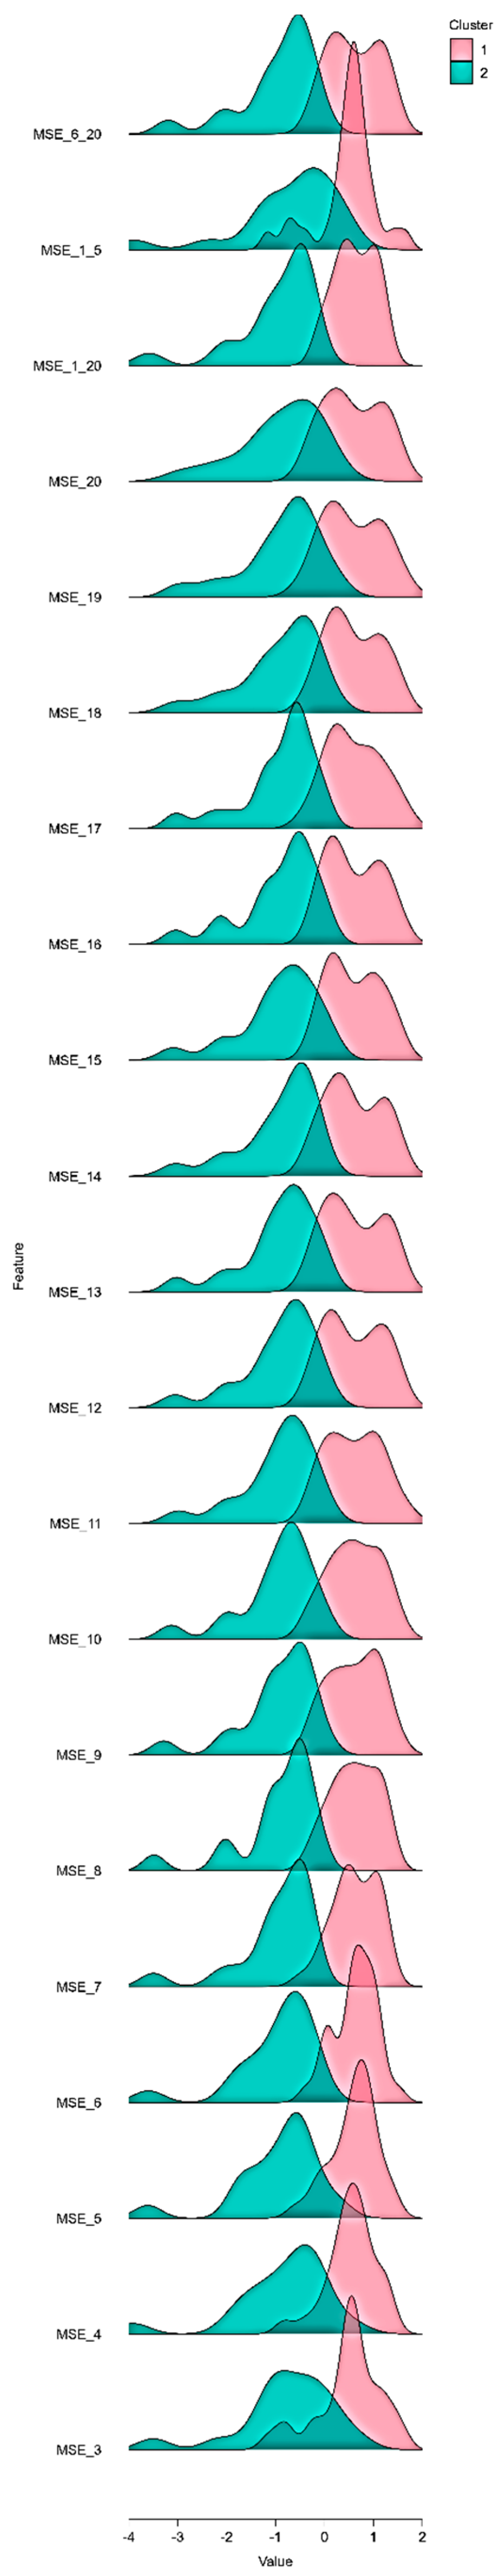
| Variables | Clusters | |
|---|---|---|
| Cluster 1 (n = 28) | Cluster 2 (n = 18) | |
| MSE 3 | 1.60 ± 0.14 | 1.33 ± 0.21 |
| MSE 4 | 1.57 ± 0.12 | 1.23 ± 0.24 |
| MSE 5 | 1.58 ± 0.11 | 1.21 ± 0.21 |
| MSE 6 | 1.56 ± 0.11 | 1.14 ± 0.22 |
| MSE 7 | 1.50 ± 0.12 | 1.06 ± 0.22 |
| MSE 8 | 1.44 ± 0.13 | 0.99 ± 0.24 |
| MSE 9 | 1.36 ± 0.15 | 0.91 ± 0.23 |
| MSE 10 | 1.28 ± 0.15 | 0.84 ± 0.22 |
| MSE 11 | 1.21 ± 0.16 | 0.77 ± 0.22 |
| MSE 12 | 1.12 ± 0.15 | 0.72 ± 0.21 |
| MSE 13 | 1.04 ± 0.14 | 0.66 ± 0.19 |
| MSE 14 | 0.97 ± 0.13 | 0.61 ± 0.19 |
| MSE 15 | 0.92 ± 0.12 | 0.57 ± 0.19 |
| MSE 16 | 0.88 ± 0.12 | 0.54 ± 0.18 |
| MSE 17 | 0.83 ± 0.12 | 0.51 ± 0.17 |
| MSE 18 | 0.78 ± 0.11 | 0.48 ± 0.17 |
| MSE 19 | 0.74 ± 0.12 | 0.45 ± 0.16 |
| MSE 20 | 0.70 ± 0.11 | 0.42 ± 0.16 |
| MSE1–20 | 23.12 ± 1.73 | 16.42 ± 3.51 |
| MSE1–5 | 6.34 ± 0.50 | 5.35 ± 0.87 |
| MSE6–20 | 15.21 ± 1.76 | 9.90 ± 2.70 |
| Groups | |||
|---|---|---|---|
| HS (n = 21) | HU (n = 25) | ||
| Clusters | Cluster 1 (n = 28) | 17 (81.0%) | 11 (44.0%) |
| Cluster 2 (n = 18) | 4 (19.0%) | 14 (56.0%) | |
Disclaimer/Publisher’s Note: The statements, opinions and data contained in all publications are solely those of the individual author(s) and contributor(s) and not of MDPI and/or the editor(s). MDPI and/or the editor(s) disclaim responsibility for any injury to people or property resulting from any ideas, methods, instructions or products referred to in the content. |
© 2023 by the authors. Licensee MDPI, Basel, Switzerland. This article is an open access article distributed under the terms and conditions of the Creative Commons Attribution (CC BY) license (https://creativecommons.org/licenses/by/4.0/).
Share and Cite
Oliveira, N.d.J.; Oliveira, A.A.; Costa, S.M.; Pirôpo, U.S.; Teles, M.F.; Freitas, V.P.d.; Souza, D.A.d.; Pereira, R. Comparison of Heart Autonomic Control between Hemodynamically Stable and Unstable Patients during Hemodialysis Sessions: A Bayesian Approach. Entropy 2023, 25, 883. https://doi.org/10.3390/e25060883
Oliveira NdJ, Oliveira AA, Costa SM, Pirôpo US, Teles MF, Freitas VPd, Souza DAd, Pereira R. Comparison of Heart Autonomic Control between Hemodynamically Stable and Unstable Patients during Hemodialysis Sessions: A Bayesian Approach. Entropy. 2023; 25(6):883. https://doi.org/10.3390/e25060883
Chicago/Turabian StyleOliveira, Natália de Jesus, Alinne Alves Oliveira, Silvania Moraes Costa, Uanderson Silva Pirôpo, Mauro Fernandes Teles, Verônica Porto de Freitas, Dieslley Amorim de Souza, and Rafael Pereira. 2023. "Comparison of Heart Autonomic Control between Hemodynamically Stable and Unstable Patients during Hemodialysis Sessions: A Bayesian Approach" Entropy 25, no. 6: 883. https://doi.org/10.3390/e25060883